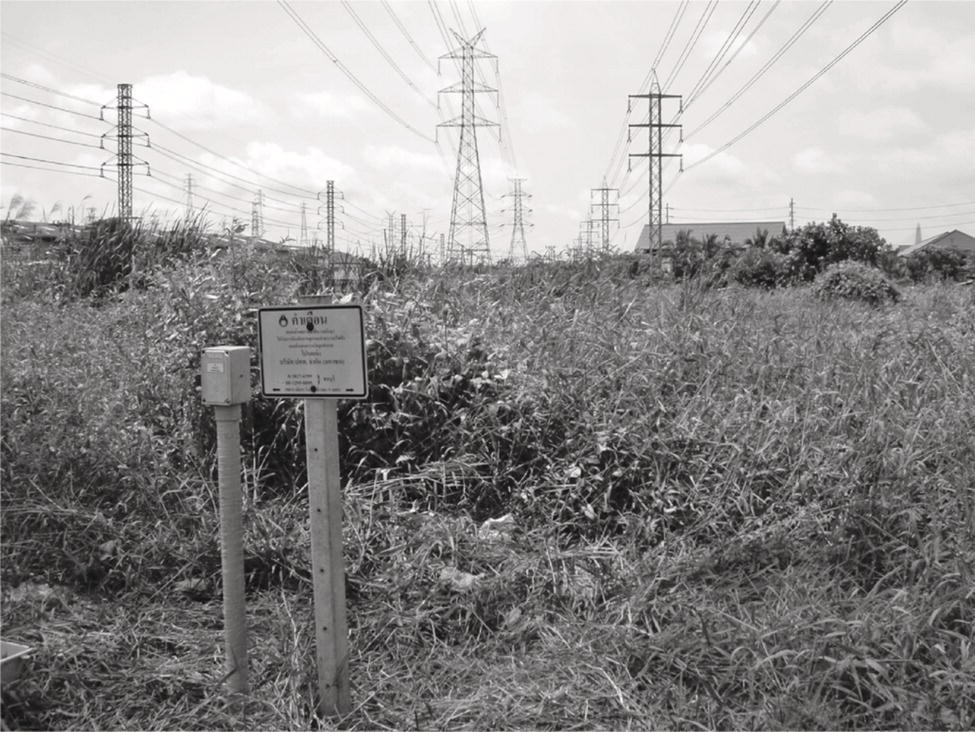
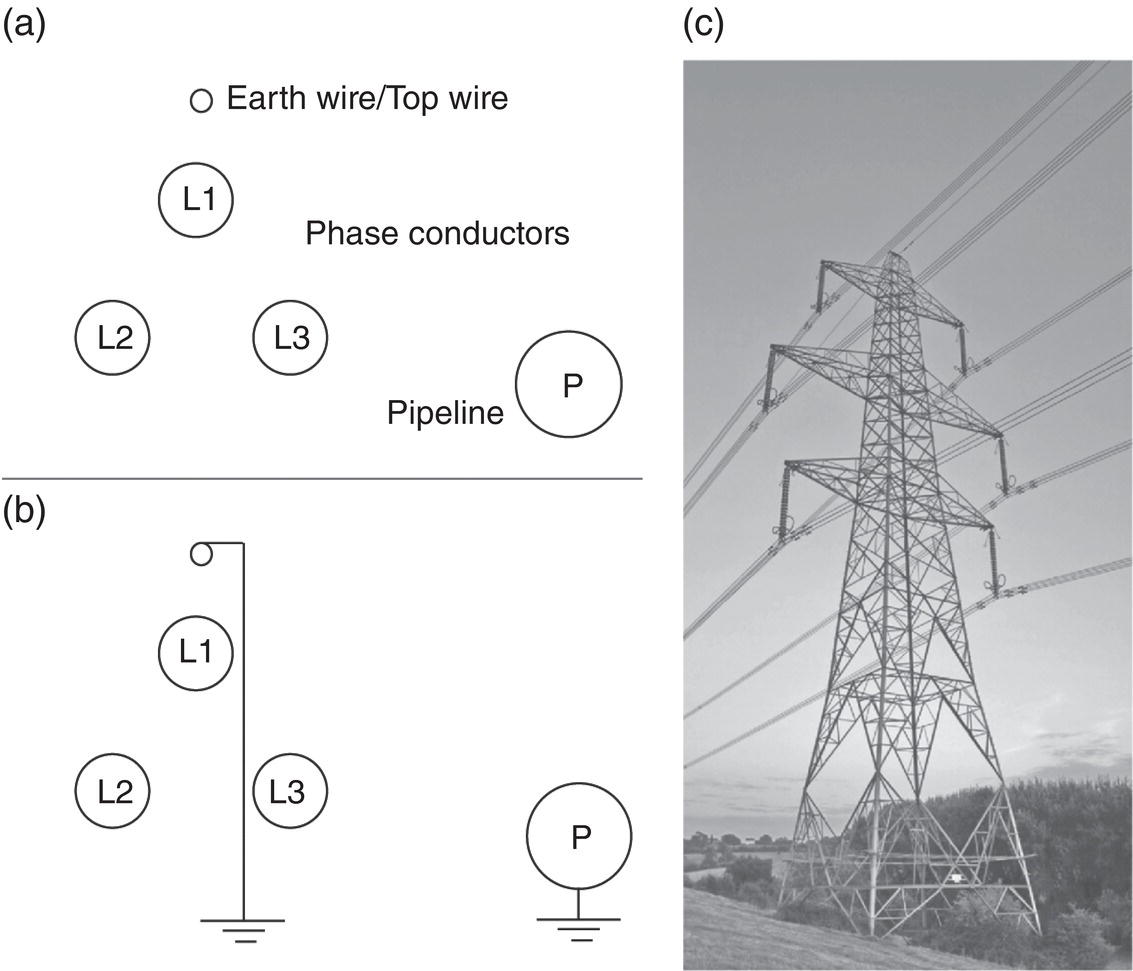
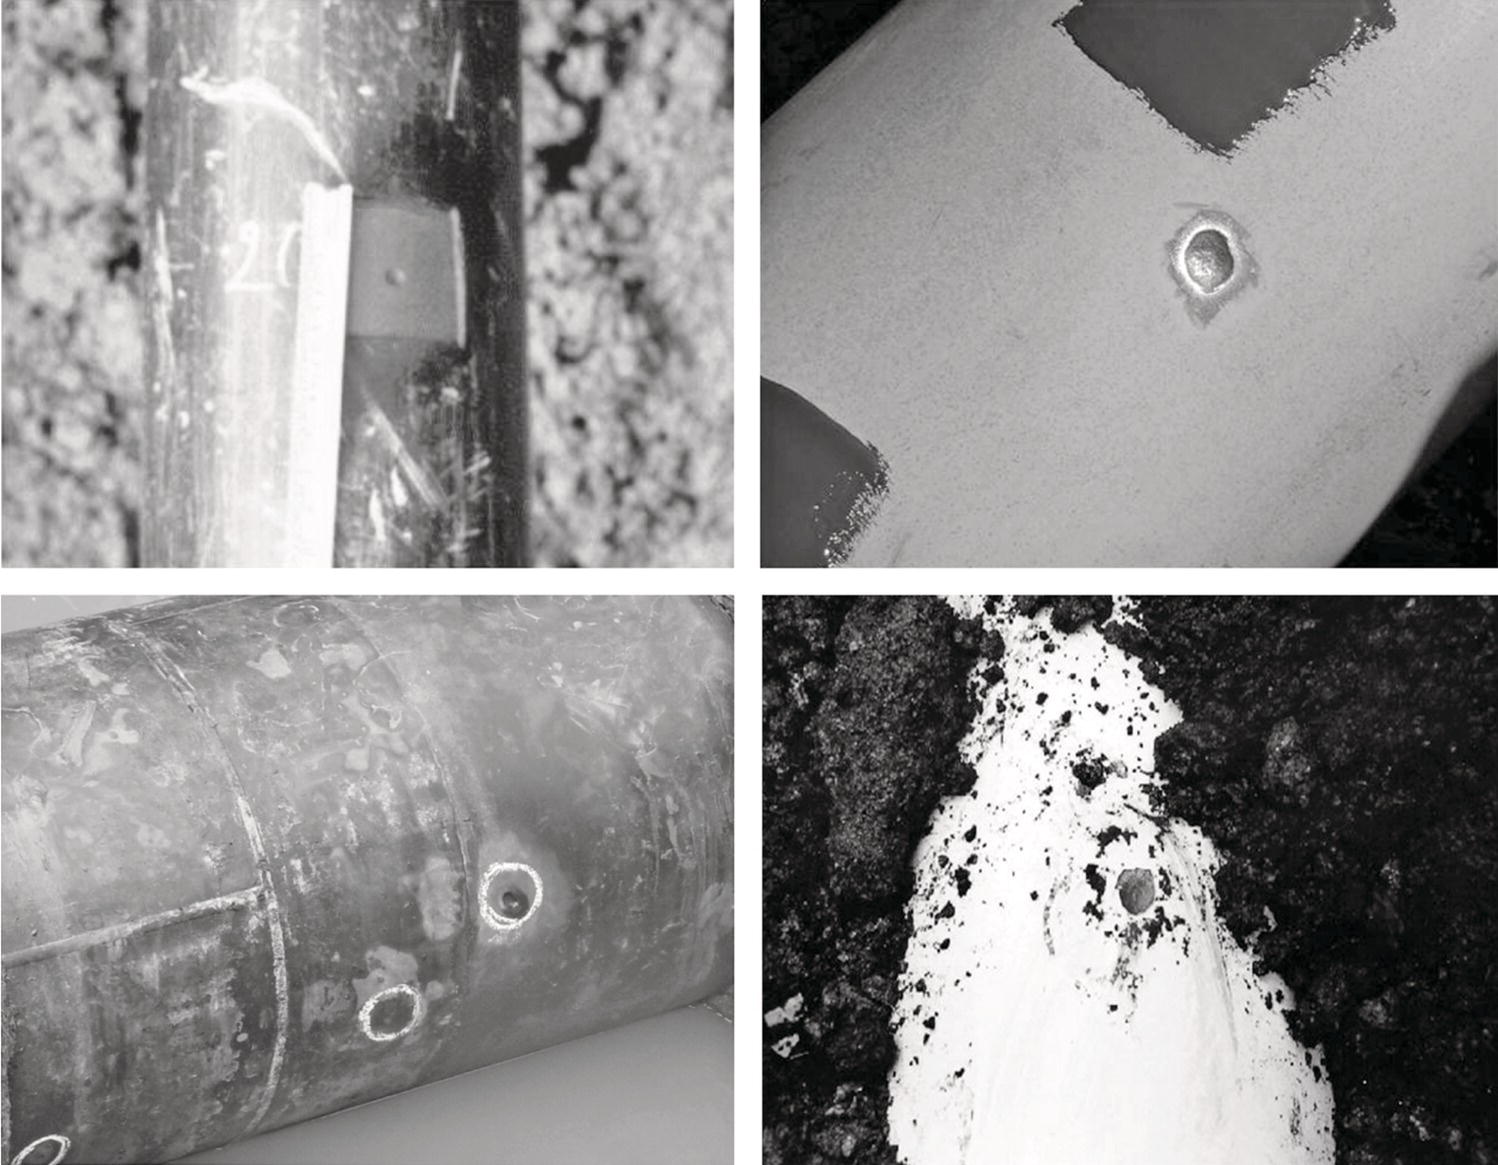
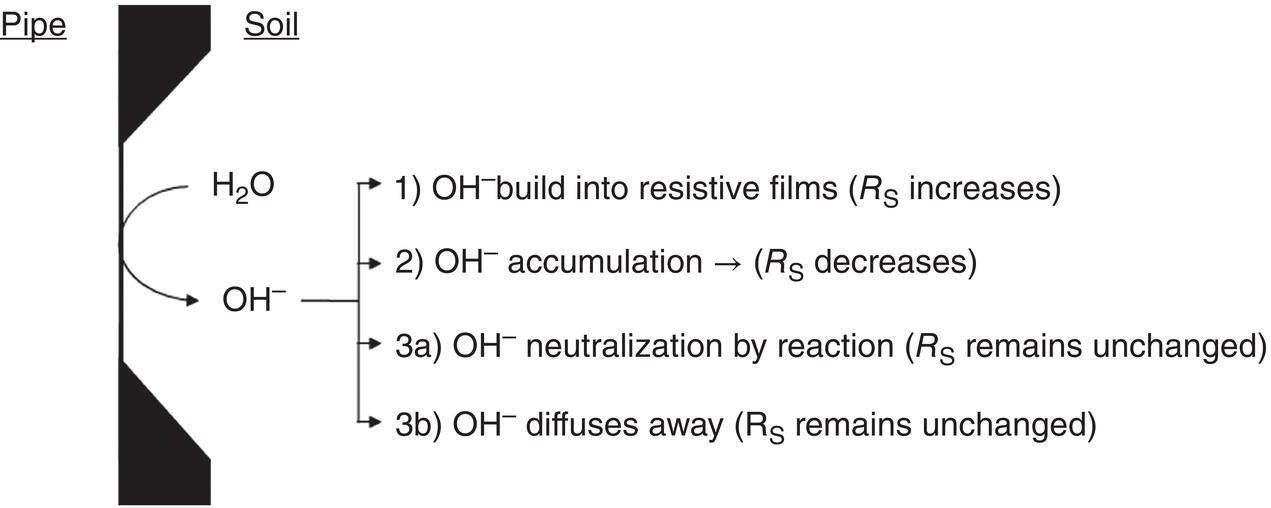
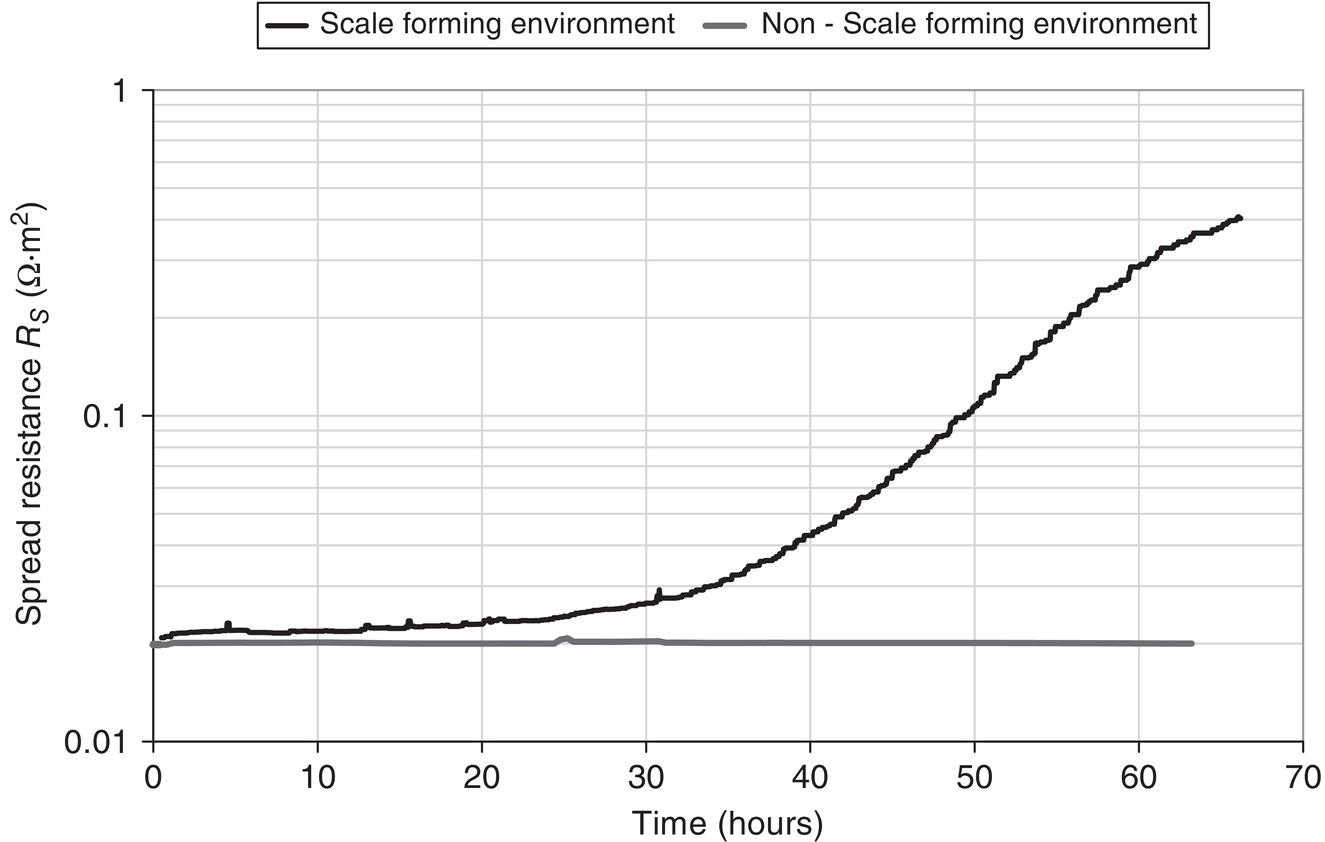
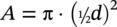
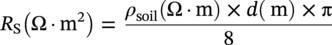
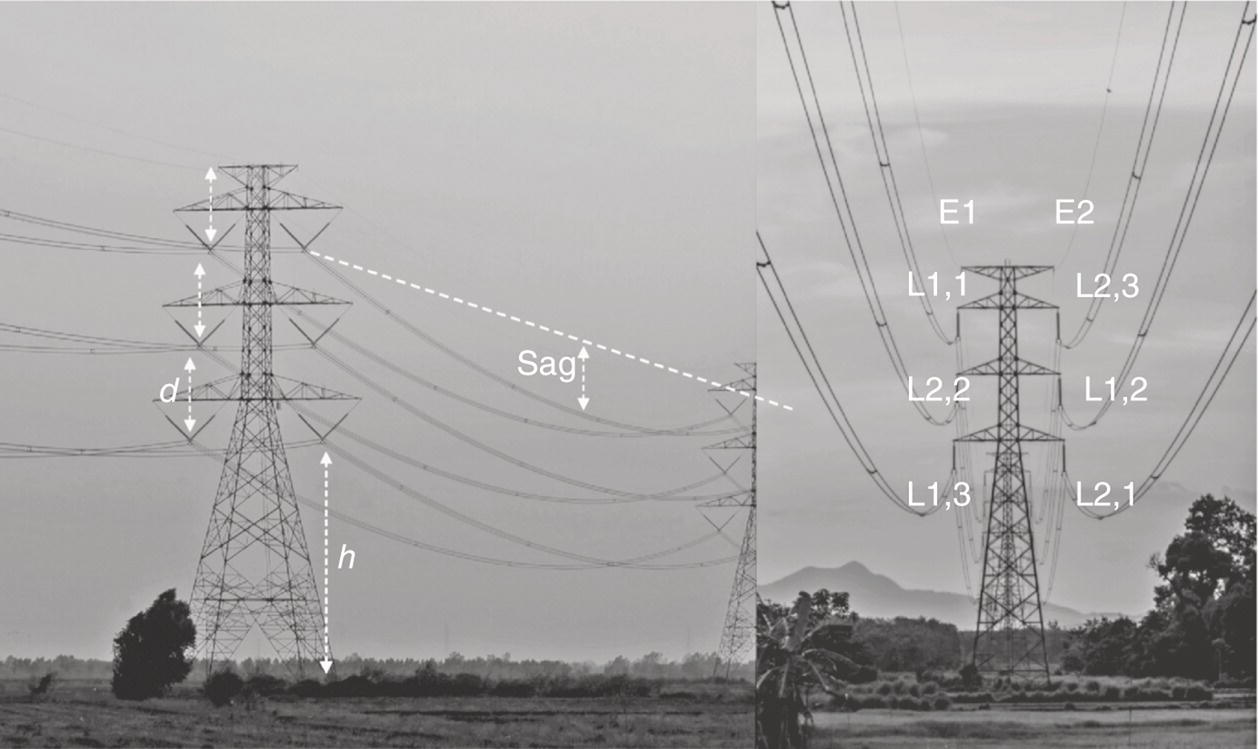
Lars Vendelbo Nielsen MetriCorr ApS, Glostrup, Denmark Alternating current (AC) corrosion can be defined as corrosion caused or influenced by AC. If the AC component is removed or limited below a certain level, the corrosion will be diminished or completely mitigated. Virtually always, the actual AC corrosion case is equally under the influence of direct current (DC). This means that in addition to mitigation by limiting the AC component, AC corrosion can be almost completely controlled by carefully adjusting the DC component—in terms of the cathodic protection (CP) condition. AC corrosion in buried pipelines has increasingly become a concern as shared right-of-ways with high-voltage power lines have become common practice in the so-called energy corridors (Figure 60.1). Proximity with AC-powered traction systems is another source of AC. The AC is induced in the pipeline through an extended length of parallelism between the pipeline and the interfering power source. Figure 60.2 shows the schematic of the arrangement of the conductors (L1, L2, and L3) carrying the current in a high-voltage power line as well as the neutral earth wire (or top wire), which is often also included in the tower arrangement primarily for fault and lightning protection. The AC current in each of the conductors (L1, L2, and L3) creates a magnetic field that induces AC in the pipeline like a secondary coil in a transformer. Since the current in the phase conductors reaches their instantaneous peak values at one-third of a cycle from each other (phase shift 120°), the net resulting magnetic field that influences the pipeline will be significantly reduced compared with the effect of one single conductor. In fact, in principle, if the pipeline was located completely symmetrical relative to the position of the conductors, the net induction would be 0. The neutral earth wire also exhibits the magnetic field; hence, AC will be induced in the earth wire. An alternative path for the AC may be created through the earth points of these wires. If the pipeline is grounded close to the earth points, stray AC current interference may result. The AC corrosion attack usually occurs at small rather than large coating defects and forms a characteristic circular or hemispheric attack as if initiated in a small point and growing laterally in all directions, resulting in a ball-shaped morphology (Figure 60.3) with corrosion rates that can reach several millimeters per year in severe cases. This chapter has been divided into two parts. The first part provides an overview of the current understanding of AC corrosion and the parameters behind it. The second part provides engineering practices for the mitigation and monitoring of AC corrosion. AC corrosion is influenced by both AC and DC parameters, which are correlated through spread resistance. A short presentation of the parameters needed to understand AC corrosion is given as follows: Figure 60.1 Shared corridor—high-voltage power lines and underground pipelines indicated by the test station. Spread resistance is a key parameter in the AC corrosion process, as further demonstrated in Section 60.2.1. Figure 60.2 Illustration of conductors in a high-voltage power line relative to a pipeline. (a) Conductors L1, L2, and L3 and an earth wire on top, (b) earth wire grounded next to pipeline grounding, (c) pylon carrying earth wires and two L1, L2, and L3 systems. Figure 60.3 Examples of AC corrosion developed from small coating defects in the pipeline. (Upper left: Courtesy of CeoCor (Comité d’étude de la Corrosion et de la Protection des Canalisation), A.C. Corrosion on Cathodically Protected Pipelines—Guidelines for risk assessment and mitigation measures—2001 [1]. (Courtesy of Roger Ellis, Pipeline Manager, Shell UK Ltd.) The spread resistance plays a key role in the AC corrosion process since in many ways, it ties together the DC and AC parameters. In the following, some observations and features of the spread resistance are given. Typically, the AC voltage and AC current density exchanged between the pipe and the soil through a circular coating defect with area (A) and diameter (d) are described as proportional through the relation: In this relation, ρsoil is the soil resistivity. The spread resistance is the proportionality factor between the AC voltage and AC current density and may be described as Hence, according to this equation, the spread resistance depends both on the magnitude (size) of the coating defect and on the soil resistivity. This is true only with some modifications as follows. The CP of the bare steel at a coating defect will affect the soil chemistry at the close proximity of the steel surface—particularly through the production of hydroxyl ions from water by the CP current—see Figure 60.4. The electrochemical processes resulting from CP may influence the resistivity of the soil close to the coating defect in three different ways: Case 1 (increase of the spread resistance). Due to the CP processes, alkalinity (OH−) is produced at the bare steel surface at the coating defect. If the soil contains earth alkaline cations such as Ca2+ and Mg2+, the alkalinity produced will lead to precipitation of calcium and/or magnesium hydroxides. This scale-forming process will form resistive layers on the steel surface, and the spread resistance will increase regardless of a constant soil resistivity in the bulk. The process may increase the spread resistance by 2 orders of magnitude. Figure 60.4 Schematic illustration of the modification of the spread resistance due to the production of hydroxyl ions through the electrochemical cathodic protection processes. Figure 60.5 Development of the spread resistance in a scale-forming environment versus a nonscale-forming environment under mild cathodic protection (−850 mV CSE). An example is shown in Figure 60.5 [2]. The development of the spread resistance is shown throughout approximately 70 h in an environment with a mixture of scale-forming earth alkaline cations (Ca2+ and Mg2+) This development is compared with the development in a similar but non-scale-forming environment where earth alkaline cations (Ca2+ and Mg2+) were replaced with Na+ equivalents. In both cases, the DC ON potential was −850 mV CSE (copper–copper sulfate electrode), whereas the AC voltage was 20 V. In the scale-forming environment, the spread resistance increases by a factor of 20 (and continues its increase), whereas the spread resistance in the non-scale-forming environment is constant over the period. Case 2 (decrease of the spread resistance). This relates to the accumulation of the hydroxyl ions (OH−) produced by the CP processes. If produced in sufficiently large amounts—with a certain reaction rate—hydroxyl ions will concentrate at the surface and contribute to the conductivity of the soil close to the steel surface. Besides an increase in pH, the accumulation will lower the spread resistance and cause an increase in the AC current density at constant level of AC voltage according to Equations (60.1) and (60.2). Figure 60.6a illustrates an example established in a soil box with a chemical composition having a non-scale forming capability. A coupon having an area of 1 cm2 was increasingly polarized in the environment, and the spread resistance was measured simultaneously. The decrease in spread resistance is observed to occur when the cathodic DC current density exceeds a threshold of 0.15 A/m2 in this environment. In a similar manner, the spread resistance in soil boxes with various soil resistivities (various concentrations of nonscaling solutions based on the same chemical substances) was recorded as a function of the applied CP current density. The threshold CP current density is defined as the value of JDC above which the spread resistance decreases. This threshold level versus the soil resistivity is shown in Figure 60.6b [3]. As can be observed, such simple experiments illustrate how the CP current density can take control of the environment close by the coating defect and in particular, above a certain threshold current density, gradually decrease the spread resistance. This threshold depends on the actual soil resistivity. The higher the resistivity, the lower the level of CP needs to be before the resistivity close to the coating defect is affected. In conclusion, Equation (60.1) must be used with care and never substitute real measurements. Figure 60.6 (a) Effect of the cathodic protection DC current density on the spread resistance—illustrating a threshold DC current density above which the spread resistance decreases. (b) Threshold cathodic DC current density above which the spread resistance decreases—as a function of the soil resistivity. Case 3 (spread resistance remains unchanged). This relates to the situation where the hydroxyl ions (OH−) are not produced sufficiently fast by the CP processes to accumulate at the surface at the coating defect (below the threshold CP current density). As already indicated through Equations (60.1) and (60.2), the spread resistance value depends on the diameter of the coating fault. Substituting As observed from this, the spread resistance (in Ω ⋅ m2) increases with increasing area of the coating defect. Consequently, small coating defects are more susceptible to AC corrosion because the spread resistance is lower compared with larger defects, and the AC current density produced at small defects will be higher than the AC current density produced at larger defects—given the same level of AC voltage. This above is a simplification and relates to a circular defect. Figure 60.7 illustrates further the geometry around a circular coating defect. Besides the diameter (d) describing the size of the defect, one must consider the effects on the spread resistance of the thickness (t) of the coating, and one must also consider the angle between the exposed metal surface and the coating. Further, it should be considered how a scratch behaves in comparison with a circular coating defect. These questions have been studied by mathematical numerical simulations, which afterward have been partly checked in controlled practical experiments [4]. Some essential results are shown in Figure 60.8. Generally, the spread resistance is illustrated for a constant soil resistivity. Upper figures relate to conditions where the coating is very thin (0.001 mm) and with no practical influence of the spread resistance. Lower figures relate to conditions where the coating is significant (3 mm thick). Left figures describe calculated actual values, whereas right figures describe indexed values, where index 100 is the case of a circular defect. Apart from the circular defect, calculations were made on rectangular defects with increasing length (L)-to-width (w) ratios (1:1, 10:1, 100:1, and 1000:1) virtually describing the transition from a circular defect to a scratch. The calculations have been made with the area of the coating defect as the primary parameter. Figure 60.7 Illustrations of the geometrical parameters related to a circular coating defect. Besides diameter (d) and area (A) of the coating defect, the coating thickness (t) and coating contact angle (α) with the metal surface are also considered. (Adapted from [3]). The upper figures show that as long as the coating is thin, and therefore have no effect on the spread resistance, the circular defect will have the highest spread resistance (practically identical to the square (1:1)), whereas increasing length-to-width ratio provides lower and lower spread resistances. The spread resistance relating to the scratch-like defects—length-to-width ratio 1000:1—will be approximate, with only 20% of the spread resistance relating to the circular defect. Hence, the scratch-like defect will produce 5 times higher AC current density than the circular one. The lower figures take into account the geometrical limitations provided by a coating with a defined thickness (3 mm). It is understandable that the spread resistance of a pin hole defect in a 3-mm coating will be conducted primarily by the narrow gap in the coating rather than the actual area of the bare steel surface. The figures show how the coating becomes predominant at small defects and that the spread resistance for all geometries practically converts toward the same value when the coating defect is small (0.01 mm). In conclusion to this, it is clear that the geometry of the coating defect controls the susceptibility to AC corrosion; small defects are more likely to suffer from AC corrosion than larger defects, and scratch-like defects are more susceptible than circular or square defects. The combined effect of coating fault geometry and influences of DC current on the chemistry at the coating defect remains to be an area with lack of research. Another phenomenon being important in the understanding of AC corrosion is the effect of AC on DC polarization behavior. Most often, the AC will depolarize the electrode kinetics, which implies in practice that the DC current demand for maintaining a certain CP potential will be increased with increasing AC. This tendency can be readily observed in practice by controlling the pipeline ON potential and registering the current demand alongside the pipe-to-soil AC voltage. In the laboratory, the effect can be demonstrated for example in a soil box experiment where a working electrode is kept at a certain ON potential with superimposed AC at different levels. Figure 60.9 gives an example of this—clearly illustrating that AC causes depolarization of both the anodic and cathodic electrode kinetics. The effect of AC on the IR-free DC potential measurement is a further challenge, as illustrated in Figure 60.10. The figure shows three cathodic polarization curves—in all three cases represented by the ON potential versus CP current density and the IR-free potential versus CP current density. The difference between the figures is the superimposed AC—0.5, 4, and 10 V. Besides showing the aforementioned effect that AC causes a depolarization of the DC kinetics, it can also be observed that as the AC increases, the IR-free polarization curve starts acting in an odd manner, in the sense that increased CP current actually leads to more anodic IR-free DC potentials. The reason for this behavior remains so far unsolved, but the phenomenon is readily reproduced and has been reported independently from different sources (e.g., Büchler [5]). Figure 60.11 quantifies the effect, which in this book is referred to as the Faradaic rectification. Figure 60.8 Effects of the coating defect size and geometry on the coating defect spread resistance. Data are mainly calculated with random experimental checks. ([3]/CeoCor). A proposed mechanism of AC corrosion has been based on reactions and stability domains illustrated in the Pourbaix diagram—Figure 60.12. During the anodic (positive) half-wave of an AC cycle, the bare metal is oxidized and forms an oxide film—such as Fe3O4. During the cathodic (negative) half-wave of the AC cycle, this oxide film is reduced and converted into a nonprotective rust layer—such as Fe(OH)2. In the next anodic cycle, a new oxide film grows that is converted into a larger amount of rust and so on; see Figure 60.13 [5–7]. This may be a true mechanism as long as the following prerequisites—found in any laboratory experiment and in any field detection of AC corrosion—are observed (Figure 60.14) with reference to the previous illustrations: The induced AC is the driving force for the process, whereas the smaller coating defects as well as excessive CP facilitate a low spread resistance. The lower the spread resistance, the higher the AC current density at a certain level of AC voltage since AC voltage, spread resistance, and AC current density are correlated simply through Ohm’s law. Figure 60.9 Effects of AC current densities on DC polarization curves. Figure 60.10 Effects of AC voltage on DC polarized potentials. Figure 60.11 Effects of AC voltage on DC polarized potentials [5]. ΔEF is explained as the Faradaic rectification caused by the AC. (Courtesy of Dr. Markus. Büchler, GSK Switzerland.) Figure 60.12 Pourbaix diagram (pH–potential diagram). Figure 60.13 Schematic description of an AC corrosion process. (Courtesy of Dr. Markus. Büchler, GSK Switzerland.) Figure 60.14 The vicious circle of AC corrosion. If the AC current density is high enough, the DC current density (for the CP process) will increase due to depolarization effects of the AC. The net result is that the cathodic DC current increases—i.e., the CP current at the coating defect becomes even more excessive. Such excessive CP current produces alkalinity/hydroxyl ions (OH−) nearby the coating defect by either of these reactions: Regardless of which of these reactions is taking place, the net production of hydroxyl ions is achieved nearby the coating defect, and this can result in alkalization (pH rise) and a significant lowering of the spread resistance. In turn, the lowering of the spread resistance results in ever higher levels of AC current density, which again depolarizes the CP kinetics, produces more alkalinity, increases pH further, lowers spread resistance further, increases AC current density further, and so on. A vicious circle has been produced (Figure 60.14). Eventually, the pH at the coating defect may reach such high values that the high-pH free corrosion area ( Figure 60.15 illustrates some interesting observations that follow from the “vicious circle” scenario. The results have been produced in a laboratory soil box environment with a nonscaling electrolyte embedded in purified quartz sand. At a constant 15 V AC, six different levels of CP (ON potentials) were maintained for some weeks to study the development of the corrosion rate as measured by electrical resistance (ER) probes and the various electrical parameters associated. Figure 60.15a shows the corrosion rate displayed as a function of the AC voltage—which was held constant in all experiments. As observed, corrosion can be created or kept at 0 depending on the CP level. The AC voltage itself therefore is not a valid indicator of corrosion risk. Figure 60.15b shows the corrosion rate displayed as a function of the AC current density. What can be deduced from this is that despite a constant AC voltage, the AC current density changes from approximately 100 A/m2—at low CP level—up to 500 A/m2 at higher CP levels. The corrosion rate may be associated to the AC current density. Figure 60.15c shows the corrosion rate displayed as a function of the DC ON potential. Clearly, the corrosion rate increases with more CP being applied. Figure 60.15d shows the corrosion rate displayed as a function of the IR compensated DC potential. This graphic illustrates above all the Faradaic rectification effect discussed in Figures 60.10 and 60.11. Increasing the CP level (more negative ON potential) below –1200 mV (ON) results in less negative IR-free potentials. Figure 60.15e shows the corrosion rate displayed as a function of the CP DC current density (note that the negative sign indicates cathodic current). Clearly, the corrosion rate increases when CP current density increases. Figure 60.15f shows the spread resistance as a function of the DC current density. This again illustrates the spread resistance as being a very central parameter in AC corrosion. The graph shows that the CP DC current density is able to lower the spread resistance by a factor of 5–6 in this case. In turn, the AC current density is increased by the same factor of 5–6 (Figure 60.15b). Getting out of the vicious circle can be managed, as will be discussed hereafter. Figure 60.15 Example of the corrosion rate versus various electrical parameters. (a) AC voltage. (b) AC current density. (c) DC ON potential. (d) IR compensated DC potential. (e) CP DC current density. (f) spread resistance versus DC current density. Standards and guidelines on how to assess the risk of AC corrosion are currently being developed, under the auspices of NACE,1 ISO, and CEN. The latter—EN 15280:2013—Evaluation of AC corrosion likelihood of buried pipelines applicable to cathodically protected pipelines—published in September 2013 [8]—takes into account the up-to-date understanding of AC corrosion, as presented in Section 60.2, and therefore, will be the backbone of this section on risk assessment and management. The development of this particular standard has to a large degree been based on established monitoring in selected test stations in which corrosion rates on ER corrosion probes have been compared with the electrical quantities (UAC, JAC, EON, EOFF, AND JDC) as previously defined [5, 6, 9]. EN 15280 operates with a set of normative criteria based on AC/DC current densities or direct measurements of corrosion rates on coupons or probes and a set of informative criteria based on AC voltage and DC ON potentials (ON potential approach). Since the conditions vary from case to case, it is acknowledged that a single threshold value cannot be applied. Previously, a 30 A/m2 AC current limit measured on coupons has been applied as a rule of thumb, but recent observations regarding both thresholds and qualitative understanding like the vicious circuit of AC corrosion have demonstrated that such a simple criterion is not applicable. Figure 60.16 AC corrosion criteria based on AC and DC current densities measured on installed coupons. Criteria are taken from EN 15280:2013. (Adapted from [8]). The following is based closely on Section 7 in EN 15280:2013 [8]. The design, installation, and maintenance of the CP system shall ensure that the levels of AC voltage do not cause AC corrosion. This is achieved by reducing the AC voltage on the pipeline and the current densities (in coupons) as follows: These current density criteria have been illustrated in Figure 60.16. As a normative alternative to the previously mentioned list of criteria, it is also allowed to demonstrate effective AC corrosion mitigation by corrosion rate measurements (ER probes and weight loss coupons). As an informative alternative, the annex E of EN 15280:2013 suggests an ON-potential approach having criteria as follows: The CP criteria in EN 12954 Table 1 [10] (same footnote as mentioned earlier) should be followed. Note that in this case, it is important to ensure that there is no corrosion risk due to cathodic disbondment and no adverse effect caused by hydrogen evolution, or AC voltage and DC potential should be measured using the same reference electrode placed in remote earth. Figure 60.17 illustrates these guidelines for AC corrosion risk assessment. Methods for the mitigation of AC corrosion address both the AC component and the adjustment and control of the CP level. The mitigation should be incorporated both in the design and construction phase of a pipeline, as well as in the operational stage. For the assessment of the level of induced voltage, modern computer software programs are available that are capable of performing detailed calculations and modeling [11, 12]. For preparation of AC calculations and recommendations for optimized earth electrode positions, some basic information is required regarding the pipeline and the high-voltage power line(s) paralleled with the pipeline as follows: Pipeline input data High-voltage power line system input data—for each interfering line Figure 60.17 AC corrosion criteria based on AC voltage and DC ON potentials. Criteria are taken from EN 15280:2013—informative annex E. (Adapted from [8]). Figure 60.18 Illustration of information from pylons required for AC voltage modeling. (Thaiview/Shutterstock). Output data For the pipeline, the calculations and iterative modeling should as a minimum lead to (fault conditions excluded) the following: In the design stage, the installation of isolating joints should be considered. Since the length of parallelism between an electrically continuous pipeline and a high-voltage power line is a determining factor for the overall induced voltage, the shortening of the electrically continuous sections of the pipe by inserting isolating joints will decrease the level of induced AC. Of course, the installation of isolating joints also creates discontinuity in terms of DC and, therefore, must be considered in view of the CP design and position of CP sources (rectifiers and galvanic anodes). The level of induction on a pipeline located in urban areas as opposed to rural areas may be moderated through the existence of other metallic constructions such as other pipe works and so on. Such presence of other metallic subjects will reduce the induction in the pipeline caused by the so-called civilization factor. A systematic way of introducing a civilization factor is by installing mitigation wires along the pipeline. These are wires installed in close proximity to the pipeline. The drawback of these wires is their adverse effect on coating defect surveys. Since the AC interference mainly depends on the proximity and parallel routing of the pipeline and high-voltage power lines, it is evident that mitigation of AC induction can also be achieved by increasing the distance between the pipeline and the high-voltage power lines. Typically, this is not practical because of the desire to keep these constructions within narrow energy corridors. Another factor that can be introduced in the construction stage is arrangement of the phase conductors on the pylons (Figure 60.18) in order to minimize AC induction, or ultimately arrangement of high-voltage power transportation in cables where the distance between the power conductors is very small compared with the distance between the individual conductors and the pipeline. Mitigation measures most typically imply the establishment of earth electrodes, which drain AC from the pipeline to the adjacent soil and into “far earth.” The earth electrodes are typically copper rods, zinc ribbons, and so on. It is essential that the resistance to earth is as low as possible to facilitate AC drainage. The earth electrodes can be directly connected to the pipeline, or they can be connected through AC discharge devices (DC decoupling devices, polarization cells, polarization cell replacements, etc.); see Figure 60.19. These devices essentially block the DC while creating a low-resistance AC path. The advantage of inserting these devices is that a direct connection implies a possible increased demand of CP, or that the earth electrodes are consumed if they act as sacrificial anodes and thereby over time will increase the resistance to earth and become less effective. Requirements for the AC discharge devices are that they need to be completely neutral and should not interfere with the applied CP system. A common AC discharge component is an electrolytic capacitor, which can be installed along with other electronic components (spark gaps, thyristors, and diodes) to protect from transients and so on; see Figure 60.19. Figure 60.19 (a) Electrical component circuitry typical of some AC discharge devices. (Courtesy of MetriCorr.) (b) Polarization Cell Replacement (PCR) installed at an AC interfered location. (Courtesy of Dairyland Electrical Industries.) Figure 60.20 shows an example of simple AC induction modeling for a short pipeline (approximately 20 km) that is paralleled with a high-voltage power line. Quite typically, the induced voltage has maximum values in the end-points and minimum value close to the midpoint of the pipeline. The upper figures illustrate the significant effect of the coating resistance on the induced AC. The higher the coating resistance, the higher the AC voltage induced. In other words, modern efficient coatings introduce higher induced AC and, therefore, constitute an increased risk of AC corrosion in tiny coating defects. This must be encountered when repair of coating defects is considered a means for minimizing AC corrosion risk in areas deemed to be high-risk areas. The lower illustrations in Figure 60.20 illustrate the effect of the resistance to earth of two earth electrodes installed in the end points of the pipeline. As observed, the resistance from the pipe to earth through the earth electrode is a crucial factor for the effectiveness of the AC drainage. Sometimes, low resistances are costly in high-resistance areas—ultimately such as rocky terrains. As discussed previously, the mitigation of AC is one way—and a first step—of the AC corrosion mitigation procedure and the first step to get out of the vicious circle of AC corrosion. The second step, which is sometimes (often) the easiest and most cost effective, is to control the level of CP applied to the pipeline. It must apply to usual criteria but not too much more. Therefore, in theory and in the simple case, AC corrosion may be controlled by simply adjusting the CP level. CP conditions may, however, vary quite a lot from one pipeline to another. The current requirement may be in the order of amperes per kilometer for pipelines with a very poor coating quality, ranging all the way down to microamperes per kilometer for pipelines with a very good coating quality (a very high coating resistance). When the coating quality is very good, and the CP current consumption therefore very low, the pipeline current is low as well, and therefore, only very small IR drops in the pipe occur. Under these circumstances, it is quite easy to maintain a homogeneous CP potential throughout the length of the pipeline. If there is no complicating circumstance like DC interference, it is therefore easily obtainable to control the DC potential in a narrow range—on one hand complying with the usual CP potential criterion—and on the other hand making sure that no excessive CP is present that could initiate AC corrosion. On the other hand, if the coating quality is very poor and the CP current requirement is very high, the pipeline current is likely to be very high, and large IR drops in the pipeline may occur. Under these circumstances, both conditions of excessive CP near CP sources and low, and perhaps inadequate, CP in mid-positions between CP sources can be present on the same pipeline. Further complications with DC interference can be present. Even though these kinds of pipelines are normally well-grounded due to the low average coating resistance, and therefore, AC induction level can be moderate, it can be difficult to maintain conditions for safe operation in terms of AC corrosion. Figure 60.20 Examples of modeled AC voltage data and effects of coating resistance and resistance from the earth electrode to earth. To document the safe operation of pipelines with regard to AC corrosion (as well as other types of corrosion), it should be considered to establish monitoring in selected test stations along the pipeline. For the evaluation of AC corrosion, the installation of coupons or probes is a necessary requisite. The coupons or probes should be installed anywhere the criteria for AC corrosion likelihood need to be evaluated. The coupon or probe should include a small coating defect—for instance, 1 cm2. AC modeling procedures may be applied in connection with the selection of sites, which may include the following: Other points may also be considered. Some operators prefer to perform statistical testing before selecting a higher number of test stations for systematic monitoring. During installation of the coupons or probes, special care has to be taken to make sure that the coupon is embedded in the very same soil as the pipeline. The selection of parameters to be monitored must reflect the analysis that must be performed to ensure safe operation—according to Section 60.3.1. Figure 60.21 shows an example where all optional parameters are measured simultaneously, that is, both corrosion rate measured on ER probes, AC and DC current densities, and DC potentials (ON potential and IR compensated potential) as well as spread resistance. Such a concept allows for analyzing electrical conditions under which corrosion takes place and subsequently adjusting these conditions and making sure the corrected conditions are maintaining safe operation. Figure 60.22 shows comparable data from different pipeline locations at which all relevant parameters have been measured simultaneously. Figure 60.21 Simultaneously measured corrosion rates (ER probes) and the electrical data involved in AC corrosion risk assessment. Figures 60.23 and 60.24 show corrosion rate data obtained on 31 pipelines compared with the criteria given in Section 60.3.1. Figure 60.23 shows data based on AC and DC current densities, while Figure 60.24 is based on AC voltage and DC ON potential. As observed from these figures and especially Figure 60.24, the threshold parameters are not always very well in correlation with corrosion rates, and corrosion rate measurements could be considered. As an allowed option, it is therefore suggested to simplify AC corrosion risk assessment by using the corrosion rate approach and to optimize the electrical parameters only if corrosion is unacceptably high. A simple scheme for AC corrosion evaluation has been suggested in Figure 60.25. Risk assessment may be necessary for Figure 60.22 Example of the corrosion rate and various electrical parameters measured along a pipeline. Figure 60.23 AC corrosion criteria based on AC and DC current densities measured on installed coupons—with illustration of corrosion rates measured simultaneously [9]. Figure 60.24 AC corrosion criteria based on AC voltage and DC ON potentials with corrosion rates measured simultaneously [9]. For new constructions of either pipelines or interfering sources, the analysis should include calculations using the computerized tools for predicting the interference levels. The same tools should be used for designing the mitigation. For old pipelines, it could be a pragmatic solution to allow a judgment based on the track record of corrosion incidents. The mitigation strategy could be “no action” if the pipeline has been present for a long time and no corrosion incident has ever occurred. The monitoring strategy could be based on the electrical fingerprints as allowed in the EN 15280 standard, or it could be based on the corrosion rate measurements strategy, as illustrated previously. If, for instance, the monitoring strategy involves measuring the AC/DC current on coupons and it shows that it is impossible to mitigate AC to below acceptable limits (unsafe condition), then the monitoring strategy could be changed to the corrosion rate strategy for the demonstration of a safe condition. Figure 60.25 A suggested scheme for AC corrosion assessment. A direct way to the demonstration of a safe operation would imply application of the corrosion rate strategy—which is operational and fully allowed according to the new standard. Standards and Recommended Practices Books and Reports Papers/Conference Proceedings
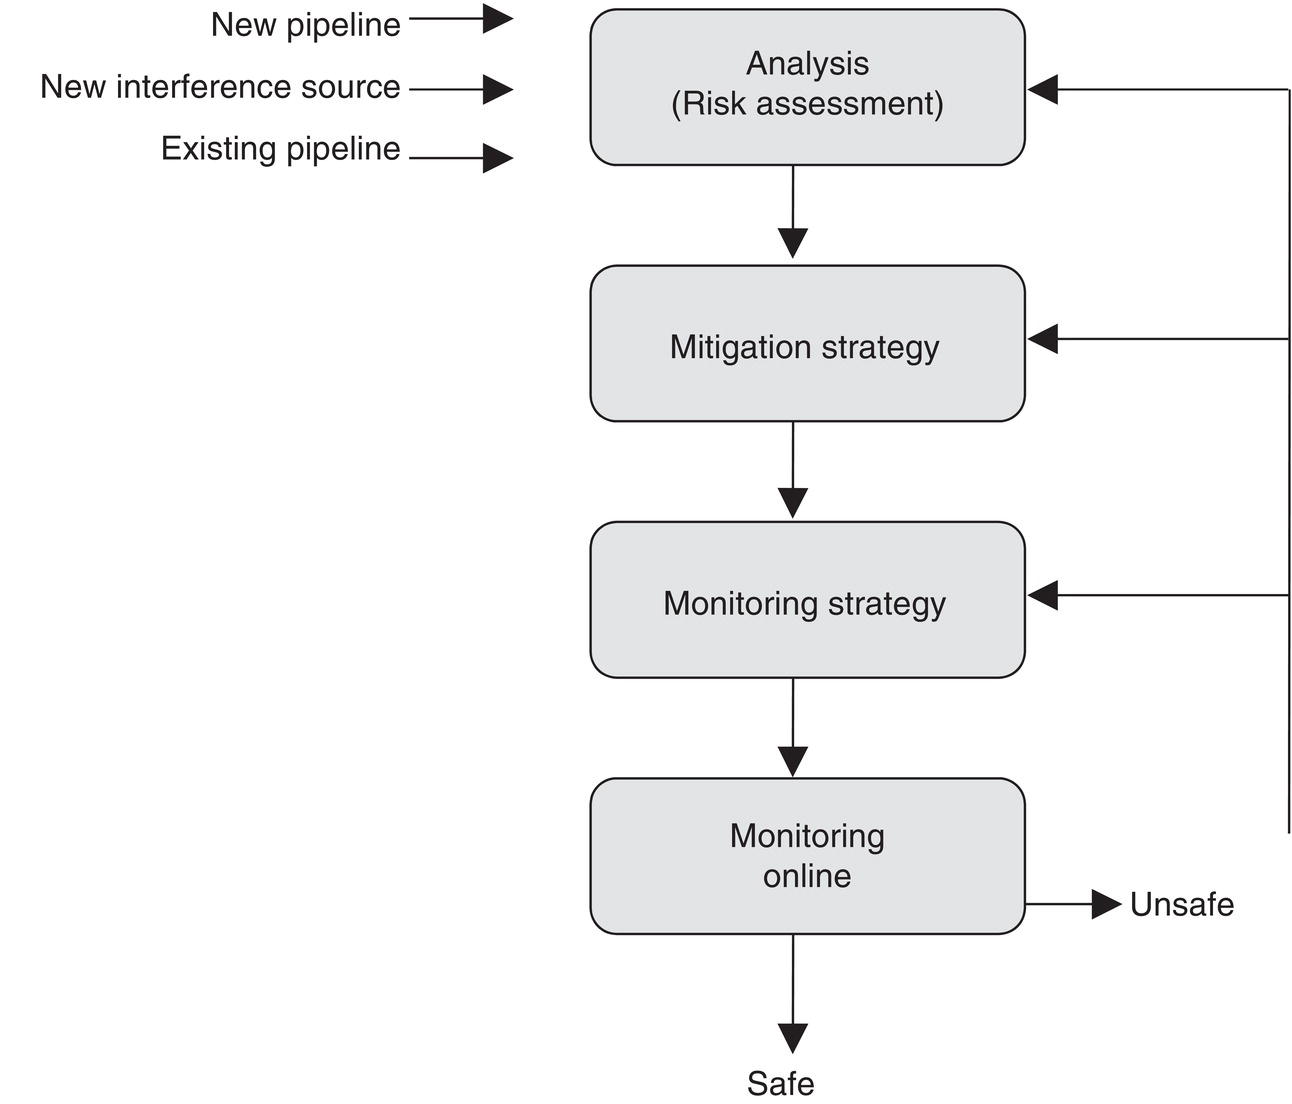
60
AC Corrosion
60.1 Introduction
60.2 Basic Understanding
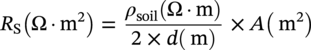
60.2.1 The Spread Resistance
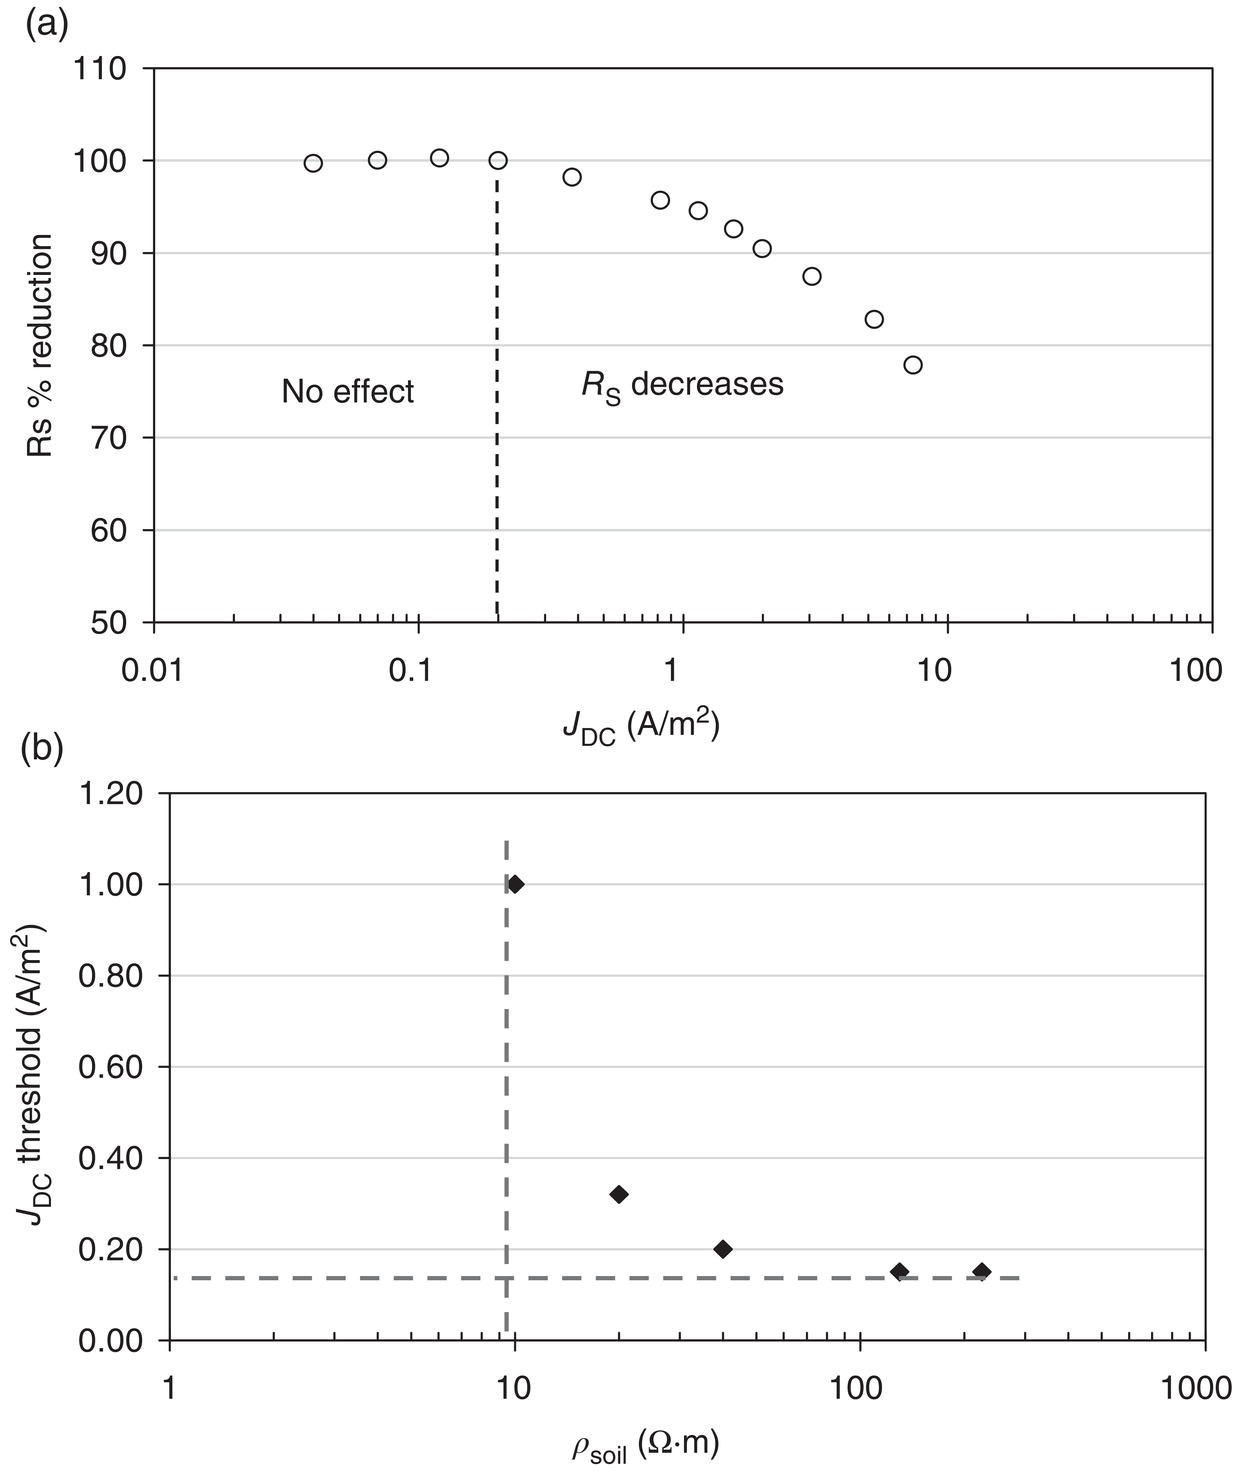
60.2.1.1 The Spread Resistance Dependency on DC Current Density
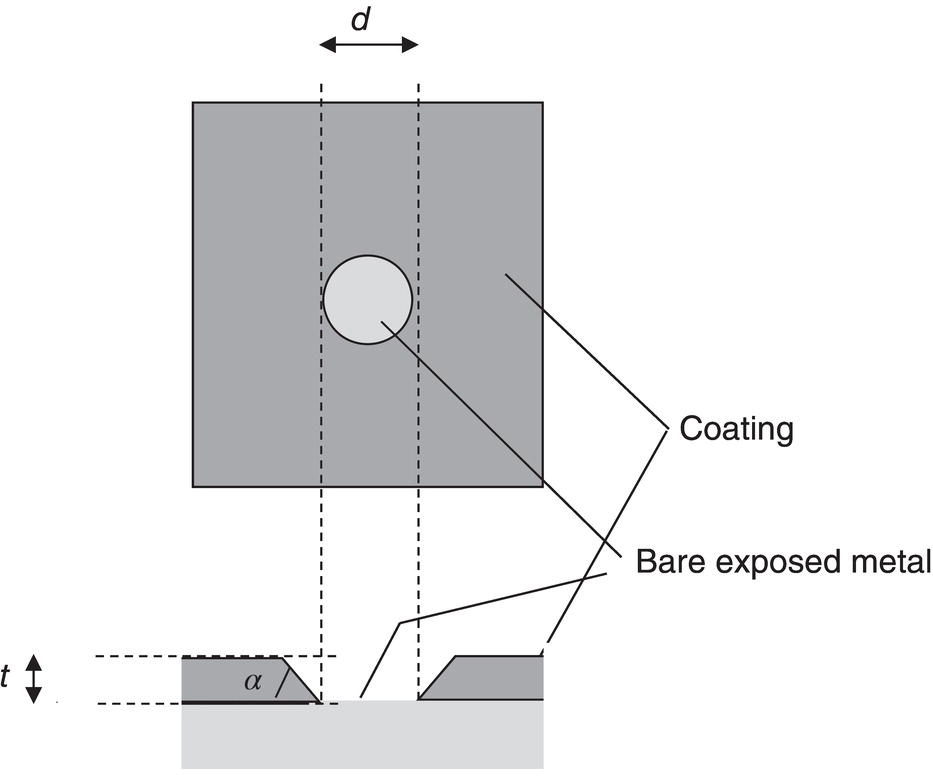
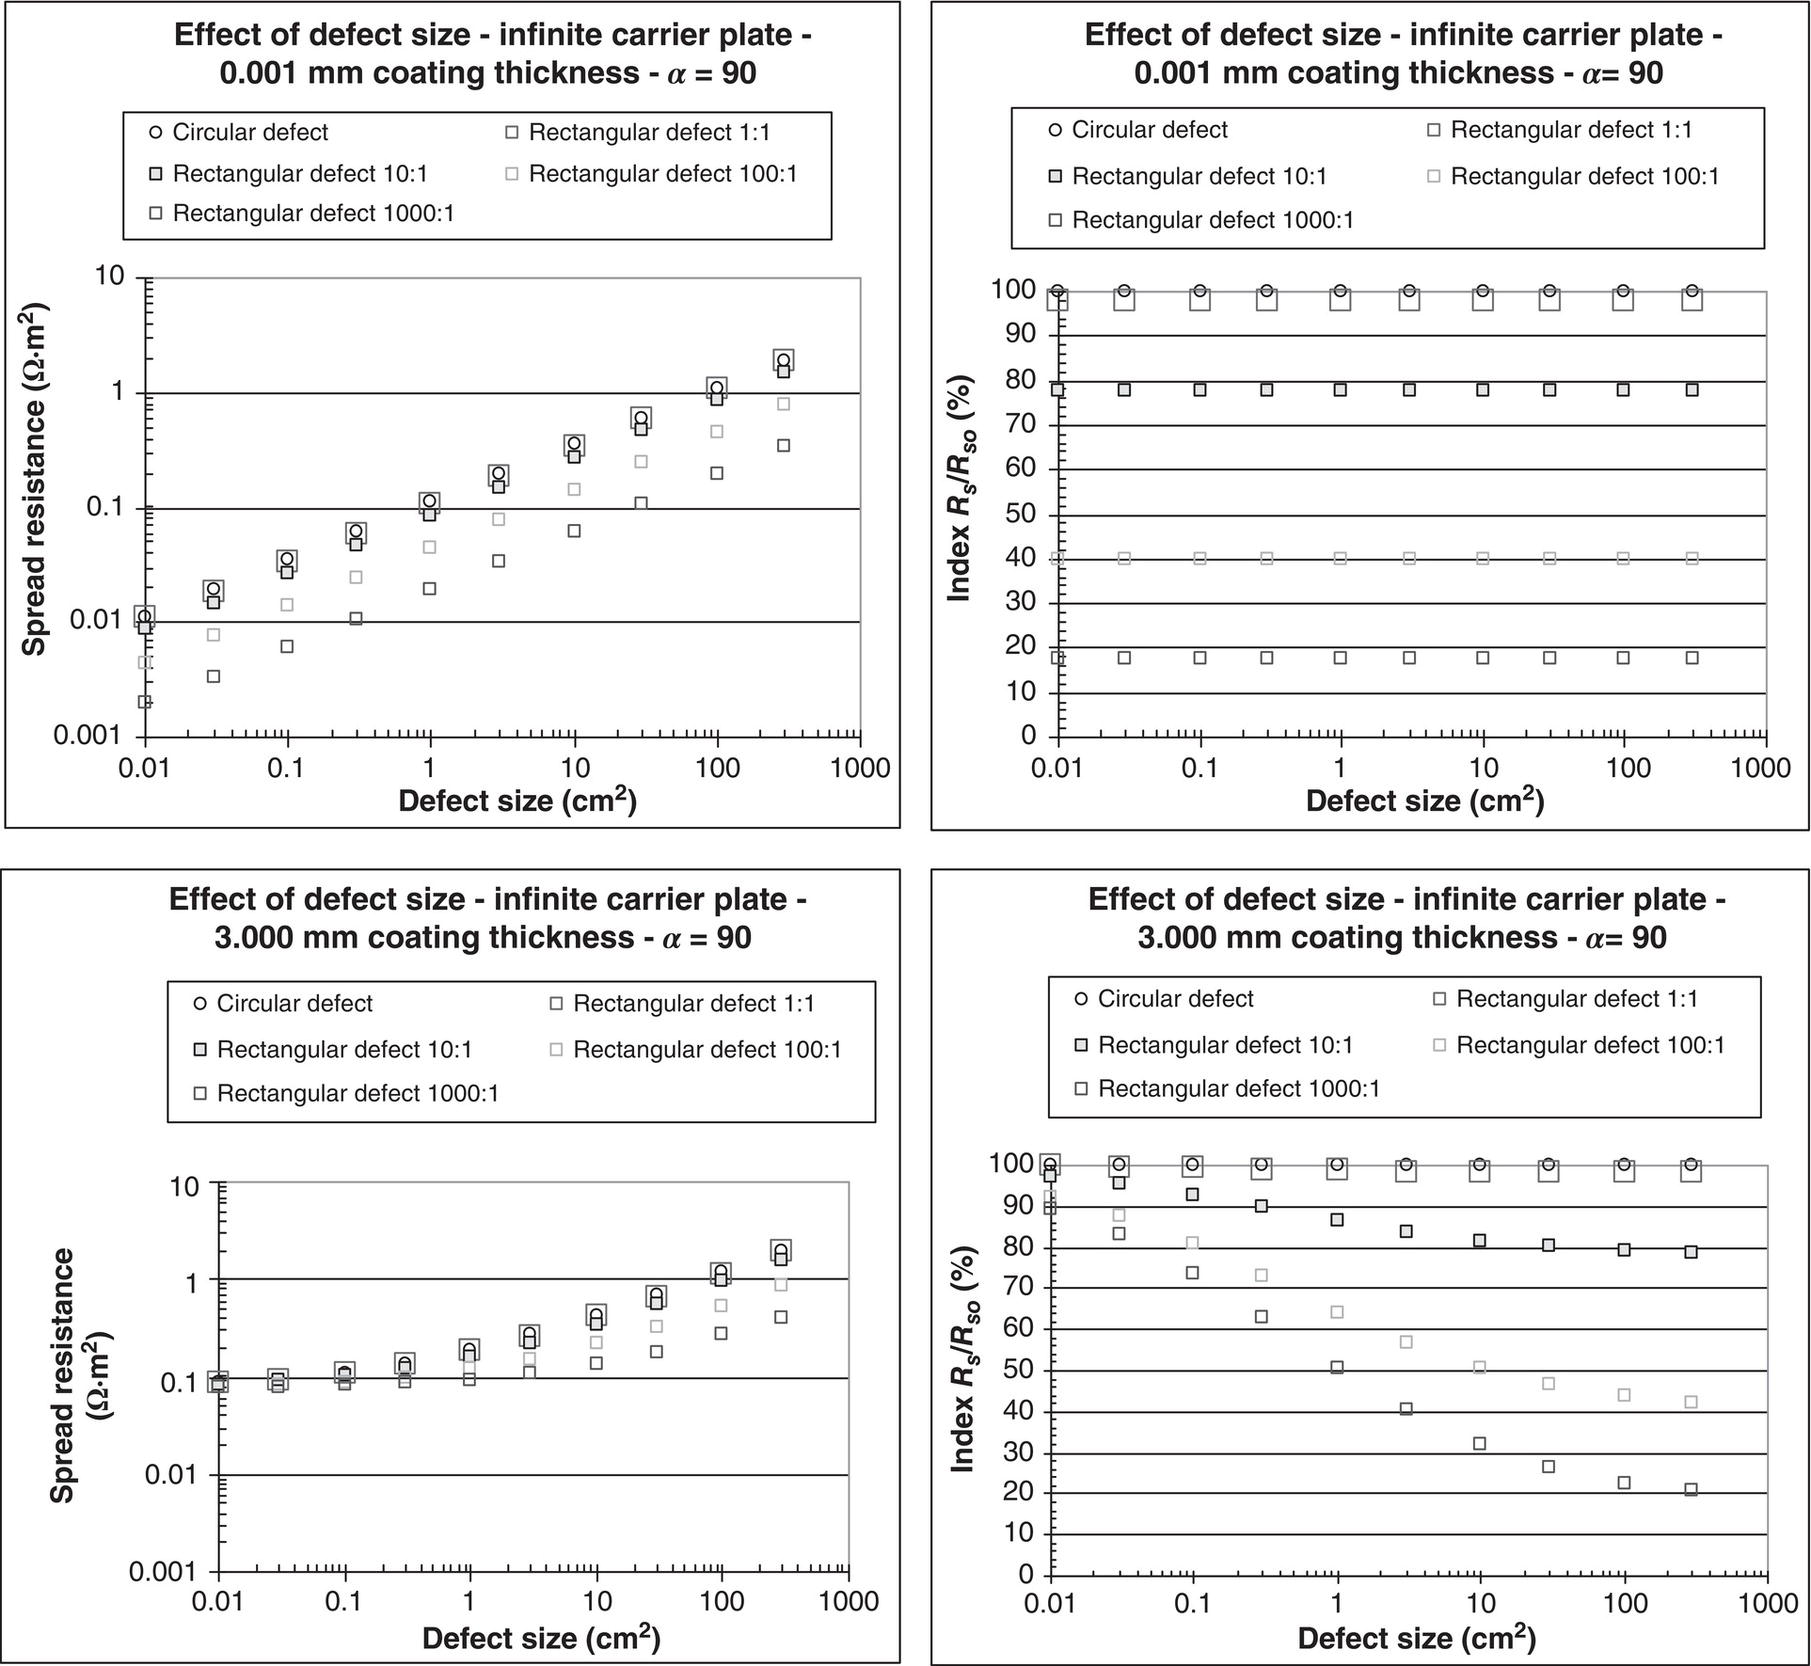
60.2.1.2 The Spread Resistance Dependency on Coating Fault Size and Geometry
 in Equation (60.2) gives
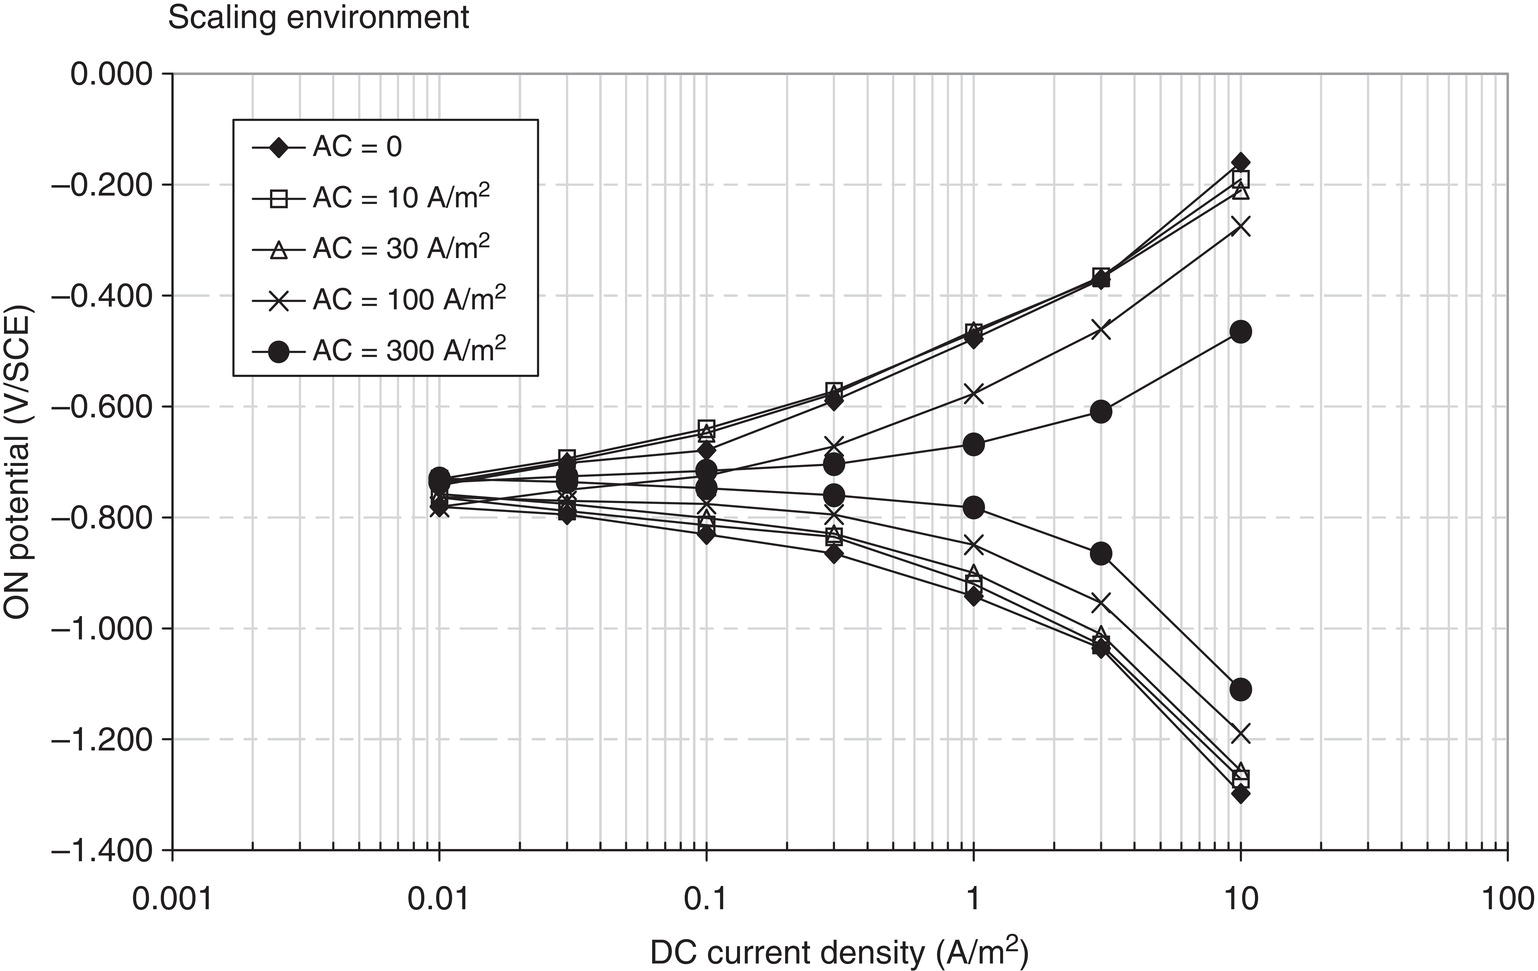
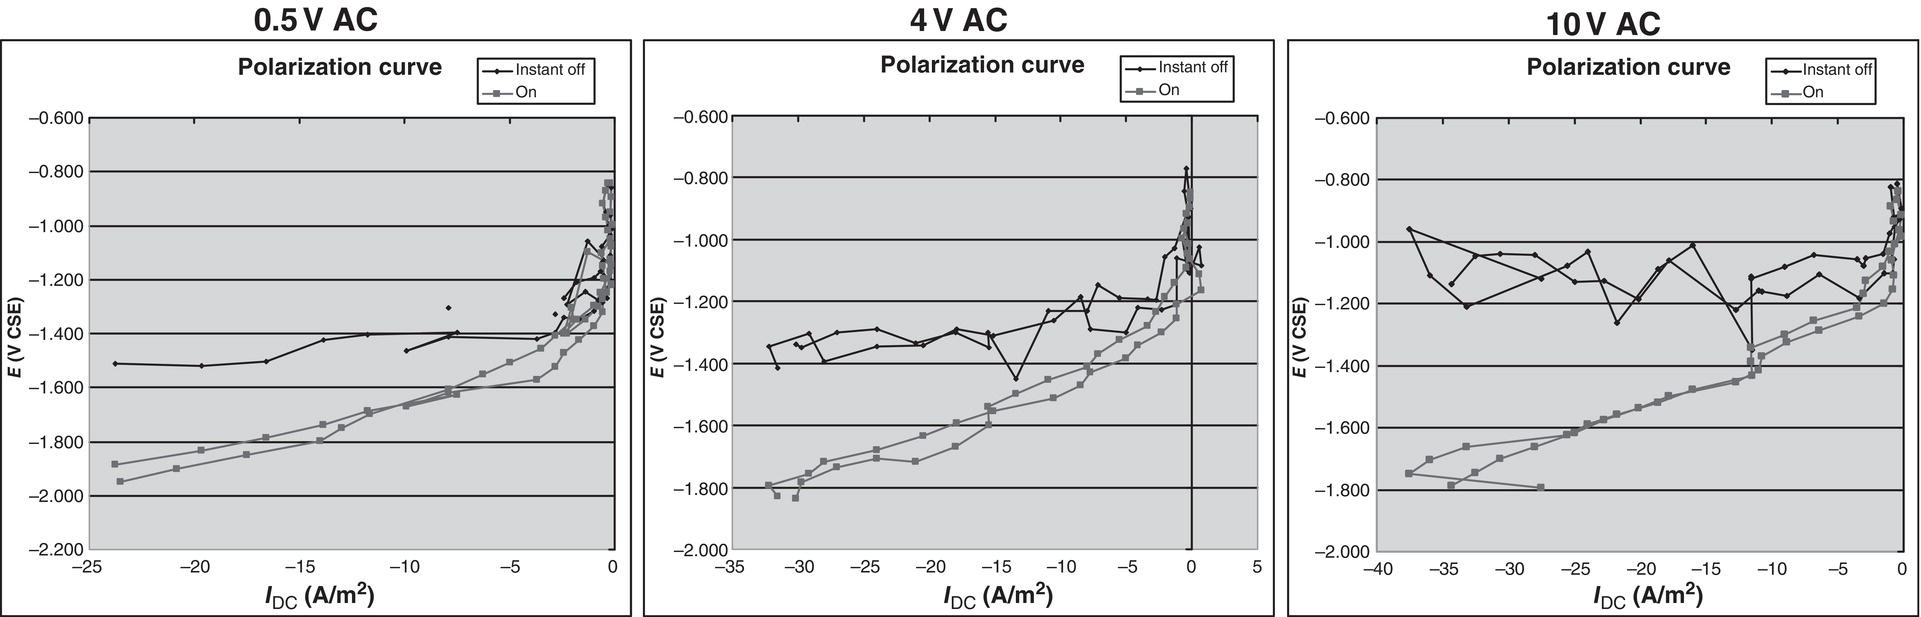
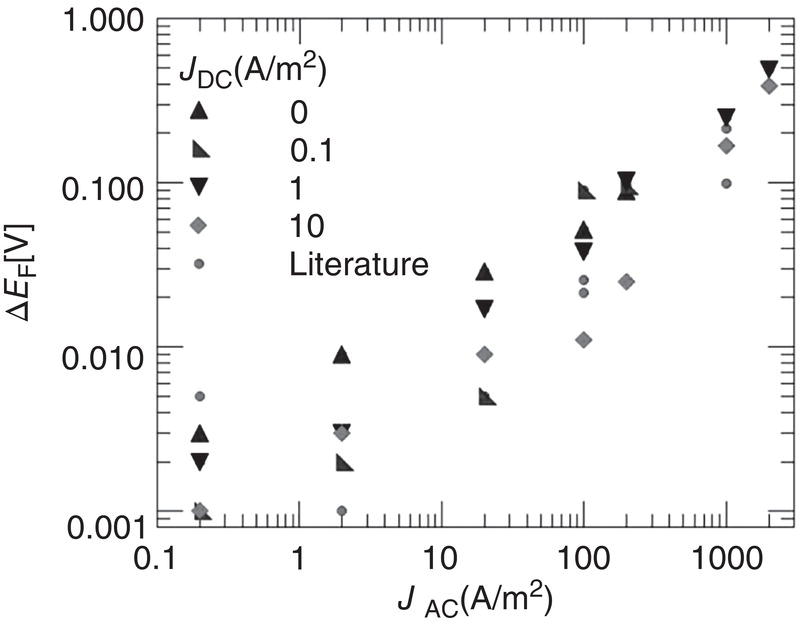
60.2.2 The Effect of AC on DC Polarization
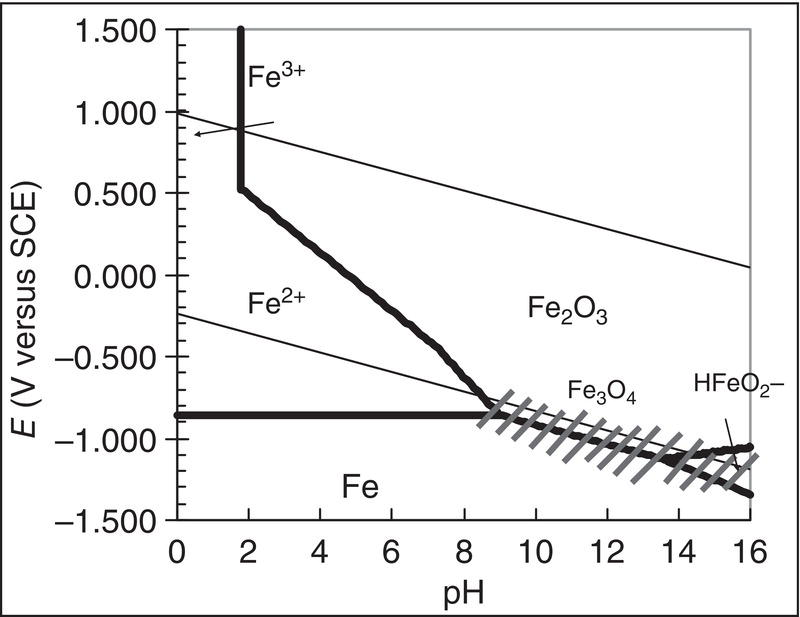
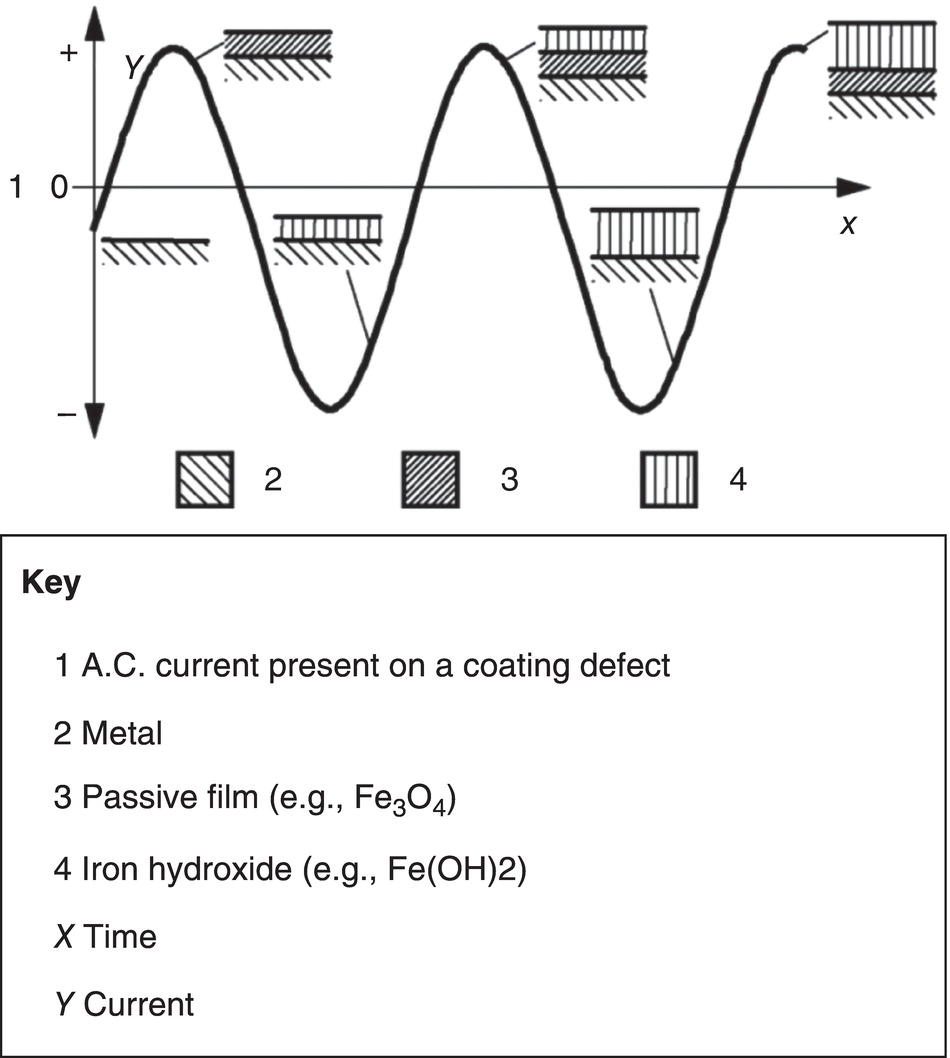
60.2.3 The Vicious Circle of AC Corrosion—Mechanistic Approach
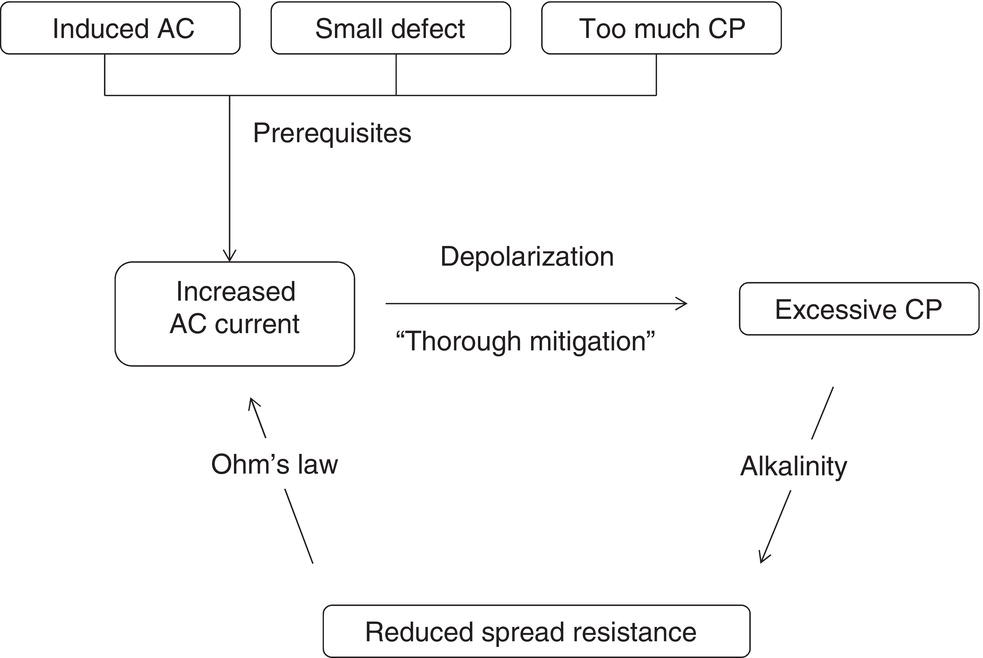
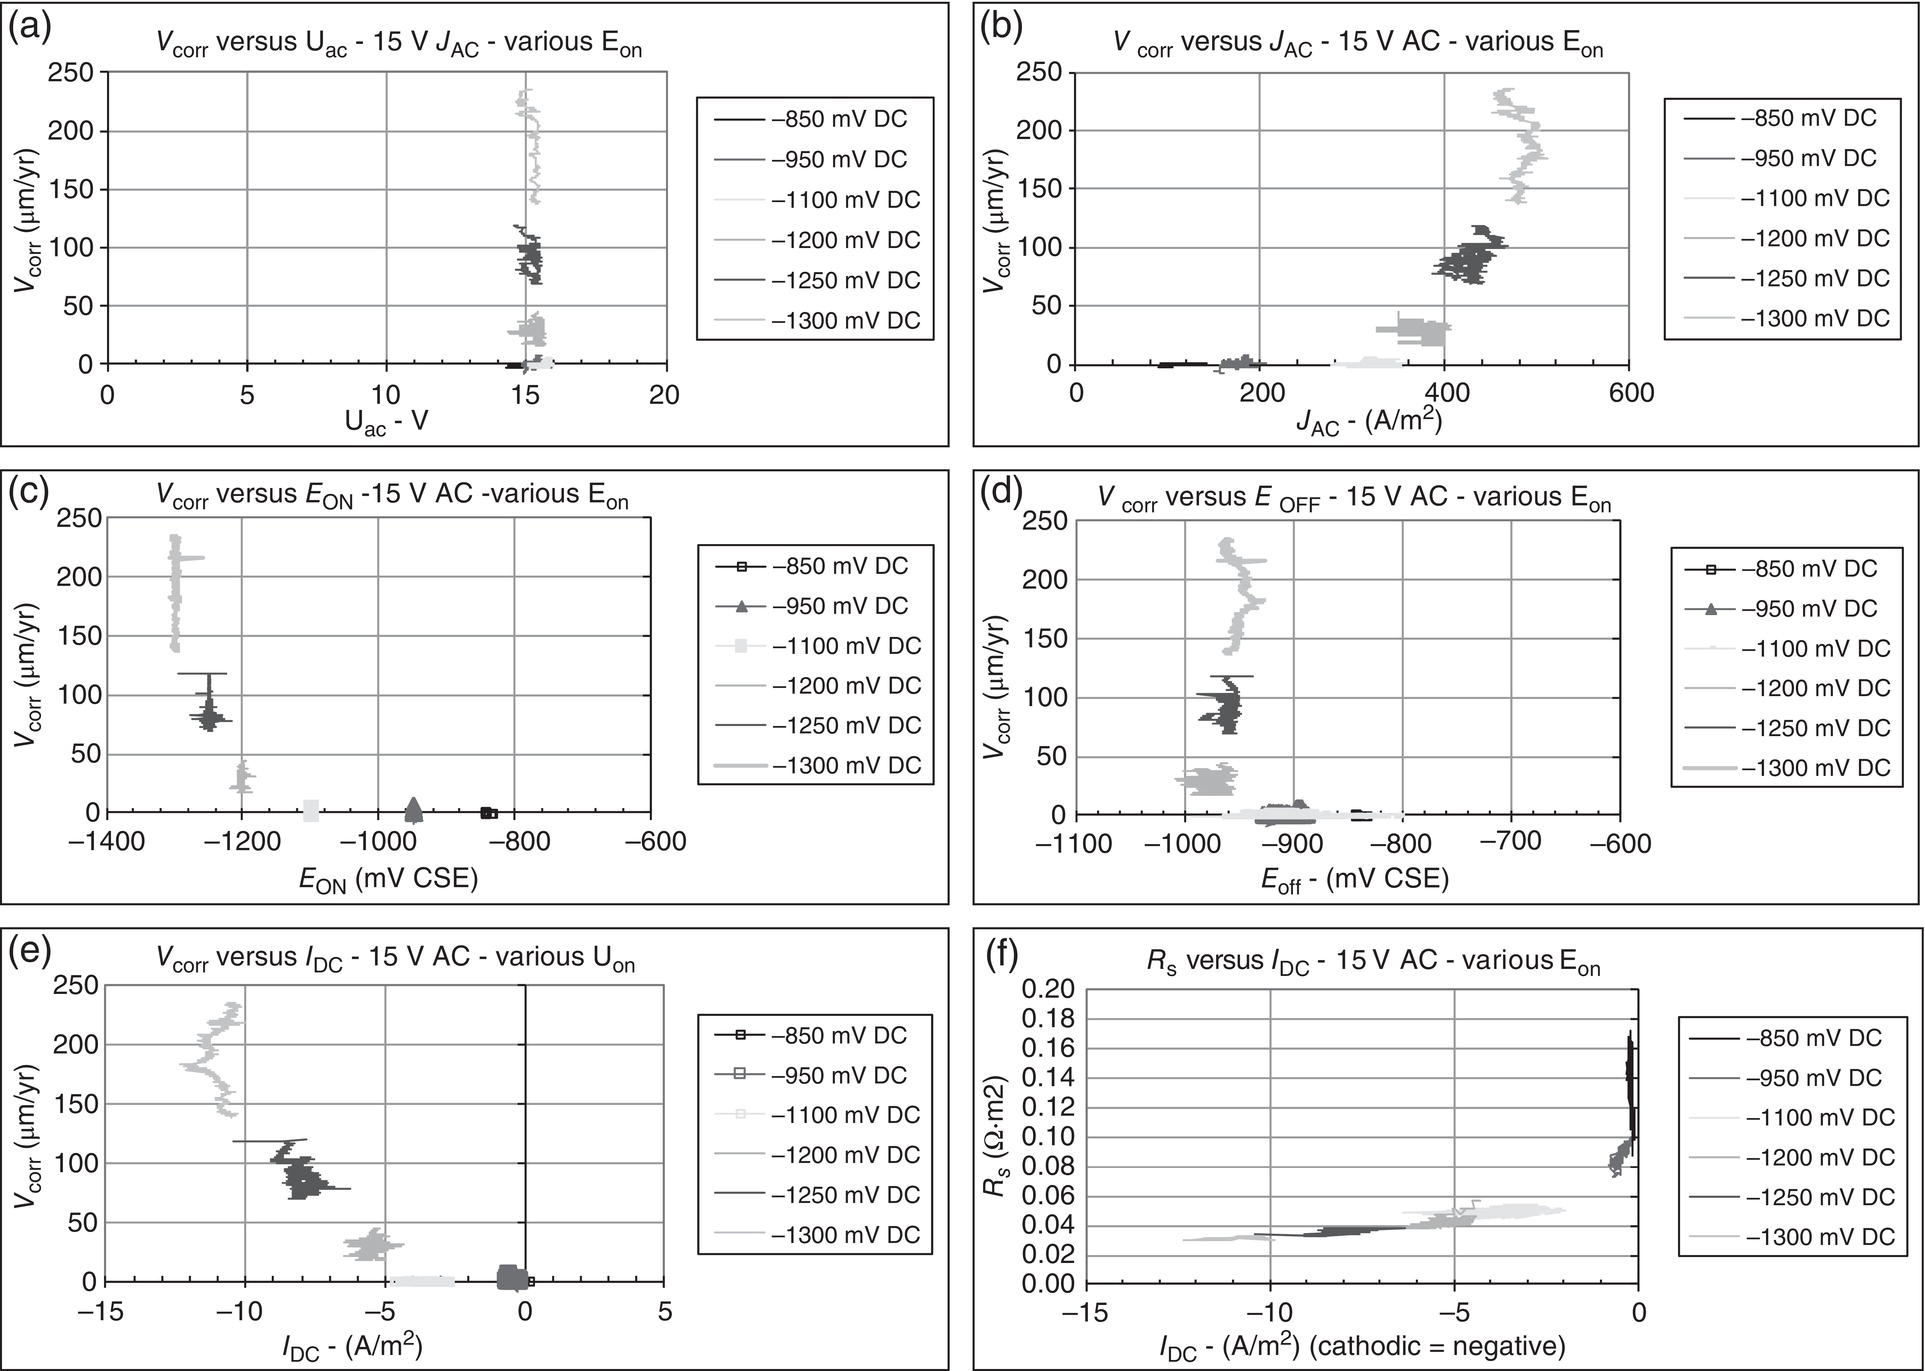
 ) in the Pourbaix diagram (Figure 60.12) will lead to an open wound of corrosion. Corrosion rates in excess of 10 mm/yr have been observed.
60.3 AC Corrosion Risk Assessment and Management
60.3.1 Criteria
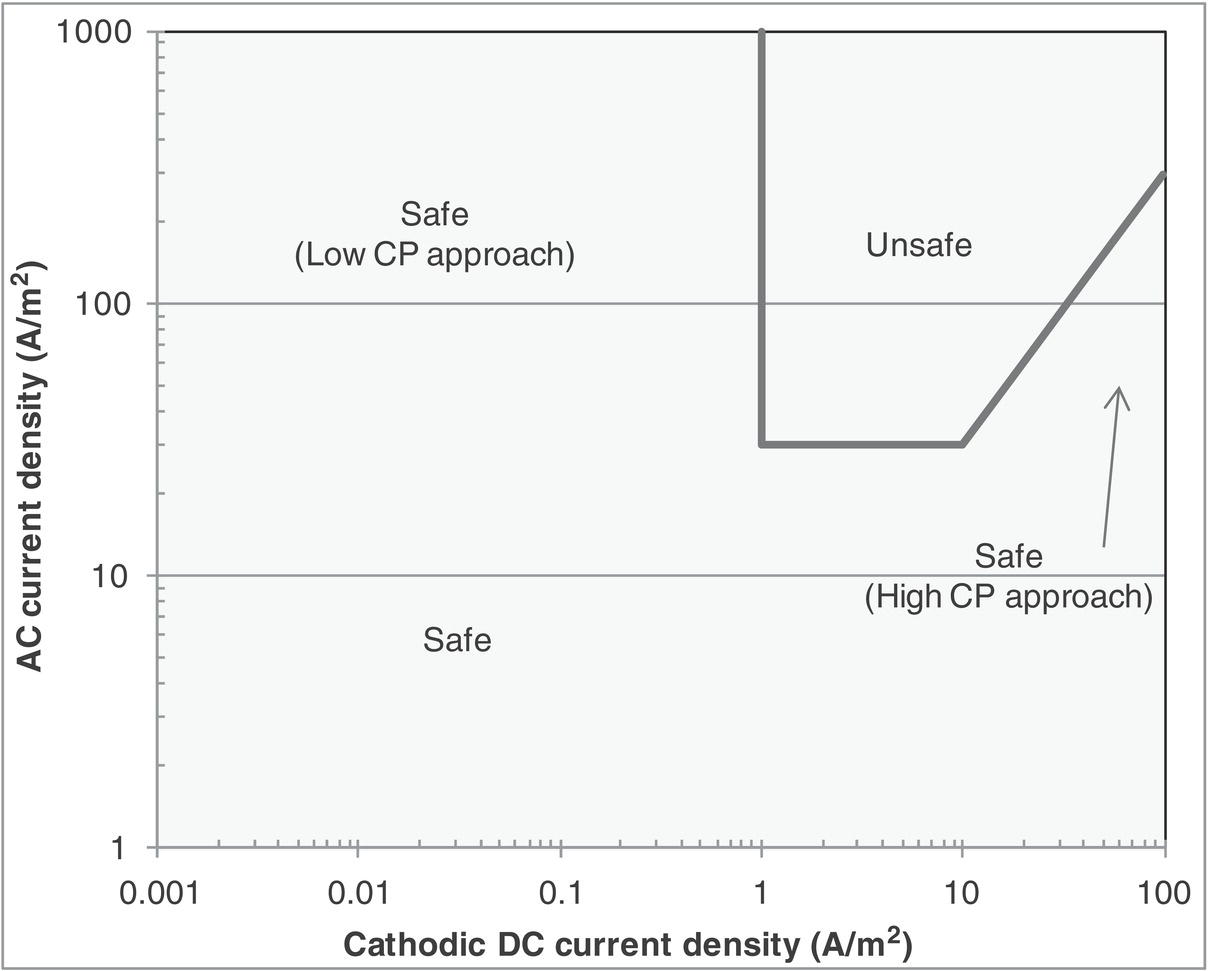
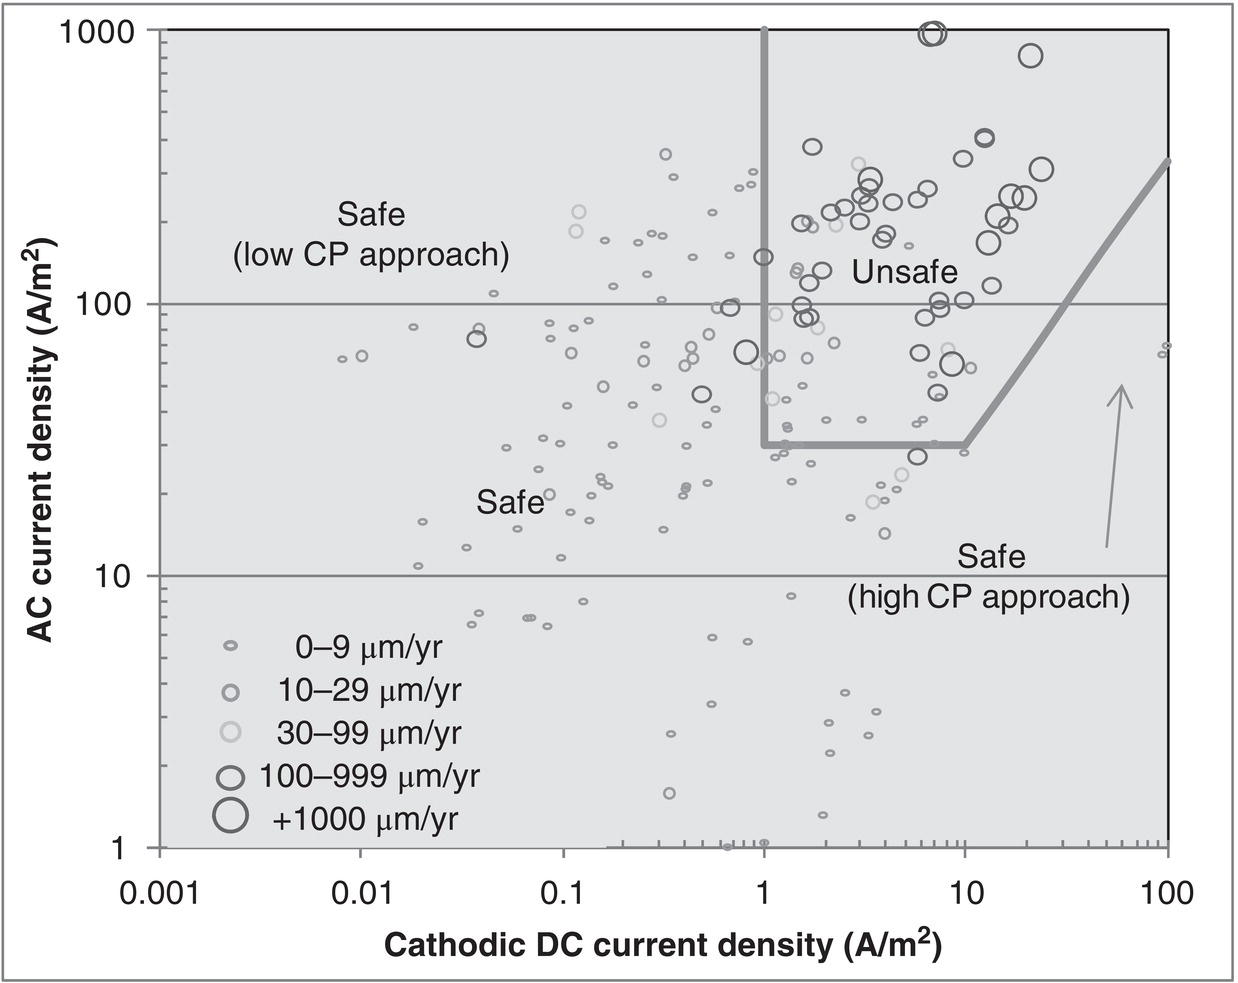
60.3.2 Current Criteria
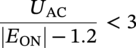
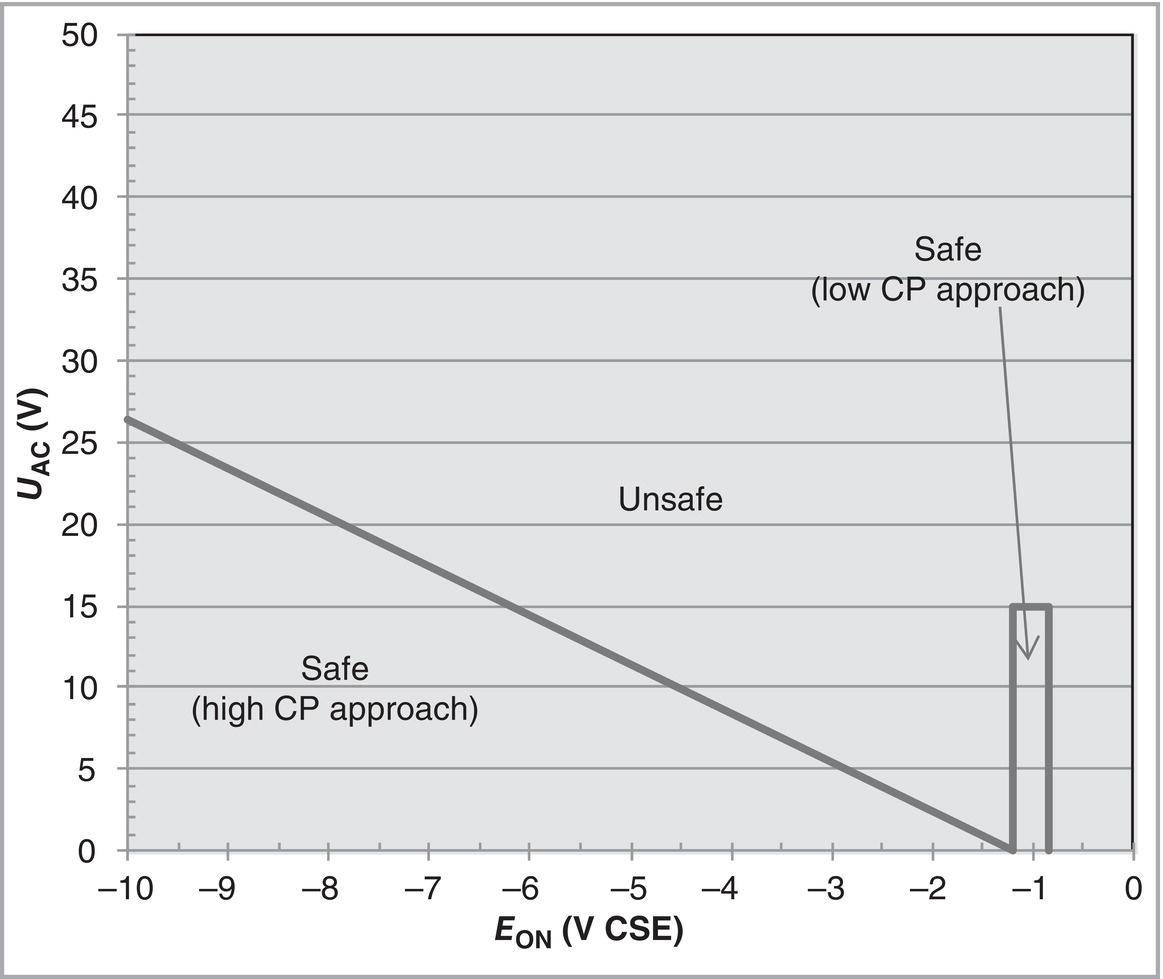
60.3.2.1 ON Potential Approach
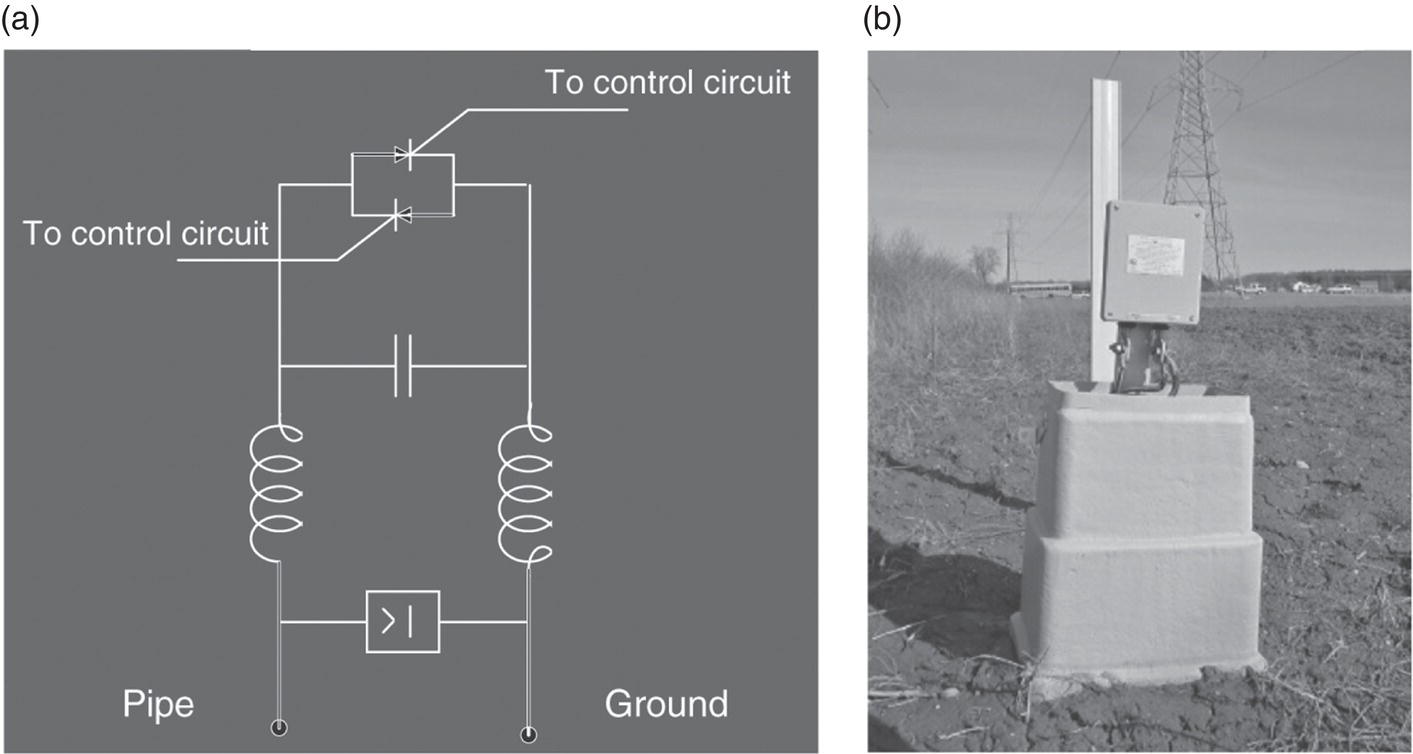
60.3.3 Mitigation Measures
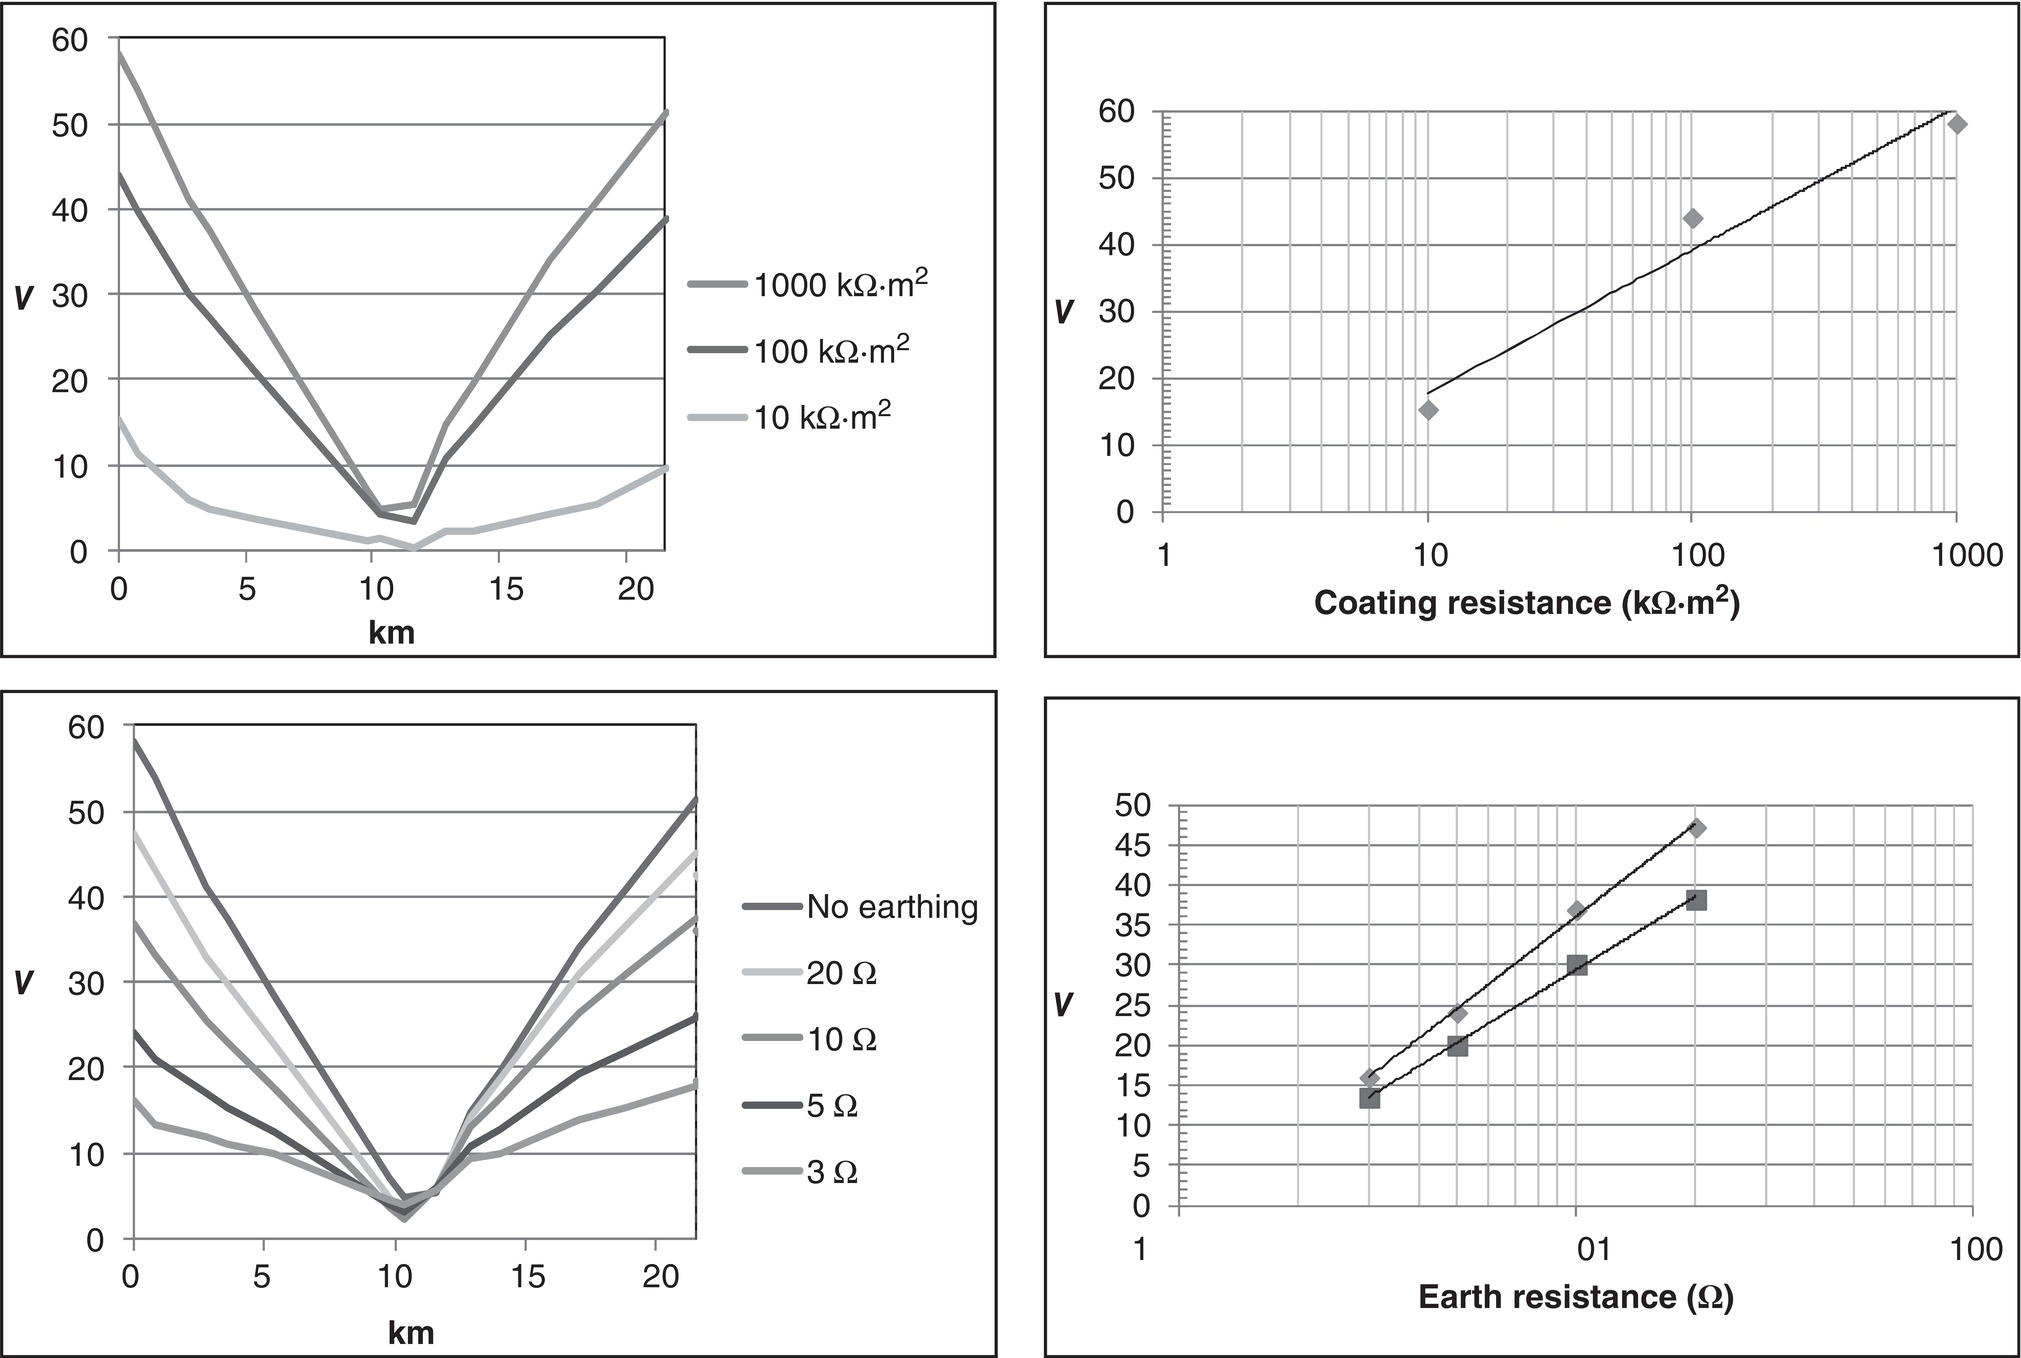
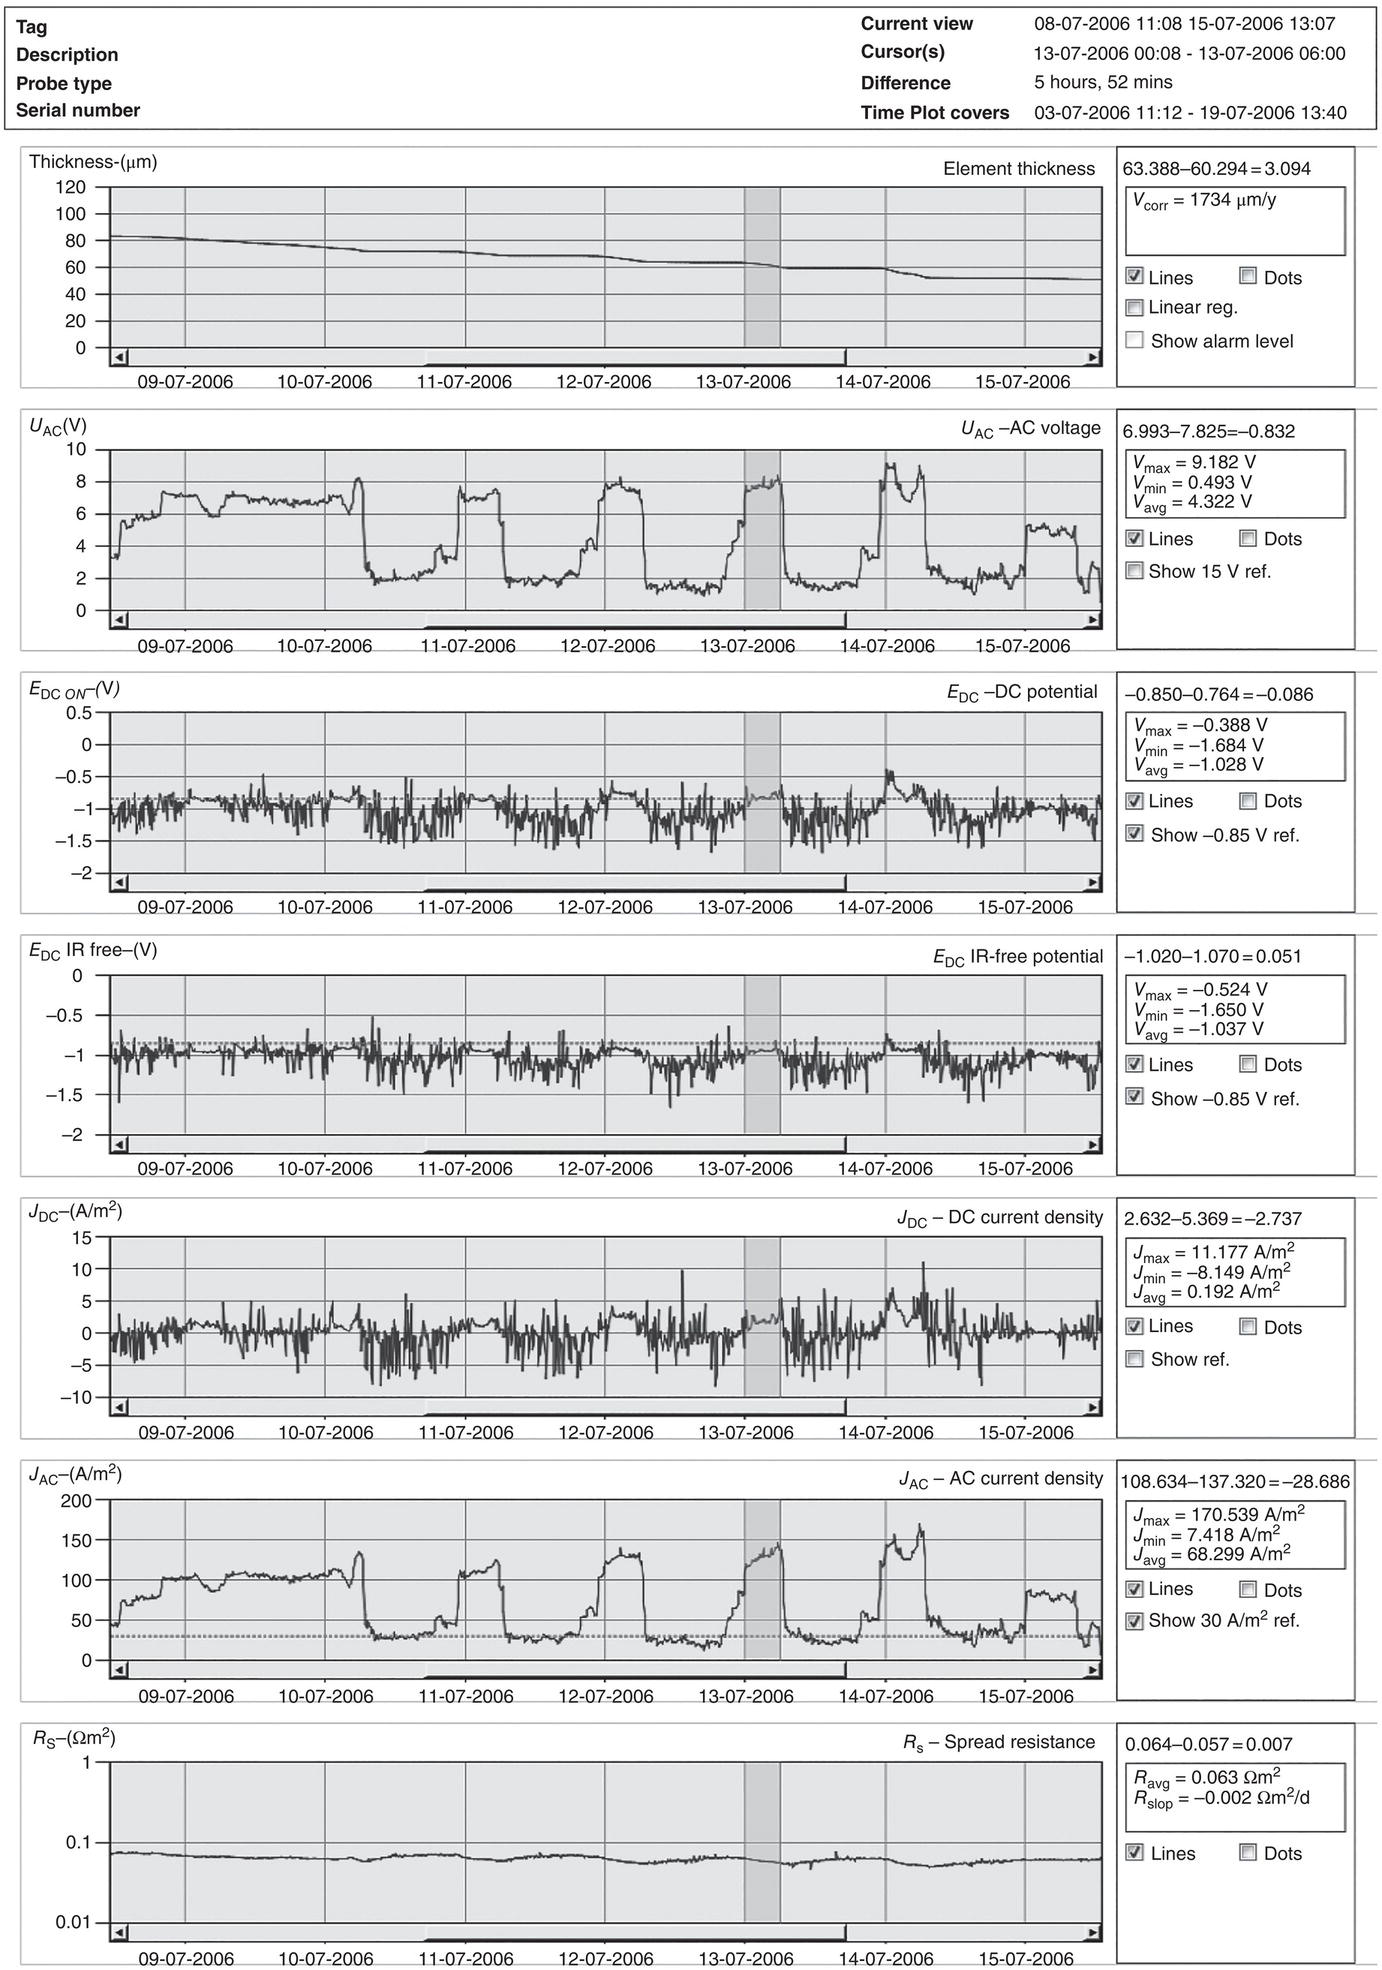
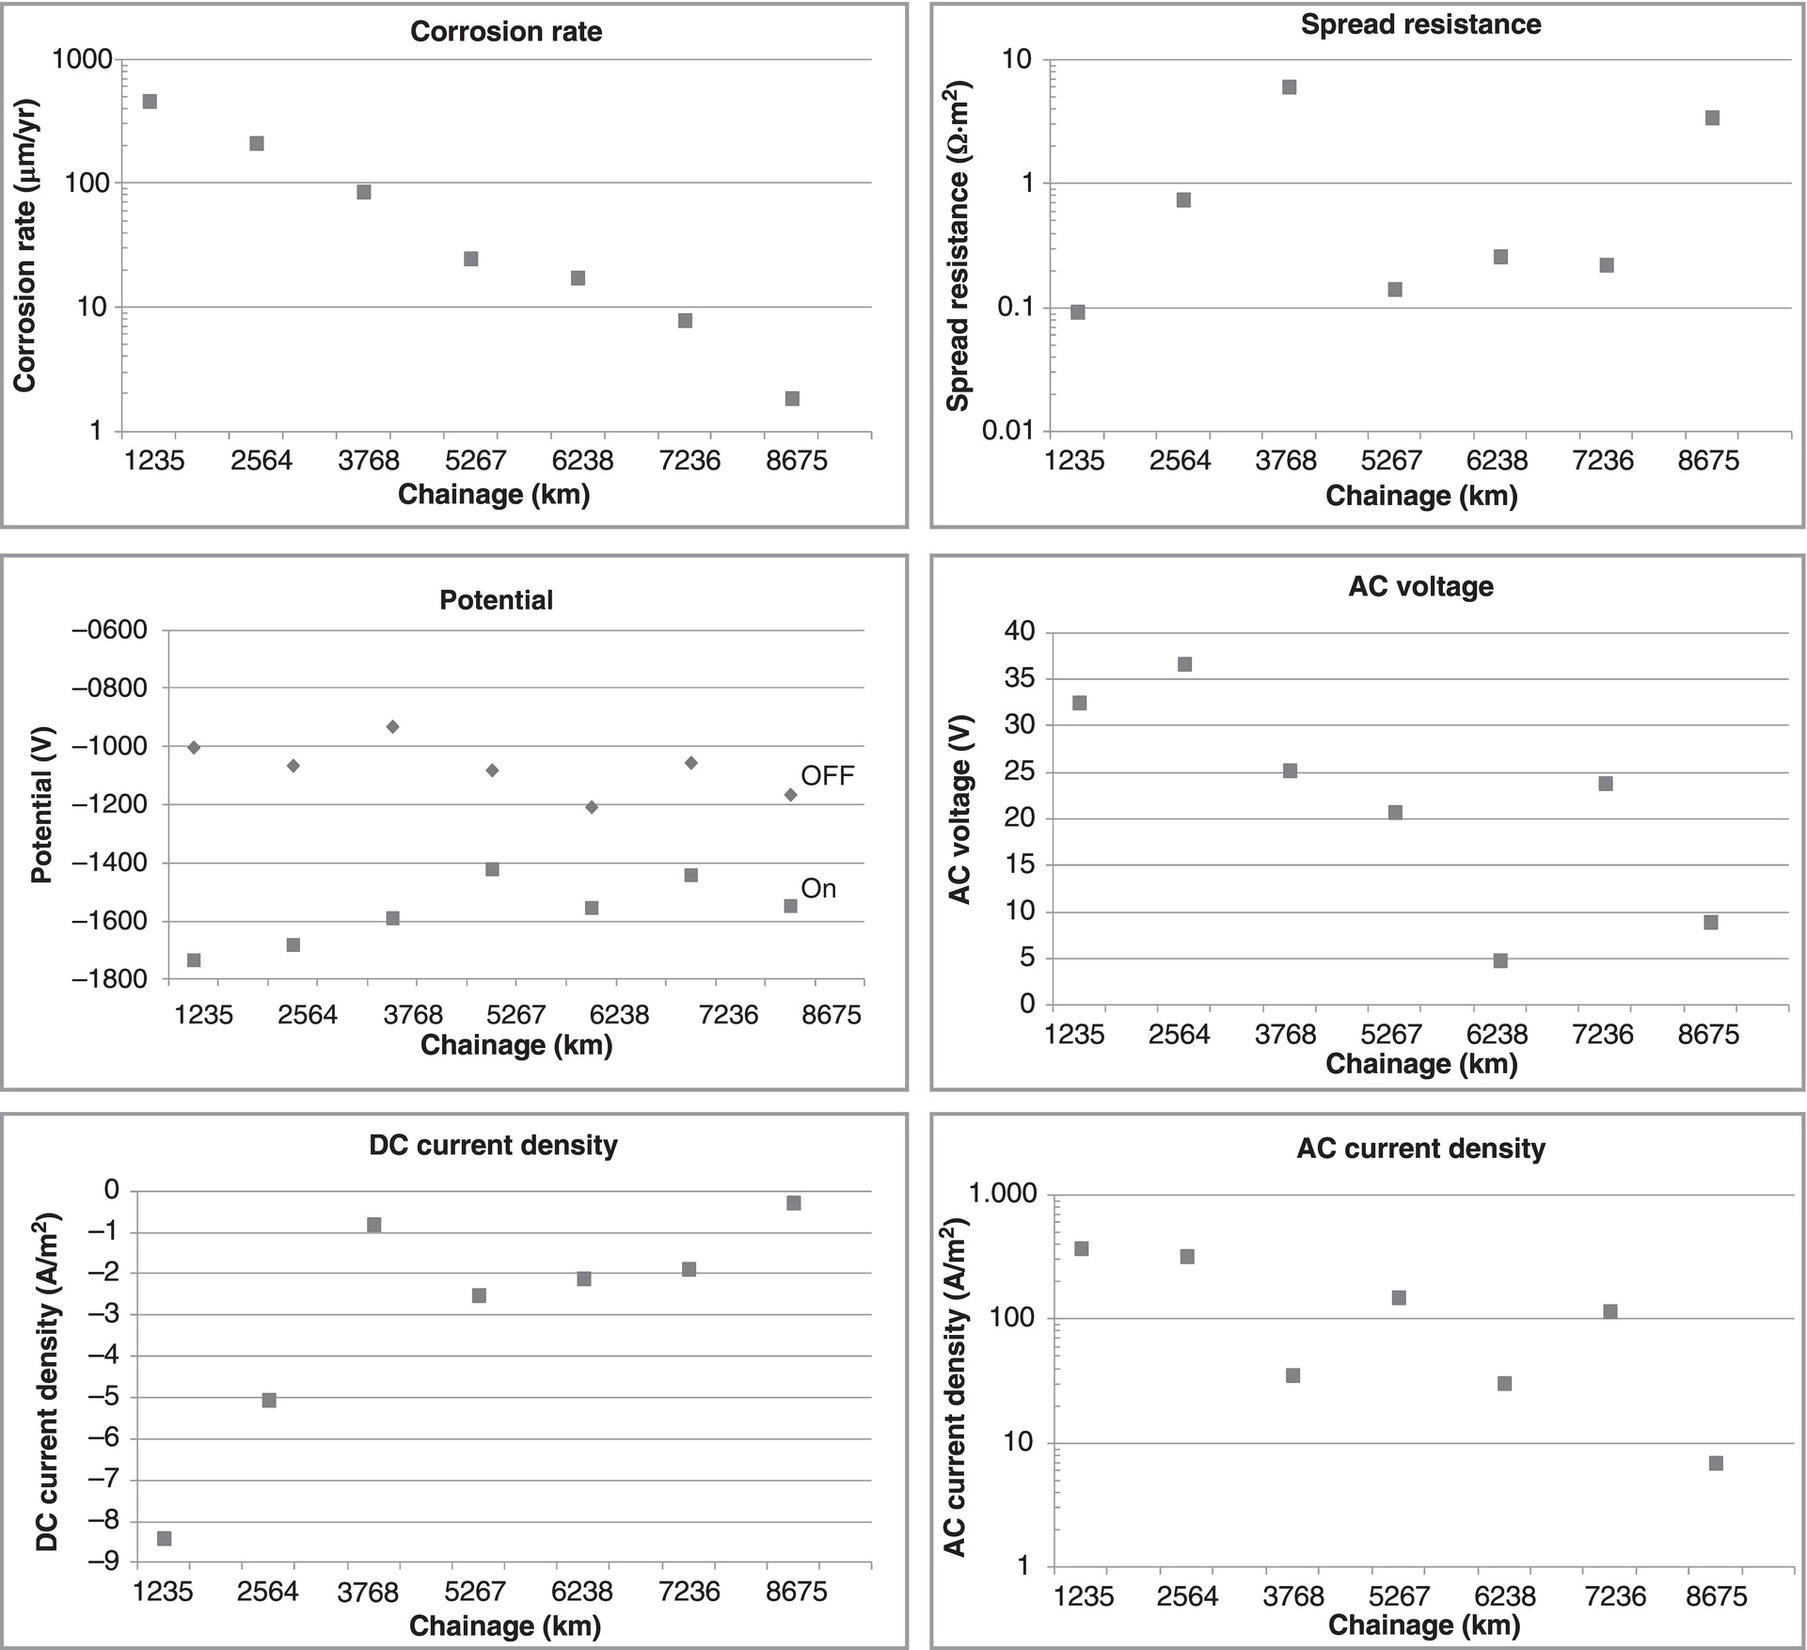
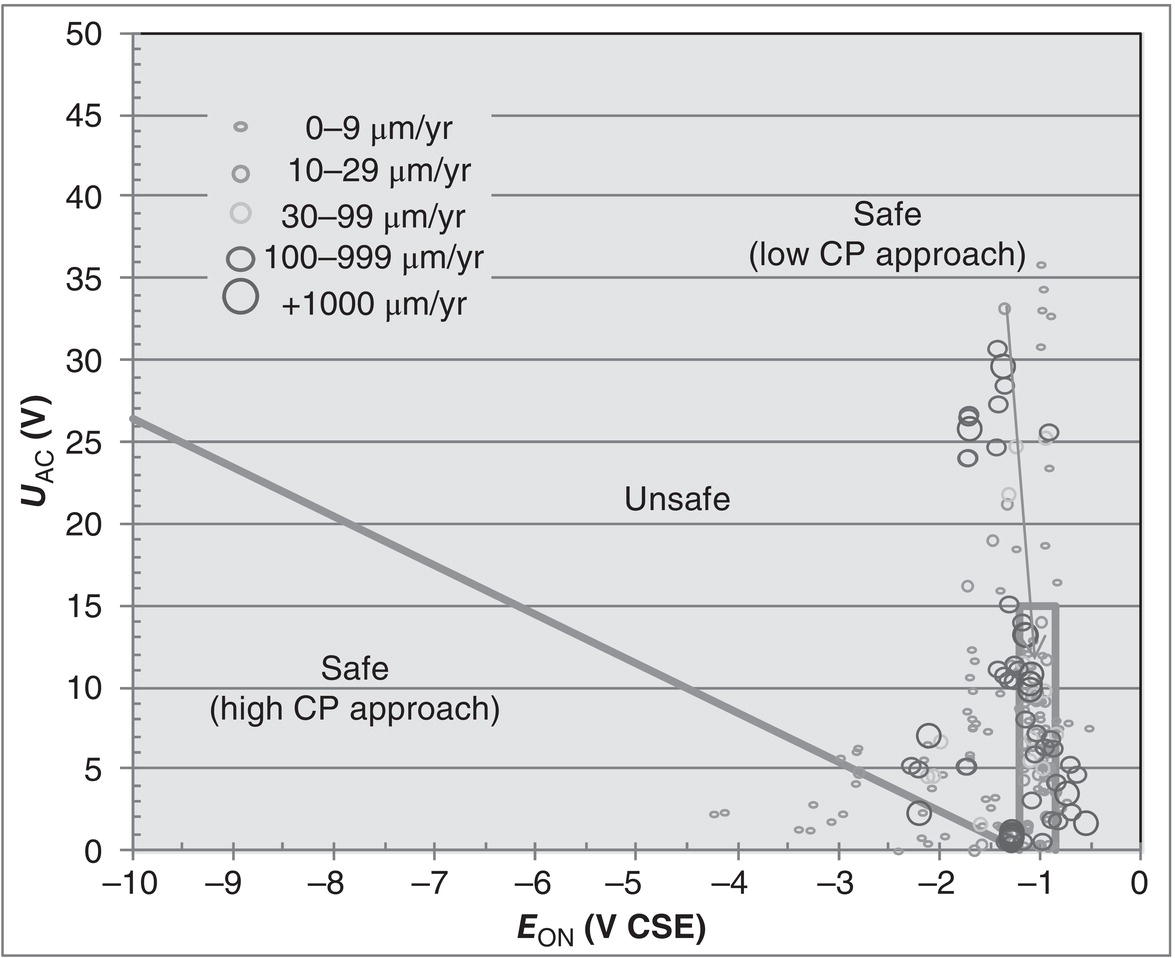
60.3.4 Monitoring and Management
References
Bibliography
Notes
AC Corrosion
(60.3)