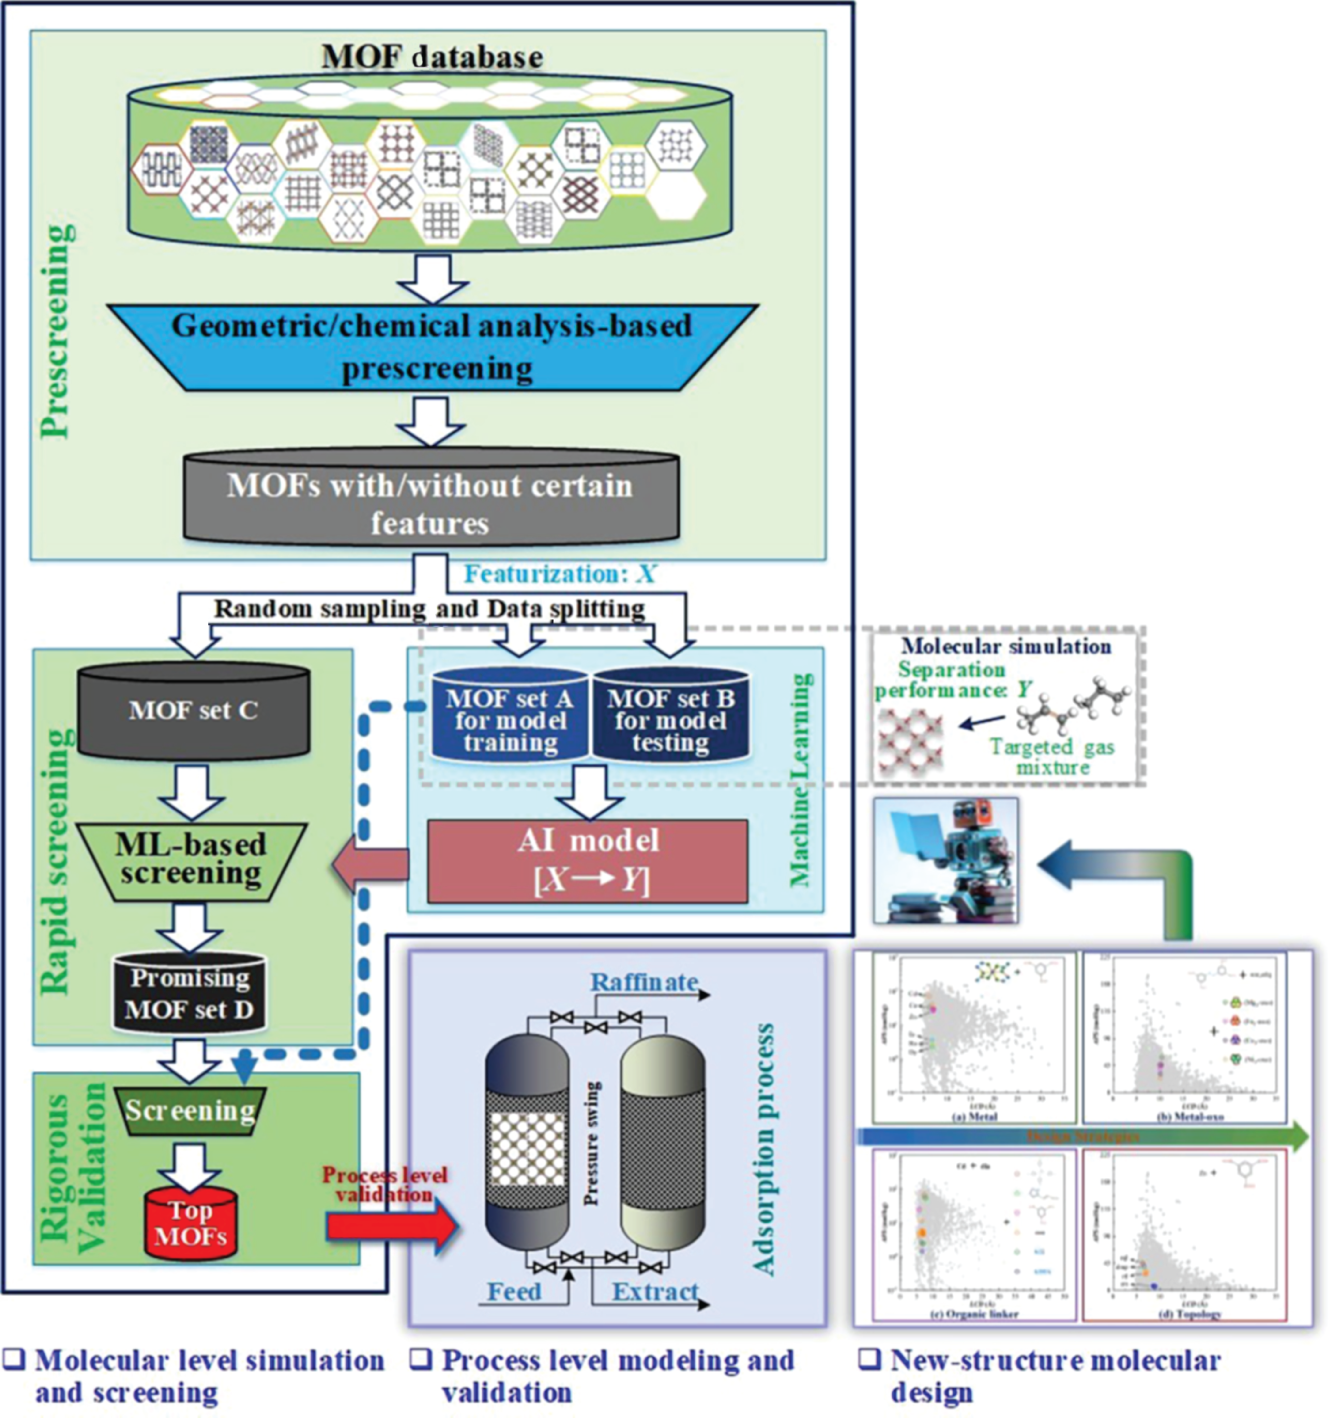
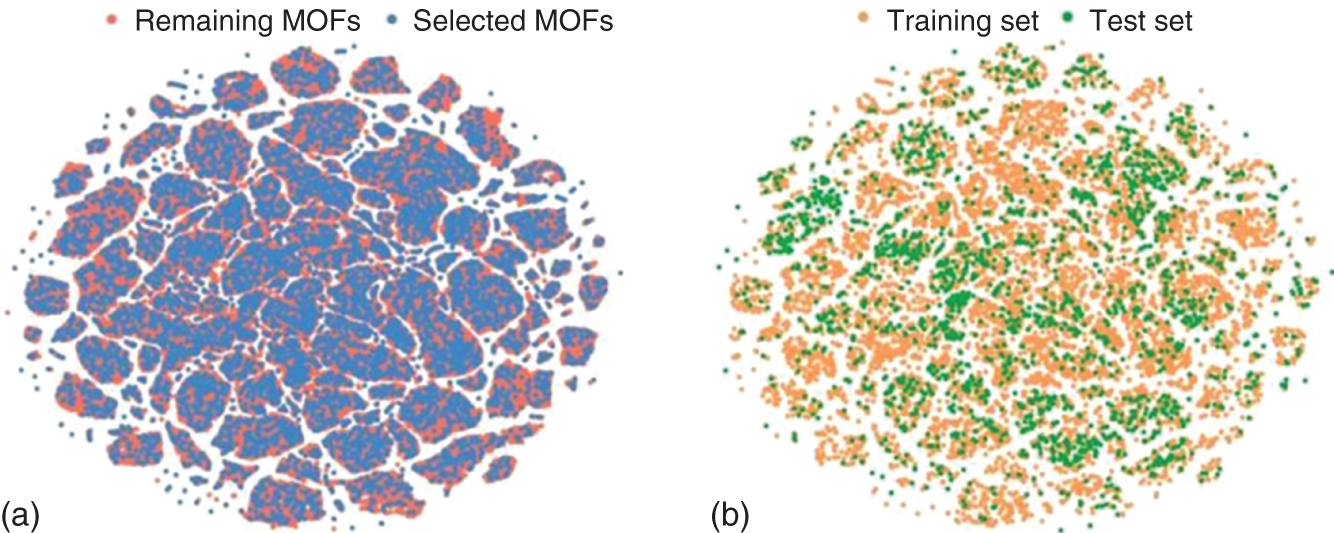
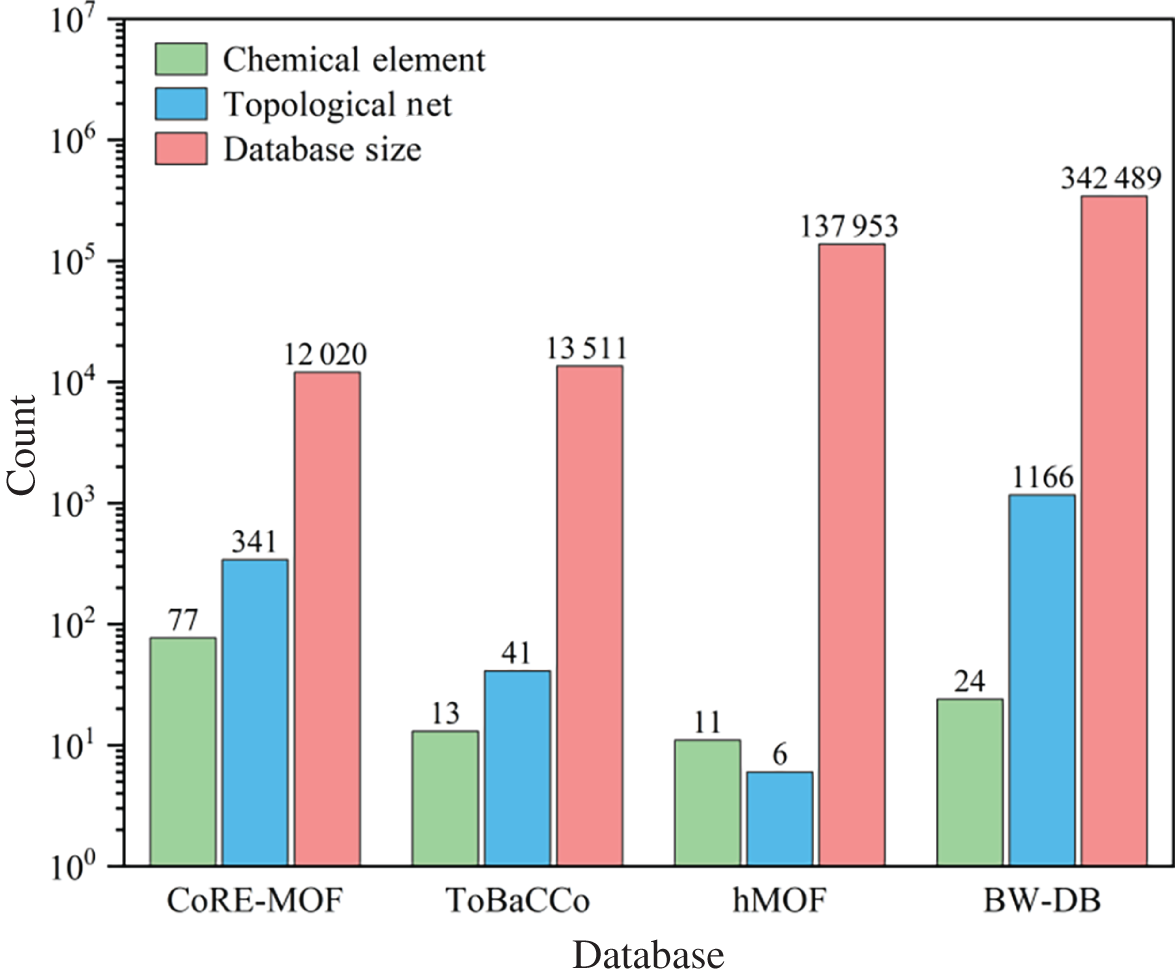
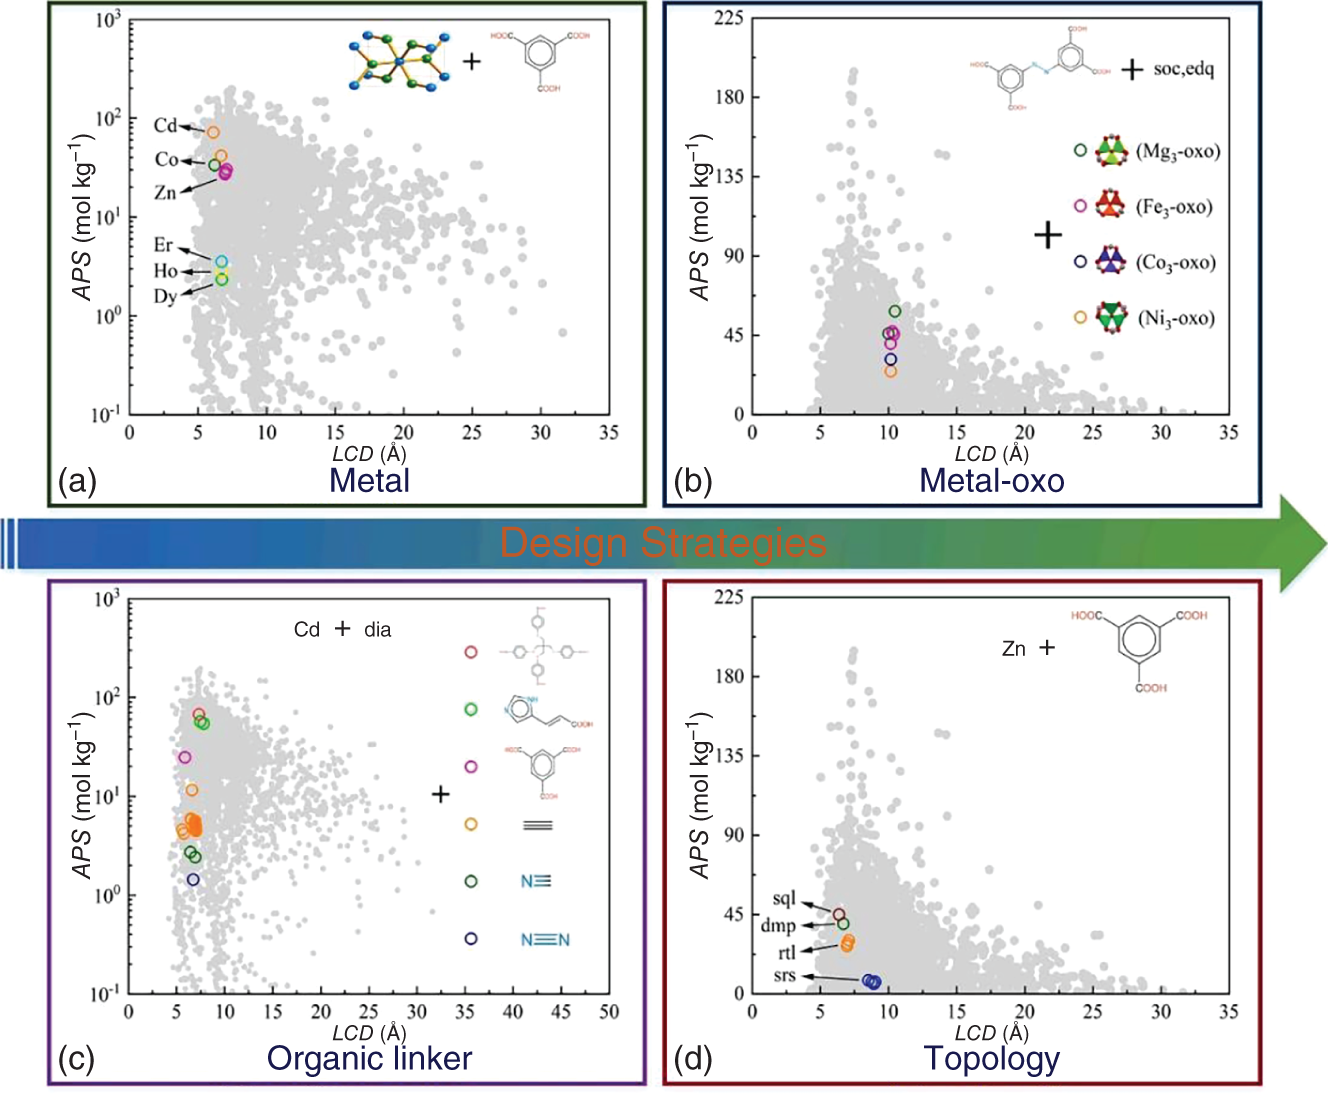
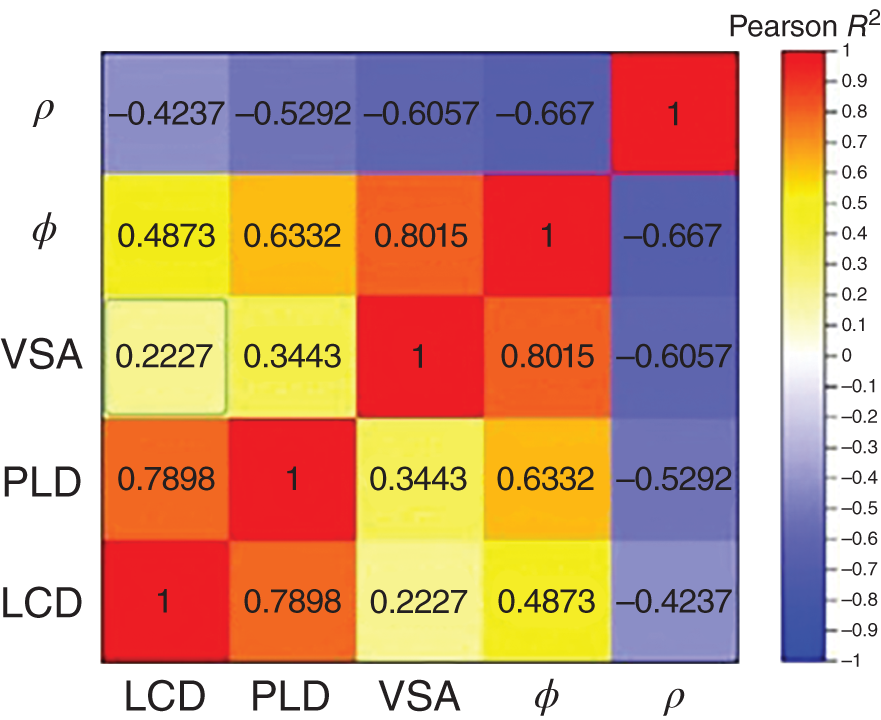
Li Zhou, Min Cheng, Shihui Wang, and Xu Ji Sichuan University, School of Chemical Engineering, No.24 South Section 1, Yihuan Road, Chengdu, Sichuan Province, 610065, China Gas separation/purification is of paramount significance in the petrochemical industry. Distillation is one of the most practiced techniques in this regard, such as the separation of alkenes from alkanes [1, 2], O2/N2 [3], which is energy- and capital-intensive. Selective adsorption separation based on solid porous materials can be a promising alternative owing to its low energy consumption and cost [4]. To date, multiple types of porous materials (e.g. resins, zeolites, and carbon-based materials) have been examined and applied for gas purification applications. Metal–organic frameworks (MOFs), as a special class of porous materials, have attracted widespread attention in gas separation due to their tunable pore sizes and chemistry characterizations and are considered promising replacements and/or enhancements to traditional adsorbents. In recent decades, considerable investigations have been carried out to accelerate their applications in industry, covering expert knowledge-guided experimental synthesis and evaluation [5, 6], molecular simulation-assisted screening of high-performing candidates [7–9], as well as techno-economic analysis for their large-scale synthesis [10]. At the early stage, experiment-driven investigations for better MOFs were conducted and reported for various applications [11, 12]. Although traditional expertise-aided trial-and-error experimental approaches are effective in discovering better materials for certain applications within a restrained chemical space, their effectiveness and efficiency pale when facing enormous potential chemical spaces for MOFs for which the theoretical number of realizable structures is infinite. This brought the rise of computer-aided material discovery. Computer-aided material discovery heavily relies on the accurate and rapid evaluation of properties of the candidate materials, such that materials with high potential can be rapidly screened out for further experimental validation. To better support the discovery of desirable MOFs, several open-source authoritative MOF databases were contributed by the community, including the s (Cambridge Structural Database non-disordered metal–organic frameworks subset) [13] and the hMOFs (Northwestern Hypothetical MOF Database) [14]. The CSDSS contains experimentally synthesized MOFs of one-dimensional (1D), two-dimensional (2D), and three-dimensional (3D). In 2014, Chung et al. [15] initiated the CoREMOF 2014 (Computation-Ready, Experimental MOF Database) with 4764 3D MOFs derived from the CSDSS. In 2019, the database was updated to include more new 3D MOFs contributed by CoRE-MOF users, updated from the CSD, and the Web of Science search [16]. Generally, the procedure of computer-aided high-throughput screening and optimistic design of MOF materials for adsorptive gas separation consists of several steps, which are illustrated in Figure 9.1. As shown, three coupled steps are required, covering molecular level simulation and screening driven by rigorous molecular simulation as well as machine learning, unit operation level modeling and validation, and data mining assisted new molecular design to enrich the targeted chemical space and aim for better performances in the particular application. The premise for machine learning modeling is to translate abstract MOF structures into machine-readable numerical features (also known as descriptors). To comprehensively characterize a MOF, a set of indicators that can qualitatively and/or quantitatively characterize the structural and chemical distinctions of a MOF is adopted to assist the overall screening and optimistic design procedure. Regarding structural features of a MOF, several computationally simple and physically intuitive properties can be employed to describe its pore geometry and size, such as the largest cavity diameter (LCD), pore limiting diameter (PLD), volumetric/accessible/gravimetric surface area (VSA/ASA/GSA), pore volume (PV), density (ρ), and porosity (φ). In some studies, the pore size distribution (PSD) and its derived indicators are also introduced to depict the inhomogeneity of the inner pore structures of a MOF [17]. The optional chemical indicators cover the total degree of molecular unsaturation (TDU), the metallic percentage (MP), the oxygen–metal ratio (OMR), the nitrogen–oxygen ratio (NOR), the Henry’s coefficient, the electronegative atoms–total atoms ratio (ETR), the weighted electronegativity per atom (WEPA), the number of different constituent atoms (xH, xC, xO, etc.), and so on. These descriptors are widely used in the identification of suitable MOFs for the adsorptive separation/purification of ethane–ethylene gas mixture [18], O2/N2 gas mixture [19], xenon recovery from exhaled anesthetic gas mixture [17] and industrial hydrogen purification [20]. According to the latest technology known to the authors up to now, the calculation of φ as well as Henry’s coefficients can be realized by RASPA package [21], while the rest of the aforementioned structural properties can be computed by Zeo++ software [22]. For the calculation of the remaining chemical descriptors, a MOF chemical feature calculation tool is available (https://github.com/barisoo/MOF-Features). Figure 9.1 The outline of AI-aided high-throughput screening of MOF Materials for Gas Separation. Source: [20]/with permission of Elsevier. The key for MOFs to be high-potential alternatives in various selective gas adsorption and separation processes is their highly tunable structural and chemical features, which endow them flexibility to adapt to different scenarios. Hence, a prescreening procedure based on structural/chemical analysis according to the respective application is considered a preliminary step. Based on the molecular characterization results, structures with PLD less than the kinetic diameter of the targeted molecule and/or VSA = 0 m2 cm−3 are excluded, as they are considered uncompetitive in the targeted adsorptive separation. Subsequently, chemical analysis is performed, and MOFs with the undesired chemical characteristics (e.g. MOFs with rare and/or toxic metals) are identified and removed, since their performance may be low or unpractical in large-scale industrial applications. By performing the prescreening procedure, the MOF candidate pool can be curated to exclude the undesirable structures, and only those with the potential to be high-performing adsorbents are reserved for further study. The distribution of the prescreened candidates in their self-constituted chemical and structural space is analyzed, based on which a small subset of representative MOFs is randomly sampled for later artificial intelligence (AI) model development. For ease of visualization, t-SNE technology [23] can be applied to project the chosen descriptors (structural, chemical, and/or their combination) into 2D maps. As shown in Figure 9.2, the distribution of the randomly sampled MOFs (set A∪B) should be evenly overlapped with that of the overall MOF candidates (set A∪B∪C) so that their representativity can be assured. The same rule applies to the training MOF set (set A) and the test MOF set (set B). In this way, the robustness and effectiveness of the later stage AI model can be guaranteed and enhanced to some extent. There are optional algorithms, such as the Kennard–Stone algorithm, that can be used to facilitate this procedure. For the sampled candidates, molecular simulations are performed to mimic their adsorption behaviors toward the targeted gas mixture. A set of performance evaluation metrics is defined to quantify the adsorption performance. Table 9.1 lists several of the commonly used indicators. Working capacity measures the difference between the uptake amounts of the targeted molecule under the adsorption and the desorption conditions. The greater the working capacity, the more the targeted component can be captured through the process. Adsorption selectivity indicates the degree of affinity of a MOF toward the targeted gas molecule. It is calculated by the ratio of adsorbed gas uptakes of the targeted component and the remaining, normalized by their partial fugacities. It has been proven that a trade-off exists for the working capacity and selectivity of MOF absorbents. Hence, the trade-off between the working capacity and adsorption selectivity is usually adopted to evaluate the performance of a MOF candidate more thoroughly. Regenerability (R%) is another performance indicator that is considered crucial for the MOFs as adsorbents in a gas adsorption process. It is a measurement of the percentage regeneration of the adsorption sites during the desorption of the adsorbed gases, and it is defined as the ratio of working capacity to the gas uptakes of the targeted gas molecule at the adsorption pressure. Figure 9.2 An example of t-SNE maps based on the combination of the structural and chemical descriptors for (a) the randomly selected MOFs and the remaining MOFs and (b) the training and test sets. Source: [2]/with permission of Elsevier. Table 9.1 Performance evaluation metrics. a) Grand canonical Monte Carlo (GCMC) simulations are performed to estimate the gas uptake amounts of the components in an adsorption and desorption process by setting the bulk pressure, temperature, and gas mixture compositions. For the modeling of adsorbates and adsorbents as well as the interactions between them, different settings should be conducted according to the specific applications in order to obtain reliable results. Also, a trade-off should be made while carrying out the GCMC simulation cycles to balance the computational cost and result accuracy. It should be noted that validation of the parameter settings for the GCMC simulations should also be performed by comparing the results from simulations with experiments. By estimating the separation performance (Y, such as APS/TSN, and R%) of all MOFs in datasets A and B, along with the chemical and/or structural descriptors (X), the quantitative structure–property relationships (QSPR) model can be established based on AI technology. This model would effectively correlate the molecular features to their separation performances (X → Y). Various well-established AI algorithms, including random forest regression and artificial neural networks, can be used for the development of the QSPR model. In order to increase the robustness and predictive accuracy of the AI model, feature engineering techniques are sometimes necessary to eliminate insignificant features. Commonly used methods for this purpose include Pearson correlation analysis and the recursive feature elimination algorithm. Besides, hyperparameter tuning is decisive for the predictive accuracy of the developed AI model in certain cases. After the training process, model performance can be properly measured by scoring criteria such as mean absolute error (MAE), root-mean-square error (RMSE), and R2 (Table 9.2). Table 9.2 Evaluation criteria of models. yi and Finally, the best-performing machine learning model developed based on MOF samples (set A∪B) is used to predict the separation performance of the MOFs in the remaining dataset (set C) to perform high-throughput screening for high-performance MOFs. The top MOFs with high predictive separation performances for the targeted gas separation task are identified in this step, for which GCMC simulations are again performed to calibrate their adsorption performance. The final high-performing MOFs with desirable separation capability are determined from the resultant dataset. To gain a deeper understanding of the high-performing MOF adsorbents, it is beneficial to conduct process level studies by simulating the adsorption and desorption processes specific to the targeted separation task. This allows for an examination of the gas recovery rate under various industrial scenarios, providing insights into the practical application potential of the identified MOFs. In practical applications, the presence of impurities in material streams is inevitable, with water being the most common impurity. Therefore, it is essential to investigate the influence of impurities on the separation performance of the adsorbents. Furthermore, practical factors such as temperature and pressure can be manipulated to affect the adsorbent’s separation performance. Considering the fluctuating nature of inlet gas composition during production, it is also important to assess the flexibility of the adsorbent in industrial practice by investigating its separation performance under different inlet gas concentrations. The merit of computer-aided material discovery is that a rich molecular space can be explored at an affordable cost. However, in the majority of the cases, the existing molecular space composed of the known molecules synthesized by experiments and/or assembled by algorithms targeting other applications is still rather restricted. For example, Figure 9.3 presents the statistical analysis for the diversity of the MOFs in four of the representative databases, covering CoRE, ToBaCCo, hMOF, and BW-DB. As can be seen, the chemical elements as well as the topological net covered by these databases are limited, especially in the case of ToBaCCo and hMOF. Moreover, as mentioned at the beginning of this chapter, the most attractive aspect of MOFs is that their tunable pore structure and the chemical microenvironments allow them to be tailored for different applications. Hence, it can be beneficial if directed structural design can be achieved based on a statistical analysis of the MOFs’ characteristics with high separation potential. Figure 9.3 Diversity analysis of the MOF databases. Source: [2]/with permission of Elsevier. As commonly understood, a MOF consists of three essential components: metal nodes, organic linkers, and a matching topology net. Based on this understanding, three design strategies can be applied accordingly: substitution of the metal node, regulation of the topology net, and adjustment of the organic linker. Figure 9.4a and b show the adsorption performance of a series of MOF analogs with the same topology and organic linker but different metal nodes. Despite having a similar LCD, these MOFs exhibit varying adsorption behaviors, indicating that substituting the metal node can enhance the separation performance of a MOF to some extent. Our previous study [17] also revealed that the substitution of the metal node slightly tunes the largest pore size, resulting in improvements in working capacity and selectivity. Figure 9.4 Three design strategies for new MOF structure. Source: [17]/with permission of Elsevier. Pore size and shape are important factors that influence the adsorption performance of MOFs, which can be tailored by altering the organic linker. Figure 9.4c shows that the adsorption performance can be improved by adjusting the organic linker. Clues about the pros and cons of the organic linkers toward different guest molecules can be derived via expert knowledge or analysis of the behavior of relative candidates. For example, in a study by Cheng et al. [17], it was observed that substituting the aliphatic linker with an aromatic linker significantly enhanced the adsorption separation of Xe from an exhaled gas mixture. This finding aligns with expert knowledge, as MOFs with aromatic rings offer more adsorption sites and thus exhibit a stronger affinity for the targeted Xe molecule. Topology is another factor affecting the pore geometry of MOFs. Regulating the topology of a MOF was proven to be an effective strategy for the enhancement of separation performance in several applications [19, 24]. Figure 9.4d illustrates four different topology nets assembled by Zn and an aromatic linker. As can be seen, despite the identical building blocks, the pore sizes of these four MOFs can be adjusted by regulating their topology nets, thereby improving separation performance. This section exemplifies the application of the AI-aided high-throughput screening of MOF materials for adsorptive gas separation with a case study. In industry, the separation/purification of hydrogen from methane impurities is of significant importance, especially in light of carbon dioxide mitigation toward carbon neutrality. Adsorption separation is an effective route for this application regarding energy cost and separation efficiency, for which the selection of adsorbents is the key. The CoRE-MOF 2019 database is employed as the starting point for this case. Firstly, the structural/chemical analysis-based prescreening is performed. LCD, PLD, VSA, ρ, and φ are chosen as the structural descriptors and calculated to feature each MOF. Based on the result, structures with PLD less than the kinetic diameter of CH4 (3.8 Å) and with rare and/or toxic metals are excluded. This procedure shortlisted 5096 candidates out of the original 12 020 MOFs. Subsequently, Pearson correlation analysis is performed on the five structural descriptors to reveal the correlations. The result in Figure 9.5 suggests that the correlation between LCD and VSA is the weakest, as the calculated coefficient between these two gives the smallest. Hence, these two are chosen as the structural descriptors for the structure–property relationship analysis. Figure 9.5 Correlations of various structural features for 5096 CoRE-MOFs. Source: [20]/with permission of Elsevier. Two hundred MOFs are randomly sampled from the 5096 MOF candidates, for which GCMC simulations are conducted to study their adsorption behaviors toward CH4/H2 mixture. On this basis, the structure-performance relationship is analyzed to study how the adsorbent performance of the MOFs varies with their structural features. Figure 9.6 gives the relationship plot between LCD and VSA at different APS of the 200 sampled MOFs. As shown, MOFs with high APS values (APS ≥ 150 mol kg−1) exist in the region where VSA value falls into the range of 600–1800 m2 cm−3 and LCD value ranges from 4 to 11 Å. Therefore, two screening criteria for high-performing MOFs are derived, namely, 4 ≤ LCD ≤ 11 Å and 600 ≤ VSA ≤ 1800 m2 cm−3. With the new screening criteria, the 5096 resultant candidates from the prescreening are further filtered, resulting in a subset of 2408 MOFs with the desired structural properties. The adsorption performance of the 2408 CoRE-MOFs toward CH4/H2 gas mixture is then evaluated based on GCMC simulation, and the corresponding performance metrics ( Figure 9.6 Relationship plots of LCD versus VSA of the 200 sampled CoRE-MOFs, color-coded with adsorbent performance score. Source: [20]/with permission of Elsevier. Figure 9.7 (a) Selectivity of the screened MOFs as a function of their working capacity, color-coded with APS; (b) Regenerability of the screened MOFs as a function of APS. Source: [20]/with permission of Elsevier. Table 9.3 The detailed information on the nine promising CoRE-MOFs. OMS: Open metal site. Rk: Ratio of Henry’s coefficients of H2O and CH4. Relationships between the calculated separation performance of the 2408 CoRE-MOFs and the corresponding geometric characteristics are visualized in Figure 9.8. Figure 9.8a gives the relationship Further, the influence of the types of metal sites is also investigated. Figure 9.9a gives the proportion of metals in all 2408 CoRE-MOFs, in which 13 types of metals appear more than 20 times. Among them, Zn is the most observed metal site, followed by Cd, Cu, Co, Mn, and Ni, accounting for more than 5%. It can also be seen in Figure 9.9b that Zn, Cu, and Co appear more frequently in the desired MOF category than in all CoRE-MOFs. Particularly, structures with Cu sites have the highest probability of possessing both high APS and R%. Furthermore, the structural properties of the CoRE-MOFs containing Zn, Cd, Cu, Co, Mn, and Ni were analyzed, as visualized in Figure 9.9c. It can be seen that, from a statistical point of view, the pore sizes (LCD and PLD) of the MOFs are positively correlated with the atomic radii of the metal sites (Zn > Cu > Co). It is more likely for Cu to form “preferable” pores with ligands for CH4/H2 separation (approximately 5 and 7 Å for PLD and LCD, respectively). This also agrees well with the findings from He et al. [34]. Notice that the pore sizes of most of the MOFs with Cd (the largest atom among the six) are relatively low. It is conjectured that this may be owing to the deformation of large pores. Statistical analysis for Mn and Ni shows slight deviations, probably because of the insufficient sample. Figure 9.8 Relationship plots of (a) selectivity versus PLD, color-coded with LCD, (b) working capacity versus ρ, color-coded with φ, (c) selectivity versus Henry’s coefficient of CH4, color-coded with working capacity, and (d) regenerability versus Henry’s coefficient of CH4, color-coded with adsorbent performance score, for 2408 CoRE-MOFs. Source: [20]/with permission of Elsevier. Humidity In industrial scenarios, the presence of impurity in the material streams is inevitable; hence, it is of practical importance to study its influence on the adsorbents’ separation performance. Among others, water is the most common impurity in practice. Figure 9.10 plots the calculated APS values of nine promising CoRE-MOFs facing various water content in the gas mixture stream. Meanwhile, the ratio of Henry’s coefficients, Rk (Rk = Figure 9.9 (a) Proportion of metals in 2408 CoRE-MOFs. Metals that appear more than 20 times are displayed. (b) Proportion of Zn, Cd, Cu, Co, Mn, and Ni in the categories of MOFs with different adsorption behaviors and in all CoRE-MOFs. (c) Box plots and distribution for LCD and PLD of MOFs with Zn, Cd, Cu, Co, Mn, and Ni. Source: [20]/with permission of Elsevier. Figure 9.10 Adsorbent performance score of the nine promising CoRE-MOFs under different humidity conditions. The saturation pressure of water is 4.24 kPa. Source: [20]/with permission of Elsevier. Table 9.4 Separation performance comparison of the top CoRE-MOFs under different operation condition settings [20]. Original operation conditions: adsorption and desorption conditions are (303 K, 10 bar) and (303 K, 1 bar), respectively. Adjusted operation conditions: adsorption and desorption conditions are (293 K, 10 bar) and (313 K, 1 bar), respectively. Figure 9.11 shows the distributions of adsorbed CH4 and H2O in the MOFs with refcodes TAKTAD, CUYWUP, and DIDBEZ at 0%, 20%, and 100% humidity, and the subgraphs represent radial distribution functions of corresponding atom pairs of framework atoms with adsorbate. As can be seen in Figure 9.11a, in the dry structure, CH4 molecules are confined within the pores by the framework. At 20% humidity, H2O molecules introduced into the structure are preferentially adsorbed near the hydrophilic sites on the framework, such as hydroxyl groups, as the first atomic pair peak belongs to the atom pairs of O with H2O, and quickly occupies the adsorbing sites of CH4. Interestingly, in Figure 9.11b, the MOF with refcode CUYWUP can contain a considerable number of CH4 molecules when the humidity is low, even though its Rk is much larger than one. It can be attributed to the different adsorption sites of CH4 and H2O. The water molecules first adsorb near the open Cu sites of the structure (the first atomic pair peak belongs to the atom pairs of Cu with H2O), while the CH4 molecules are preferentially adsorbed near the framework atoms. Yet as the humidity increases, H2O takes up more space, and thus CH4 molecules are excluded from the structure. As for the MOF with refcode DIDBEZ in Figure 9.11c, there is almost no H2O molecule adsorbed in the structure even at 100% humidity. Operation Temperature and Inlet Gas Composition Temperature is a practical factor that can be manipulated to affect the separation performance of an adsorbent. Adsorption behaviors of the nine promising CoRE-MOFs were simulated under various temperatures (293, 298, 303, 308, and 313 K), and the results are illustrated in Figure 9.12. It is observed that low temperatures are beneficial for adsorption but unfavorable for the regeneration of MOFs. The flexibility of the adsorbent in industrial practice is another concern, as the inlet gas composition may fluctuate during production. To this end, the separation performance of top CoRE-MOFs under different inlet CH4 concentrations (30%, 40%, 50%, and 60%) is simulated, as shown in Figure 9.13. It can be seen that the APS values of most MOFs increase when CH4 concentration rises from 30% to 40%; as the concentration continues to increase, the APS values tend to be stable. On the other hand, the regenerability drops below 80% when CH4 concentration increases to 50%, which is unfavorable from an economic perspective. Based on the findings from the temperature investigation, this may be remediable by temperature manipulation. To guide practical usage, the separation performance of the nine promising CoRE-MOFs is further examined under various operation conditions based on GCMC simulation. Apart from the original inlet gas molar ratio of 0.3/0.7 for CH4/H2, two more scenarios were considered, i.e. 0.5/0.5 and 0.6/0.4. Two different temperature and pressure settings for adsorption and desorption were investigated. The first is (303 K, 10 bar) for adsorption and (303 K, 1 bar) for desorption, which is the same as the original operation condition, while the other is (293 K, 10 bar) for adsorption and (313 K, 1 bar) for desorption, regarded as an adjusted operation condition. Simulation results are listed in Table 9.3. As can be seen, for the molar ratio of 0.3/0.7, the adjusted APS and regenerability are increased by more than 37% and 6%, respectively. It is worth noting that when the inlet CH4 concentration is 50% or 60%, not only the APS values are enhanced, but also the regeneration of most MOFs recovers to satisfactory values by regulating the adsorption and desorption temperatures. Figure 9.11 (Left panel) CH4 distribution at 0% humidity; (middle panel) CH4 (top) and H2O (bottom) distributions at 20% of humidity; (right panel) CH4 (top) and H2O (bottom) distributions at 100% humidity in the MOFs with refcodes (a) TAKTAD, (b) CUYWUP and (c) DIDBEZ. The subgraph represents the radial distribution functions of different atom pairs between the framework atoms and CH4 (H2O). Source: [20]/with permission of Elsevier. Figure 9.12 (a) Adsorbent performance score and (b) regenerability of the nine promising CoRE-MOFs under different operation temperatures. Source: [20]/with permission of Elsevier. Figure 9.13 (a) Adsorbent performance score and (b) regenerability of the nine promising CoRE-MOFs under different operation temperatures. Source: [20]/with permission of Elsevier. In this chapter, we introduce an AI-aided high-throughput screening and optimistic design of MOF materials for adsorptive gas separation. MOFs free of rare and/or toxic metals and MOFs uncompetitive in the targeted separation task are first excluded by a prescreening procedure. This is followed by a molecular simulation and machine learning coupled analysis for small sampled MOFs to acquire QSPR. Based on the obtained QSPR model, MOFs with the potential to perform well in the targeted application can be identified, and hence the candidates are further narrowed down. Then, rigorous molecular simulation is employed to assess the separation performances of these MOFs. Based on the result, top-performing MOFs are identified. Additionally, the impact of practical factors, such as humidity, operation temperature, and inlet gas composition, on the performance of the selected adsorbents in practice can be explored.
9
AI-Aided High-Throughput Screening and Optimistic Design of MOF Materials for Adsorptive Gas Separation
9.1 Introduction
9.2 Methodology
9.2.1 Molecular Level Simulation and Screening Driven by Rigorous Molecular Simulation and Machine Learning
9.2.1.1 Molecular Characterization
9.2.1.2 Structural/Chemical Analysis-Based Prescreening
9.2.1.3 Diversity Analysis and Dataset Splitting
9.2.1.4 Molecular Simulation and Performance Evaluation Metrics
Metrics
Formulaa)
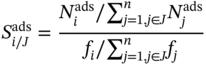
Selectivity
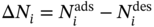
Working capacity
Trade-off between working capacity and selectivity
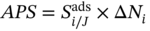
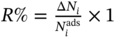
Regenerability
 00%
00%
 : gravimetric uptakes for the targeted component i at adsorption/desorption conditions; j, the nontarget component; f: fugacity in gas mixture.
9.2.1.5 AI-Aided Quantitative Structure–Property Relationship Development and Rapid Screening
Evaluation criterion
Formula
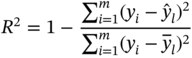
Determination coefficient
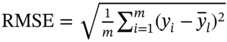
Root-mean-square error
Mean absolute error
 represent the simulated and predicted performance values of the ith structure in the MOF database, respectively.
  represents the mean of the simulated performance values of all the MOFs, and m is the number of MOFs.
9.2.1.6 Process Level Simulation
9.2.1.7 Reverse Molecular Design
9.3 Case Studies
9.3.1 High-Throughput Screening of Metal–Organic Frameworks for Hydrogen Purification
9.3.1.1 Prescreening
9.3.1.2 Rapid Screening
9.3.1.3 Rigorous Validation
 ,
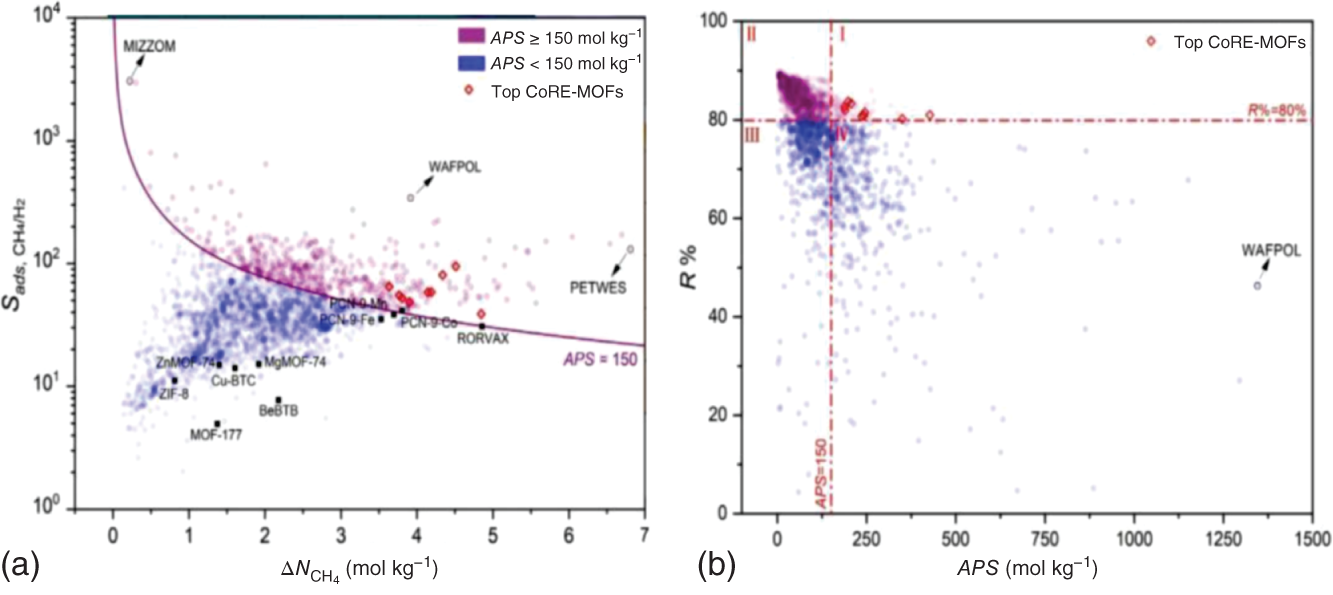
,  , APS, ΔQ, and R%) are obtained to sort the separation performance of MOFs. The adsorption performance of the 2408 CoRE-MOFs is illustrated in Figure 9.7a. The horizontal and vertical axes give the simulated working capacity and CH4-selectivity respectively, while the APS is color-coded. The blue dots denote MOFs with APS values lower than 150 mol kg−1, while the purple ones distributed on the top-right side of the purple line are the ones with APS values equal to or larger than 150 mol kg−1. A wide distribution of selectivity is observed among MOFs, with values ranging from 2 to 26 724. The majority of MOFs fall within the range of 20–100. Similarly, the working capacity of MOFs varies significantly, from 0.08 to 6.80 mol kg−1, and the majority fall within the range of 1–3 mol kg−1. Within this diverse distribution, it is possible to identify MOFs that exhibit both high selectivity and working capacity. For example, a MOF with refcode MIZZOM possesses a high theoretical selectivity of 3028, but its working capacity is quite low, 0.22 mol kg−1. On the other hand, a MOF with refcode PETWES exhibits a high working capacity of 6.80 mol kg−1, while the corresponding selectivity is relatively low, which is 131. This reveals the widely proved trade-off between MOFs’ selectivity and working capacity. Therefore, one may infer that a desirable MOF candidate with both high selectivity and working selectivity should be located in the middle of the purple area. Following this clue, a MOF with refcode WAFPOL comes into the spotlight for its well-balanced working capacity and selectivity, yet its suitability needs to be further examined by more practical factors affecting its performance in industrial applications. In practice, regenerability is another important factor that needs to be considered. The R% of the 2408 CoRE-MOFs is presented in Figure 9.7b. Generally speaking, a preferable adsorbent material should have regenerability not lower than 80%. As shown, two auxiliary lines with regenerability equal to 80% and APS equal to 150 mol kg−1 are drawn, dividing the space into four quadrants. In the fourth quadrant, where MOFs with high APS but low regenerability are gathered, the MOF with refcode WAFPOL is found. It turns out that its regenerability is quite low (R% = 46%), which makes it unsuitable for practical applications. MOFs with desirable separation performance are distributed in the first quadrant, where both high APS and regenerability can be provided. The candidates with R% ≥ 80% are ranked by their APS values, and the practicability of the top-ranked MOFs is investigated by tracing the corresponding experimental data in the literature, and the MOFs that have been tested for gas adsorption are selected; then, nine promising CoRE-MOFs toward CH4/H2 separation are identified, as visualized by red diamonds in Figure 9.7. Table 9.3 lists the detailed information about them. The stability of the top performers is further examined in the literature. The MOF with refcode DAFJOM has been tested to be chemically stable under 75% humidity at ambient temperature [25], while the MOF with refcode JALCAD exhibited outstanding thermal stability and high tolerance to water vapor [26]. The remaining seven proved to be thermally stable at a high temperature of up to 400 K [27–32].
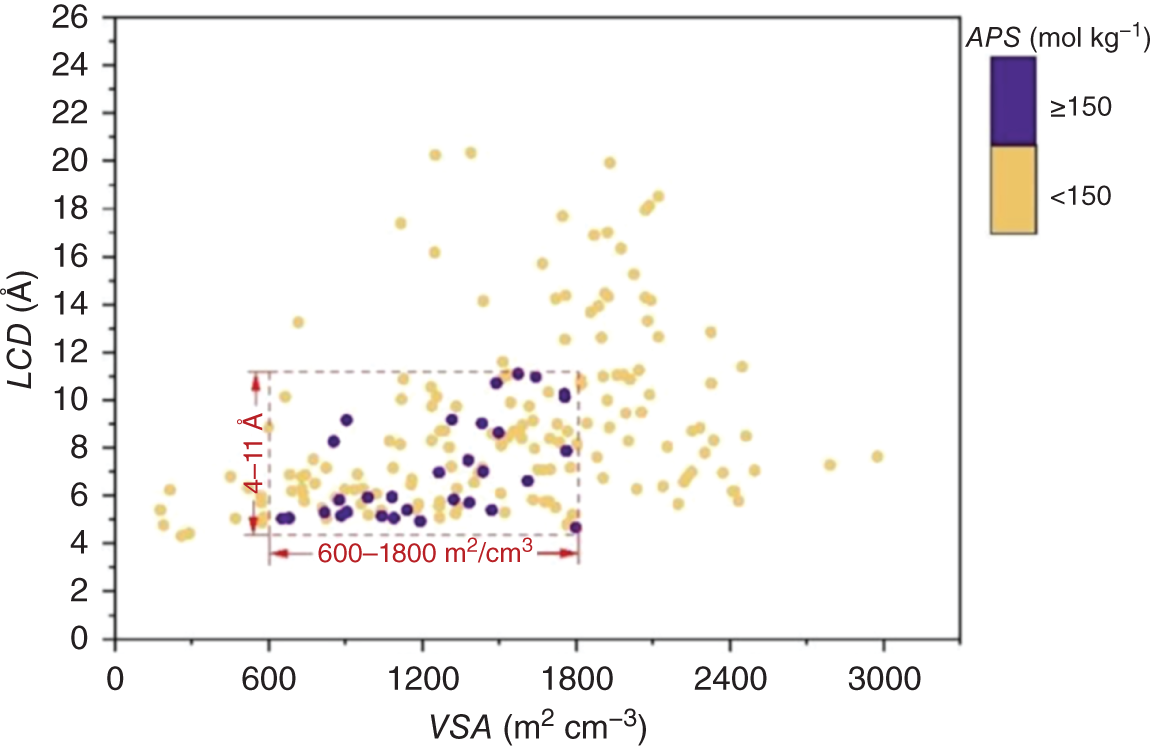
MOF refcodes

 (mol kg−1)
APS (mol kg−1)
R%
Metal
Has OMS
Rk
TAKTAD
94.75
4.51
427.39
80.97
Ga
No
6.00 × 10³
XILLEL
80.61
4.34
349.74
80.20
Zn
No
0.10
CUYWUP
58.47
4.19
244.87
81.54
Cu
Yes
24.68
DAFJOM
58.36
4.14
241.66
80.90
Mg
No
1.48
SETDUS
64.80
3.63
235.40
80.71
Cu
Yes
101.90
KUKPUD
54.94
3.76
206.85
83.34
Cu
Yes
108.44
DIDBEZ
52.04
3.81
198.09
83.71
Co
No
0.15
SOZHOG
48.59
3.90
189.48
81.94
Cu
No
0.18
JALCAD
38.81
4.84
188.03
82.66
Al
Yes
3.98 × 10⁵
9.3.1.4 Structure–Property Relationship Analysis
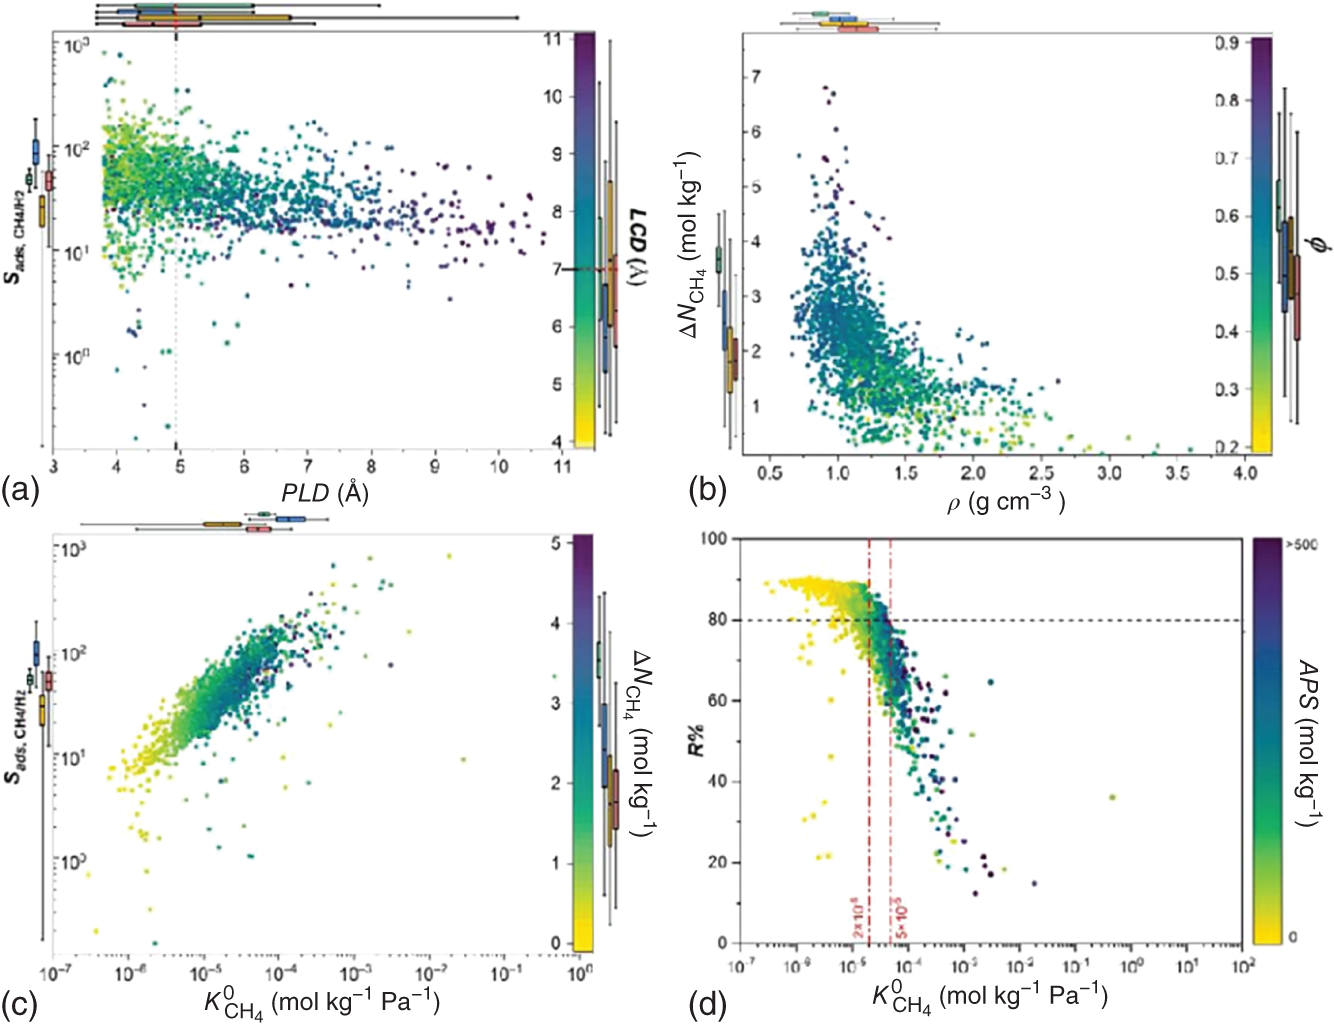
 ∼ PLD at different LCD. It can be seen that, generally, with increasing PLD or LCD, a lower selectivity is observed; meanwhile, a MOF with a larger PLD tends to have a larger LCD. This implies that a MOF with a more compact pore size is more preferential for selective adsorption of CH4 over H2; nevertheless, the corresponding regenerability gets hindered. It can be seen that a MOF with PLD around 5 Å and LCD near 7 Å is preferable. This finding is consistent with the observations from Altintas et al. [33]. Figure 9.8b plots the relationship
  ∼ ρ at different φ. With increasing density, the working capacity seems to decrease; and a high density usually corresponds to low porosity. Apparently, it is more likely for MOFs with higher porosity to possess higher working capacity, as they contain more space available for adsorption. Figure 9.8c presents the relationship
  ∼
∼  at different
  . It is shown that Henry’s coefficient of CH4 is another important factor that affects the selectivity of a MOF. A higher Henry’s coefficient means a stronger affinity of the MOF toward CH4, resulting in a higher selectivity. Yet too strong an affinity between the adsorbent and adsorbate may pose difficulties for its regeneration, as shown in Figure 9.8d.
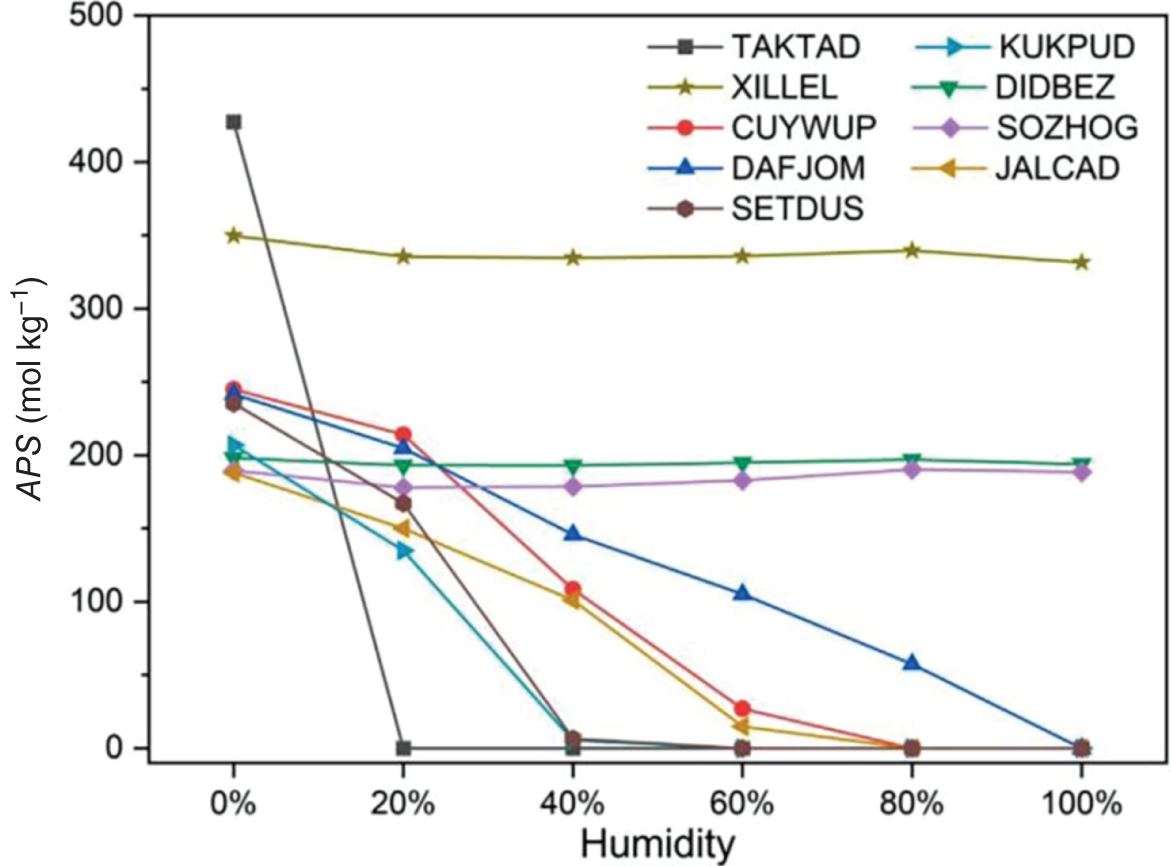
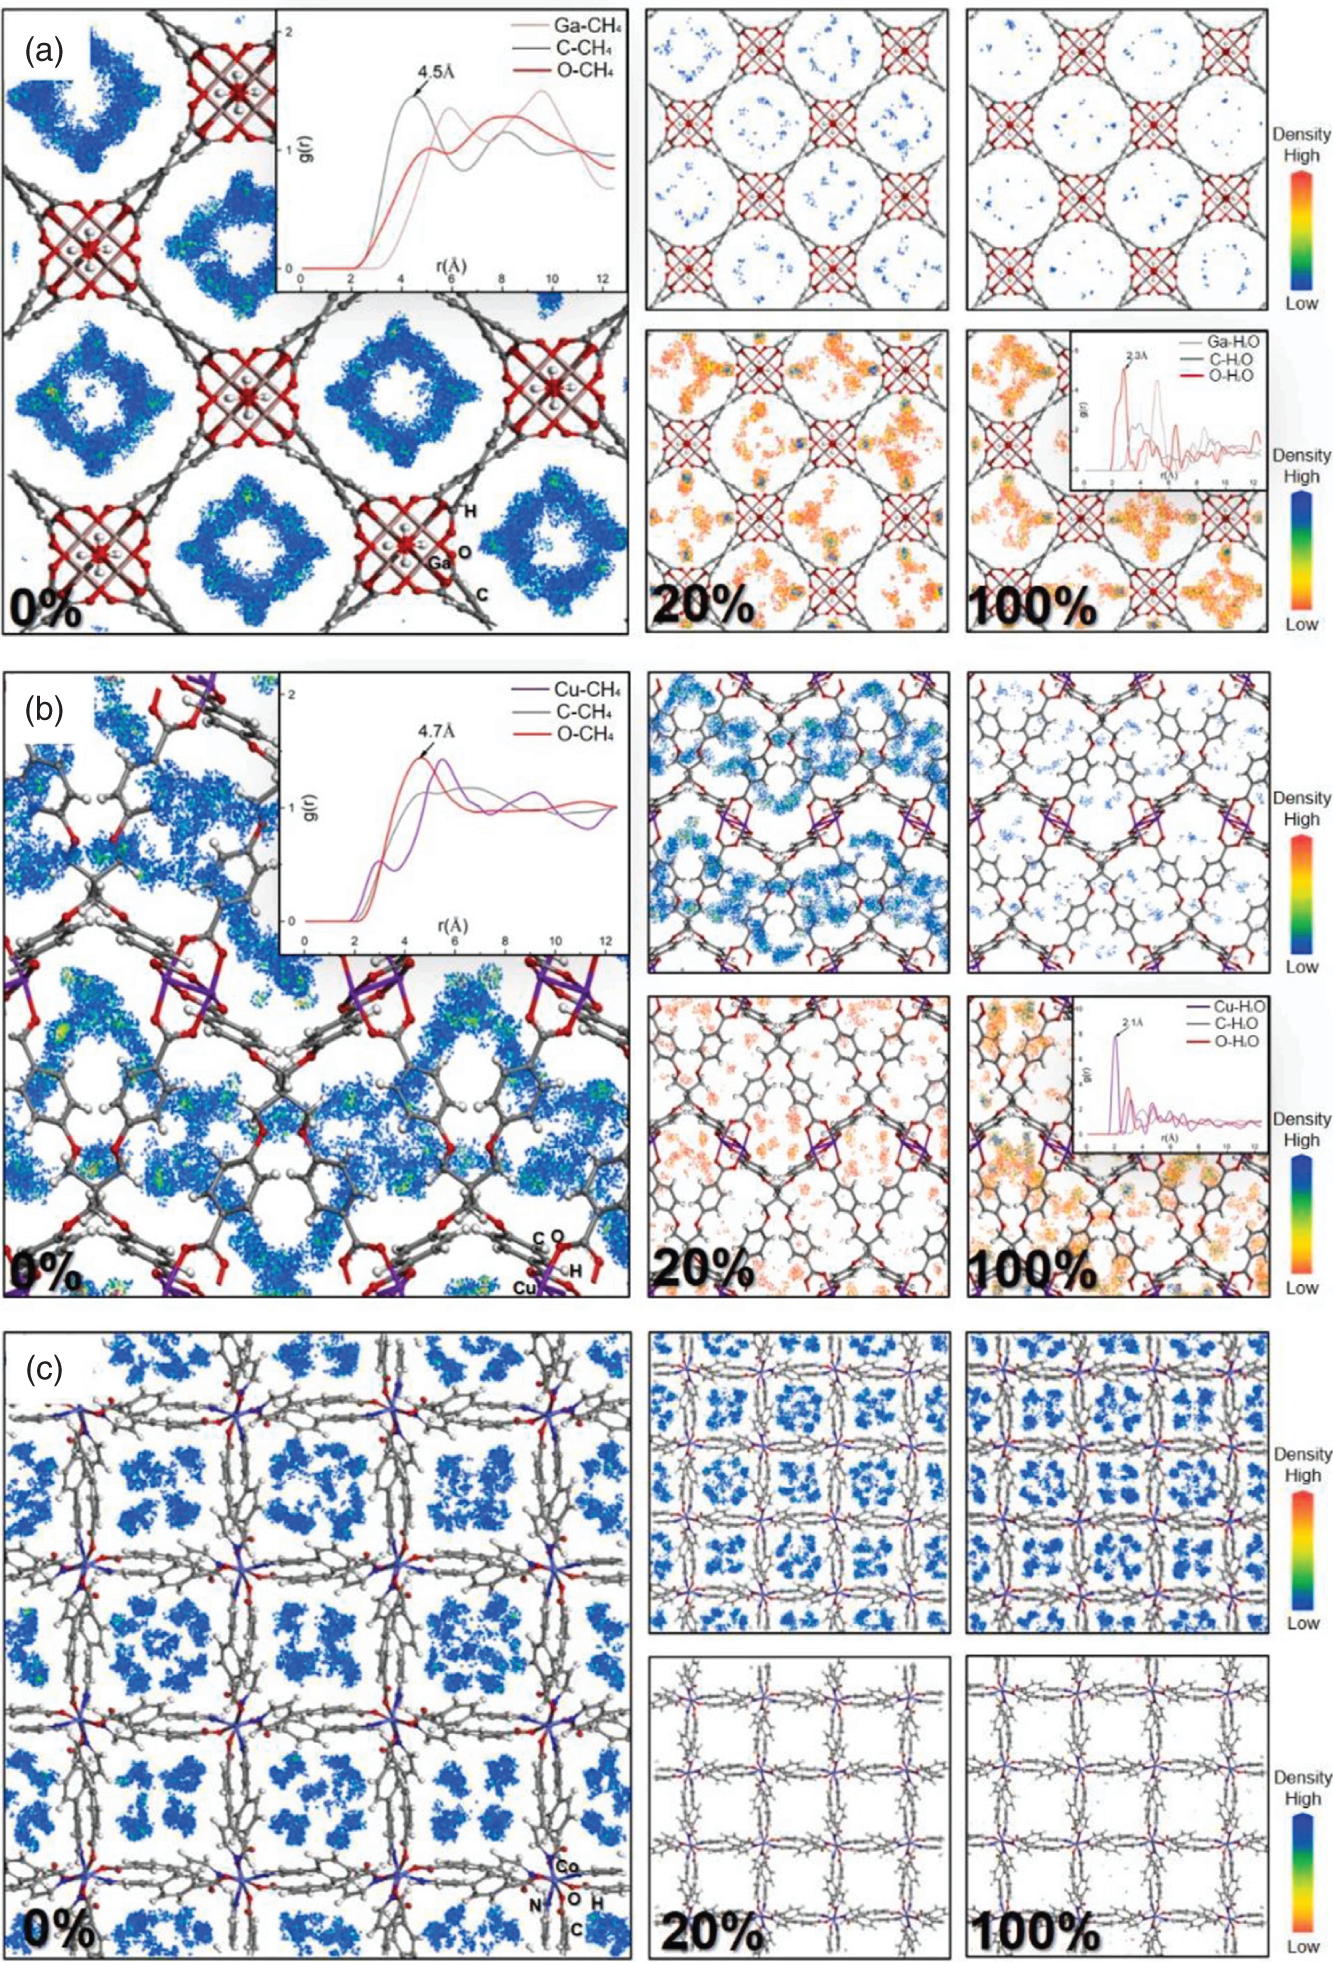
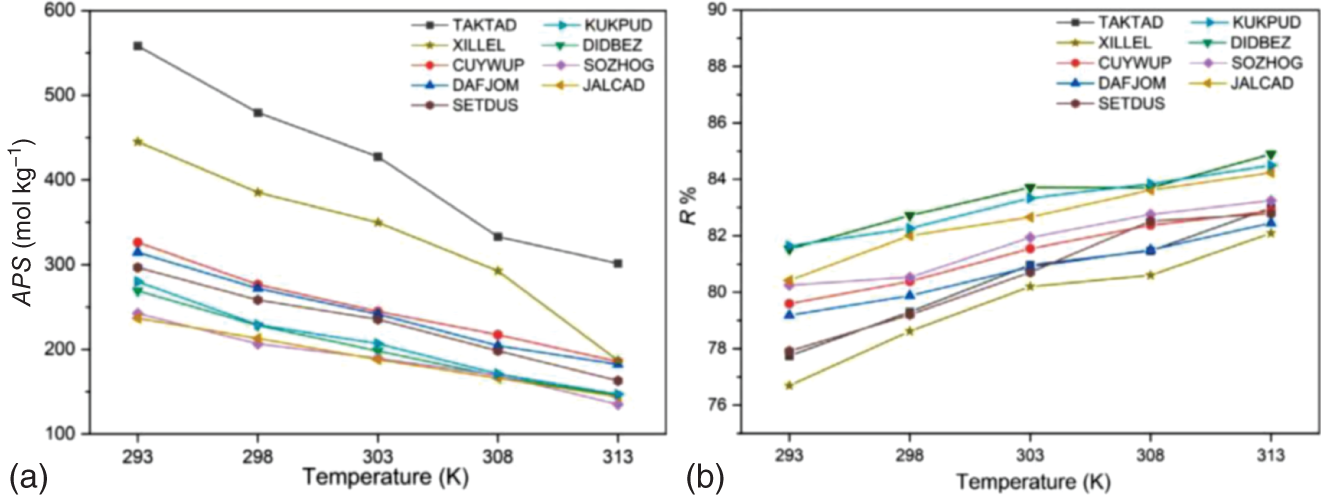
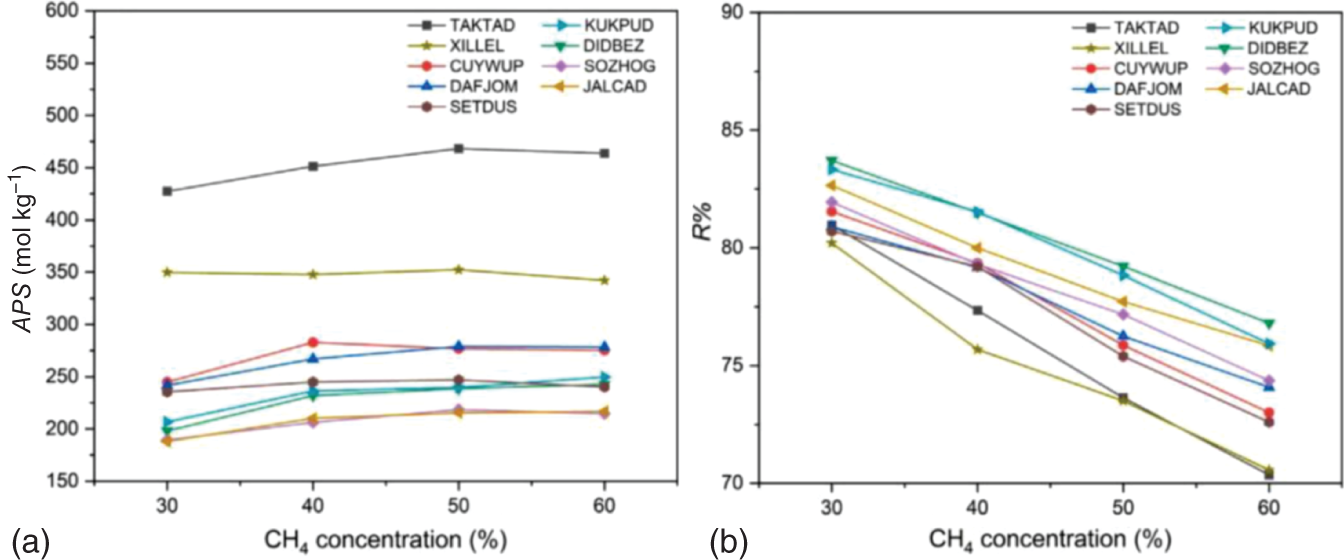
9.3.1.5 Investigation on Practical Factors
 /
/ ), is also given in Table 9.4, indicating the relative magnitude of affinity of the MOFs toward H2O and CH4. When the value of Rk is more than 1, the MOF has a stronger affinity toward H2O; on the contrary, it is more inclined to adsorb CH4. For MOFs with refcodes XILLEL, DIDBEZ, and SOZHOG with Rk < 1, no significant deterioration in separation performance is observed. At the same time, these MOFs maintain a high regeneration capacity (R% are 80%, 83%, and 82%, respectively) when the humidity reaches 100%. On the other hand, it is observed that some MOFs offer Rk > 1, and they possess exposed OMSs and/or hydrophilic sites that may form strong interactions with water [35, 36]. Yet these adsorbents have different sensitivities to water. For MOFs with refcodes TAKTAD, SETDUS, and KUKPUD, their tolerance to water is quite low, as the corresponding APS quickly deteriorates to zero. While the MOFs with refcodes CUYWUP, DAFJOM, and JALCAD maintain a relatively gradual decrease with increasing gas humidity, eventually dropping to almost zero when the gas mixture’s humidity is over 80%.
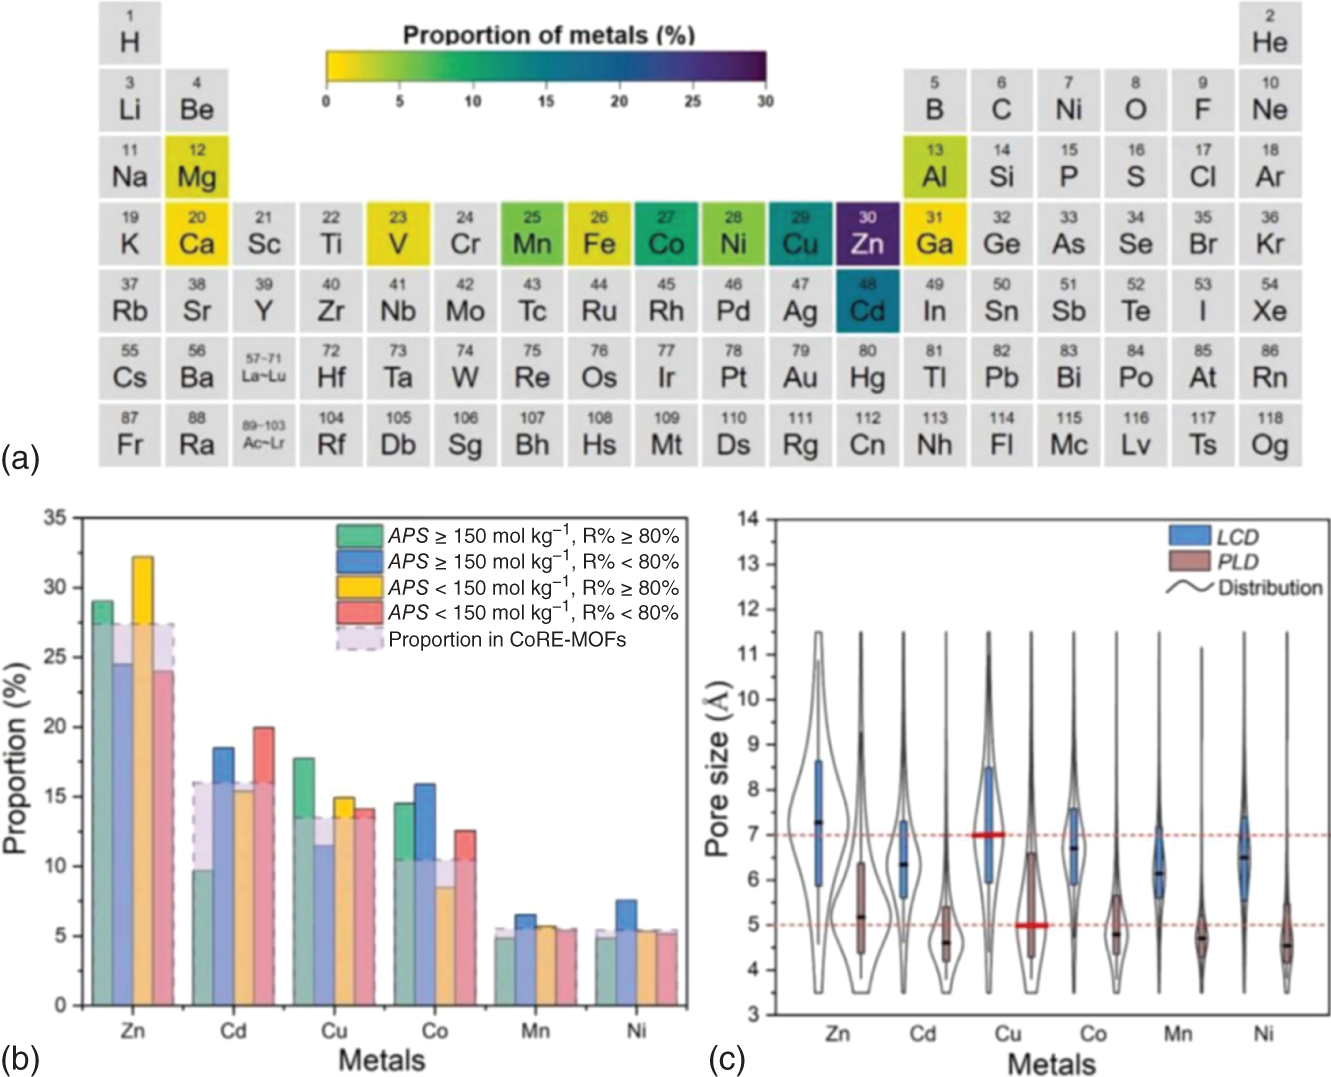
Original operation condition
Original operation condition
CH4/H2 = 0.3/0.7
CH4/H2 = 0.5/0.5
CH4/H2 = 0.6/0.4
CH4/H2 = 0.3/0.7
CH4/H2 = 0.5/0.5
CH4/H2 = 0.6/0.4
MOFs
APS (mol kg−1)
R%
APS (mol kg−1)
R%
APS (mol kg−1)
R%
APS (mol kg−1)
R%
APS (mol kg−1)
R%
APS (mol kg−1)
R%
TAKTAD
427.39
80.97
468.35
73.63
463.79
70.36
620.38
86.4
666.44
80.96
680.98
78.2
XILLEL
349.74
80.2
352.34
73.5
342.19
70.56
499.84
86.13
491.62
80.34
469.52
78.55
CUYWUP
244.87
81.54
272.87
75.86
275.28
73
356.05
86.86
387.09
82.8
370.09
80.99
DAFJOM
241.66
80.9
278.96
76.25
278.4
74.07
344.05
86.64
393.83
82.25
406.51
81.38
SETDUS
235.4
80.71
246.91
75.39
245.16
72.6
331.73
87.11
324.75
82.33
321.43
80.96
KUKPUD
206.85
83.34
239.61
78.83
249.76
75.93
304.32
88.72
334.54
84.84
322.7
82.89
DIDBEZ
198.09
83.71
238.61
79.22
242.51
76.8
293.22
88.8
330.52
85.09
349.32
83.16
SOZHOG
189.48
81.94
218.45
77.17
214.73
74.36
264.64
87.61
288.49
82.89
289.24
81.19
JALCAD
188.03
82.66
215.48
77.72
216.85
75.85
259.13
87.99
306.38
84.08
295.59
82.31
9.4 Conclusions
References