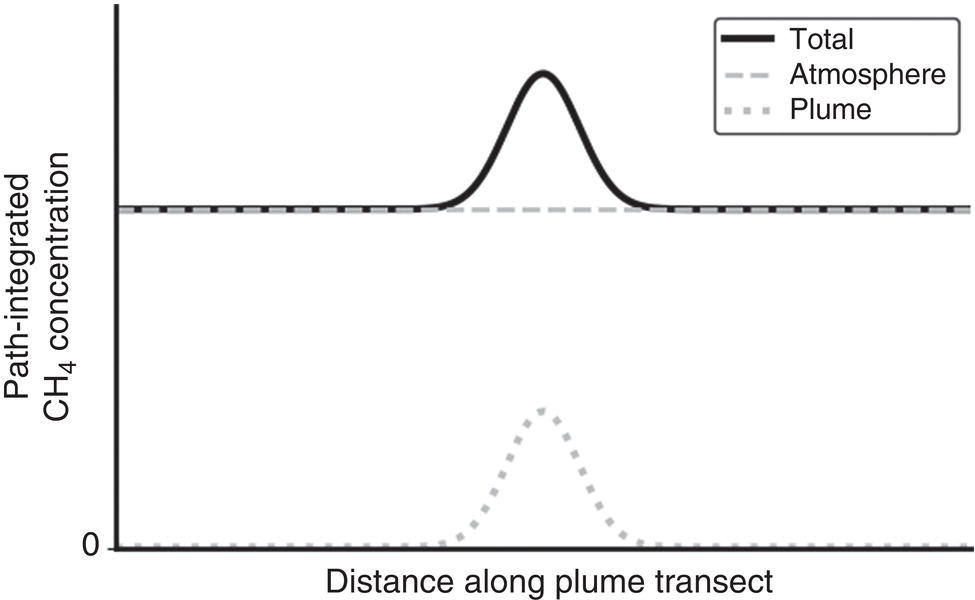
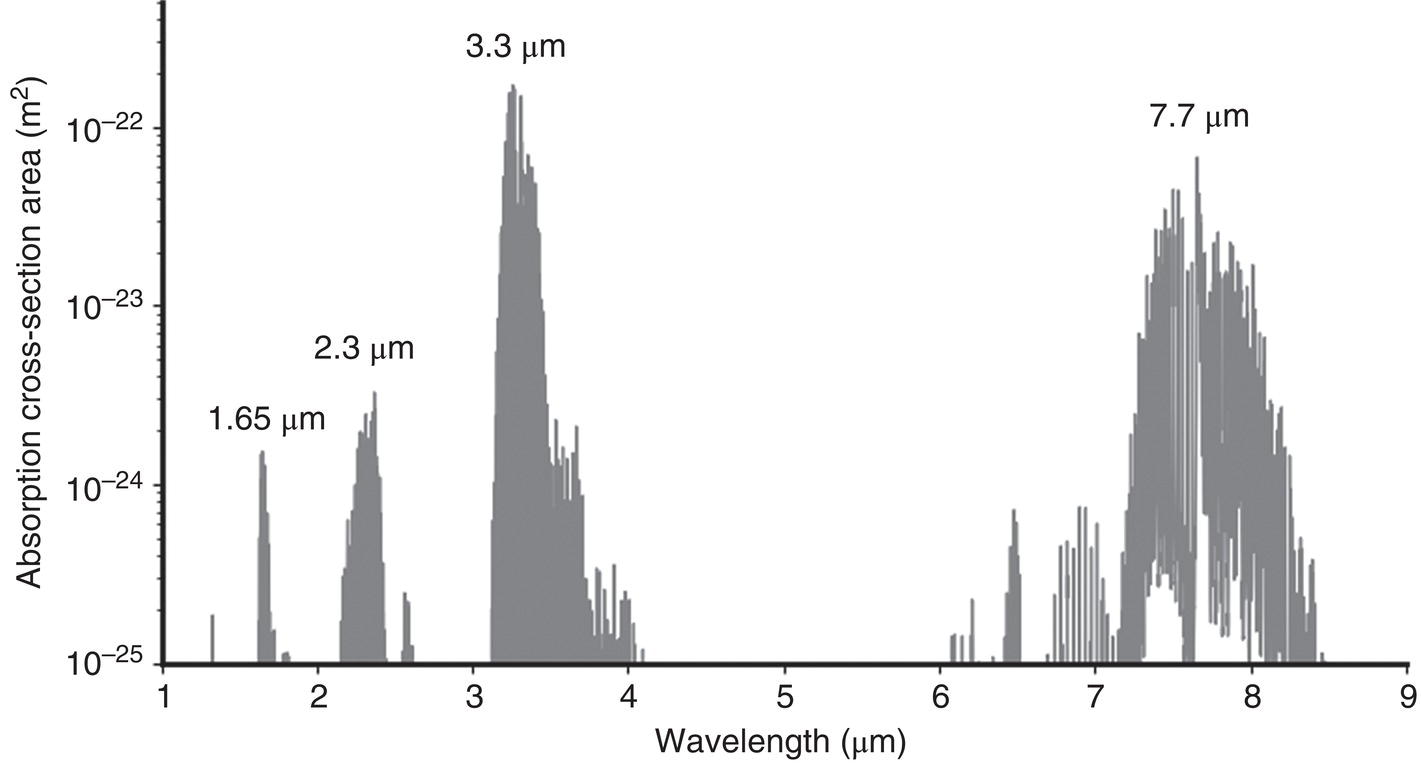
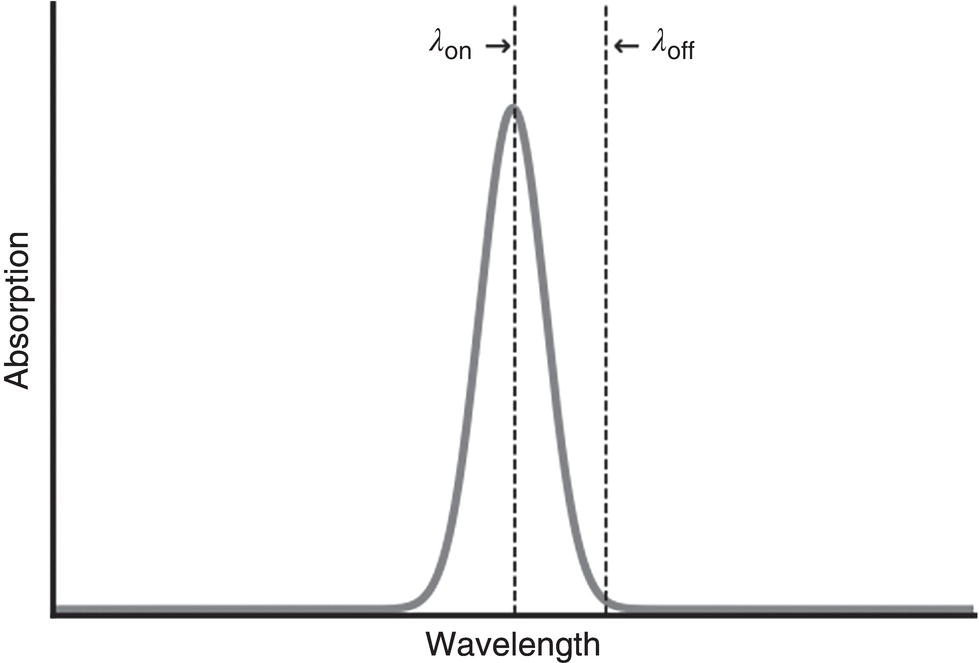
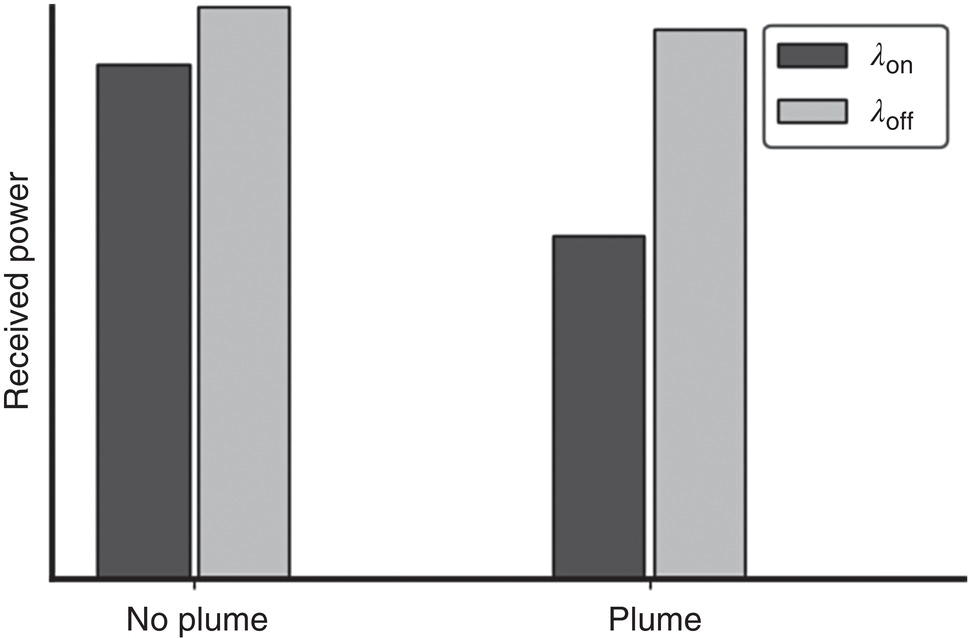
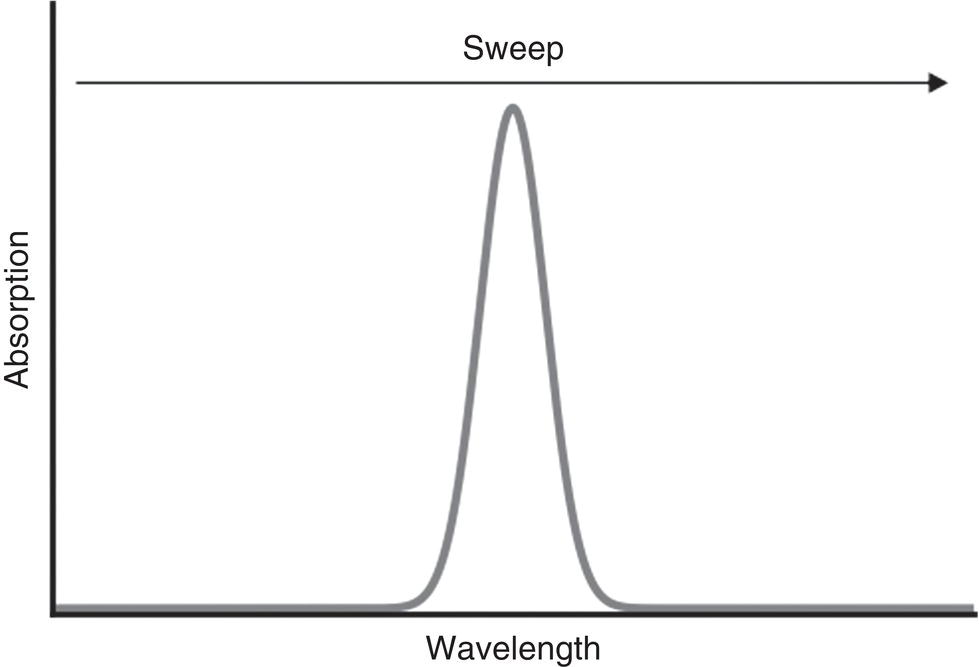
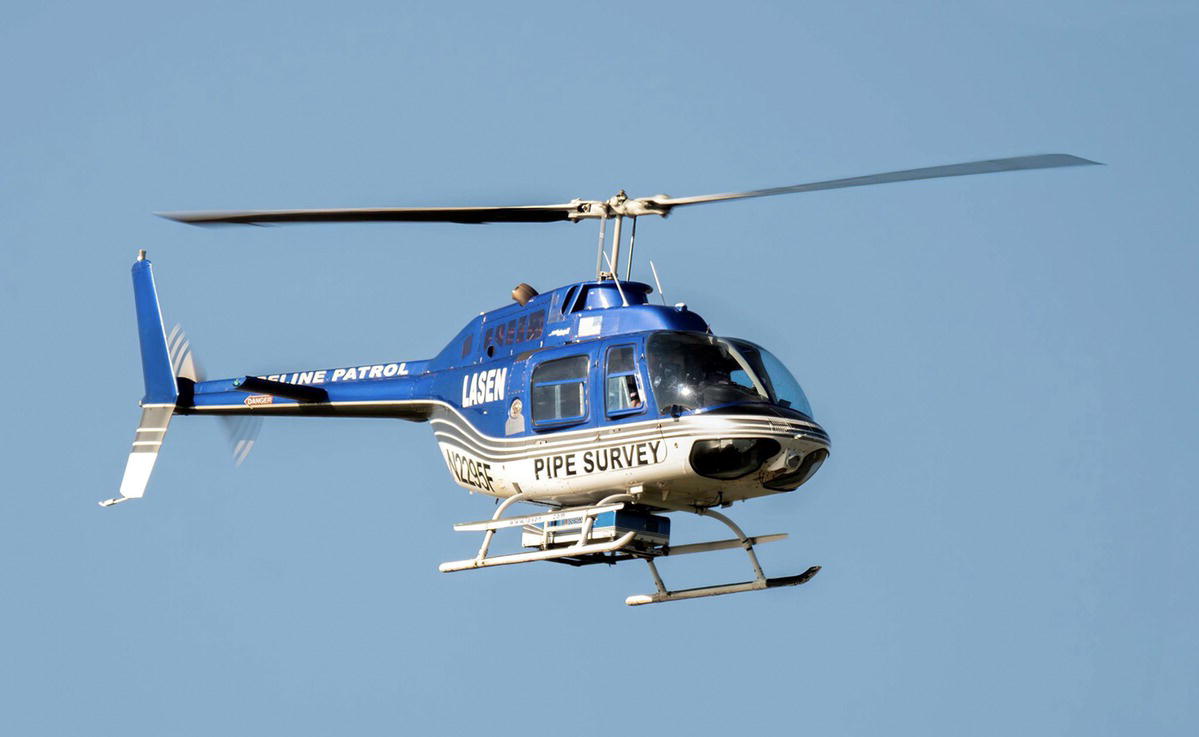
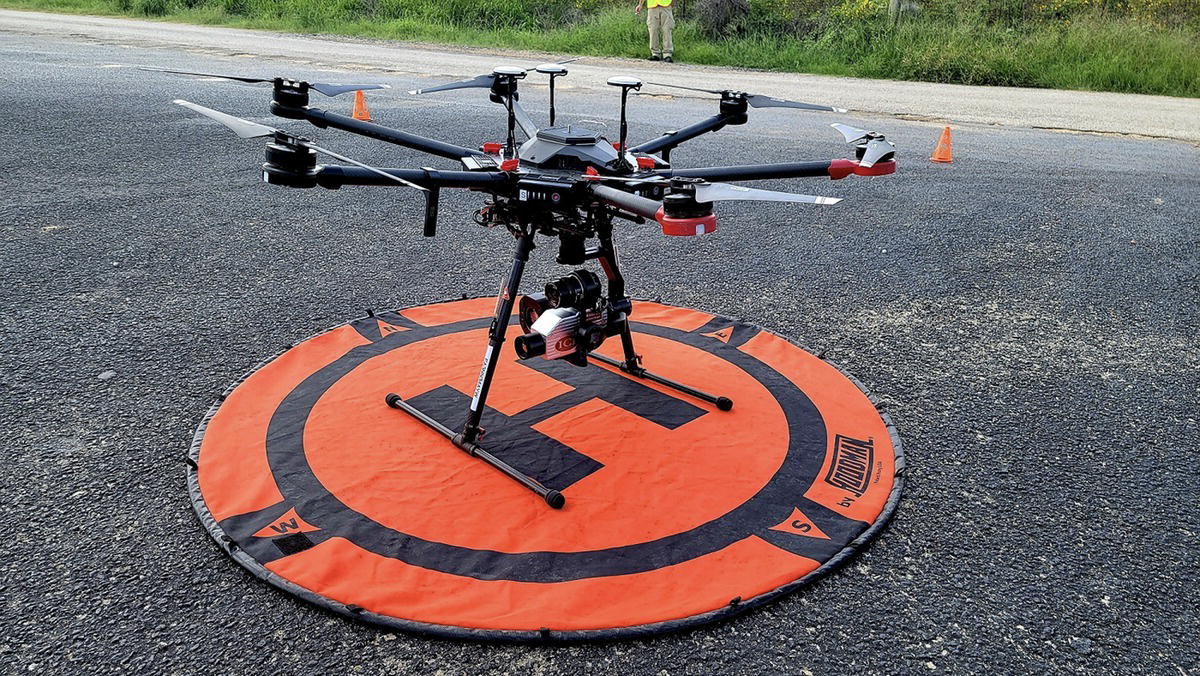
Ashwin Yerasi LaSen, Inc., Las Cruces, NM, USA In order to maintain the functional integrity of pipelines that transport natural gas, it is necessary to inspect them regularly for leaks. The majority of pipeline inspection is performed using in situ sensors. Although in situ sensor technologies are quite mature and reliable, they have a significant disadvantage. Because they must be in direct contact with the gas to detect it, they are severely limited in their spatial coverage. It is therefore not ideal to depend solely upon them for thorough and complete monitoring of pipeline networks due to how vast and complex many of them can be. Fortunately though, remote sensing approaches have recently emerged to help fill in these gaps in coverage. Remote sensing is essentially the exact opposite of in situ detection. That is, the instruments detect gas leaks from a distance without directly contacting them. They typically do so by measuring the amount of light that gets absorbed by methane plumes at certain infrared wavelengths. Since they can operate from a distance, they have an important advantage in that they can be transported by an airborne platform safely above hazardous structures. As a benefit, they can be flown over large pipeline networks and scan them in relatively little time compared to terrestrial in situ sensors. In particular, light detection and ranging (LiDAR) instruments have demonstrated to be quite effective. Over the past few decades, the utilization of airborne LiDAR systems for inspecting pipelines has evolved from a somewhat hypothetical concept to a viable reality. Several scientific organizations and technology companies have developed such instruments for this purpose. In this chapter, airborne LiDAR systems used to inspect natural gas pipelines and detect leaks are discussed. First, general operational considerations and some common implementations are explained in greater detail. Then, the ancillary components typically equipped onto these systems and the airborne platforms that transport them are described. Finally, the kind of information that could be presented in an inspection report is addressed. LiDAR is an active remote sensing technique. That is, the instruments produce their own light instead of passively relying on light from an external source such as the Sun. While flying over a pipeline, an airborne LiDAR system transmits a laser beam downward and measures the light reflected back up by the ground with a photodetector. If the beam were to pass through a gas plume on the ground, its resultant signal would be attenuated accordingly. The presence of leaks can thus be inferred from these measurements. The LiDAR system calculates the total amount of methane along the laser beam’s optical path, usually represented in terms of path-integrated concentration. This value is the product of the mole fraction of methane present in the column of air between the ground and the aircraft and the altitude of the aircraft above ground level. It is expressed in some unit of concentration times distance, like parts per million meter. As illustrated in Figure 24.1, there are two parts to the total path-integrated methane concentration: the methane already present in the background of the atmosphere and the gas emanating from pipelines in the form of plumes. In regards to leak detection, only the latter part is of interest. However, the laser beam itself cannot distinguish between the two, so ultimately the total methane gets calculated. Figure 24.1 Total, atmospheric, and plume methane. (With permission of Ashwin Yerasi.) Fortunately, the relationship between the path-integrated atmospheric methane and aircraft altitude is virtually linear. As the aircraft altitude increases, the atmospheric methane below it increases almost proportionally. By contrast, the path-integrated methane from the plume has no relationship with altitude beyond the extent of the plume’s vertical dispersion. Therefore, the atmospheric methane can be estimated using aircraft altimetry data and subsequently subtracted from the total, leaving behind only the plume methane. This quantity can then be used to assess whether or not a leak may be present. The infrared absorption spectrum for methane gas is given in Figure 24.2 [1]. There are four main wavelength bands with notable absorption lines: 1.65, 2.3, 3.3, and 7.7 μm. Because their laser technologies are the most developed, the 1.65-μm and 3.3-μm bands are the most commonly used for detecting gas leaks through active remote sensing. The instruments in Refs. [2–6] are airborne LiDAR systems that operate at 1.65 μm while the ones in Refs. [7–9] operate at 3.3 μm. These two bands have their respective advantages and disadvantages. Depending on the specific surveillance scenario at hand, it may be more appropriate to select one over the other [10]. It can be seen that the absorption lines in the 3.3-μm band are about two orders of magnitude greater than those in the 1.65-μm band. Laser beams in the 3.3-μm band would get attenuated much more rapidly when passing through a natural gas plume of a given size. As a benefit, this band is more sensitive and can be used to detect smaller gas leaks. However, it is also more susceptible to being attenuated by atmospheric methane. Thus, if the optical path were too long, the beams could be weakened to the point where the received signals are not useful. The 1.65-μm band has opposite characteristics. Because its absorption lines are much smaller, laser beams in this band can withstand longer optical paths through the atmosphere, although it is not as sensitive to smaller leaks. These differences generally mean that 1.65-μm LiDAR systems can be flown at a higher altitude but can only detect larger leaks. Conversely, 3.3-μm LiDAR systems can detect smaller leaks but must be flown at lower altitudes. There are several techniques that airborne LiDAR systems can implement to retrieve path-integrated methane concentration. Two of the most common are differential absorption LiDAR (DIAL) and tunable diode laser absorption spectroscopy (TDLAS). The instruments in Refs. [5–9] operate using DIAL techniques while the ones in Refs. [2–4] use TDLAS. Although their exact principles differ, both DIAL and TDLAS involve the laser beam’s wavelength being tuned to a particular line in the methane absorption spectrum. Figure 24.2 Methane absorption spectrum. (Reference [1]/Elsevier/CC BY 4.0.) In the standard execution of the DIAL technique, the LiDAR system transmits beams at two different but closely spaced wavelengths toward the area being inspected. These wavelengths are referred to as “online” and “offline.” The online wavelength is tuned to the peak of a methane absorption line, while the offline wavelength is tuned near the base of that line. Figure 24.3 gives an example of where the online and offline wavelengths, λon and λoff, would be placed relative to an arbitrary absorption line. They should be selected far enough such that their difference in methane absorption is substantial yet close enough such that any differences pertaining to other factors like ground reflectivity, photodetector responsivity, atmospheric transmission, etc. are negligible. Figure 24.4 shows what the received signal power at both wavelengths could possibly be in the absence and presence of a natural gas plume if both beams were originally transmitted at or near equal power. As both beams propagate downward and back up through the air, the online one gets attenuated more than the offline, even more so with the plume. But because the other factors should affect their received signal powers equally, they effectively cancel out in the inversion process. Therefore, by simply comparing the powers of the received online and offline signals to their respective transmitted signals, the path-integrated methane concentration below the aircraft can be retrieved. Figure 24.3 DIAL wavelengths. (With permission of Ashwin Yerasi.) Figure 24.4 DIAL received power. (With permission of Ashwin Yerasi.) The DIAL inversion formula, Equation (24.1), is the basic formula used to calculate this quantity from DIAL measurements [11]. The term DIAL systems can transmit laser beams either in the form of continuous waves or pulses. In continuous wave mode, both beams are transmitted together simultaneously without interruption, but are modulated at slightly different frequencies. Their received signals are separated using a lock-in amplifier set to these two frequencies. In pulsed mode, the beams are transmitted in short bursts at some repetition frequency. The pulses typically alternate between online and offline and are staggered by a brief time delay to prevent their received signals from merging. Continuous wave mode has the advantage of constant spatial coverage, but tends to produce less precise measurements. Conversely, pulsed mode can generally surmount noise better. With fast enough pulse repetition, coverage is essentially constant. Hence, many airborne DIAL systems used for pipeline inspection operate in pulsed mode. A TDLAS system also functions by transmitting a laser beam with its wavelength tuned to a certain methane absorption line. But unlike the DIAL technique which has two set wavelengths on and off the line, the TDLAS technique goes over the entire line. That is, the laser wavelength is rapidly and repeatedly swept across the line from one side to the other. By measuring how much the received signal is attenuated over these sweeps, the path-integrated methane concentration can be retrieved. Figure 24.5 TDLAS sweep. (With permission of Ashwin Yerasi.) A common method for tuning the wavelength is to adjust the laser diode’s injection current. For these types of lasers, the wavelength has an approximately positive linear relationship with the injection current. This current is usually swept in a sawtooth pattern such that the resultant wavelength range spans both sides of the line and is centered at its peak. Figure 24.5 gives an example of an arbitrary absorption line and the direction in which the wavelength could be swept. Figure 24.6 shows the received powers that would correspond to this sweep. It represents a theoretical TDLAS system observing an area with and without a natural gas plume. Due to the increased attenuation caused by the greater amount of methane, the power curve with the plume has a deeper dip at the absorption line peak wavelength. It is worth noting that longer wavelengths tend to have greater received power because the transmitted laser power also increases with respect to the injection current. Consequently, there is a ramping artifact in the signal, as depicted in Figure 24.6. Figure 24.6 TDLAS received power. (With permission of Ashwin Yerasi.) An issue that would affect standard TDLAS measurements if implemented from an airborne platform is the constantly changing ground reflectivity. This leads to inconsistencies in the received power. To correct for this, many airborne instruments implement a variant of TDLAS called 2f/1f wavelength modulation spectroscopy (WMS). In this mode of operation, the transmitted laser wavelength is also modulated at some known reference frequency while it is being swept. Then, using a lock-in amplifier, the received power signal is demodulated at both this frequency and its second harmonic. The path-integrated methane concentration can be retrieved using the 2f/1f WMS inversion formula in Equation (24.2) [12]. The terms PRx,1f and PRx,2f are the amplitudes of the signal demodulated at the reference frequency and its second harmonic, respectively. The term Imod is the amplitude of oscillation for the modulation of the injection current, and I is the central value of the current when at the wavelength of peak absorption, λpk. As for the integral in the denominator, the methane absorption cross section is a function of wavelength, which is centered at λpk and oscillates at amplitude λmod along with the current. As in the case with DIAL, it can be seen that this inversion formula does not involve ground reflectivity. Thus, the LiDAR system can operate freely as the terrain varies along the flight. In addition to its laser and photodetector, an airborne LiDAR system also features other ancillary components that collect the supplementary data required to produce the desired deliverables. Perhaps the most important of these components is the global positioning system (GPS) which measures the aircraft’s latitude and longitude. It can help pinpoint the specific locations which were found to have remarkably high amounts of methane, possibly indicating gas leaks. As mentioned previously, the system should also have an altimeter to measure aircraft altitude, which is used to estimate the atmospheric methane. And while not wholly necessary, it is highly beneficial to include an inertial measurement unit (IMU), which measures the roll, pitch, and yaw tilting of the aircraft. The GPS data can be synthesized with the altimeter and IMU data to improve the accuracy of the detected leak locations even further. Although not directly related to the LiDAR measurements themselves, the airborne system also usually features a camera. Digital camera technology has advanced substantially over the past few decades and is currently capable of collecting high-quality imagery at minimal cost in terms of size, weight, and power. Such cameras can easily be installed onto airborne platforms and operate simultaneously alongside the LiDAR. As a benefit, the airborne system can not only detect gas leaks while surveying pipelines, but also gather visual context about their immediate surroundings. The majority of airborne LiDAR pipeline inspection is conducted using piloted rotary-wing or fixed-wing aircraft. In general, piloted aircrafts are often capable of supplying the lift and electrical power necessary to transport larger instruments for longer periods of time. This allows for the surveillance of pipelines stretching over vast distances. The photograph in Figure 24.7 shows a 3.3-μm DIAL system being flown on a piloted helicopter. For more compact LiDAR instruments, a smaller uncrewed aerial vehicle (UAV) may be an adequate option. Although most commercially available UAVs typically do not have as much strength and endurance as piloted aircrafts, they tend to be more maneuverable. Thus, they are better suited for inspecting more localized gas structures. The photograph in Figure 24.8 shows a rotary-wing UAV equipped with a 1.65-μm TDLAS system resting on a landing pad. Figure 24.7 3.3-μm DIAL system on piloted helicopter. (With permission of LaSen, Inc.) Figure 24.8 1.65-μm TDLAS system on rotary-wing UAV. (With permission of LaSen, Inc.) Natural gas companies that employ pipeline inspection services are primarily interested in determining where leaks are located and approximately how large they are. With this knowledge, they can make more informed decisions about allocating resources for maintenance and repair procedures. Airborne LiDAR systems should therefore be capable of collecting all the data necessary to generate reports containing this information. A report should provide details about every localized site along the surveillance path that was found to have an unusually large amount of methane gas relative to what would normally be expected in atmosphere. Such details include, but are not limited to, the amount of methane measured at each site, its geographic location, date and time of the flight, aerial photographs, and any relevant commentary. It may be somewhat helpful to also include the wind speed, since plume methane concentration is inversely proportional to it. However, it is generally well-understood throughout the gas industry that reliable wind data is very difficult to obtain, so this quantity is often interpreted with some degree of uncertainty. The simplest way to present this report is perhaps the portable document format (PDF). The deliverable package might also include geographic information system (GIS) shapefiles showing the surveyed areas and the sites where gas leaks are suspected to be located. Since PDF documents and GIS shapefiles are relatively lightweight, they can be quickly uploaded to an online portal and accessible to customers shortly after data analysis. As for the full set of aerial imagery, which tends to be far more massive, it can be stored onto an external drive and shipped to the customer as early as logistics permit. Preliminary reports of uncovered leaks can be delivered within hours of surveillance. Natural gas companies read these reports and begin deciding which pipelines and other structures are in the greatest need of immediate attention. Once the full reports are available, they finalize their plans and repair defective infrastructure accordingly. By doing so, they prevent not only loss of their product, but also accidents within local communities in the short term as well as greenhouse gas emissions around the globe in the long term.
24
Airborne LiDAR for Pipeline Inspection and Leak Detection
24.1 Introduction
24.2 LiDAR Measurements
24.3 Wavelength Bands
24.4 Operational Techniques
24.4.1 DIAL Principle
 is the path-integrated methane concentration (concentration
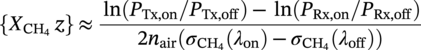
  times distance z), PTx,on and PTx,off are the transmitted online and offline signal powers, PRx,on and PRx,off are the received online and offline signal powers, nair is the number density of air molecules, and
  is the absorption cross-section area for methane at the DIAL wavelengths. It can be seen that this formula does not involve ground reflectivity, so this technique is highly suitable for airborne operation.
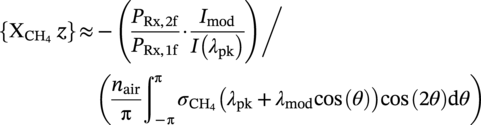
24.4.2 TDLAS Principle

24.5 Ancillary Components
24.6 Airborne Platforms
24.7 Inspection Report
Appendix 24.A.1 Abbreviations Used in This Chapter
References