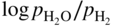
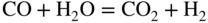
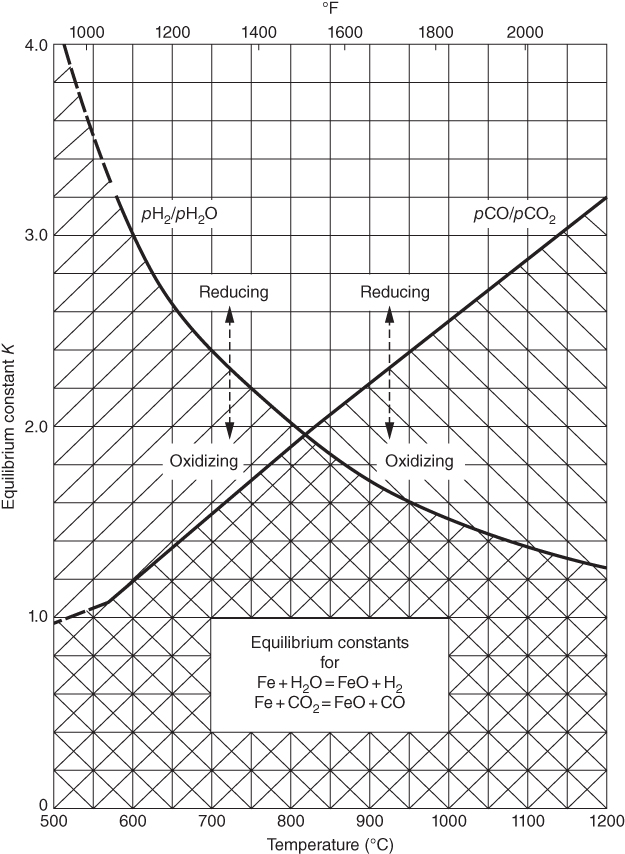
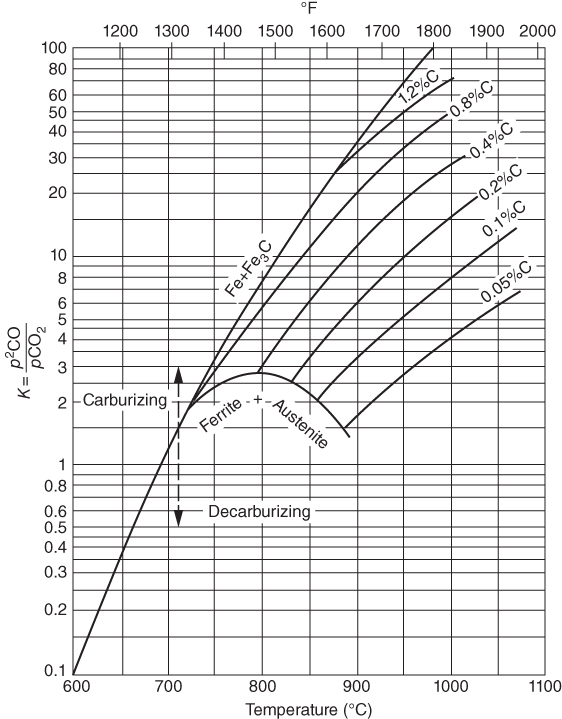
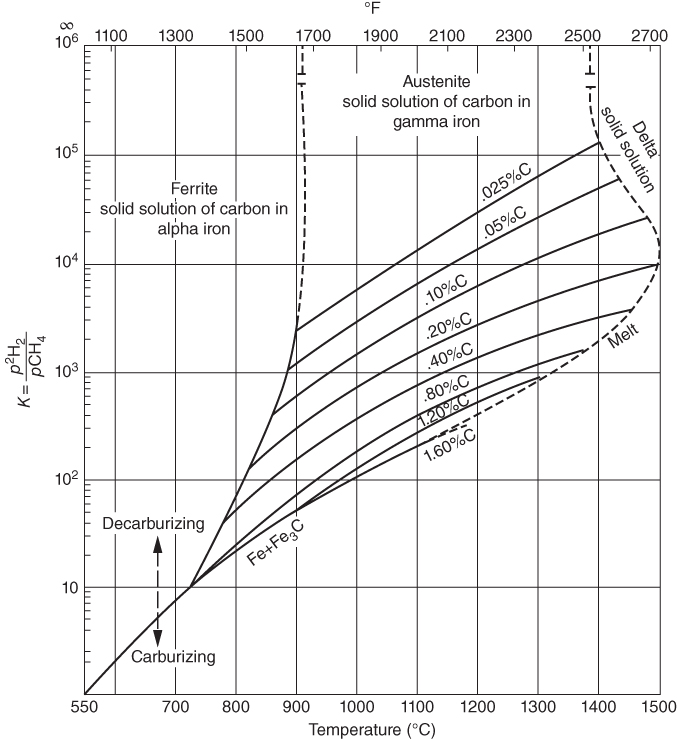
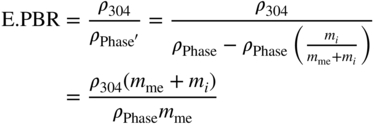
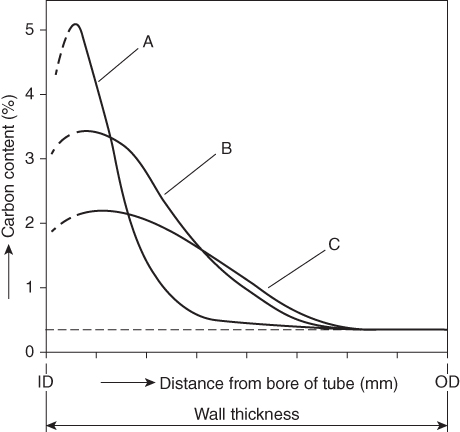
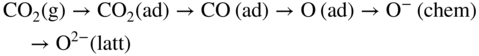
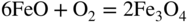
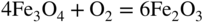
section epub:type=”chapter” role=”doc-chapter”> Metals and alloys are susceptible to carburization when exposed to an environment containing CO, or CH4 or other hydrocarbon gases, such as ethane (C2H6), propane (C3H8), and so forth, at elevated temperatures. Carburization involves the formation of internal carbide precipitates. Severe carburization occurs in the cracking tubes used in ethylene and other olefin plants, in the heat treatment of components associated with carburizing furnaces (e.g. baskets, trays, retorts, and fans), and for reformer tubes used in the steam reforming of natural gas. Furnace equipment and many other components repeatedly subjected to carburizing environments at 850–950 °C frequently suffer brittle failures as a result of carburization attack. Examples of studies and reviews of material carburization have been presented by Catlow and Mackrodt (1987), Grabke and Wolf (1987), Kane and Cayard (1995), and Rahmel et al. (1998). Metal dusting (MD) is a catastrophic carburization that occurs at temperatures of 430–900 °C when a process gas stream consists of primarily H2, CO, and CO2 along with some hydrocarbons with high carbon potentials (aC > 1). Metals or alloys can suffer rapid metal wastage in a form of pitting or general thinning of the cross‐sectional thickness of a metallic component. Materials failures associated with MD have been encountered in refining and petrochemical processing, such as production of syngas in hydrogen, ammonia, nitric acid, and methanol plants, plants producing iron ores, heat treating, and other industrial processes (Lai 2007). Relevant aspects of MD have been reviewed by Hochman (1977), Grabke (1998a, b, 2003), and more recently by Nishiyama et al. (2006). Whether an alloy is likely to be carburized or decarburized depends on the carbon activity (aC) in the environment and that of the alloy. The thermodynamic condition dictates either carburization, aC environment > aC metal, or decarburization, aC environment < aC metal. Thus one needs to know the carbon activities of both the environment and the alloy. Carburization can proceed by one of the following reactions when the environment contains CH4, CO, or H2 and CO: Assuming that carburization follows Reaction 9.1, the carbon activity in the environment can be calculated by Similarly, if carburization follows Reaction 9.2, known as Boudouard reaction, the carbon activity of the environment can also be calculated: When carburization follows Reaction 9.3, the carbon activity in the environment is Data for carbon activities of commercial alloys at temperatures below 1200 °C are relatively limited. Natesan (1976) reported that aC for 2.25Cr–1Mo steel is in the range of 1 × 10⁻¹ to 10−2 from 550 to 750 °C. Natesan and Kassner (1973) reported the carbon activities of Fe–18Cr–8Ni alloys. For carbon steels, carbon activity can be estimated by assuming that it is in equilibrium with cementite (Fe3C): Environments containing gas mixtures such as CO/CO2 or H2/H2O are very significant in terms of carburization/oxidation phenomena. Let us, for example, consider the following reaction: The variance of the equilibrium is equal to 2 in this case of condensed phases without miscibility since there are three independent components and three phases in equilibrium. At equilibrium, we have where The stability domains of the condensed phases are represented in Assuming that ΔH° and ΔS° are independent of temperature, Figure 9.1 Stability domains of M2Ob and M2Ob′ in a H2/H2O gas mixture. If several oxides of the same metal can be formed, it is necessary to proceed in the same way as described in Chapter for the case of equilibrium with a simple gas. The stability domains of iron and iron oxides, i.e. FeO, Fe2O3, and Fe3O4, as functions of gas composition and temperature are represented in Figures 9.2 and 9.3. Figure 9.2 corresponds to a Chaudron diagram and Figure 9.3 to the plot of Figure 9.2 Stability domains of iron and iron oxides as functions of temperature and gas composition according to the Chaudron diagram (CO/CO2 and H2/H2O mixtures). The hatched areas indicate the stability domains of FeO according to the gas mixture, i.e. CO/CO2 or H2/H2O (COACH data bank 2002). Figure 9.3 Stability data domains of iron and iron oxides as functions of temperature and of the Note that both diagrams exhibit a triple point, T0 = 830 K, O′, and O′′, respectively, in Figure 9.3, corresponding to a pseudo‐invariant system, insofar as the pressure is not a factor in the equilibrium since there are three independent components and four phases. Also note that B′ and B′′ in Figure 9.2 (intersection of, respectively, the curves (2) and (2′) and (3) and (3′)) correspond to the inversion temperature of the following equilibrium: that is, T1 = 1100 K. Moreover, for T < 1100 K, CO is more reducing than hydrogen, whereas the reverse applies for T > 1100 K. A more general treatment of high temperature equilibria for oxidation, and carburization or decarburization of iron or steel, requires the consideration of the equilibria H2O/H2, CO2/CO, and CH4/H2. Therefore, the reactions chiefly responsible for this corrosion at high temperature are The data presented in Figures 9.4–9.6 show the variation with temperature of the equilibrium constant for each of the four Reactions 9.13–9.16. Figure 9.4 Chart illustrating the variation with temperature of the equilibrium constant for the reaction between iron and water vapor or carbon dioxide. Figure 9.5 Equilibrium constants for the reaction Fe3C + CO2 = 3Fe + 2CO as a function of temperature and carbon content. Figure 9.6 Equilibrium constants for the reaction 3Fe + CH4 = Fe3C + 2H2 as a function of temperature and carbon content. The constants are given in terms of the partial pressure of each gas, that is, the total pressure multiplied by the volume fraction (not weight percentage) of the gas in question. For example, in a gas mixture containing 45% CO, 15% CO2, and 40% N2 at a total pressure of 1 atm, the partial pressure of CO is 0.45, and that of CO2 is 0.15. The curves presented in the several figures enable one to predict the way in which a mixture containing CO and CO2 or H2 and H2O tends to react with iron or iron oxide. (They do not indicate the rate at which this tendency may be followed.) As an illustration, for the gas mixture described above, the pCO/pCO2 ratio is 0.45/0.15 or 3. Figure 9.4 shows that this ratio is equal to the equilibrium constant at 1130 °C; hence at this temperature this mixture is inert to iron or iron oxide, at higher temperature it cannot reduce iron oxide and tends to oxidize iron, and at a lower temperature it tends to reduce iron oxide and cannot oxidize iron. To ascertain whether this mixture tends to carburize or to decarburize steel at 800 °C, the value of the equilibrium constant for Reaction 9.3 is computed; it is p2CO/pCO2 = (0.45)2/0.15 = 1.35. Figure 9.5 shows that at 800 °C this gas is decarburizing toward steel of any carbon content. A ratio of 6 instead of 1.35 would indicate (see Figure 9.5) that at 800 °C the gas mixture tends to decarburize steel containing less than 0.8% carbon and to carburize steel containing a higher concentration of carbon. The use of these charts for mixtures of hydrogen and methane (Figure 9.6) is analogous to that for carbon monoxide and carbon dioxide. Note that at high temperatures the oxide that first forms is FeO, and if the partial pressure of oxygen is low, this is the only oxide that forms. At somewhat higher oxygen pressures, a layer of Fe3O4 forms on the top of FeO, and at still higher pressures, a layer of Fe2O3 forms over Fe3O4. Below about 600 °C, FeO is unstable and decomposes into iron and Fe3O4 so that high temperature scales on iron examined at room temperature show only iron, Fe3O4, and possibly Fe2O3. Even though in cases where the gas mixture may not reach an equilibrium condition, it will be of great benefit to better understand the gas–metal reaction in terms of thermodynamic equilibrium in multicomponent gas environments. The thermodynamic equilibrium gaseous composition along with its thermodynamic potentials, such as carbon activity, aC, oxygen potential, The environment is also being characterized in terms of aC, and As reported above, carburization depends on the carbon activity in the environment and that of the alloy. The phenomenon refers to ingress of carbon into the material in the presence of carbonaceous gases such as CO, CO2, CH4, and other hydrocarbons. Carbon is transferred to the material surface, diffuses through it, and forms various carbides with the alloying elements. Usually, it happens at T > 800 °C and aC < 1. Apart from carbon inward diffusion and carbide precipitation, MD is also observed for lower temperatures and greater aC (aC > 1). But, during metallic carburization, other effects may occur, namely, discontinuous precipitation, microcrack formation, and volume expansion, as will be discussed next. The growth of discontinuously precipitated carbides was described by Cahn (1959) and Hillert (1969) during the 1950–1960s. Many solid‐state reactions such as eutectoid transformations like pearlite formation and discontinuous precipitation result in a lamellar structure. In the case of discontinuously precipitated carbide in austenite, Cr diffusion occurs in the austenite/austenite grain boundary as the boundary of the growing cell moves through the supersaturated austenite. In the alloy 602CA (alloy type NiFeCrAl), a fine substructure of carbides (probably M7C3) and a new Ni‐enriched, Cr‐depleted austenite were formed from the carbon‐saturated austenite. The carbon supersaturation decreases discontinuously as the carburized austenite/newly formed austenite cell boundary advances. The carburization thus constitutes the driving force for the phase transformation, which occurs by a discontinuous cooperative growth of carbide and Cr‐ and C‐depleted austenite. This type of reaction represents a fast precipitation process at lower temperatures where bulk diffusion is slow. It has been suggested that the force, actually pulling the cellular boundary of discontinuous precipitation, is the difference in atomic size, which gives rise to strain energy in the concentration gradient ahead of the growing new austenite grain. This mechanism was originally proposed by Sulonen (1994). Two different morphologies of the discontinuously precipitated carbides were also detected in AISI 304L as well as in nanosized carbon filament formation during MD of stainless steel (Lin and Tsai 2003; Szakálos et al. 2002). In the case of the alloy 602CA, the cellular growth rate of discontinuous precipitated carbides means that the advancement of the cellular boundary is governed by the rate at which a sufficient amount of Cr can move to the carbide phase via the cellular boundary. Every Ni atom has a short diffusion distance between the carburized bulk (old austenite) and the newly formed low‐alloyed austenite, while Cr has orders of magnitude longer diffusion distances toward the nearest Cr carbide. This means that the average Ni atom has a very short dwell time, and, as a consequence, the average Cr fraction in the boundary could be much higher than the bulk fraction of 0.25. The cellular growth in this case is characterized by a small fraction of discontinuous precipitates, and both the new phases formed are close to equilibrium, i.e. the Cr‐diffusion process, and, subsequently, the Cr‐carbide formation, is almost accomplished. It is possible to estimate the cellular growth rate based on diffusion limitations. It is assumed that the cellular boundary can move forward in steps of the boundary thickness and before it moves forward, all metal transport needed to reach equilibrium must be accomplished. Consider a segment of the cellular boundary, with S the lamellar spacing in the cellular structure and S/2 the characteristic diffusion distance. Using an approximation of Fick’s first law, we can write where Δm is the amount of Cr metal in the segment that diffuses and forms carbide Δx(S/2) is the diffusion length, Δt is the time for one segment of cellular growth ΔCCr (2XCr) is the Cr content in the cellular boundary, which may be much higher than the bulk content (XCr) (and the difference in Cr concentration toward the carbide may therefore be estimated as ΔCCr = 2XCr) A is the diffusion cross‐sectional area or A = δ per unit length ρ is the density of the diffused metal, i.e. Cr δ DGB is the effective grain boundary diffusion coefficient of the Cr atoms with LAρ as a characteristic size of the structure, in this case L = δ, which is the cellular boundary thickness or segment thickness. The growth increment or movement of the cellular boundary is set to the grain boundary thickness, δ, and thus the diffusion‐controlled velocity of the cellular boundary v1 may be written as Using the model for cellular growth proposed by Hillert (1969), it gives the maximum growth rate: The constant 16 in Eq. 9.19 is directly comparable with the constant 8 in Eq. 9.18. This means that Hillert’s model predicts two times faster growth rate of the discontinuously precipitated carbide structure. This implies that the MD corrosion rate could be much higher if the atmosphere was more aggressive, i.e. with higher carbon activity. The cellular structure is thus of vital importance and facilitates the relatively fast MD kinetics at lower temperatures. Carburization during MD conditions may result in low ductility and microcracks, which form flat metal fragments on the surface in different sizes up to 200 µm × 60 µm × 10 µm, where 10 µm represents the typical crack depth. Crack configuration suggests that the carburized surface metal developed compressive stresses, which could result in shear cracks parallel to the surface, favored by a ductility drop. Distribution of the microcracks all over the carburized surface, revealing the crack propagation path through the carbide network, shows that general surface carburization can be simultaneously involved with oxidation and microcrack formation, as revealed by cross sections of 602CA at 540 °C. Carburization gives rise to compressive stresses due to volume expansion (Schnaas and Grabke 1978), but at higher temperatures, such as 650 °C, stress relaxation may take place fast enough to avoid crack formation. An additional effect may be that microcracks form during cooling because of different thermal expansion in the carburized layer and the bulk. If the uncarburized bulk “shrinks” somewhat more during cooling than the carburized surface layer, the result would be cracks parallel to the surface. The microcrack formation during cooling may explain the surprisingly low metal attack resistance for 602CA during cyclic conditions as pointed out by Toh et al. (2003). Several phases such as oxides and carbides, which will form in an AISI 304L steel during metal carburization/dusting conditions, give rise to a substantial volume expansion. This may contribute to the rather rapid degradation process that characterizes the metal aggression phenomenon. Some possible phases and calculated volume expansions, when formed in the steel matrix, are given in Table 9.1. These extended Pilling–Bedworth ratios (EPBR) for different phases are based on density changes for the metal during phase transformation. The phase stability conditions are calculated with Thermo‐Calc. Table 9.1 Possible phases formed in AISI 304L at 650 °C during carburization and metal dusting conditions and calculated volume expansion aLattice spacings and structures of metals and alloys (Pearson 1958). bWhen related to M7C3. The EPBR are calculated by virtual volume expansion or density change of the metal component during phase transformation, i.e. if C, O, or N had zero mass: where ρ304 is the density of the AISI 304L steel; ρPhase the density of the phase formed in the steel; Once formed, chromia or spinel oxide is very stable even at extremely high carbon activities, as seen in Table 9.1. As the carbide content in the different phases grows, volume expansion becomes visible. It is obvious that these volume expansions will create stresses and finally eject the corrosion products, which most likely accelerate the metal corrosion process. An especially detrimental “grain pick out” process occurs when the grain boundaries are selectively attacked and complete grains are ejected as observed by de Bruyn et al. (2001) in reformer plants at 540 °C. This effect was also observed at higher temperatures as “green rot” by Dovey and Jenkins (1950) (see Section 1.5.11). Carburization attack generally results in the formation of internal carbides in the alloy matrix as well as at grain boundaries. The measurement of the carbon concentration profile as a function of distance from the metal surface is an excellent method for characterizing the carburized alloy, but it will be certainly beneficial to use as many evaluation methods (gravimetric, metallographic, etc.) as possible for characterizing the carburized alloys. Figure 9.7 illustrates three possible carbon concentration profiles to analyze the impact of carburization on an alloy’s performance (Krikke et al. 1976). Krikke et al. considered profile A with a steep concentration profile to be the most damaging. Further analysis showed that for carburization, the real issue is the effect of carburization on the alloy’s mechanical properties, such as creep‐rupture properties and toughness or ductility, but for making an informed material selection, it is necessary to review and analyze the carburization data in terms of mass gain, mass carbon absorption, carburization depth, and concentration profile of the carburized layer (Klower and Heubner 1998). When the environment is such that no protective oxide scale (e.g. Cr2O3 scale) is formed on the metal surface, carburization is controlled by diffusivity and solubility, carbon permeation through the oxide layer being possible only if the layer contains pores and fissures (Wolf and Grabke 1985). Pyrolysis furnace tubes typically constructed of Fe–Cr–Ni cast alloys, such as HK (Fe–25Cr–20Ni or 25/20) and HP (Fe–25Cr–35Ni or 25/35), show improved carburization resistance as well as creep‐rupture strengths when modified with additions of Nb, W, Mo, Si, Ti, Ni, or Cr (microalloyed castings) (Hall et al. 1985). Figure 9.7 Three possible carbon concentration profiles of carburized alloys (Krikke et al. 1976). Fe–Ni–Cr alloys, including commercial and experimental alloys, were tested at Petten laboratories, at fixed carbon activities (aC of 0.3 and 0.8) and spread temperatures (825–1050 °C), with various additions of Si, Nb, Cr, and Fe and various oxygen potentials (Harrison et al. 1979). The oxygen potentials of the test environment were below that in equilibrium with Cr2O3 (Figure 9.8), that is, no chromium oxide scales should have formed on the metal surface. The test results at 825 °C showed that type 314 stainless steel (2.04% Si) was significantly more carburization resistant than HK‐40 (1.35% Si), HP‐40 Nb (1.29% Si), and 800H (0.4% Si). The beneficial effect of Si on carburization resistance was clearly demonstrated. Both chromium and iron are carbide formers, constituting the major elements in M7C3 and M23C6 carbides resulting from carburization. Nickel reduces the diffusivity of carbon in Fe–Ni–Cr alloys and also decreases the solubility of carbon in Fe–Ni alloy system. Bose and Grabke (1978) observed that increasing nickel improved carburization resistance in Fe–Ni–Cr alloys, with the maximum resistance achieved when the ratio of Ni to Fe was 4 : 1. This is in general agreement with the product of carbon solubility and diffusivity. High nickel alloys are generally more resistant to carburization than Fe–Ni–Cr alloys. Figure 9.8 Oxygen potentials of the test environments used in carburization studies at Petten laboratories (Harrison et al. 1979). Small additions of some minor elements, such as Ti, Nb, W, and rare earth elements, may also improve an alloy’s resistance to carburization in test environments of H2–8.6% CH4–7% H2O and H2–12% CH4–10% H2O (Khandros et al. 1984). The superior carburization resistance of TMA 4750 alloy (0.50C–0.70Mn–1.84Si–25.1Cr–38.4Ni–0.13Ti–0.28Nb–0.27W‐REM, this denoting rare earth metals) to HK‐40 2.0% Si (0.41C–0.60Mn–1.98Si–25.0Cr–20.7Ni) can be attributed to small additions of Ti, Nb, W, and REMs. In both test environments, the oxygen potentials are believed to be high enough to form oxide scales. Thus, improvements in carburization resistance may be partly due to the improved oxide scale. Ando et al. (1989) concluded that a critical concentration of c. 2.7 Al in Fe–Al alloys is required for good carburization resistance at 930 °C. They suggested that an incomplete and/or non‐protective Al2O3 film forms at aluminum concentrations below this critical value. A drawback to the use of wrought alumina formers such as 214 and 602CA is their relatively poor creep strength at the higher operating temperatures when carburization is often a problem (T > 950 °C). Despite this, these alloys can be used effectively in carburizing applications involving lower temperatures and/or lower stresses. Adjusting the composition of the process environment can also reduce the rate of carburization attack. For instance, injection of steam into the environment reduces the carbon activity and increases the tendency for oxide formation. Alternatively, carburization attack in the absence of oxide‐barrier formation can be reduced by introducing very small amounts of sulfur or sulfur compounds into the environment (Grabke et al. 1977); the sulfur blocks the transfer of carbon into the steel. Sulfur levels higher than 1.4 × 10⁻¹⁰ atm at 1000 °C reduce the extent of carburization, but overall corrosion increases because of the growth of sulfide scales (Corish et al. 1987; Rahmel et al. 1998). In general, the solubility of carbon in nickel alloys is low; therefore, the choice of nickel alloys to resist carburizing environments is widespread. However, heat‐resistant alloys invariably contain many alloying elements such as chromium, aluminum, silicon, and so on. Carburization thus always leads to the formation of various chromium carbides. Nickel alloys are protected from carburization by stable oxide scales. Whether an alloy will undergo oxidation or carburization in a gas mixture at a given temperature is determined by the partial pressure of oxygen (oxygen potential) and the carbon activity at that temperature. At higher temperatures, typically greater than 1050 °C, oxide scales are stable in the following order: Al2O3 > SiO2 > Cr2O3. For service below 1050 °C, chromia‐forming alloys offer satisfactory life. For service above 1050 °C, silica‐ or alumina‐forming alloys are preferred. If the processing conditions alternate between carburizing and oxidizing, then chromium in the alloy would alternately oxidize and carburize. The carburization of oxides releases CO for subsequent oxidation, and the cycle continues. This phenomenon leads to what is known as “green rot,” named for the greenish chromium oxides on the fracture surface (see Sections 1.5.11 and 9.2). High temperature oxidation performance of austenitic stainless steels in oxidizing or hazardous atmospheres has been one of the main scientific and engineering interests in the large field of environmentally induced degradation of materials over the past 25 years (Rouillard et al. 2009). It is well known that parts of the boiler system are exposed to high temperature oxidation and hot corrosion that are recognized as the main factors for degradation of boiler parts. In general, most of the metals are thermodynamically unstable with respect to ambient gases such as CO, O2, and CO2 at elevated temperature. Finally, the gas reacts with the surface of the boiler part to form different compounds such as oxide or spinel. Certain compounds may protect the underlying metals or may also thicken into a non‐protective scale with various defects such as cavities, microcracks, and porosities. Many service environments contain combustion products, such as water vapor and carbon dioxide compounds. All have a harmful influence on oxidation resistance of the underlying metals. Furthermore, it is well recognized that oxide films are ductile at high temperature and are often brittle at lower temperature. Most oxide films have different coefficient of thermal expansion of those of the underlying metals from which they are formed. Therefore, the oxide films formed at high service temperature may lose adherence to the underlying metals when cooled to lower temperature and turn into the non‐protective films. These are the major reasons for breakaway oxidation and degradation of the underlying metals (Othman et al. 2010). In the process of oxy‐fuel combustion, the oxygen is required to separate from air prior to combustion, and the fuel is combusted in oxygen diluted with recycled flue gas rather than by air. The oxygen‐rich, nitrogen‐free atmosphere results in the final flue gases consisting mainly of CO2 and H2O (water). Specific concern for corrosion in the presence of water vapor is identified to increase the corrosive tendency of the environment. Water vapor can affect this process in various ways. It has been well known that the presence of water vapor in oxidizing environments can accelerate the degradation process for many different metals including austenitic stainless steel (Kumar et al. 2011). In order to understand the effect of dry and wet CO2 gas environments at high temperatures (≅700 °C) on high temperature carburization/oxidation behavior of austenitic stainless steels, many studies have been described (Chia and Wen 2009; Grabke 1998a, b; Szakálos et al. 2002; Wuchina et al. 2009; Young 2008). In the presence of CO2 at 700 °C, oxidation takes place instead of carburization due to dissociation of CO2. The process can be split into several steps at the scale interface. The reactant‐gas molecule must move toward the surface and become adsorbed there. The adsorbed molecules then split to form adsorbed oxygen, which finally attracts electrons from the oxide lattice to become initially chemisorbed and eventually integrated into the lattice (Freund and Robert 1996). These processes can be expressed as follows: From Eq. 9.22, CO2 adsorbs onto the oxide surface and there dissociates to adsorb CO and O species. In fact, the adsorbed oxygen then goes through the ionization stages. Oxygen turns into dominant and reacts with the substrate (Liu et al. 2012). The oxide phases found were wustite (FeO), magnetite (Fe3O4), and hematite (Fe2O3) in iron after exposure to CO2 gas (Huenert et al. 2008). It can be explained by the following reactions: In dry (Ar–75% CO2) environments, protective oxide scale, which is Cr2O3 layer, was developed. The capability of the austenitic stainless steel to form protective oxide scale is based on Cr content (Francis 1966). The oxide scale of austenitic stainless steel was found to be adhesive and dense in dry CO2 especially between metal–oxide interfaces. From the cross‐sectional observation, it can be seen that diffusion of oxygen through the scale was less in dry CO2, which showed that the corrosion attack was slower in dry condition. The aim of this characterization was to obtain a better understanding of the effect of water vapor in flowing CO2 gas on samples as well. The presence of water vapor in the CO2 environment accelerated the oxidation of austenitic stainless steel alloys. This indicates that non‐protective scale growth occurs in the Ar–75% CO2–12% H2O. The presence of water vapor causes acceleration of the oxide growth from protective oxide to non‐protective oxide scale. It leads to a significant increase in oxidation rates and thickening of the oxide scale due to the formation of non‐protective Fe3O4 oxides. Silicon has also been found to be very effective in improving carburization resistance, as reported by Kane (1983), Steinkusch (1979), Van der Bruck and Schillmoller (1985), Wolfe (1978), and Wright (1983). The focus thus far has been primarily on alloys used in ethylene cracking and steam hydrocarbon reforming operations. Most of the alloys are cast alloys used for furnace tubes. A variety of wrought alloys of stainless steels, Fe–Ni–Cr alloys, and Ni–Cr alloys have been widely used in various industries, including heat treating and chemical processing. Silicon was again noted for its beneficial effect as illustrated by type 304 versus type 302B. Chromium was found to be beneficial in Fe–Cr alloys, as shown by type 446 versus type 430. Small additions of titanium or niobium appeared to be beneficial when comparing type 321 and type 347 to type 304. Aluminum is the most effective alloying element in improving an alloy’s carburization resistance at high temperature. Lai (1985a, b) showed that when tested at 870, 930, and 980 °C, alloy 214 (Ni–16Cr–3Fe–4.5Al–Y) was the most carburization‐resistant alloy among more than 20 commercial wrought alloys, ranging from stainless steels and Fe–Ni–Cr alloys to nickel‐ and cobalt‐based superalloys in the test environments, which were characterized by a unit carbon activity and oxygen potentials such that Cr2O3 was not expected to form on the metal surface. Oxides of silicon, titanium, and aluminum were expected to be stable under the test conditions. The excellent carburization resistance of this alloy was attributed to the Al2O3 oxide scale formed on the metal surface. Kirchheiner et al. (2005) developed a commercial, centrifugally cast nickel‐based alumina‐forming alloy, alloy 60HT, containing approximately 25% Cr, 11% Fe, 0.4% C, and Al. No carburization data were reported. However, the resistance to coking was studied on alloy 60HT containing three levels of aluminum (i.e. 2.35, 3.55, and 4.81%). They found significant reduction in coking rates for the samples containing 3.55 and 4.81% Al, with the samples containing 2.35% Al exhibiting only slight reduction of coking rates compared with the conventional HP‐40 alloy (4852). Coking, which is an important phenomenon in ethylene cracking, develops on the internal surface of the pyrolysis tube and reduces the heat transfer. The ethylene cracking operation has to be interrupted to allow decoking, typically with steam and air to remove the coked layer. This decoking operation can have detrimental effects on the tube properties, thus reducing the tube’s service life. Other factors such as surface finish have been found to be very important in affecting carburization reactions. Machining the metal surface to improve the surface finish can significantly increase an alloy’s carburization resistance. It is common practice to bore or hone the internal diameter of a centrifugally cast tube to remove surface shrinkage pores (Pons and Hugo 1981; Thuillier 1976). A cast metal surface with shrinkage pores can generate stagnant conditions in crevices, which are very conductive to carburization attack. In addition, a machined surface exhibits a cold‐worked layer, which tends to accelerate the diffusion process and results in rapid formation of oxide scale or film, thus slowing subsequent carbon ingress. Injecting sulfur compounds into the carburization gas stream can significantly reduce the carburization kinetics. Sulfur compounds, such as H2S, can retard carburization kinetics. This was observed by many workers, namely, Ramanarayanan et al. (1998) and Wright (1983). It was shown that carburization of HK‐40 alloy was significantly reduced when 100 ppm H2S was injected into the test environment. The effect of different levels of H2S injection on the carburization of HK‐40 was also observed. The carburization of alloy 800H in H2–CH4 (aC = 1.0) with injection of different levels of H2S (H2S/H2) was also studied by Grabke et al. (1979). When this approach is used for controlling carburization, it is important to determine the optimum level of sulfur compounds needed to achieve maximum effectiveness. Too much can lead to accelerated corrosion due to sulfidation, which may be worse than carburization. In fact, a low H2S injection failed to reduce carburization, and a high H2S injection caused sulfidation attack for alloy 800H. It has been proposed by Grabke et al. (1977) and Ramanarayanan and Srolovitz (1985) that sulfur absorbed on the metal surface blocks the potential sites for carbon absorption from the carburizing gas, thus significantly reducing the carbon concentration in the metal surface layer and retarding the overall carbon transfer into the metal. The room temperature ductility or toughness of an alloy can be severely degraded when the alloy is heavily carburized (Klower and Heubner 1998). For high temperature components that are subjected to severe carburizing environments at very high temperatures, such as ethylene pyrolysis furnace tubes, the component can be carburized through the thickness of the component with significant amount of carbon pickup. Grabke and Jakobi (2002) performed a metallurgical analysis of a failed ethylene pyrolysis furnace tube made of HP‐40 Nb and found that the tube was carburized throughout the tube wall with 3.14–3.3% C, as opposed to the original carbon content of about 0.5%. Furthermore, carburization can increase the volume of the carburized zone, thus developing internal stresses. When the alloy is severely carburized, these internal stresses can be significant enough to develop cracking when the carburized alloy is cooled to room temperature. The effect of carburization on the mechanical properties of high temperature materials has also been studied in terms of their creep‐rupture behavior. Marriott et al. (1987) edited an excellent book documenting these and related aspects of carburization corrosion. MD deterioration as a concept was first reported by Camp et al. in 1945. The corrosion problem was initially detected in a superheater for reforming naphtha. Several laboratory exposures were performed on 18/8 stainless steel in order to minimize the newly detected corrosion phenomenon, and it was concluded that different forms of sulfur additions eliminate the corrosion. More focused studies on the mechanisms of MD were initiated by Prange (1959) during the 1950s with studies on the effects of carbon‐bearing gases on alloys in petrochemical applications and were a major feature at the 1959 NACE conference. Several excellent conference papers on the subject were published by Prange and other authors. A statement by Prange summarizes the state of the art of MD research on high‐alloyed materials during the time period: “While a few aspects are discernible (regarding MD), the picture as a whole is hazy. At first glance it might seem that oxidation phenomena govern the entire problem….” This seems to anticipate, 50 years later, the lively debate on effect and role of oxygen in MD of high‐alloyed materials, which is thoroughly described in recent literature. Pure carbon‐induced MD on binary Fe–Ni alloys was described during the 1950s by Hultgren and Hillert (1953). Today, this disintegration by graphitization is considered to be one of the major degradation mechanisms of MD. This paper has not been referred to until recently, perhaps because, in the words of one of the authors (Hillert), “At that time, we did not know that the phenomenon was denoted metal dusting.” In the 1960s, Hochman and Burson (1966) identified an additional mechanism that operates on iron and low‐alloyed steels, which includes decomposition of metastable cementite. However, the steady‐state situation and driving force of this mechanism were never elucidated. A statement by Zeng et al. (2002) may summarize the situation of MD research a few years ago: “Metal dusting has been studied for more than 50 years, but the mechanisms are not fully understood.” Obviously, there are still several gaps in the understanding of MD mechanisms, especially concerning high‐alloyed materials. The Hochman proposal for the MD corrosion of iron, which has been further elaborated and confirmed by Grabke et al. (1998), Pippel et al. (1998), and Chun et al. (2003), involves the initial formation of a metastable Fe3C carbide layer on the iron surface in environments that are supersaturated with carbon. The carbide subsequently dissociates into carbon and metal particles when it is destabilized by carbon deposition, leading to the formation of “dust.” Often the metastable Fe3C does not decompose, but instead constitutes the dust by the rupture of surface Fe3C layer. The stresses generated during the formation and growth of Fe3C appear to be rather large, and above a critical stress level, the surface Fe3C layer breaks up, with fractured Fe3C migrating upward through the carbon deposit. The presence of Fe3C in the carbon deposit has also been reported by Toh et al. (2002), Zeng et al. (2002), and Zhang et al. (2003). Nickel and cobalt are also subject to MD; however, their disintegration leads to larger metal particles, the overall rate of metal wastage is lower, and the amount of carbon deposition is less. Previous work (Chun et al. 2003) indicated that the mechanism of MD of Ni and Co is different from that of iron and steel because the metastable surface carbide layer that typifies Fe corrosion is not observed. However, Ni and Co still corrode by a combination of atom migration through surface carbon deposits and carbon intrusion and precipitation in the bulk metal. Schneider et al. (1999) have also carried out some studies on the MD of nickel‐based alloys. It is believed that MD can be suppressed by the formation of a protective stable oxide layer. However, the breakup of surface oxide films initiates localized attack. Corrosion then leads to the formation of hemispherical pits and holes, from which coke grows in various forms such as cones, worms, leeches, etc. The following sequence of steps has been proposed by Grabke (2003): (i) carbon transfer from the carbon‐supersaturated environment to the alloy surface and dissolution in the alloy, (ii) deposition of graphite on the alloy surface in different orientations, (iii) growth of graphite into the alloy interior by addition of dissolved carbon to graphite basal planes normal to the alloy surface, (iv) destruction of the alloy by inward‐growing graphite and dislodgement of metal particles into the coke layer, and (v) further coke formation on these metal particles that act as catalyst. Zhang et al. (2005) have studied the effect of copper additions to nickel on the rate of MD. Because copper is noncatalytic to carbon deposition from the gas atmosphere, the addition of ∼20 wt% copper to nickel was able to suppress or greatly retard the MD of the alloy without the need for a protective oxide scale on the surface. This concept was originally used by Ramanarayanan et al. (2004) to propose MD corrosion‐resistant coatings. High temperature MD is treacherous since when initiated, the MD pit growth rate may reach at least a millimeter per month on stainless steels and an order of magnitude higher on low‐alloyed steels. It is a widespread problem in the petrochemical industry, particularly in cracker furnaces and reforming units, i.e. in hydrocarbon synthesis gas containing predominantly CO and H2 with some water vapor. This means that basically all production of monomers, which are the raw materials for polymer production, like polyethylene, may be subjected to MD. Other chemical processes where organic compounds are reacting, such as in butane dehydrogenation, hydrodealkylation, acetic acid cracking, and pyridine production, are also subjected to MD (Grabke 1995). Industrial processes within the heat treating industry, energy production (coal gasification plants), and ammonia plants are other examples. During the recent years, MD has attracted considerable attention due to development of new processes in the petrochemical industry as well as in electric power generation. In the important context of energy production, it is fairly safe to say that mankind will not stop the usage of fossil fuel until all of the Earth’s reservoirs of oil, gas, and coal have been emptied. However, their exploitation via today’s technology at the current rate is also associated with negative ecological and climatic consequences. The solution of these problems is believed to be in new technology, where only the hydrogen part of the fossil fuels is used for energy production or by using CO2 sequestration techniques. A more immediate problem is that the global production of conventional oil is predicted to peak toward the end of next decade. However, it is possible to compensate the forthcoming decrease in oil production with natural gas, but it requires more efficient techniques. The prevailing circumstances have recently increased the interest in Fischer–Tropsch gas‐to‐liquid (GTL) hydrocarbon processing technologies and the pursuit of maximum efficiency in steam reforming technologies. Another important future technique for energy production is represented by solid oxide fuel cell (SOFC) and molten carbonate fuel cell (MCFC) technologies. Significant progress on reducing the operating temperatures of an SOFC has already been achieved, from ∼1000 °C down to 550–800 °C intermediate temperature solid oxide fuel cell (ITSOFC). However, the Achilles’ heel in all these techniques is the development of equipment, i.e. metallic materials capable of operating at increased carbon activities across the temperature range of 450–850 °C, where MD can cause severe damage to alloy components. Even today’s technology suffers significant problems with MD. The US Department of Energy (DOE) has calculated that savings of more than US$ 300 million could be made annually in hydrogen production alone if the limitations caused by the MD phenomenon could be circumvented. A solution to the MD problem without lowering the carbon activity or introducing inhibitors, i.e. by development of a new generation of engineering alloys immune to MD corrosion, would represent an important contribution toward a more durable and environmentally nondestructive society – the hydrogen society. The phenomenon of MD may be divided into three main mechanisms denoted type I, type II, and type III. Type I, first described by Hochman (1972) and further detailed by Grabke (1995, 1998a), involves decomposition of metastable cementite. Type II may be described as disintegration of a carbon‐supersaturated phase by internal graphitization and was first described by Hultgren and Hillert (1953) and studied in detail by Pippel et al. (1995, 1998). Type III, which operates on high‐alloyed steels and Ni‐based alloys, was first proposed and further detailed by Szakálos et al. (2002, 2006) and involves selective oxidation of alloyed carbides, i.e. not pure Fe carbides. Pure metals like Fe, Ni, and Co do not form any protective oxides in synthesis gas mixtures since the oxygen partial pressure is typical in the range of 10−20 to 10−24 bar depending on the content of oxygen‐bearing gases such as H2O and CO2. This means that their MD behavior is likely to be poor. Nevertheless, these metals are of principal importance since the alloys used today in MD environments are based on Fe, Ni, and Co. MD mechanism on iron and low‐alloy steels has been studied in recent times by Grabke and coauthors. The suggested mechanism may be summarized as formation of metastable cementite and its subsequent decomposition into graphite and iron during MD conditions (Figure 9.9). Figure 9.9 Schematic illustration of the metal dusting mechanism on iron and low‐alloy steels from Grabke (1995): (a) supersaturation of the metal matrix by carburization, (b) formation of Fe3C at the surface with growth from the interior, (c) deposition of graphite onto the Fe3C surface, and (d) Fe3C decomposition and outgrowth of coke by carbon deposition on the metal particles from the Fe3C decomposition. Based on the model, the prerequisite for MD to occur is a high carbon activity environment (aC > 1.0) that causes the oversaturated metal with the carbon activity being more than 1. This condition promotes the formation of cementite (Fe3C) on the metal surface. Constructed thermodynamic graphs of carbon activity as a function of gaseous composition in terms of ( Figure 9.10 Fe–C–O metastable phase stability diagram showing that metastable cementite (Fe3C) forms under high carbon activities (aC > 1) at 700 °C and lower (Bonnet et al. 2003). The mechanism of MD on Ni and Co is predicted to be the same and involves formation of neither carbides (Chun et al. 2003) nor oxides in typical MD environments. Instead, a direct fragmentation takes place by graphitization, i.e. type II mechanism (Chun et al. 2003; Pippel et al. 1998). This mechanism was first described by Hultgren and Hillert during the 1950s in a study of binary Fe–Ni alloys (1953). Ni and Co have similar properties in typical MD environments (Hochman 1972; Olsson and Turkdogan 1974; Smalley et al. 2002): These properties promote type II mechanism – disintegration of a carbon‐supersaturated matrix by internal graphite formation. Initially, larger metal fragments may be released from the MD front. These larger metal pieces are subjected to continued fragmentation until they finally may be too small for inward growth of graphite or graphite nucleation in their interior and the continued formation of solid carbon will occur on their surface. The final metal dust is typically in the nanometer scale, resulting in carbon nanotube formation. The mechanism for MD on chromia‐forming alloys is considered to be similar for austenitic iron‐based alloys and Ni‐based alloys. In publications by Grabke (1995, 2003), the MD of high‐alloyed steels and CrFeNi alloys were described with the schematic in Figure 9.11. Figure 9.11 Schematic representation of the MD mechanism on high‐alloyed steels and CrFeNi alloys taken from (A) Grabke (1995) and (B) Grabke (2003). The proposed mechanism includes the following main steps: The above proposed mechanism implies that oxidation is not involved in the MD process, only in the subsequent breakdown of the corrosion products. This is contradicted by a number of metallographic observations on CrFeNi alloys such as stainless steels alloy 800 and Inconel 600 (Baker and Smith 2001; de Bruyn et al. 2001; Levi et al. 2001; Strauss et al. 1999; Toh et al. 2002). All these observations indicate that oxygen is active in the MD process. Pippel et al. (1995) and Schneider et al. (1999) propose a somewhat modified mechanism for Cr‐containing Ni‐based alloys as shown in Figure 9.12. Figure 9.12 Schematic representation of the processes and reaction layers involved in metal dusting on Cr‐containing nickel‐based alloys (Inconel 600) from Schneider et al. (1999). This modified mechanism includes the following main steps: Again, the oxygen is not taking part in the suggested MD mechanism, and it is unclear what happens to the Cr atoms in the steady‐state corrosion process. It should be mentioned that nickel‐based alloys, typically of composition around 20Cr80Ni, may also be attacked by another high temperature corrosion phenomenon denoted “green rot”; the term has been coined because the fractured surfaces have a green appearance due to the formation of Cr2O3. Although green rot is a very old problem, it is described in only a few literature references. This is largely because its occurrence is limited to a narrow range of environmental parameters and to temperature range of 900–1150 °C (Betteridge 1959; Kofstad 1988; Naumann and Spies 1977; Skarda 1986). The gas environment must be reducing or at least periodically reducing with respect to the bulk metal (Ni and/or Fe) although oxidizing for Cr (Skarda 1986). The term “green rot” has also been applied to alloys exposed to oxidizing and carburizing atmospheres, which result in internal oxidation of previously formed grain boundary Cr carbides, giving the same appearance with green chromia on the fractured surfaces (Kofstad 1988). This form of green rot may thus show some similarities with MD. However, in synthesis gas mixtures in the temperature range of 540–650 °C, the overall corrosion process is far more complex. The corrosion attack described here, with hemispherical pit formation and dark/black corrosion products, consisting of metal particles, graphite and spinel oxides, is typical of MD. Type III mechanism was first identified on an AISI 304L‐type stainless steel exposed at 650 °C in a CO‐containing gas mixture (Szakálos et al. 2002; Szakálos 2003). Scanning electron microscopy (SEM) images of MD reactions in AISI 304L stainless steel led to the sketch in Figure 9.13 that shows 6 MD steps (Szakálos 2003): Figure 9.13 The mechanisms of metal dusting as they appear on stainless steels. They include an active corrosion process with carbon and oxygen (type III), in combination with fragmentation by graphitization (type II). The fine‐grained austenite/graphite layer (zone 4) promotes the Cr diffusion and consequently oxide formation. The corrosion products consist of Fe–Ni austenitic metal dust, spinel oxides, and elementary carbon, but no carbides. The main reactions of type III mechanism are presented below. In order to point out the main solid‐state reactions, intermediate reactions in the gas phase are excluded. Consider 10 atoms of AISI 304L steel of composition 18Cr–10Ni–72Fe in wt%, i.e. an approximate atomic ratio of 2Cr–1Ni–7Fe. The following reactions show the steps involved in a fully equilibrated carburization and MD process in a CO/H2‐containing gas (aC ≥ 1.0). Schematically, the mechanism reactions may be divided into two stages: Carburization (zones 1 and 2 in Figure 9.13) and carbide dissolution by selective oxidation (zones 3–5) where γdust is austenitic particles, i.e. metal dust. As shown in Figure 9.13, carbides do not oxidize directly, but they dissolve first and Cr diffuses through the carbide‐free austenite (zone 4) and reacts with oxygen. The equilibrium corrosion products are thus austenitic (Fe–Ni) metal particles, Cr–Fe spinel oxides, and elementary carbon. The carbide is a necessary reaction intermediate, and the overall reaction simplifies to The summary reaction will be identical in the case of oxidation of cementite or M23C6 carbides instead of M7C3 carbides; it is only the carbon and CO content in Reactions 9.26 and 9.27 that differ. From the overall reaction alone, it seems that MD of stainless steels by CO is basically degradation by oxidation, but, as discussed above, a more correct description is to see MD as active corrosion by carbon since carbon reacts and is then released but not consumed. There is one major difference between the two active corrosion processes. In the case of chlorine‐induced corrosion, virtually all metal atoms react chemically to form corrosion products. In the case of MD, according to the above reactions, only around 30 at.% of the steel reacts chemically to form corrosion products, and the remaining 70% forms metal particles or dust without any chemical reaction. These proportions correspond surprisingly well to SEM observations in the active reaction front in an MD pit. In fact, in some cases only a fraction of 30 at.% have to react when the attack (type III) penetrates subgrain boundaries. Process equipment failures due to MD were reported in the refinery industry during the 1950s. Eberle and Wylie (1959) reported metal wastage of uncooled components, such as soot‐blower elements, made of types 347SS and 310SS in the waste heat boiler of a synthesis gas reactor. The synthesis gas, predominantly CO and H2 with some water vapor and carbon particles, was produced by combustion of methane and oxygen. The wastage took place at temperatures between 480 and 900 °C. Both 347SS and 310SS suffered severe metal wastage after only three weeks of service. MD problems were also encountered in reforming plants where a synthesis gas (i.e. H2 + CO) for methanol manufacturing was produced. Type 304SS and 310SS reformer outlet tubes were perforated by severe pitting attack at 650–725 °C. Hydrodealkylation units, acetic acid cracking furnaces, and coal gasification plants were reported to suffer MD problems. Perkins et al. (1976) reported pitting attack of alloy 800 tubes in a preheater for gasifier recycle gas rich in H2 and CO with some H2O. The tubes, with a wall thickness of 0.38 cm (0.15 in.), were perforated in a few thousand hours. The attack occurred at 540–870 °C. MD has also been encountered in the heat treating industry (Lai 1985a,b). Refractory anchors, fan housing assemblies, and other components in carburizing furnaces frequently suffer MD problems. Alloys typically used include stainless steels, such as type 310; nickel‐based alloys, such as alloys X and 333; and iron‐based alloys, such as Multimet alloy (or N‐155). MD typically occurred at temperatures between 540 and 820 °C. Severe attack frequently took place after one year of service and at locations where the gaseous environment became stagnant. Ferritic Fe–Cr alloys are more resistant to MD than austenitic Fe–Ni–Cr alloys presumably due to much faster chromium diffusion rates, thus resulting in faster formation of chromium oxide scales, and then better MD resistance. Rapid diffusion of chromium to the metal surface to form a protective chromium oxide scale is important in retarding MD attack. Accordingly, for the same alloy, a fine‐grained material can form a surface oxide scale more readily than a coarse‐grained material – thus better MD resistance (Grabke et al. 1998). Types 304, 310, and 800H – which are Fe–Ni–Cr alloys – were found to suffer MD attack (i.e. the reaction rates in weight loss), while two nickel‐based alloys (alloy 601 and RA333) showed no MD attack (i.e. the reaction rates in weight gain). This was due to beneficial effect of silicon along with aluminum in the alloy. The beneficial effects of silicon and aluminum are demonstrated by additions of these two elements to alloy 800 (Fe–20Cr–32Ni), as shown by Strauss and Grabke (1998); also in this study, other alloying elements such as niobium, molybdenum, and tungsten were found to have some beneficial effects as well. In reviewing data on Ni–Cr alloys, Grabke (2003) found that Ni–50Cr alloy was very resistant to MD, showing a thin chromium oxide scale (about 3 μm thick) after testing in H2–49CO–2H2O at 650 °C (aC = 18.9) for 10 000 hours with no evidence of MD or carburization. Only minute amounts of coke were observed on the specimen surface. Under this test condition, alloy 601 had already suffered MD attack after only 1993 hours of exposure. Similarly, a very thin chromium oxide scale was observed in Cr–5Fe–1Y2O3 after 10 000 hours of exposure in the same test, showing no evidence of MD attack. From the discussion so far on MD, formation of a good protective chromium oxide scale is a very effective way to provide protection against MD attack. Since the temperature range for MD attack is quite low and chromium diffusivities are relatively low at these temperatures, rapid formation of a good protective chromium oxide scale is critical. Accordingly, the concentration of chromium at the surface of the metal becomes important. Higher chromium concentration at the metal surface provides faster formation of a protective chromium oxide scale. Thus, alloys with higher bulk chromium concentration (higher surface chromium concentration) are more resistant to MD. Also, for the same alloy, the fine‐grained structure exhibits better MD resistance than the coarse‐grained structure. This is because grain boundaries provide fast diffusion paths for chromium to reach to the metal surface. A fine‐grain‐sized material will have more grain boundaries and, thus, more chromium reaching to the metal surface to form a better chromium oxide scale faster than a coarse‐grained material, thereby resisting MD attack much better. The surface of the metal can also be prepared by grinding or machining to produce a thin cold‐worked layer with high density of dislocations, which also provide fast diffusion paths for chromium to reach to the metal surface to form a protective chromium oxide scale. As a result, MD is greatly improved when the surface is ground or machined. The beneficial effect of the ground surface condition is illustrated in a thermogravimetric study by Grabke (2003). For both alloy 800 and type 310SS, the as‐ground specimen was most resistant to MD compared with the as‐received surface (cold rolled) and electropolished surface. Electropolished surface condition was the worst because of possible surface depletion in chromium during electropolishing. Selection of an appropriate filler metal for MD environments is also critical since not every wrought alloy has a matching filler metal. Thus, it is necessary to select a filler metal that is, at least, as good as but preferably better than the wrought alloy selected for the application. The suitable filler metal requires not only good resistance to MD but also good weldability. Also, in many cases, machining or grinding the weld joint may not be possible, particularly in tubular butt welds where inside diameter (ID) grinding or machining is not feasible after joining. Furthermore, alloys that resist MD contain high aluminum or silicon along with high chromium, as discussed previously. If matching filler metals are available for these alloys, the weldability of these high aluminum or high silicon filler metals can be an issue. Sulfur that has a strong tendency to segregate to the surface and grain boundaries can act as an inhibitor to MD. Hochman (1977) first reported the beneficial effect of sulfur against MD attack. Extensive investigations on the effect of sulfur on MD behavior of iron were carried out by Grabke and Muller‐Lorenz (1995, 1998), Schneider and Grabke (2003), and others. The mechanism for sulfur to inhibit MD attack, as proposed by Grabke and Muller‐Lorenz (1995), is that the absorption of sulfur on the surface of cementite suppresses the nucleation of graphite, thus inhibiting MD attack. Grabke (2000) avoided MD by sulfur injection under certain
Chapter 9
Carburization and Metal Dusting
9.1 Introduction
9.2 Carburization


 and
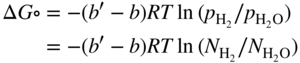
and  are the mole fractions of hydrogen and water vapor in the gas mixture, respectively. Assuming that the activities of the condensed phases are unity and that the gases show ideal behavior, ΔG° is independent of the total pressure p, and the gas composition is a function of temperature only. Under these conditions, the equilibrium is considered as pseudo‐invariant.
 (or
(or  ) versus f(T) plots (Chaudron diagram) or as
 versus 1/T. In effect, Eq. 9.10 can be written as
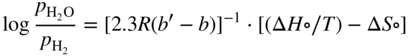
 is a linear function of 1/T, as represented in Figure 9.1. The straight line marks the boundary between the stability domains of each oxide, i.e. M2Ob and M2Ob′.
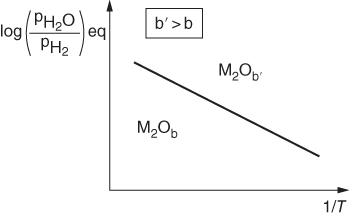
 or
or  versus 1/T.
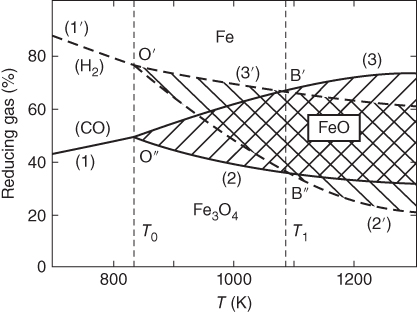
 ratio or of the
  ratio (COACH data bank 2002).


 , hydrogen potential,
  , methane potential,
  , and other potentials, can be determined using a commercial software program such as HSC Chemistry for Windows (HSC 2006, Finland), ChemSage/FactSage (GTT 2015, Germany), and Gemini (Thermodata 2002, France).
 ,
, ,
,  , etc., and in complex gas mixtures such as H2–CH4–H2S, H2–CO–H2O–H2S, as well as reported in the open literature (Barralis and Maeder 1997; Christ 1998; Coltters 1985; Forseth and Kofstad 1998; Grabke 1998a, b, Jakobi and Gommans 2003; Nishiyama et al. 2003; Rocabois et al. 1996; Yazawa 1979).

Phase formed in the steel matrix
Phase stability conditions regarding carbon and/or oxygen content
Phase density (g cm−3)
Calculated volume expansion when the phase is formed in a AISI 304L steel, EPBR
Reference (304L)
7.9
1.00
304 + 1 at.% C
7.9
1.0087a
M23C6
≤2.3 wt% C
6.97
1.20
M7C3
≥1.2 wt% C
6.9
1.25
Graphite
≥3.5 wt% C (ac ≥ 1)
2.26
∞ or 1.06b
(Fe,Cr)3C
ac ≥ 2.1
7.66
1.11
Ni3C
ac ≥ 39
7.96
1.06
Cr3C2
ac ≥ 600
6.68
1.35
Cr2O3
10−31 ≤ pO2 ≤ 10−28 (ac ≤ 1800)
5.21
2.17
(Cr2Fe)O4
pO2 ≥ 10−28 (ac ≤ 190)
4.8
2.28
FeO
pO2 ≈ 10−23 (ac ≤ 2.1)
5.7
1.79
NiO
pO2 ≥ 10−18 (ac ≤ 39)
6.67
1.53
(Fe2Ni)O4
pO2 ≥ 10−22 (ac ≤ 1016)
5
2.19
Cr2N
≤1.8 wt% C
6.8
1.31
CrN
≥1.8 wt% C
6
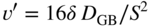
1.65
 = ρPhase with reduction of the mass contribution of the element C, N, or O; mi = niMi = (number of C, O, or N atoms in the empirical phase formula) × (molar weight); and mme = nmeMme = (number of metal atoms in the empirical phase formula) × (molar weight).
9.3 Alloy Resistance to Carburization
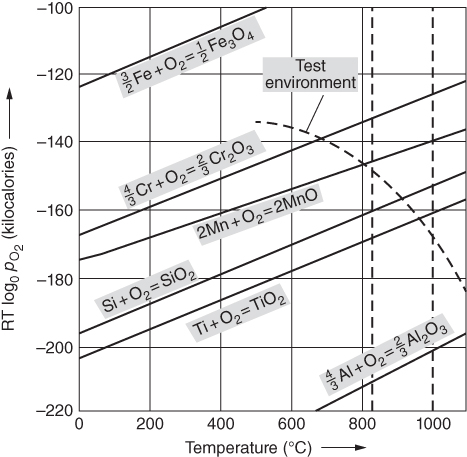


9.4 Metal Dusting Problem
9.5 Metal Dusting Mechanisms
9.5.1 Type I Mechanism
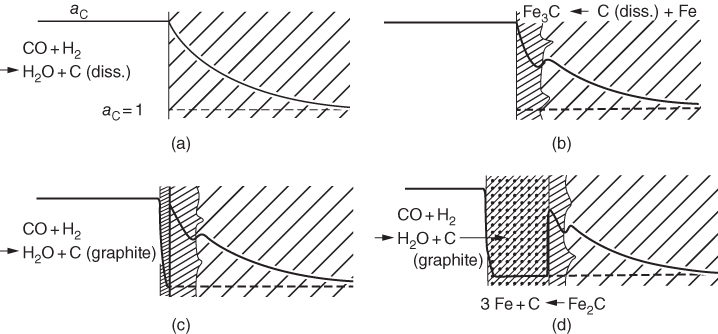
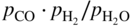 ) ratios for various temperatures (400–1000 °C) show that the carbon activities in equilibrium with cementite are higher than 1.0 at 700 °C and lower temperature. Figure 9.10 shows a metastable Fe–C–O phase diagram at 600 °C, indicating that metastable cementite forms at aC > 1.0 (Bonnet et al. 2003). Once graphite deposits on the cementite with the carbon activity of the graphite at 1, cementite in contact with graphite becomes unstable and then decomposes into iron and carbon with iron migrating outward into the graphite layer. As a result, metal wastage takes place as a repeated reaction of formation of metastable cementite and decomposition of cementite into iron and carbon. For iron and low‐alloy steels with no protective oxide scales, metal wastage attack in general follows uniform metal thinning (Grabke 1998a). A layer of cementite (Fe3C) was found to occur on 1Cr–0.5Mo steel after exposure to MD conditions with a layer of coke on top of the cementite (Grabke 1995).
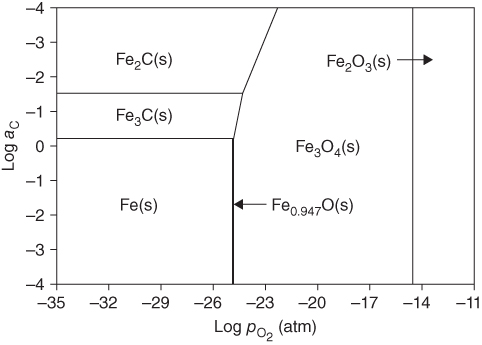
9.5.2 Type II Mechanism
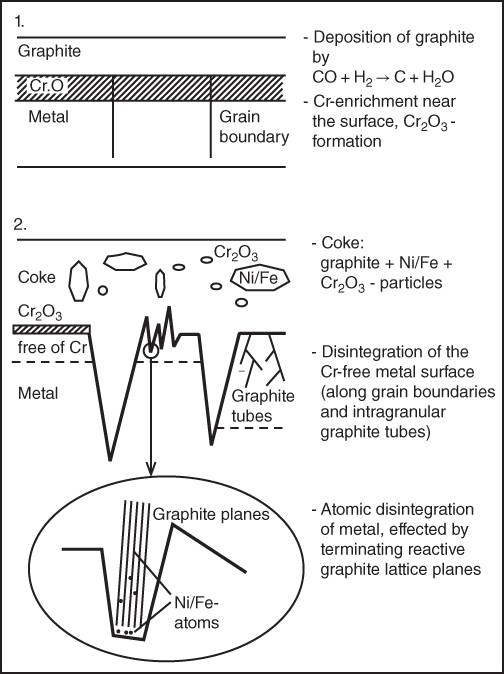
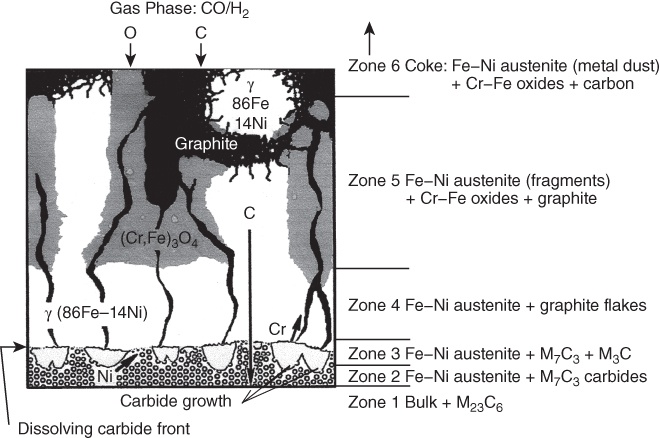
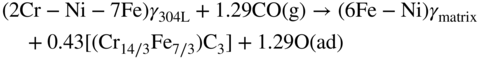
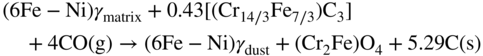
9.5.3 Type III Mechanism
9.6 Alloy Resistance to Metal Dusting
 ratios at temperatures from about 500 to 1000 °C. Injecting a right amount of sulfur into the environment to retard MD without causing accelerated sulfidation attack is a balancing act.
References
Further Reading
Carburization and Metal Dusting
9.1
9.2
9.3
9.4
9.5
9.6
9.7
9.8
9.9
9.10
9.11
9.12
9.13
9.14
9.15
9.16
9.17
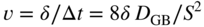
9.18
9.19
9.20
9.21
9.22
9.23
9.24
9.25
9.26
9.27
9.28