“The liquid distributor is often considered to be the most important part of a packed bed design. A good distributor cannot make a bad packing perform well, but a bad distributor can certainly make a good packing perform poorly” —(Dhabalia and Pilling, Ref. 83) Figure 4.1 shows two of the most common basic types of liquid distributors. An orifice pan distributor (Figure 4.1a) is a pan containing evenly spaced floor perforations, which may be equipped with short tubes, through which the liquid is distributed to the packed bed below, and with round or rectangular riser tubes through which vapor from the bed below passes without contacting the liquid. Liquid is usually fed to the distributor by an elbowed-down pipe above its center or by a pipe with downward-pointing perforations above its center. In a trough distributor (Figure 4.1b), liquid is fed to a rectangular box called a parting box. The parting box contains holes that apportion the liquid to the troughs below, such that the larger troughs receive more liquid and the smaller ones receive less. The troughs contain evenly spaced openings, either at the bottom (visible in the three troughs in the bottom left of the photograph), or in the side of the troughs near the bottom with downward-deflecting baffles or downflow tubes, through which liquid descends onto the packed bed below. Liquid is fed to the parting box by a central sparger pipe along its length with downward-pointing perforations which may be equipped with downflow tubes. Many additional features are often incorporated to optimize the performance of either distributor type. Additional common distributor types are notched distributors (Section 4.14) and spray distributors (Section 4.15). Troubleshooting Our malfunctions survey (198, 201) found liquid distributors to be the second most troublesome internal in distillation towers. The number of malfunctions was higher in chemical than in refinery towers, probably due to the wider spread application of packings in chemical towers. The survey identified liquid distributor issues as the prime malfunction in chemical towers. Plugging and overflow were the two major liquid distributor issues. Good filtration and fouling-resistant distributor designs were effective cures. While overflows were often caused by plugging, many more resulted from distributor overloading caused by excessive liquid flows, insufficient orifice area, and hydraulic problems with the feed entry. Figure 4.1 Two common types of packing liquid distributors (a) an orifice pan distributor, (b) a trough distributor with a parting box metering liquid to the troughs. (Part (a): Courtesy of Koch-Glitsch, LP; Part (b): Copyright © FRI. Reprinted Courtesy of FRI.) Poor irrigation quality, fabrication/installation issues, and poor feed entry configurations were other common issues (198, 201, 239). Poor irrigation quality, which the literature has focused on, accounted for only 20% of the reported liquid distributor malfunctions. The more troublesome items, such as plugging, overflows, and feed entry, received disproportionally less attention. Feed entry issues, such as excessive velocities, splashing, and poor orientation of the feed pipes, frequently caused poor packing efficiencies. Flashing feed entry into a liquid distributor has been especially troublesome and a fertile source of malfunctions. Inadequate hole pattern, distributor damage, infrequent redistribution, out-of-levelness, insufficient mixing, and interference with hold-downs constitute the remaining common issues (198, 201, 239). Surprisingly, distributor out-of-levelness was low on the list. Insufficient mixing was mostly troublesome in larger diameter (>10 ft ID) towers and in certain applications like extractive distillation. Olsson’s (346) classic article has been the leading reference for distributor troubleshooting. His key advice is “ASSUME NOTHING.” Olsson advocates critically examining the fouling potential and possibility of vaporization in streams entering the distributor, testing distributors by running water through them at the design rates, either in the shop or in situ, and finally, good process inspection. Following Olsson’s guidelines would have prevented more than 80–90% of the reported liquid distributor malfunctions in Refs. (198) and (201). Vapor is easier to distribute than liquid, but since common vapor-distributing devices are far less sophisticated, it is not trouble-free. The prime source of vapor maldistribution has been undersized reboiler return or gas inlet nozzles, which shoot high-velocity jets into the tower (198, 201). These jets persist through low-pressure drop devices like packings. Interference with packing support beams has also been troublesome. Installing vapor distributors, improving vapor distributor designs, and even using inlet baffles have alleviated many of these problems. This section describes key techniques for diagnosing the nature and cause of maldistribution. Gamma scans (Chapters 5 and 6) and thermal wall measurement by pyrometers or thermal cameras (Chapter 7) provide additional excellent diagnostics. Drawing to-scale sketches is powerful for diagnosing point of transition issues (Chapter 8) at feed and vapor entry and redistribution. For maximum effectiveness, the troubleshooter is advised to combine these techniques. A rule of thumb for packing HETP (in inches), as a function of ap, the packing surface area per unit volume (m2/m3), gives: For organic and hydrocarbon systems, surface tension <25 dynes/cm: Multiply the above values by two for water due to its higher surface tension (70 dynes/cm). For intermediate surface tensions, interpolate. These rules of thumb are generally plus or minus 25% and assume good industrial-grade liquid and vapor distribution (not perfect distribution like in test columns). Measured HETP values that are significantly higher indicate possible or likely maldistribution. Recognizing maldistribution The key tool for recognizing maldistribution is the above rules of thumb. Derive the HETP from a simulation that correctly reflects the plant data (follow all the recommendations in Chapter 3), and compare it to the above rules. An HETP >20–30% than the rules of thumb suggests possible maldistribution. An HETP twice that calculated from the rules of thumb signifies a highly likely maldistribution. Closely review the VLE and thermal property data or correlation used in the simulation. Errors in the VLE and thermal properties produce major errors in the HETP determination (Section 3.1.6, items 1 and 2). The author experienced cases where maldistribution was incorrectly identified or not identified due to erroneous VLE or thermal properties in the simulation. Symptoms of flooding in the bed (Chapter 2) also suggest possible maldistribution. Sometimes flooding causes maldistribution; other times, maldistribution leads to premature flooding. Gamma scans (Chapters 5 and 6) and wall temperature measurements (Sections 7.1.3, 7.2.2, 7.2.3) are especially valuable for detecting flooding and plugging. Temperature inversions (upper temperatures being hotter than lower temperatures) may also suggest maldistribution. One case study was described (480) and the author experienced others. However, temperature inversions can also suggest other issues such as the presence of a second liquid phase (Section 7.1.5) or a chemical reaction. This topic is discussed at length with extensive literature citation in Kister’s book (193) and Perry’s Handbook (245). Below is a summary focusing on diagnostics rather than design: Figure 4.2 shows the Moore and Rukovena (326) empirical correlation for efficiency loss due to liquid maldistribution in packed towers containing Pall® rings or IMTP® packing. This correlation is simple to use and was shown to work well for several case studies (Figure 4.2), making it valuable, at least as a preliminary guide. The quality of liquid irrigation is expressed by the Moore and Rukovena distribution quality rating index (Section 4.10). Typical indexes are: Locckett and Billingham (36, 301) modeled maldistribution as two columns in parallel (Figure 4.3a), one receiving more liquid (1 + f)L and the other less (1 − f)L, with the vapor assumed to be equally split between the columns. f is the maldistribution fraction, and L is the liquid flow rate in molar units. At the different L/V ratios, the overall separation is inferior to that at uniform L/V. As the maldistribution fraction f increases, the effective number of stages in the combined two-column system declines (Figure 4.3b). The decline is minimal when the maldistribution fraction f is small or in short beds (e.g., 10 theoretical stages), as noted earlier by Strigle’s extensive experience (462). Figure 4.2 Effect of irrigation quality on packing efficiency. (a) Case histories demonstrating efficiency enhancement with higher distribution quality rating. (b) Correlation of the effect of irrigation quality on packing efficiency. (From Moore, F. and F. Rukovena, Paper presented at the 36th Canadian Chemical Engineering Conference, October 5–8, 1986. Reprinted Courtesy of F. Rukovena, Consultant.) Figure 4.3b shows that beyond a limiting maldistribution fraction fmax, the required separation cannot be achieved even if the bed is tall enough to provide many stages. Physically, at fmax the liquid-deficient column becomes pinched. Figure 4.3c shows that the steep drop in packing efficiency due to this pinch occurs earlier when the bed contains many stages and that the efficiency loss can be tremendous. For fmax in a binary system, Billingham and Lockett derived the following equation: Figure 4.3 Lockett and Billingham’s model for efficiency loss due to maldistribution as a function of maldistribution fraction f and the number of stages per bed for a given case study (a) the parallel-column model; (b) fmax and reduction in number of stages. (c) Showing larger efficiency loss at higher number of stages per bed and higher f. The steep drops indicate pinching associated with fmax. (From Billingham, J. F., and M. J. Lockett, Transactions of the Institution of Chemical Engineers, 80, Part A, p. 373, May 2002. Reprinted Courtesy of IChemE.) In Eq. (4.1), x and y are mole fractions of the more volatile component in the liquid and vapor leaving a stage, respectively, and the subscripts 0, 1, N, and N + 1 signify stage numbers, with 0 being the lowest stage and N + 1 the top stage. This equation permits the calculation of fmax directly without the need for a parallel column model. The terms in Eq. (4.1) can be readily calculated from the output of a steady-state commercial simulation. This method can be extended to multicomponent systems either by lumping components together to form a binary mixture of pseudolight and pseudoheavy components or by normalizing the mole fractions of the two key components. Once fmax is calculated, Billingham and Lockett propose the following guidelines: Figure 4.3c shows that shortening the bed can increase fmax. Relative volatility and L/V ratio also affect fmax. The bed length and L/V ratio can often be adjusted to render the bed less sensitive to maldistribution. Analysis of field data using similar principles was discussed by Krishnamoorthy and Yang (264). Effect of bed length Both Figures 4.2 and 4.3 show that as a packed bed grows taller, it becomes more sensitive to maldistribution. This is supported by Fractionation Research Institute (FRI) data presented by Shariat and Kunesh (428). In several case studies (178, 201, 285, 301), splitting a bed into shorter beds with redistribution in between largely improved separation. Rules of thumb that recommend limiting packed bed height range from the more conservative that recommend limiting bed heights to <20–25 feet (68, 192, 285, 459), and <10 stages per bed (173, 192) to the less conservative that increase the limits to <30 feet (462) and <15 (53, 462) or <15–20 (262, 458, 459) stages per bed. Effect of irrigation point density A minimum of four irrigation points per square foot has been recommended, with 6–10 per square foot being ideal (40, 192, 338, 362, 450, 462). For high purity separations and clean services, a higher number of 10–14 was recommended (40). Commercial-scale tests with both random and structured packings of specific surface areas of 250 m2/m3 or less showed no improvement in packing efficiency by increasing the irrigation point density above 4/sq ft (103, 349). So going to higher point densities provides little efficiency benefit while leading to smaller holes, which makes the distributor more prone to plugging. With high surface area structured packings, a larger irrigation point density was shown to help packing efficiency (349). It has been recommended to use irrigation point densities per square ft >12 for 350 m2/m3 packings; >16 for 500 m2/m3 packing; and >20 for higher areas (262). The following steps have been recommended: Figure 4.4 shows samples from the feed stream to a chemical column in which trays were replaced by packings (201, 346, 347). Prior to the retrofit, Operations reported no solids in the feed. Samples were drawn and showed coloration (similar to samples 1, 2, and 3 in Figure 4.4) but no solid deposits. After startup, the feed distributor plugged up, causing massive maldistribution, poor packing efficiency, and a capacity bottleneck. Feed samples 1, 2, and 3 show colorations, but there is no telling whether these indicate suspended solids. The clear sample on the left, drawn after a fine filter was installed on the feed stream, clearly shows that the colorations were due to suspended solids. Deposits were also observed when the color samples were allowed to settle over a week or two. The filter eliminated the plugging problem. When Operations say they have no problem with solids in the tower, their concise statement should be interpreted as “we have not seen solids in the feed, nor have we experienced fouling issues with our existing (at the time, trayed) internals.” Packing distributors and many packing types are far more prone to solids than trays, so a solids issue hidden in a tray tower may become apparent following a packing retrofit. Figure 4.4 Samples of a tower feed stream (1, 2, and 3), showing coloration. It is impossible to tell whether the coloration is due to suspended solids or dissolved material. The clear sample on the left, taken after a feed filter was installed, shows that in this case the coloration was due to suspended solids. (From Olsson, F. R., in “Distributors that Worked and those that Did Not,” Paper presented at the AIChE Spring National Meeting, Houston, Texas, March 14–18, 1999. Reprinted Courtesy F. R. Olsson.) Have Mechanical check that the filter screens and baskets are adequately mounted. Liquids can easily find a path around an improperly mounted basket. Check the filter pressure drop and log it over a time period. Loss of pressure drop across a filter may signify a damaged or removed basket. Check the frequency of filter cleanings. Expect a high frequency during startup and initial run, as the feed moves along residual solids lodged in the line. Closely watch the action of the Operations team. When cleaning is too frequent, especially during startup, baskets are often completely removed, resulting in solids ending up in the distributors or packings (e.g., 216, Case 1). Line up additional personnel to help during these busy periods. Refer Section 10.3.11 for additional recommended filter checks. With reactive components at high temperatures, elevating holes needs a careful review. Below the perforations, the liquid residence time is high, and when “cooked” by hot vapor, it can undergo undesirable reactions, polymerize, or turn into tars or sludge. Figure 4.5 Wall perforations in a trough distributor. The distributor liquid issues via two perforations, the lower one a short distance (about 1″ or 2″) above the floor, the upper one higher up. The exiting liquid is directed downwards into the packings by the downflow tubes. (Reprinted Courtesy of Sulzer Chemtech.) Overflows are the most common distribution issues, often referred to as “Death to packed beds.” An overflow occurs when the liquid in the distributor rises above the top of the distributor troughs or risers and pours out. The overflowing liquid will be maldistributed to the bed below. This is if one is lucky. If one is not lucky, the vapor flow between the troughs or in the risers will be too high to permit liquid descent. Typically, the vapor rise area of a pan distributor is of the order of 25% of the tower cross-section area, and that of a trough distributor is about 50% of the tower cross-section area. The vapor velocity, and therefore the C-factor (Eq. 2.1), in the vapor risers of a pan distributor, or between the troughs of a trough distributor, will therefore be four or two times, respectively, higher than that in the bed below. In the absence of overflow, the higher vapor velocities will be harmless, and operation will be normal. If an overflow occurs and the system limit C-factor is exceeded in the risers or between the troughs, the overflowing liquid will be blown upward by the vapor and accumulate above the risers or troughs, initiating flood. The accumulating liquid may be blown into the bed above, propagating the flood up the tower, or when enough head builds up, the liquid may dump through some of the vapor passages, initiating alternating steps of buildup and dump, which destabilize the tower. Section 8.11 describes case studies of system limit floods initiated by a similar mechanism. Many of these were due to overflows, but others were due to high C-factors between the hats of redistributors or collectors. Increased reflux and boilup test If there is no overflow, the separation should improve. An overflow-initiated flood would usually cause separation to deteriorate. In Case 7.1 in Ref. (201), and in many other cases experienced by the author, up to a certain reflux flow rate, separation improved. When the reflux flow rate was raised beyond that, the distributor or collector overflowed, flooding initiated, and the separation deteriorated. In one caustic absorber (77), raising liquid circulation worked well up to a limit, beyond which overflow occurred, initiating flood which caused caustic carryover from the top of the tower. This was identified by an in situ water test during an outage. In distributors and redistributors Overflow-induced flooding (Section 4.6.1) that propagates up the tower is most severe with pan distributors due to their small riser areas. Trough distributors have much larger vapor passage area, which often allows channeling of vapor through some of the vapor passages with the overflowing liquid finding its way down through the others. Sheet or rivulet formation by the overflowing liquid makes it easier to descend. This drains the accumulating liquid and alleviates the flood, at the expense of severe maldistribution and efficiency loss in the bed below. The overflow process may unpredictably alternate between flooding, flooding and dumping, and the channeling modes, generating tower instability. The troughs in some distributor designs contain slots near the top that direct overflowing liquid into guide tubes, that in turn take this liquid to the bed, out of the path of the vapor. These also minimize maldistribution. The effectiveness of these designs varies with the amount overflowing and the guide tube design. Figure 4.6a is a photograph taken during a turnaround in situ water test of a redistributor on the verge of overflowing. At that liquid flow rate, the tower worked well, but when raised beyond this point, an overflow occurred. Figure 4.6b is a close-up of two risers experiencing overflow in the water test. During normal operation, vapor flowing through the risers prevented liquid descent. Beyond the overflow rate, flooding initiated, propagating through the bed above and causing liquid carryover into the tower overhead product stream. Figure 4.6 Packing distributor overflow as photographed during in-situ water test. (a) froth/liquid reaching top of distributor vapor risers; (b) liquid pouring into vapor risers. During operation, vapor flowed through risers and entrained overflowing liquid. Diagnosing overflows The techniques below, as well as gamma scans (Chapters 5 and 6), and to a lesser extent, thermal scans (Chapter 7), have been effective for diagnosing overflows. An invaluable tool for diagnosing overflows is the head–flow relationship for packing orifice distributors, given by the Torricelli Orifice Equation: where Q is the liquid flow rate, gpm; KD is the orifice discharge coefficient, with a recommended value of 0.707 (68, 161, 192, 245); nD is the number of holes; dh is the hole diameter, inches; and h is the net liquid head, inches. The actual liquid height in the distributor, Hactual, can be obtained by applying buoyancy and pressure drop corrections to the net liquid head, both of which will tend to raise the liquid height in the distributor: where ρL and ρV are liquid and vapor densities, lb/ft3, and ΔPvapor rise is the vapor pressure drop through the distributor risers (pan distributors) or the vapor rise areas (trough distributors), inches of liquid. In most pan distributors, ΔPvapor rise is of the order of 0.25 in. of liquid (161, 192), and is less in trough distributors. For vacuum and atmospheric systems, the buoyancy correction is negligible, but it becomes significant at higher pressures (>50–100 psia). The vapor rise pressure drop can be estimated from Eq. (4.4) where VR is the vapor velocity through the risers or vapor passages, ft/s. KR is the hydraulic constant representing the number of velocity heads lost through the risers. As a conservative estimate, KR = 2.5, based on the head loss through an orifice. In reality, the riser is a short pipe with entrance and exit losses (hydraulic K’s of 0.5 and 1, respectively), giving KR = 1.5. The correct value is probably somewhere between, depending on the riser length, with KR = 1.5 more appropriate for long risers (>18″). Applying Eq. (4.2) for diagnosing overflows Consider a distributor with wall perforations about 1 in. above the floor. For turndown, a minimum net head of about 2 in. above the perforations is required. Turning up the flow to twice the minimum will raise the net head to 2 × 22 = 8 in. per Eq. (4.2). Since the perforations are already 1 in. above the floor, the liquid height will be 9 in. above the floor, assuming negligible buoyancy and pressure drop corrections in Eq. (4.3). If one wants to turn up the flow to quadruple of the minimum, the required liquid head above the perforations by Eq. (4.2) will need to be 2 × 42 = 32 in., which is 33 in. (=32 + 1) above the floor. To safeguard from overflow, the troughs need to be about 40 in. high. The author had never seen a commercial distributor with even close to 40 in. tall troughs. Typical trough heights in the industry are 8–12 in., mostly closer to 8 in.. Of these, the bottom inch is the elevation of the perforations above the floor, and the top inch is often slotted to permit orderly overflow should it occur. With 8 in. tall troughs, a liquid height of 9 in. above the floor will be 2 in. above the bottom of the overflow slots and will overflow into the vapor passages. With 12″ tall troughs, the liquid level will be 2 in. below the bottom of the overflow slots. This example illustrates why overflow is such a severe problem. Per the orifice Eq. (4.2), the liquid head rises parabolically with the liquid flow rate and very easily reaches the overflow. Taller troughs or risers will make the distributor much more robust for overflow prevention. Do not overlook the pressure drop term. In two small-diameter towers (1.25–1.5 ft), the vapor riser areas in pan distributors were about 10% of the tower cross-section areas, and the number of holes was excessive. The liquid head was nearly equal to the vapor pressure drop through the distributors. This is believed to have induced vapor to break through the distributor liquid, causing frothing, turbulence, and the observed poor efficiency (433). In parting boxes Overflows occur not only in the distributors but also in their parting boxes, which are (Figure 4.1) the boxes that split the incoming liquid to the various toughs of a distributor. Figure 4.7 shows a photograph of a liquid overflow in a water test of a model parting box. The consequences are much the same as those of a distributor overflow. Figure 4.7 A Liquid overflow in a water test of a model parting box. Figure 4.8 A water test of a sparger-fed model parting box shows significant aeration and frothing at the parting box, which raises froth heights to above the liquid head predicted by the orifice equation. Also note the clear liquid zone right under the tee. (From Kister, H. Z., “Practical Distillation Technology,” Course Manual. Copyright © 2020. Reprinted with permission.) In parting boxes, there is often considerable aeration, which drives up the froth level, resulting in an early overflow (247, 248). Water tests with the sparger-fed model parting box, as depicted in Figure 4.8, showed froth heights typically 20–30% taller than the liquid heads calculated using the orifice Eq. (4.2). Using dip tubes that bring liquid from the feed pipe to near the parting box floor eliminates the frothing, but generates a horizontal momentum effect that also causes the liquid head in the parting box to exceed the liquid head calculated using the orifice equation by 20–30% (249). Dip tube designs that break the momentum can reduce the parting box liquid heads to the values calculated using the orifice equation (249). Packed tower collectors are common overflow producers. From the collector, liquid descends to a redistributor either by downcomers, downpipes (most common), or by perforations. If the descent is by perforations, the orifice Eq. (4.2) can be used to check for overflow, with any possible aeration taken into account. If the descent is by downpipes or downcomers, the residence time of liquid on the collector between the overflow level and the top of the downpipe should be calculated. If this time is less than 30–60 seconds, the liquid is likely to be aerated and the downpipes need to be sized for self-venting flow, i.e., a flow pattern in which liquid descends while any trapped vapor bubbles disengage back up. Figure 4.9 shows an excellent correlation for self-venting flow, initially established by Simpson (439) and later by Sewell (425). Above the diagonal, the flow is self-venting. Below the diagonal, the downpipes are likely to choke, causing the liquid to back up the top of the risers, generating an overflow. The overflow liquid is maldistributed and may generate flooding just like other overflows. The correlation is often expressed (439) as maintaining the liquid Froude Number in the downpipes less than 0.31. Figure 4.9 A recommended correlation for self-venting flow. (From Sewell, A., The Chemical Engineer, No. 299/300, p. 442, 1975. Reprinted with permission.) The cases described in Refs. (416) and (417) are classic examples of painful collector overflow experiences. To improve the yield of the valuable jet fuel, trays in the jet fuel–diesel separation section (as well as other sections) of an atmospheric crude tower were replaced by structured packings. Upon restart, the separation worsened instead of improving, and the jet fuel yield was reduced by half. A superb troubleshooting investigation diagnosed the root cause to be collector overflow generating maldistribution in the jet fuel–diesel separation packed bed below. The liquid residence time in the collector was low, and the downpipes transporting its liquid to the distributor below were undersized for self-venting flow. Level measurements and gamma scans showed liquid level reaching the overflow, as well as pulsations indicating frequent intermittent dumps. Two years later, the same refinery performed a similar revamp in a parallel (second) crude tower of similar design. Incorporating the lesson learned, a chimney tray collector with downpipes sized for self-venting flow was specified to the supplier. Upon restart, jet fuel–diesel separation was not better, with low jet fuel yield again. Tests, simulations, gamma scans, and computer-aided tomography (CAT) scan pointed again to a collector overflow. This time, the overflow was caused by excessive hydraulic gradients on the chimney tray, incurred by chimneys perpendicular to the liquid flow, similar to the problem described in Section 8.10 and Figure 8.11a. Additional obstruction to liquid flow was due to triangular chimney reinforcements that severely hindered flow. Learning from these experiences, when the first unit was turned around, the collector was replaced with a chimney tray containing smaller chimneys that occupied less of the cross-section area and allowed liquid movement. The downpipes were replaced by down boxes with ample area for self-venting flow. This time, excellent separation and the desired yield were achieved. The second unit was less fortunate. After its revamp, it performed even worse than before (417). An in situ water test during an outage showed skewed liquid distribution. Visual observations and CFD showed that the long chimneys on the collector and their positions too close to downpipes and down boxes created “shadow” regions (Figure 8.22, Section 8.18, Case 2). The long chimneys obstructed liquid flow to these regions, so their down boxes received much less liquid than other unobstructed down boxes. Success was achieved by replacing with a new chimney tray in which liquid movement to the down boxes was unobstructed by chimneys. Reference (416) states that overflow from collectors that had low residence times and whose downpipes were undersized for self-venting flow occurred in two other refineries by the same company. All these towers were made to work by good chimney tray design. Case 7.1 in Ref. (201), as well as Refs. (129, 275), and (482) describe case studies of very poor packed tower performance resulting from collector overflows. The author is familiar with many more. A summary of the lessons learned for collectors is expressed in Ref. (417) “If it starts the wrong way, it will keep that way.” If the collector delivers an uneven feed to the distributor, distribution to the bed is likely to remain poor. Overflows due to plugging As stated earlier, typical liquid levels in commercial distributors at the design rates are not far from the overflow. Consider a trough distributor with 12″ tall troughs (which is taller than typical), holding 8 in. of liquid above wall perforations 1 in. above the floor. Should 15% of the holes plug, nD in Eq. (4.2) will become 0.85 times its previous value, raising the liquid head from 8 in. to (8/0.852=) 11 in., i.e., to the overflow (assuming no slots at the top). Even if the distributor operation was at turndown, and the liquid head were only 4 in. above the perforations, it would take only 40% plugging to get to the overflow (4/0.62 = 11 in.). So the liquid head again rises parabolically with the number of plugged holes. The result is that due to the parabolic relationship in the orifice equation, it does not take much plugging to generate an overflow. This also teaches that any significant plugging in a gravity distributor is likely to generate an overflow. For these reasons, overflow troubleshooting must be a priority on packed tower troubleshooting. Overflows due to impingement A vapor stream impinging on the liquid surface in a collector, parting box, distributor, or redistributor will generate waves and unevenness on the liquid level, with peaks that exceed the trough walls and bring about premature overflows. Carefully check using sketches to scale (Chapter 8) for vapor-containing feeds, or vapor issuing from chimneys and deflected downward by their hats, blowing on the liquid surface. Overflows in foaming systems Foam formation is likely to lead to liquid presence as a foam at taller elevations than those calculated from Eq. (4.2), and to premature overflows. Falling liquid promotes foaming, and liquid fall height should be minimized. Free fall of more than 6 in. should be avoided (40). Section 2.10 and Figure 2.27 describe relevant cases. Liquid maldistribution tends to lower packing turndown (192, 268, 462) The orifice Eq. (4.2) is also powerful for addressing distributor turndown. In the example in the previous section, the liquid head at maximum flow was 8 in. above the perforations. At half that flow (a turndown of 2:1), the head declined to (8/22=) 2 in. Often, 2 in. is considered the lowest head needed to ensure a reasonable distribution. If instead of a turndown of 2:1 it is desired to go to a 3:1, the liquid head per Eq. (4.2) will be (8/32=) 0.9 in. At such a low head, the liquid is likely to be maldistributed. Also, at this low head the distribution is likely to be sensitive to even small degrees of out-of-levelness, waves, turbulence, and uneven frothing. The turndown on most orifice distributors is about 2:1, which is limited by the orifice equation. Figure 4.10 Effect of maldistribution on packing efficiency at turndown. (From Kister, H. Z., “Distillation Operation,” Copyright © McGraw-Hill, 1990. Used with permission of McGraw-Hill.) There are certain features that packing suppliers often incorporate to enhance turndown. A common feature is using two perforations, one above the other, as shown in Figure 4.5. Often the perforations are of different sizes, the lower smaller ones active at low liquid rates, and both active at high liquid rates. This is not entirely trouble free. It may experience a “bump” when the liquid level just rises past the upper perforations, especially when these upper perforations are larger (which is often the case), as the liquid head building above the upper perforations will be too small to evenly distribute the liquid issuing from them. In a recent case, we identified this issue as one of the causes of poor packing efficiency experienced in a tower. Also, with two perforations along the wall, the lower ones usually need to be smaller, and therefore more prone to plugging, than with a single perforation. Figure 4.10 illustrates that packing turndown is drastically reduced by maldistribution. The “standard distributor” curve depicts typical variation of HETP with vapor or liquid load at a constant L/V ratio. The two upper curves depict a progressively lower quality of initial liquid distribution. The unevenness produced by maldistribution is amplified when the liquid flow rates and the liquid heads in the distributors are lower. A curve like the upper curve in Figure 4.10 is a clear indication of poor distribution. Out-of-levelness in distributors has been a common issue causing poor efficiency in packed towers, as demonstrated in numerous case studies (137, 201, 450, 483, 508). The orifice Eq. (4.2) is also powerful for addressing issues related to distributor out-of-levelness. In the example in the previous section, the liquid head at a turndown of 3:1 was about 1 in. Consider a tilt of 0.5 in., such that at the liquid head is 1 inch at the shallow end and 1.5 in. at the deep end. If the liquid flow rate at the shallow end (1 in. head) is 100 gpm, then at the deep end (1.5 inch head) the flow per Eq. (4.2) will be (100 × 1.50.5=) 122 gpm, a difference of 22%. Since most towers are designed to operate at 20–30% above minimum reflux (193), a 22% flow variation can easily get the bed section beneath the shallow end into a pinch, approaching or even falling below the minimum reflux. At this low liquid head, even a small amount of out-of-levelness will be disastrous to packing efficiency. Figure 4.11 Effect of simulated tilt on packing efficiency. (Reprinted with permission from Kunesh, J. G., L. Lahm, and T. Yanagi, Industrial and Engineering Chemistry Research, 26(9), p. 1845, 1987. Copyright (1987) American Chemical Society.) Furthermore, at such low liquid heads, part of the distributor where the liquid heads are low may approach drying up, making the problem even greater. Consider the same tilt when the liquid head in the distributor is at 8 in. The shallow end will have a liquid level 8 in. above the perforations, and the deep end will have a level of 8.5 in. If the liquid flow rate at the shallow end (8″ head) is 100 gpm, then at the deep end (8.5 in. head), the flow rate per Eq. (4.2) would be (100 × [8.5/8]0.5 = 103 gpm, a difference of only 3%. So at high liquid heads in the distributor, out-of-levelness is a much lesser issue than at low liquid heads. The author was involved with tilt testing on a specialty distributor. The tests found that a 0.5 in. tilt made little difference to packing HETP. This raised a few eyebrows until it was appreciated that the test was performed with a 10″ liquid head in the distributor. At such tall heads — and only at such tall heads — the distributor becomes tolerant to out-of-levelness. Figure 4.11 shows FRI test data (268) for separating C6 from C7 hydrocarbons in a 4 ft tower, packed with 1 in. Pall rings operated under different types of simulated maldistribution. The y-axis is the ratio of measured HETP to the base (excellent distribution) HETP. The two lower curves simulate distributor tilt, expressed as the ratio of liquid flow at the deep end to that at the shallow end (for instance, 1.25 means that the flow at the deep end was 1.25 times that at the shallow end). The x-axis is the percent of usable capacity at a constant L/V operation, so the higher this percent is, the higher the liquid flow rate and the higher the liquid head in the distributor. The diagram echoes the above message, showing a much greater effect of tilt at turndown, when the liquid head is lower. Closely review the out-of-levelness of the parting box. Parting box tilt will induce preferential higher flows to the troughs beneath the deep end and lower flows to those beneath the shallow end, as reported in one case (409). Hydraulic gradients, especially in narrow troughs, can also be troublesome. The hydraulic gradient in a trough can be calculated from (40, 192, 326) where Distributor troughs with floor perforations have less wetted area than those with wall perforations and, therefore, larger hydraulic gradients. It was recommended to keep the maximum transverse liquid velocity in the troughs less than 1 ft/s (40). The maximum value is at the point of liquid supply to the troughs. Feed entry ranks among the most common causes of maldistribution and capacity bottlenecks in packed towers. The following guidelines are recommended: An excellent evaluation method was developed by Moore and Rukovena (326). This method has gained wide acceptance (40, 192, 275, 336, 346, 347). Over the years, the author and his colleagues successfully extended this method to situations not addressed by the original Moore and Rukovena paper, and these extensions are incorporated in the following discussion. The Moore and Rukovena method calculates a distribution quality index DQ in percent, given by Typical values of DQ range from <40% for poor distributors, 40–70% for standard distributors, 75–90% for intermediate distributors, and >90% for high-performance distributors (326). To determine DQ, each distributor drip point is represented by a circle. The center of each circle is where the liquid from this point strikes the top of the bed. The total area of all the circles is set equal to the column cross-section area, so when all the drip points have the same diameter, the area of each circle equals the tower cross-section area divided by the number of drip points. An extension by the author for distributors containing drip points of different diameters still sets the total circle area to equal the tower cross-section area, but proportions the circle area for each hole size to its hole area. Figure 4.12 Reflux parting box fed by 70°F subcooled liquid via a central pipe. The parting box region under the pipe was repeatedly pushed downward. The terms in Eq. (4.6) are evaluated as follows (Figure 4.13a): Figure 4.13b–d illustrates the application of this technique to evaluate irrigation quality for various distributors. Figure 4.14a shows an application (346) in which this method diagnosed poor irrigation (DQ = 45%) as the root cause of high packing HETP. The distributor preferentially sent liquid to the outer regions at the top and bottom of the diagram. Replacement by a high-performance distributor (DQ = 90%; Figure 4.14b) improved staging by 40%. Application of the Moore and Rukovena method to trough distributors with side holes and external drip guides directing the liquid into the packings (336) is illustrated in Figure 4.15. The Moore and Rukovena technique can be applied at three different levels: Figure 4.13 Application of the Moore and Rukovena method for distributor quality rating (a) areas considered in liquid distribution quality rating (A = cross-sectional area not covered by point circles; B = point circle area in 1/12 tower area; C = area of overlap of point circles). (b) standard quality distributor, DQ = 60%; (c) standard quality distributor, DQ = 72%; (d) intermediate quality distributor, DQ = 84%. (From Moore, F., and F. Rukovena, “Liquid and Gas Distribution in Commercial Packed Towers,” Paper presented at the 36th Canadian Chemical Engineering Conference, October 5–8, 1986. Reprinted Courtesy of F. Rukovena, Consultant.) The author highly recommends this method for evaluating distributor irrigation at the basic and intermediate levels. With small-diameter towers, B may be difficult to define. In this case, only the basic level can be applied with confidence. With a small number of drip points, double and triple overlaps may incur difficulties (40). For structured packing, the Moore and Rukovena method may not fully characterize the distribution quality because it does not credit the liquid spreading performed by the top layer of packings, and therefore may penalize distributors that irrigate the packings in a drip line. Spiegel (457) proposed an alternative “wetting index,” which accounts for the liquid spread at the top layer of packing, but unfortunately did not provide generic guidelines for the application of this method. The author has had good experience applying the Moore and Rukovena method also to distributors that irrigate structured packings in a drip line. It works at least on the qualitative level, as long as one recognizes that the liquid will spread parallel to the layers. The author concurs with Spiegel’s point that the quantitative value of DQ may penalize such distributors. Figure 4.14 Application of the Moore and Rukovena method to justify distributor replacement. (a) Original distributor, DQ = 45%; (b) Replacement distributor, DQ = 90%. (From Olsson, F. R., Chemical Engineering Progress, p. 57, October 1999. Reprinted Courtesy of Chemical Engineering Progress (CEP). Copyright © American Institute of Chemical Engineers (AIChE).) Figure 4.15 Application of the Moore and Rukovena method to trough distributors with wall holes and external drip guides directing liquid downwards (a) triangular pitch, DQ = 95%; (b) square pitch, DQ = 90%. (From Niggeman, G., A. Rix, and R. Meier, “Distillation of Specialty Chemicals,” Chapter 7, pp. 297–336, in A. Gorak and H. Schoenmaker (ed.) “Distillation Operation and Application,” Academic Press, 2014. Copyright Elsevier 2014. Reprinted with permission.) Perry et al. (362) presented a useful method, which they conceptually credit to Moore, for troubleshooting irrigation in the tower wall region. In modern designs, drip point patterns are computer-generated. Due to mechanical constraints and support considerations, the computer often locates outer drip points some distance from the tower wall, producing underirrigated zones, which go undetected. The Perry et al. method divides the column into three concentric zones of equal areas, and the number of drip points in each zone is counted by hand. This procedure can readily detect underirrigated zones near the tower wall, as illustrated in Figure 4.16, which is its main application (336, 362). For simplicity, Figure 4.16 does not specifically show the vapor risers, but these need to be taken into consideration when applying this method. Figure 4.16 Application of the Perry et al. method using three concentric zones of equal area to detect unirrigated areas near the tower wall. The underirrigated areas are marked with clouds. (From Niggeman, G., A. Rix, and R. Meier, “Distillation of Specialty Chemicals,” Chapter 7, pp. 297–336, in A. Gorak and H. Schoenmaker (ed.) “Distillation Operation and Application,” Academic Press, 2014. Copyright Elsevier 2014. Reprinted with permission.) When reviewing the irrigation pattern, ensure that the liquid drip points are not too close to the vapor passages to be entrained by the vapor. Also, check that any drain holes do not pass quantities of liquid large enough to generate maldistribution. Finally, confirm that the distributor supports and packing hold-downs do not interfere with liquid distribution. In one case (261, 257), the distributor was supported by 4″ × 8″ plates that covered 8% of the packing, leading to poor separation. High-velocity jets entering the tower due to undersized gas inlet and reboiler return nozzles are the prime source of vapor maldistribution. These jets persist through low-pressure-drop devices such as packings. Vapor distributors, even well-designed inlet baffles, have alleviated such problems. Vapor distribution is most troublesome in large-diameter columns. Below are some guidelines for troubleshooting vapor maldistribution. In addition, many of the guidelines in the next section dealing with flashing feeds also apply for vapor distributors. Kabakov and Rozen (186) measured severe gas maldistribution in 15-ft diameter CO2 amine absorbers containing 50 ft of random-packed beds. They did not report values for FN. The efficiency in these columns was about half that measured in another column that had a specially designed inlet gas sparger. Schafer et al. (415) report a case where adding a multi-vane vapor distributor greatly improved aromatics stripping from water. Using CFD, Wehrli et al. (499) found that a very simple device such as the V-baffle (Figure 8.14b) gives much better distribution than a bare nozzle. Both Wherli et al. and Schafer et al found that a more sophisticated sparger or vane distributor was even better. With a V-baffle, use a sketch to troubleshoot for possible adverse effects produced by the baffle. Some cases are discussed in in Sections 8.13 and 8.16. It is important to verify that vapor from the V-baffles does not impinge on the liquid below or interact to generate vapor maldistribution, as explained in Section 8.13 and in Case 3 in Section 8.16. In one case (271), with FN ≫ 81.2 ΔP0.5, the entering vapor jet repeatedly damaged the bottom of an 11-ft tall bed containing sturdy grid packing. The entry was similar to that in Figure 4.17a, but there was no chimney tray between the inlet and the bed. The damaged packing was opposite the vapor entry (Figure 4.17a). High vapor velocity, possibly with entrained liquid, was “literally ripping the bed apart from the bottom (271).” In another case (158), some coking was found in the bottom (slurry) grid bed of an fluid catalytic cracking (FCC) fractionator, most pronounced on the side of the column opposite the vapor feed inlet nozzle (again, similar to Figure 4.17a but no chimney tray). The authors (158) comment that “this type of slurry bed coking is not uncommon in the industry.” Figure 4.17 Inlet vapor jet traveling through a vapor-distributing device (a) low pressure drop device, vapor maldistributed through the bed; (b) high pressure drop device, vapor distributed evenly to bed. To evaluate the effectiveness of the vapor distributing device, calculate its pressure drop and compare it to the inlet nozzle velocity head. Pressure drops through vapor distributors typically range from 1 to 8 inches of water (326) and can be calculated using Eq. (4.4). Strigle (462) recommends that the pressure drop through the vapor distributor should be at least equal to the velocity head at the inlet nozzle. Outside the loading region, the influence of the liquid flow on gas maldistribution is small or negligible. This is one application in which CFD technology has been extensively applied. This tower is unique in that the feed to the tower, typically 30–70% vapor by weight, becomes >99.9% vapor by volume under the deep vacuum at the tower inlet. Physically, the feed enters at close to sonic velocity with the liquid dispersed in the vapor as a fine mist. This feed often enters via a tangential nozzle and a vapor horn device (Figure 4.18) that flings the feed against the tower wall. The wall catches the liquid and runs it down the wall, while the vapor expands to the tower diameter. An alternative arrangement uses a radial nozzle and a vane distributor (12, 245, 499). In either case, the vapor from the feed zone rises through a chimney tray (Figure 4.18, also Figure 7.2a) to a packed bed (termed “the wash bed”), which is the most critical bed in the tower. Economic considerations necessitate minimizing reflux to this bed. Maldistribution of vapor or liquid may render the distillate from the top of the bed (heavy vacuum gas oil, or HVGO) to be off-spec or form dry spots in the bed that can severely coke, limiting the capacity and run length of the tower, and often of the entire crude unit. These make vapor distribution to the bed critical. Figure 4.18 Application of computational fluid dynamics to analyze vapor distribution at the feed zone of a refinery vacuum tower, showing the flow profile at different elevations. (From Costanzo, S., S. M. Wong, and M. Pilling, Hydrocarbon Processing, p. 81, September 2010. Reprinted with permission.) Several studies were reported on how the vapor inlet geometry affects vapor distribution to the wash bed. Lin et al. (296) tested a 3-ft ID air–water scaled-down model of the flash zone of a large vacuum tower, transfer line, feed nozzles, and slop wax chimney tray (no vapor horn). They observed the vapor preferentially rising at the opposite side of the feed inlet (similar to Figure 4.17a), with some feed liquid deflecting into these chimneys. Vaidyanathan et al. (487) and Torres et al. (482) applied CFD to examine the effect of the geometry of a chimney tray above the inlet on vapor distribution and liquid entrainment. Paladino et al. (355) demonstrated that the presence of liquid in the feed affects the gas velocity profile and must be accounted for in modeling. Paladino et al. (355) and Waintraub et al. (497) used two-fluid models to explore the velocity distributions and entrainment generated by different designs of vapor horn distributor designs. Wherli et al. (499) and Kolmetz et al. (260) presented CFD-produced flow patterns for vacuum tower inlets, including radial bare nozzle, V-baffle, vane inlet device, and tangential entry with a vapor horn. Wehrli et al. (500) produced pilot-scale data simulating a vacuum tower inlet, which can be used for CFD model validation. Remesat and Riha (394) describe at length the application of CFD for vacuum tower feed inlet design. For a refinery vacuum tower fed via a vapor horn, Figure 4.18 (75) shows CFD-generated horizontal (“x–z”) vapor velocity profiles at different elevations between the vapor horn and the wash bed. The arrows, slightly challenging to see, indicate the direction of flow. At plane 0, situated below the horn, Figure 4.18 shows a high swirl velocity of 70–80 m/s, directly beneath the region where the horn terminates. This swirl may generate a vortex at the bottom sump. If there are stripping trays in the smaller-diameter section, this swirl may upset the top tray or the chimney tray that directs the liquid to the trays. Plane 1, which slices the vapor horn, shows very high horizontal vapor velocities at the horn (as could be expected) and much lower velocities in the vapor rise region. Keep in mind that the velocities shown are in the horizontal plane. More important in this region are the vertical (“y”) velocities, which determine the potential for excessive entrainment and a premature system limit. It was recommended (394) to keep the peak C-factor (Eq. 2.1) based on the area open to vapor ascent below 1 ft/s. Plane 2, right above the horn, shows the first transition from the feed zone profile to the flow profile entering the chimney tray and is useful for evaluating the effectiveness of the vapor horn as a vapor distributor. Plane 3 is just below the chimney tray. Comparing Planes 2 and 3 shows that the vapor velocities have significantly calmed down in the vertical space between the top of the horn and the chimney tray. This is well in line with the industry experience (155) that keeping the feed inlet nozzle top at least 5 ft below the chimney tray effectively retards entrainment from the flash zone. Finally, Plane 4, above the chimney tray and just below the wash bed, shows further slowing down of the horizontal vapor velocities. Unevenness on this plane is likely to persist in the wash bed. The reduction in velocities from Plane 3 to Plane 4 indicates that this chimney tray improves vapor distribution. More important than the horizontal vapor velocities below and above the chimney tray are the vertical velocities. Figure 4.19a shows CFD-obtained vertical (“y”) velocity profiles at and above the chimney tray of a different vacuum tower (in this case, the feed enters via a vane distributor, not a vapor horn). The diagram on the right shows high-velocity peaks directly above the vapor outlets from the chimneys as well as around the periphery. These high-velocity peaks would persist into the wash bed and explain the reduced product quality, premature damage to the packing, and high slop wax production experienced (391). Similar peaks were reported earlier by Vaidyanathan et al. (487), who attribute them to vapor from two neighboring chimneys merging to form an upward jet that is dependent on the hat design. Torres et al. (482) also observed these peaks. The lower diagrams in Figure 4.19 show that these issues can be mitigated by an enlarged feed nozzle (68″ instead of 52″) and better vane distributor and chimney tray designs. Figure 4.19 Vertical (“y”) velocity profile provided by a CFD analysis of a vacuum tower feed region (a) existing design; (b) revised proposed design. In both, left is at the chimney tray, right is above the chimney tray just below the wash bed. (From Ray, D., A. Arora, and A. Phanikumar, p. 40, Revamps 2009. Reprinted with permission.) CFD analysis can be invaluable for interpreting field data. In one case (335), a high pressure drop was measured between the flash zone and the top of the wash bed, suggesting wash bed coking. A CFD analysis found that high pressure drop was due to the flash zone pressure measurement, which included a dynamic velocity head component, and not due to coking. For the results of the CFD analysis to be valid, an accurate representation of the feed properties and velocity profile is necessary (394). A feed profile is created for the CFD analysis using a 3-dimensional mixture of turbulent compressible vapor flow, with liquid droplets moving with the vapor. It is equally important to correctly represent the geometry, and with an existing tower, to validate the CFD model with plant data (394, 506). There are several assumptions involved in CFD modeling, and if these deviate from reality, so will the results and conclusions. Figure 4.20 CFD simulation of FCC main fractionator inlet (a) a schematic showing the staggered parallel pipe distributor that has been successful in alleviating coking in the packing above the tower side opposite to the inlet; (b) CFD profiles, comparing the flow patterns from a bare nozzle (right hand side) with the flow pattern with the staggered parallel pipe distributor (left hand side). With the distributor, the jet widens near the wall opposite the inlet. (From Niccum, G., and S. White, PTQ, Q1, p. 133, 2014. Reprinted with permission.) FCC main fractionator feed inlet With a hot (1000°F) reactive all-vapor feed to this fractionator, only one simple distributor is known to be successful: a series of staggered parallel pipes mounted in front of the inlet (Figure 4.20a). The reason for the success of this distributor in reducing coking on the wall opposite the inlet has been obscure. With the distributor, wall temperatures opposite the inlet seem to be typically 40–60°F hotter than directly above the inlet. Without the distributor, the difference is usually higher, but not by much. A preliminary CFD study (334) provided a plausible hypothesis. The pipes widen the inlet vapor jet and scatter it on the wall opposite the inlet (Figure 4.20). Without a distributor, the jet remains focused on a narrow region opposite the inlet. The scattering spreads the liquid impacting the back of the tower over a wider area. Additionally, as the impingement region is less defined, the shear stresses are more evenly distributed and shear the coke. This study is preliminary, but shows another valuable development in CFD applications to tower feed modeling. Liquid entry is typically designed for an inlet velocity of less than 4–5 ft/s. Figure 4.21 shows two nightmare scenarios of flashing feed entering liquid distributor parting boxes. In Figure 4.21a, water at 95°C entered a parting box of a bitumen stripper at a velocity of 3 ft/s. To improve performance, a consultant proposed reducing tower pressure from slightly above atmospheric to vacuum. Upon drawing vacuum, the feed flashed, and due to the low steam density, the feed velocity increased to 100 ft/s, which sprayed the feed liquid everywhere, precluding any decent distribution. Figure 4.21 Bad practices of flashing feed entering liquid distributor parting boxes. (Part (a): From Kister, H. Z., W. J. Stupin, and S. Stupin, TCE, p. 44, December 2006/January 2007. Courtesy of IChemE. Part (b): From Schultes, M., “The Raschig Super-Ring is Pushing the FRI Test Column to New Limits,” The Kister Distillation Symposium, Topical Conference Proceedings, p. 381, the AIChE National Spring Meeting, San Antonio, TX, April 29–May 2, 2013. Courtesy of Raschig, AG.) In Figure 4.21b, a flashing feed entered via a side nozzle into a V-notch trough that crossed the tower diameter. The design intention was for the flashing liquid to fall into the parting box and descend via the notches into the troughs of the distributor below, and for the vapor to disengage and rise to the bed above. Tests at the Raschig shop (420) (Raschig were not involved in the original design, only in the troubleshooting) showed that the high momentum of the incoming flashing feed pushed the liquid to the end of the parting box opposite the inlet nozzle, with some of it missing the parting box altogether (photograph in Figure 4.21b). The result was terrible distribution to the packing. Other cases of flashing feeds entering liquid distributors causing hydraulic and separation problems were reported (71, 239, 240, 433). In one case in which a flashing feed entered a false downcomer, the downcomer was found repeatedly blown apart and lying on the distributor (271). Figure 4.22 A typical gallery distributor design. (Courtesy of KochGlitsch, LP.) With flashing feeds, the vapor and liquid need to first be adequately separated, then the liquid descend onto a packing liquid distributor. The vapor must not enter the liquid distributor. There is a variety of flash box designs that achieve this, as described in several literature references (199, 245, 462). One of the most popular types is gallery distributors (Figure 4.22). The feed nozzle is located well above the upper plate. The gallery wall facing the inlet nozzle deflects the incoming vapor upward and the incoming liquid downward. The liquid thus separated from the feed joins the liquid raining from the peripheral zones of the bed above, and both descend through the holes in the upper plate. The lower plate is a liquid distributor to the bed below. Vapor from the risers of the distributor below rises through the hollow inside of the gallery. In many galleries or other flashing feed distributors, liquid from the gallery descends to the distributor below using downpipes instead of floor perforations. To prevent overflow, these downpipes should be adequately sized for self-venting flow (Figure 4.9). The downpipes, either from the gallery or from a collector above, should enter the distributor below without restricting liquid equalization in the distributor, as occurred in Case 1 in Section 8.18. The impact of the feed on the gallery wall tends to deflect the incoming jet upward. The top of the gallery in this region should be covered to prevent entrainment. Likewise, at the inlet, the feed splits into two streams, with the momentum pushing each stream horizontally along each wall of the gallery. Right across from the inlet, the remnants of the two streams collide. This region too can produce entrainment, which can be prevented by a gallery cover at that location. When the feed enters too close to the gallery floor, it can entrain the gallery liquid, as described in the case study in Section 8.13. Reference (37) describes severe entrainment from a high-velocity flashing feed that entered via a 10″ inlet. The bottom of the inlet was 10.7″ above a shed deck that held some liquid. When calculating liquid heads in the gallery using Eq. (4.2), account for liquid raining into the gallery from the bed above, in addition to the feed liquid. Also, there is likely to be some frothing of the liquid, and this needs to be considered in the evaluation but cannot be calculated. Gallery distributors are prone to damage at the feed inlet point due to severe hydraulic pounding of the gallery wall by the entering feed. There have been cases where sudden increases in the quantity of entering vapor have flattened galleries. Such upset conditions should either be eliminated or catered for by mechanical strengthening. It is important to ensure that packed tower feed pipes operate outside of the slug flow regime. Cases 6.8 and 6.9 in Ref. (201) describe experiences with packed tower instability, premature flooding, and poor separation resulting from slug flow in the feed. V-notches, Y-notches (Figure 4.23), and rectangular slots are successfully used in high fouling rate services such as slurries, vent scrubbers, quench towers, and where other distributors experience plugging (40, 83, 192, 258, 260). Rectangular notches are also used in some high-quality two-stage distributors. Notched troughs are insensitive to plugging, corrosion, and erosion. They minimize stagnant zones, keep particulates moving, and allow the liquid to sweep the trough clean. The notches typically discharge the liquid directly into the up-flowing vapor. The recommended equations for flow through notch is from Perry’s Chemical Engineers’ Handbook (5th ed., p. 5–17; some later editions are not clear on the units). For rectangular notches: For narrow rectangular notches, Eq. (4.7) simplifies to For triangular notches, not fully covered by liquid: where Figure 4.23 A notched trough distributor with Y notches. (Courtesy of KochGlitsch, LP.) Figure 4.24 Terms used for flow through notches (a) rectangular notch, Eqs. (4.7, 4.8) (b) triangular notch, Eq. (4.9). Per Eqs. (4.7)–(4.9), the flow rate rises to the power of 1.5 and 2.5, respectively, for rectangular and triangular notches, in contrast to flow rates rising to the power of 0.5 with orifice distributors (Eq. 4.2). This means a much lower range of liquid heads. A typical V-notch distributor will have a liquid head of 1–3 in. over its entire operating range (83). If at a head of 1 in. it handles 100 gpm, Eq. (4.9) gives that increasing the head to 3 in. will raise this flow rate to (100 × 32.5=) 1600 gpm. This is a huge dependence on liquid head. On the credit side, this gives good turndown. On the debit side, this makes the distribution sensitive to small changes in head and to fabrication irregularities from notch to notch, and makes it difficult to incorporate a large number of drip points, which inherently reduces irrigation quality. This strong dependence on the liquid head also makes V-notch (and to a lesser degree, rectangular notch) distributors far more sensitive to out-of-levelness, hydraulic gradients, and surface turbulence, and these could adversely affect their performance. The hydraulic gradient can be calculated using Eq. (4.5). At low rates, the issuing liquid may wrap itself around the troughs (Figure 4.25a). At high rates, liquid streams from adjacent troughs may join each other into a single stream, thereby halving the number of distribution points (Figure 4.25b). Both of these were observed by Olsson (346) in distributor water tests. The solution was to add drip guides (Figure 4.25c) that direct the liquid to the desired points. At high liquid rates, the flow down the length of the troughs is typically very high, and the flow out of each “V” is no longer uniform due to variance in the liquid momentum (Figure 4.26). Furthermore, at high liquid rates, the liquid may submerge the notches and maldistribute from then on. Figure 4.25 Problems experienced with notched trough distributors (a) flow dribbling down the side and wrapping itself around the trough at low rates; (b) liquid streams from adjacent troughs joining into a single stream at high rates; (c) drip guides to direct the liquid into the desired location. (From Olsson, F. R., Chemical Engineering Progress, p. 57, October 1999. Reprinted Courtesy of Chemical Engineering Progress (CEP). Copyright © American Institute of Chemical Engineers (AIChE).) Figure 4.26 Watermarks on a notched trough distributor showing liquid issuing with a sideways momentum. (From Olsson, F. R., Chemical Engineering Progress, p. 57, October 1999. Reprinted Courtesy of Chemical Engineering Progress (CEP). Copyright © American Institute of Chemical Engineers (AIChE).) Ensure that the liquid level does not reach the top of the notches. Once it does, the notches become triangular orifices, and the mode of operation totally changes, producing maldistribution and/or overflow. In spray distributors (Figure 4.27), a header pipe and laterals supply liquid to spray nozzles arranged in a pattern, typically elevated 18″ to 36″ above the packed bed. From the nozzles, liquid is sprayed as a wide-angle (typically 120°, but sometimes 90°) full cone. The cone is seldom homogenous. The bed coverage is determined by the number of nozzles, spray angle, and height above the packed bed. Figure 4.27 Water testing of a spray distributor. (Courtesy of Sulzer Chemtech.) It is a good practice to restrict the spray nozzle pressure drop to 10–15 psi, but up to 20 psi is used. This minimizes the entrainment and also minimizes the likelihood of a spray angle collapse. FRI’s experiments with wide-angle (120°) sprays (107) showed the spray cone angle to collapse from 120° to about 45° from the same spray nozzles when the spray nozzle pressure drop was increased between 10 and 20 psi with subcooled liquid. This spray angle collapse is closely related to the collapse of condensing vapor onto subcooled feed liquid (107). Entrainment Depending on the nozzle pressure drop and vapor superficial velocity in the tower, spray distributors can generate a significant amount of entrainment (up to 25% or more). Pigford and Pyle (364), and later Lin et al. (296, 297) and Trompiz and Fair (484), measured entrainment in pilot-scale simulators using the air–water and air–Isopar systems. All these tests found entrainment to strongly increase with the gas velocity (C-factor, Eq. 2.1) and with the nozzle pressure drop. Some dependence on the nozzle type was observed. An excellent correlation for calculating the entrainment is provided by Trompiz and Fair (484). Spray footprint diagram The spray circles overlap, so some areas at the top of the packing are overirrigated while others are underirrigated. The objective is to keep this maldistribution small-scale, but this objective is not always met. Spray patterns tend to be empirical. Generally, the distribution quality of spray distributors using established spray patterns is not as good as that of orifice distributors, and can be a lot worse when using nonstandard patterns. A good way to check the irrigation quality is to prepare a spray footprint diagram. The diameter of the footprint of each spray circle on top of the bed is approximated by where The correction factor of 0.92 is an empirical factor accounting for gravity, suitable for 18″–30″ height between the bottom of the nozzles and the top of the packing. The footprint of each spray nozzle is drawn as shown in Figure 4.28b. The pattern in Figure 4.28b is a common pattern that minimizes large-scale distribution with small circle overlaps. This pattern has worked successfully in many installations. There are many other patterns, some with much more extensive circle overlaps, that have also worked well. The key is to prepare a diagram like Figure 4.28b and to critically review it to minimize large-scale maldistribution. To optimize the pattern, the locations of some of the nozzles or the height above the bed can be adjusted on the diagram, and if warranted, a new header can be designed. Spray pressure drop test This should be the very first test when dealing with a spray distributor. Make sure the flow to the sprays is correctly monitored. Check it against pump curves and control valve settings. Then install a simple, calibrated pressure gauge in the liquid line to the sprays, downstream of any control valve, filter, or heat exchanger. The measured spray nozzles pressure drop equals the pressure gauge reading, minus the tower pressure (inferred from the tower pressure transmitter reading), minus the liquid static head in the line to the sprays (calculated from the elevation difference), and minus the friction loss in the liquid line to the sprays (calculated from the liquid flow rate and line size, and is often negligible). Compare the measured spray nozzles pressure drop thus obtained to the pressure drop across the spray nozzles predicted from the spray vendor catalog at the measured flow rate. Do not forget to apply the density correction as prescribed in the spray vendor catalog, as the catalog flows are based on water. Figure 4.28 Spray footprints diagram. (a) Terms used in Eq. (4.10); (b) sprays footprint diagram. Typically, pressure drop across the sprays at design flow rates is 10–20 psi. For a given flow rate, a measured sprays pressure drop significantly above that calculated from the catalog means plugged spray nozzles; a measured sprays pressure drop well below that calculated from the catalog means broken header or spray nozzles. Measuring the sprays pressure drops at several different liquid flow rates and comparing to the sprays vendor catalog is ideal and more informative. From the comparison of measured versus calculated pressure drop, the number of plugged nozzles can be estimated. Several case studies where this technique diagnosed the root cause of poor performance of a wash bed in a refinery tower were described in Ref. (130). In one, the pressure drop was zero because a header flange disintegrated due to rigid bolting of the header to the tower wall with no allowance for thermal expansion. In another, the pressure drop was 0.2 psi due to disintegration of a thin-gauge flange. In a third case, a pressure drop of 94 psi was measured where 11 psi was expected, indicating severe plugging. In another case (443), oversized nozzles and header leaks due to missing gaskets led to a pressure drop of 1 psi. The author can add many more to the list, including one instance (209, 211) when the pressure drop was 150 psi; most of the nozzles were plugged solid. Turndown Spray nozzles typically have a 2:1 turndown ratio. A high nozzle pressure drop produces fine spray droplets that can be entrained into the vapor. At very low pressure drops (typically <3 psi) the sprays droop, or even come out as “pencils” from the nozzles. Fouling or plugging can be a concern with spray nozzles, but less so than for gravity distributors. The number of spray nozzles per square foot of bed cross-section area is much smaller than the number of drip points per square foot with a gravity distributor. This permits larger spray nozzle openings compared to gravity distributors, which reduces their plugging tendency. On the debit side, the tortuous path inside the spray nozzle, which generates the spray cone, produces a multitude of low-velocity spots where solids can be trapped and accumulate. Filters, strainers, and/or screens should be used in the outside liquid pipes to the sprays to minimize the fouling per the guidelines in Section 4.5. Spray headers should be checked for the absence of, or at least the minimization of, stagnant pockets where solids can accumulate or liquid can overheat. Solids accumulating in such pockets often spall off and plug the spray nozzles. Lines from the filters to the tower should be fabricated out of corrosion-resistant metallurgy. Flow tests It is recommended that all spray nozzle systems be flow tested inside and/or outside the towers with water (if possible) to check the coverage. Where liquid distribution is critical, such as for wash sections of refinery vacuum towers, the sprays should be tested at every turnaround. If one spray nozzle fails, a significant cross-section area of the column will not be wetted properly. Tests have uncovered plugged nozzles (e.g., Figure 4.29), leaks, liquid shooting right down, loose nozzles, corrosion or erosion damage, and debris. Prior to the tests, the lines leading to the spray headers need to be flushed without going through the nozzles (505) to prevent the introduction of debris. The quality of water supply needs to be monitored. Dirty water aggravates plugging, and high-chloride water causes stress corrosion of stainless steel. Testing inside the tower is ideal but is sometimes disallowed due to various safety practices and concerns. In this case, the header should be removed and tested outside. Also, the testing may reveal a need for tack or seal welding, which may mandate removal and outside testing. Chapter 23 in Lieberman’s book (287) describes his personal experience with spray testing inside one tower, which highlights some potential safety challenges. These include narrow access that slowed emergency exit, release of pockets of hydrocarbons and H2S trapped behind plugged nozzles when the nozzles were loosened by hand, and excessive water pressure due to poor communication from inside the tower to outside. The high water pressure created noise (making communication even more difficult), mist that fogged safety glasses, and flushed out trapped hydrocarbons and H2S into the tower. Figure 4.29 Distributor water test finds plugged nozzle. (From Sanchez, J. M., A. Valverde, C. Di Marco, and E. Carosio, Chemical Engineering, p. 44, July 2011. Reprinted with permission.) When liquid distribution is critical, like in sprays to wash beds in refinery vacuum towers, the flow test should include obtaining a pressure drop versus flow curve. Control valve settings and valve openings should also be recorded. This test provides a useful baseline reference for future troubleshooting when plugging or breakage of the distributor is suspected. Other than the pressure drop versus flow curve, a visual observation is usually sufficient in spray tests. Should a close evaluation of distribution quality be desired, area samples can be collected to study the flow variation. The visualization also gives insight into the droplet size range and whether collision of sprays from different nozzles creates dry spots or overirrigated spots underneath. Spray nozzle suppliers can often provide drop size distribution data determined from water tests. One watchout is that liquids that have lower surface tensions and densities than water produce smaller drop sizes. Watch out for drain holes. These are seldom needed in spray distributors. With a high pressure drop across the spray nozzles, drain holes can generate powerful, undesired jets that damage packing. For high-flow systems, such as pumparounds, a water test may require too much water to be practical. The distribution in pumparound sections is usually far less critical than in the wash section, so the test is often skipped. However, if practical, the test can still be performed by circulating water through the pumparound. Another way of testing nozzles for high-flow systems is by building a rig outside the column that can test one to three nozzles at a time. A less effective test is to run air through the spray header. It can identify nozzles that are plugged or shoot right through. In some small towers, a single-spray or a few-spray distributor is used. Due to the non-homogeneity of the spray, these may give a very poor distribution. These should be carefully water-tested, and the nozzles should be replaced or adjusted in situ to improve the spray pattern as needed. The tests should be observed via a view port (if available) or an open manhole (505). Conducting water tests in distributors is essential because what the designer imagines does not always happen. Furthermore, many features in distributors are based on wishful thinking. Does wishful thinking work? Put water in it, and you will find out. Most major suppliers have well-equipped test rigs capable of testing distributors up to 30 ft in diameter or more. Larger distributors can be tested in sections. The suppliers charge for these tests, but their costs are usually reasonable because it is in their interest to ensure their distributors achieve the design targets. There may also be a schedule impact. These penalties, however, are dwarfed by the costs of poor-quality products or lost production from a column. Often, the water test makes the difference between a working tower and a packing failure or troubleshooting case study. The following guidelines have been recommended (192, 346, 347) for distributor testing: Should a large flaw be detected, some tough decisions may be needed, and distributor rebuild may be required. In some cases, the distributor can be modified and retested while on the test stand, saving doubts and later repetition. Inaccessibility may prevent some key measurements, and an alternative plan may need to be devised. Figures 4.25, 4.26, and 4.30 are examples of unexpected flow patterns that are extremely difficult, maybe impossible, to predict from first principles or identify in a normal troubleshooting investigation. Running water through the distributor would uncover them. Difficulties are commonly encountered during distributor shop tests. Dhabalia and Pilling (83) present an interesting account of the challenges in shop testing of a V-notch distributor, including turbulence in the pre-distributor, excess velocity in the interior portions of the arm troughs, and a liquid level about 0.5″ higher at the end than in the middle of each trough. The water test identified the causes of these problems and led to their solution. One water test revealed that above some troughs, the hole area in the parting box was larger than it should have been, yet surprisingly, the liquid levels in the troughs were even. When the excess hole area was plugged, the liquid head in some troughs was 10–20% higher than in others. A closer check found that some of the perforations were punched from the top down (rough side at the bottom) and others from the bottom up (rough side at the top). The cause was traced back to a fabrication shortcut after the perforated sheet was cut to form troughs. Water testing of distributors in situ is invaluable, both for new distributors and those that have been in operation. For new distributors, people often raise the question whether it is necessary to retest in situ after the distributor has already been tested in the shop. The merit of the in situ testing is to reveal issues that cropped up during installation and remained unnoticed. The piping in the plant differs from the setup in the supplier’s shop; the distributor supports in the plant differ from those in the shop; assembly errors could have occurred; debris and dirt could have lodged in some holes and plugged them; new leaks could have developed during assembly; feed pipe flanges may leak and damage could have occurred during transportation and mounting. Each of these can make a difference to the liquid distribution. Figure 4.30 Problems uncovered by water testing (a) angled drip tubes were designed to get the liquid under the wide support ring. A water test showed the drip tubes were directing all of the liquid onto the wall; (b) the drip tubes were shortened to correct the flow problem; (c) in-situ water test detects liquid leaking from weep holes and through gaps around the weir risers, not even getting to the notches that are intended to provide distribution; (d) outward deflection of liquid guide baffle guides the liquid to an unintended location; (e) excessive hydraulic gradient observed in parting box. (Parts (a)–(c): From Olsson, F. R., Chemical Engineering Progress, p. 57, October 1999. Reprinted Courtesy of Chemical Engineering Progress (CEP). Copyright © American Institute of Chemical Engineers (AIChE).) There are excellent examples of the merit of in situ testing. Bouck (43) found that at the minimum design liquid rate, the feed pipe cycled between being covered and uncovered by liquid in the distributor, changing the pressure drop across the control valve, which made it difficult to hold the setpoint flow rate. An in situ water test by Schnaibel et al. (417) provided an unexpected finding that liquid flow to some down boxes in a collector was obstructed by long chimneys, so these boxes received much less liquid than unobstructed down boxes. Another in situ test (264) identified maldistribution due to partial plugging of distributor holes by rust and debris as the root cause of poor performance. Diaz et al. (84) discovered a flange leak during an in situ water test, that contributed to the poor packing efficiency in a chemical vacuum batch distillation column. In a case the author is familiar with, a distributor that tested well in the shop showed maldistribution when tested in situ due to a sag in the middle. The sag did not occur in the supplier’s shop because it was better supported. For distributors that have already been in service, the above holds, and in addition, residual dirt, corrosion of holes, damage to delicate parts, bending and sag, loosening of nuts, bolts, or clamps, damage to flanges and gaskets, and unexpected splashing could all adversely affect the distribution. In situ tests with the packings in place afford the additional merit of showing the liquid distribution pattern as it comes out of the bed. Poor patterns may develop due to an anomaly or plugged or damaged section in the packed bed, or the development of excessive wall flow. Although in situ water tests usually lack the sophisticated instrumentation and measurement equipment available for supplier shop tests, they usually provide the information needed for troubleshooting. An attempt should be made to run the test at the normal liquid flow rate and test turndown as necessary. The water for the distributor can be provided from the water mains via the distributor feed pipes, pumped from a specially installed water tank, or simply provided by a water hose. Good solid-free and noncorrosive water quality is mandatory for the test, and in the case of stainless steel, also low in chlorides. The quantity of water needed for the tests should be estimated ahead of time, and special pumps should be ordered as needed. The setup used must be approved by the health, safety and environmental personnel. Water exiting the bed can be sampled by a cup that is tied to a rod and is moved around to different points, with its filling time at each point recorded. It is useful to watch the water emptying out of the distributor after the water supply is stopped. The last streams of water should come out randomly or reasonably evenly. If the last ¼–½ in. of water come out from one area, a levelness issue is implicated. Figure 4.30c shows an in situ water test that explained a very poor water-ethylene glycol separation (346, 347). All the distributor liquid leaked at the tray floor through ¾ in. weep holes and through gaps where the weir risers fitted through the deck. Figure 4.30d shows a baffle deformed in service, deflecting the water issuing from distributor holes in an undesired direction. Figure 4.30e shows a 12-ft long parting box receiving downcomer reflux liquid from the trays above as well as fresh liquid feed. A water test showed a hydraulic gradient in the box with preferential flow and overflow at the downcomer end of the box. Section 9.2.8 describes how an in situ water test showed maldistribution that gave poor separation for decades and was not picked by gamma scans. A caustic absorption tower with four circulating pumparound beds was water-tested in situ by circulating demineralized water and observing the action through the manholes (77). The tests revealed plugged perforations and a need for mechanical cleaning in one of the distributors. In addition, they revealed overflow at 75% of the design liquid flow rates, which explained the carryover they were experiencing during operation and forced operation at reduced circulation. In another caustic absorption tower, a water test on the collector from a pumparound circuit found no leaks, but circulating water through the circuit with the manhole open found that some of the collector hats overflowed into the risers. In small towers, it may be possible to test the vapor distribution. An air blower can be connected to the vapor entry nozzle and operated at normal flow. If safe and practical, it may be possible to measure the flow distribution in the tower using an anemometer. Another test advocated by Willard (505) is to run water for several minutes until the packings are fully wetted, then turning the water off while allowing the air to flow. Packings moist at the center and uniformly wet at the walls indicate good vapor distribution.
Chapter 4
Diagnosing Packed Tower Maldistribution
4.1 DIAGNOSING PACKING MALDISTRIBUTION: AN OVERVIEW
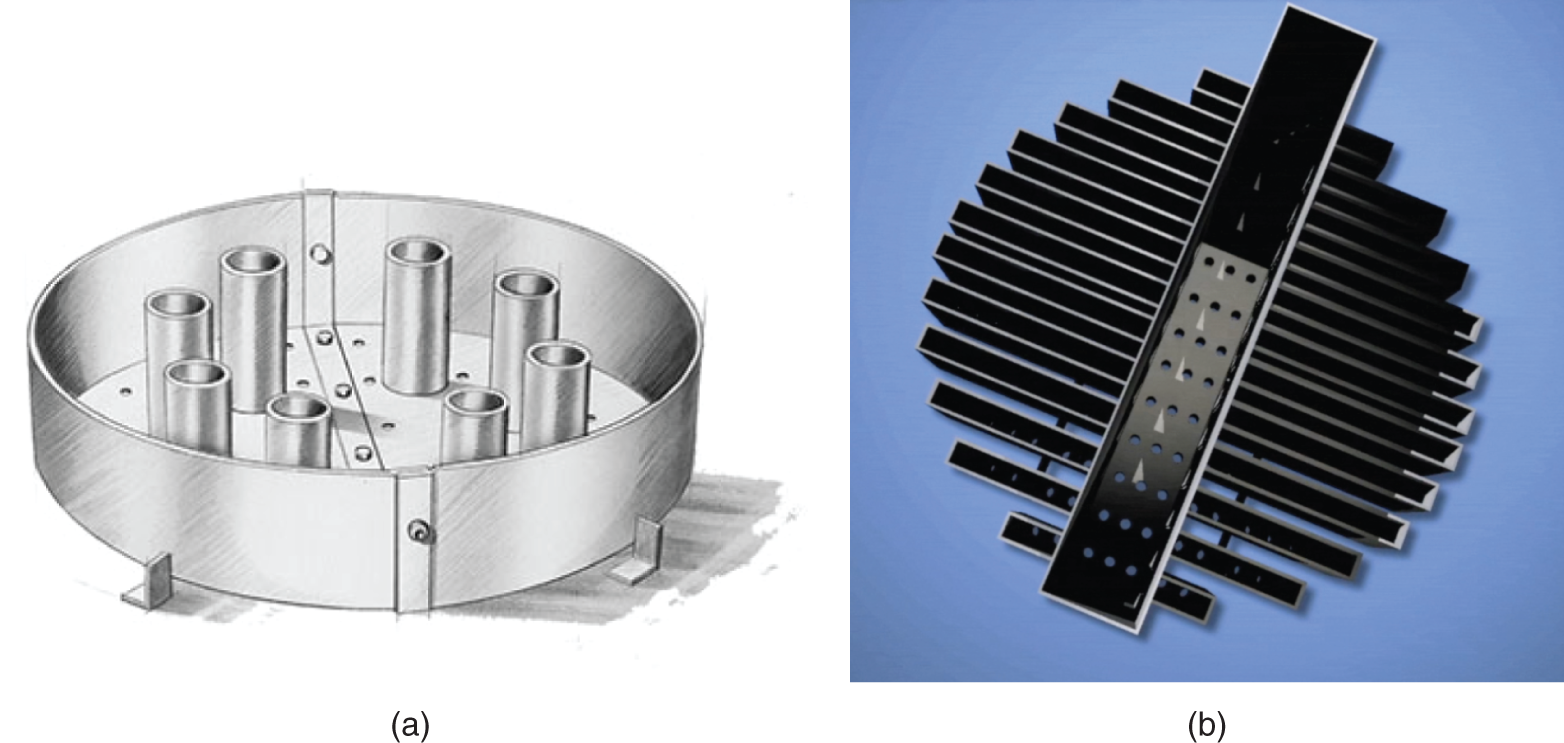
4.2 EXPECTED PACKING HETPS
4.3 SMALL-SCALE VERSUS LARGE-SCALE MALDISTRIBUTION: DO THEY EQUALLY RAISE HETP?
4.4 BY HOW MUCH DOES MALDISTRIBUTION REDUCE PACKING EFFICIENCY?
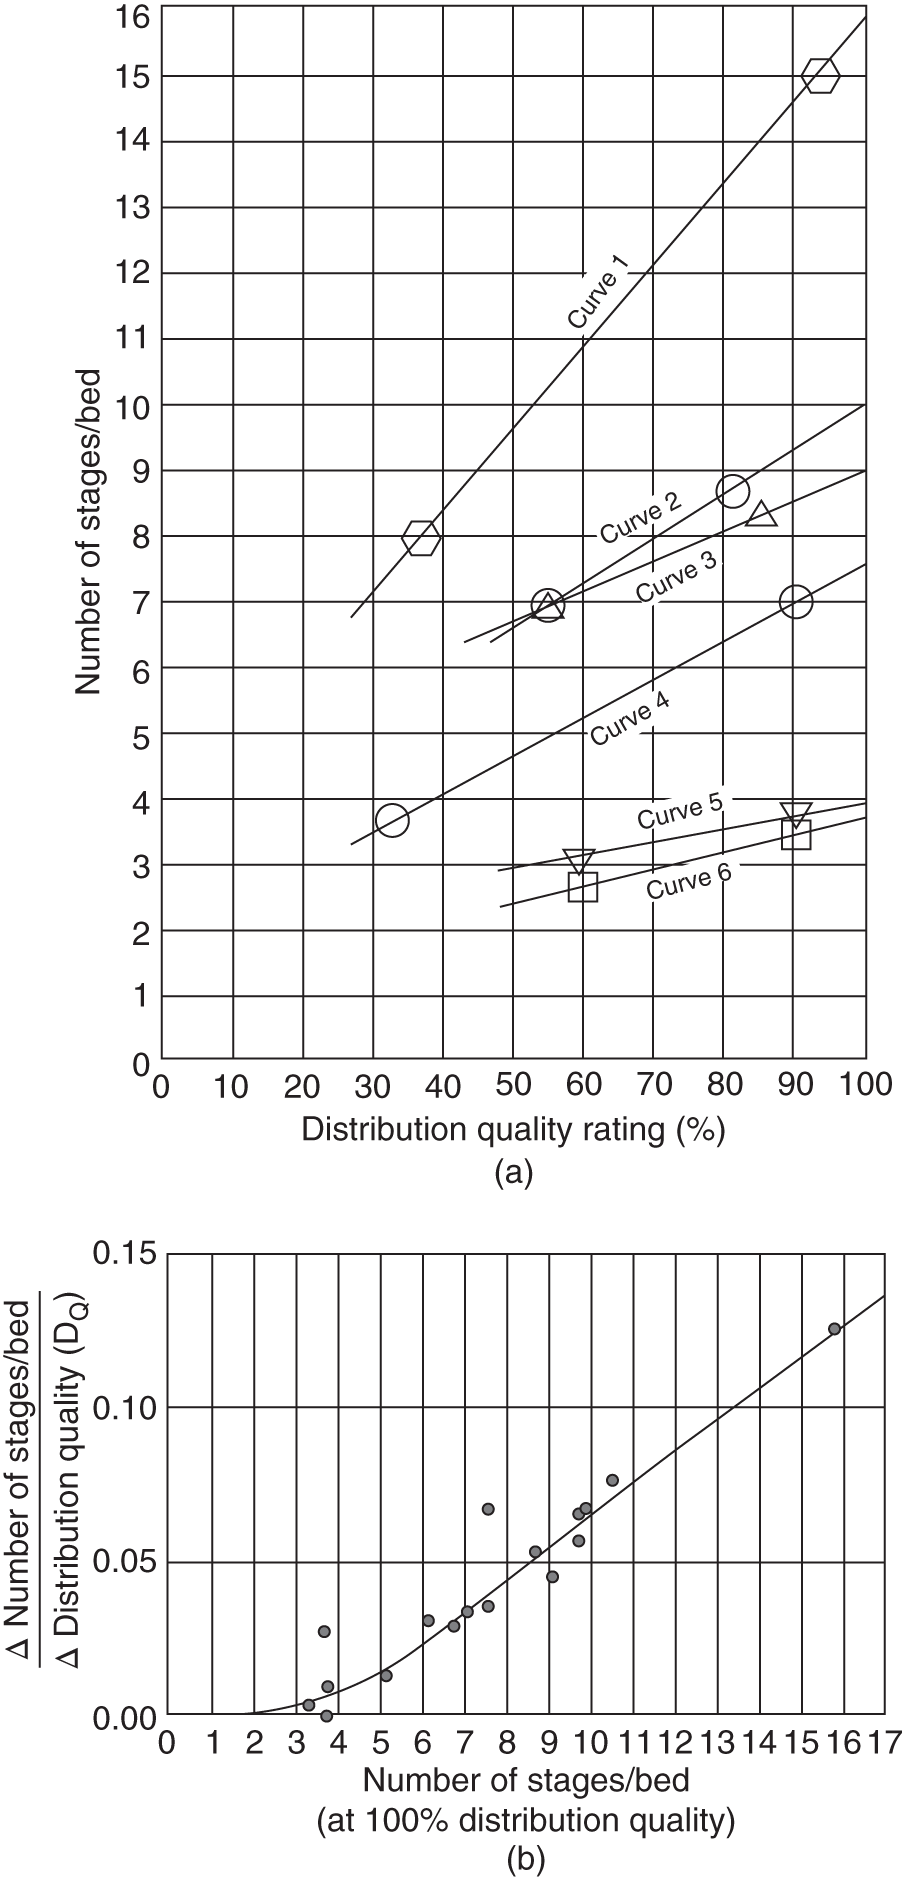
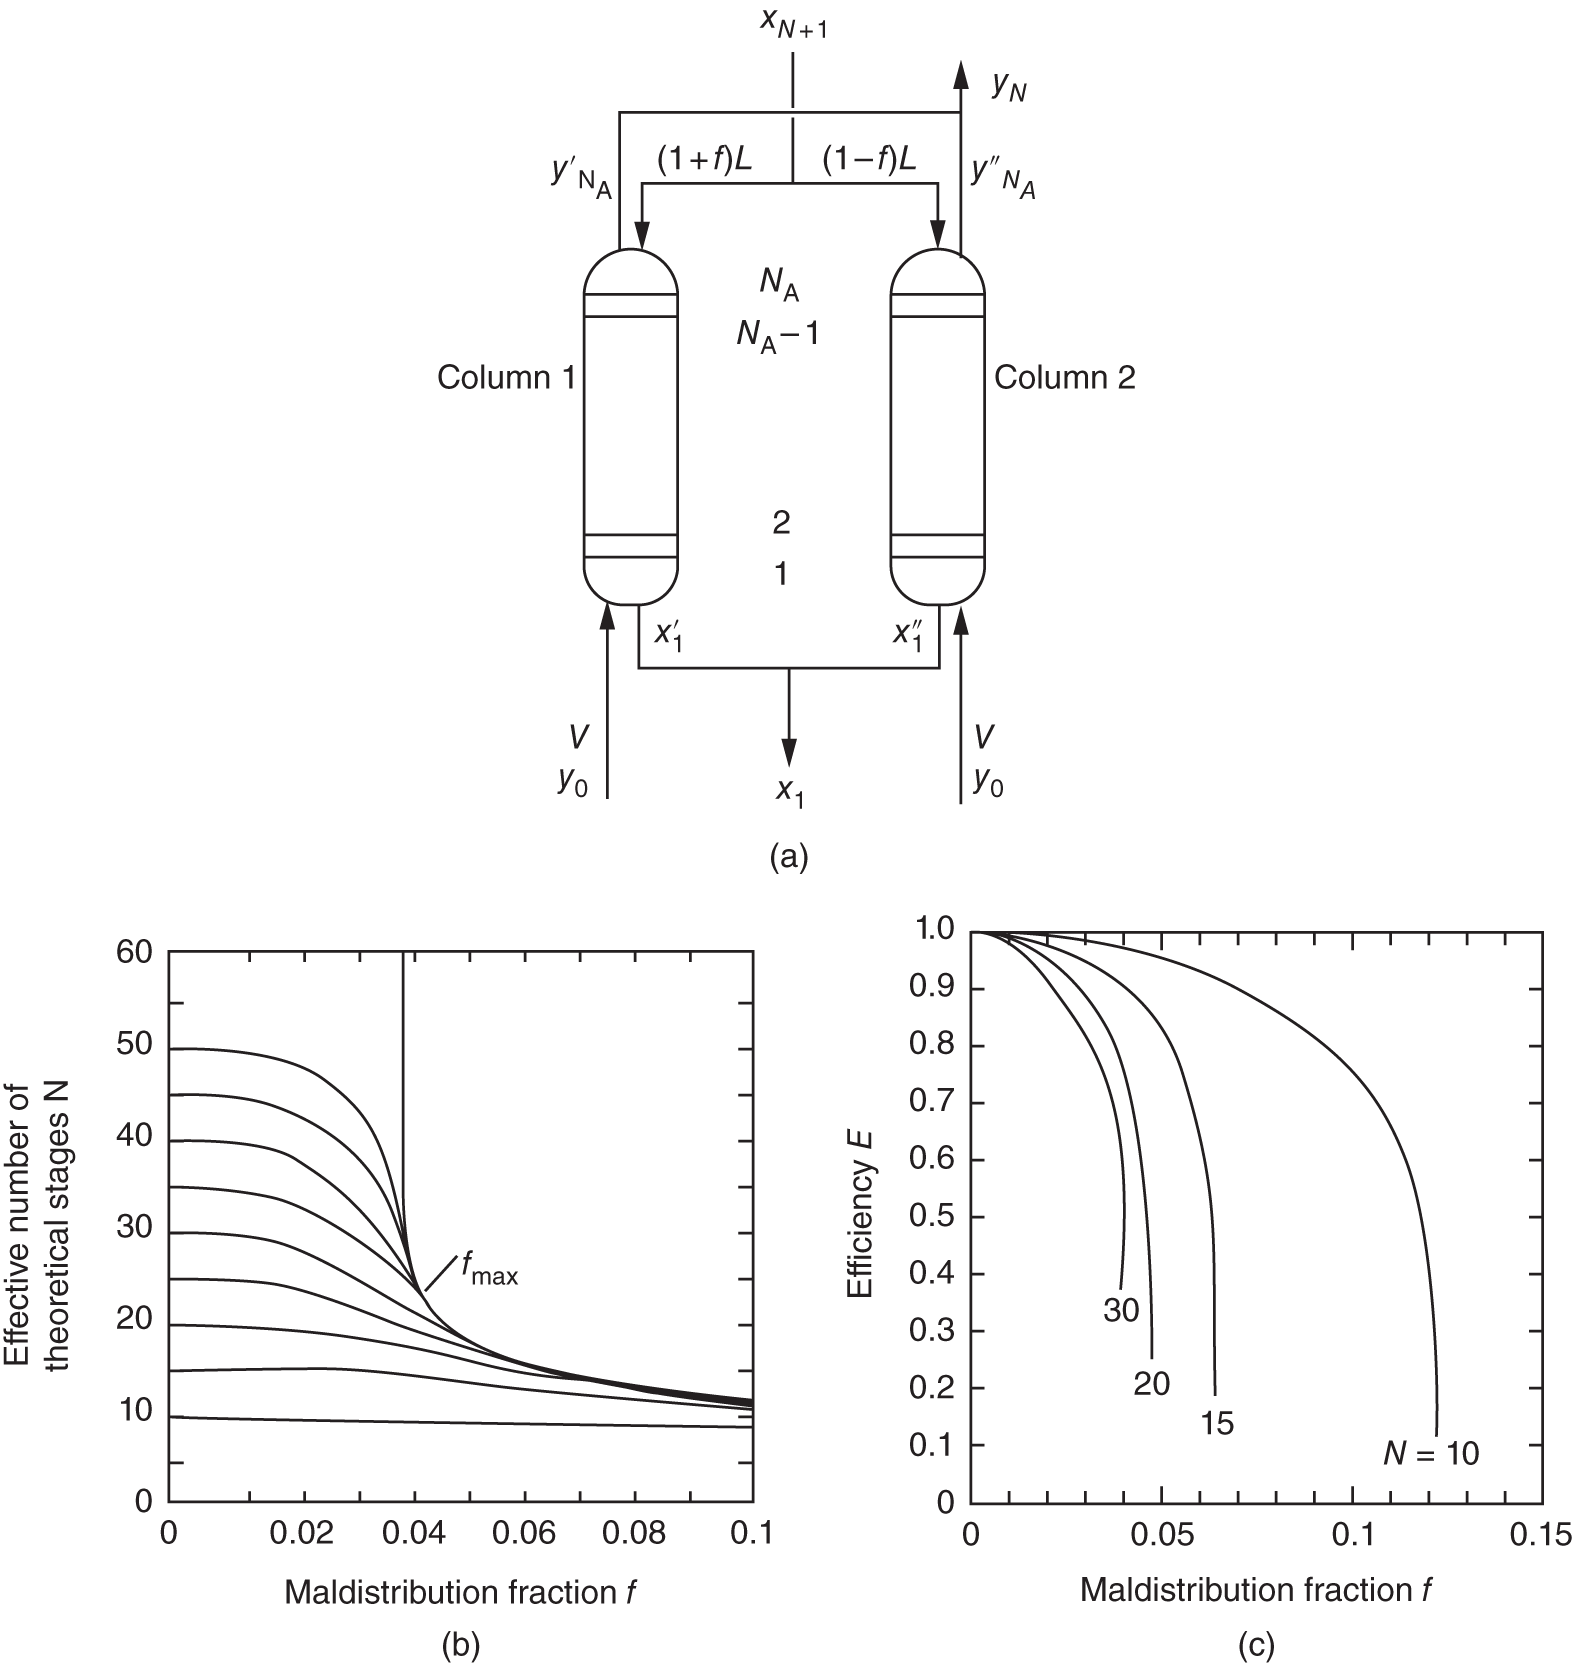
4.5 DIAGNOSING PACKING AND DISTRIBUTOR PLUGGING
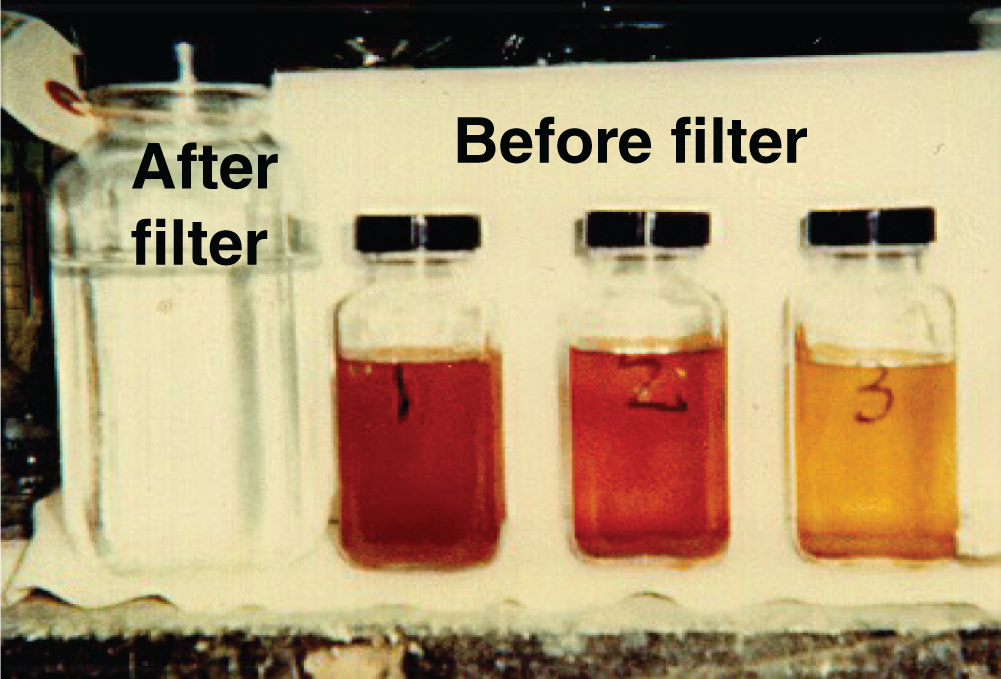
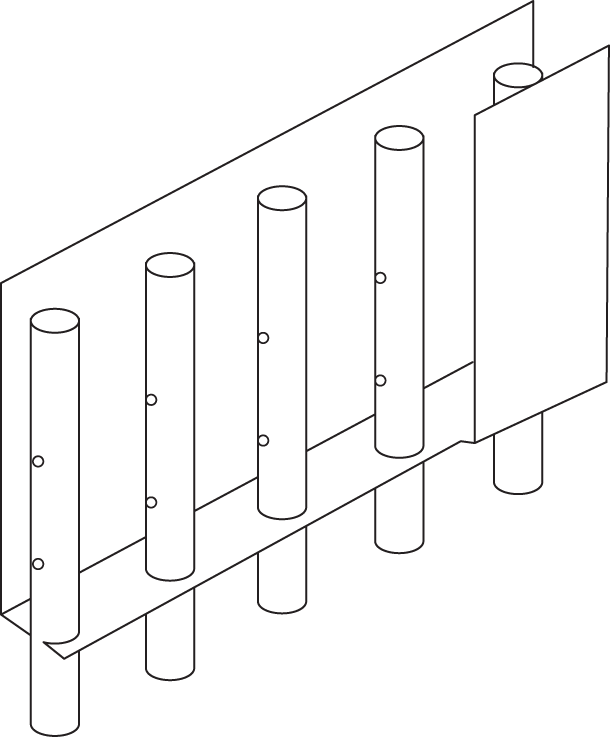
4.6 TROUBLESHOOTING FOR DISTRIBUTOR, COLLECTOR, AND PARTING BOX OVERFLOWS
4.6.1 Overflows and Their Impact
4.6.2 Overflows in Distributors, Redistributors, and Parting Boxes
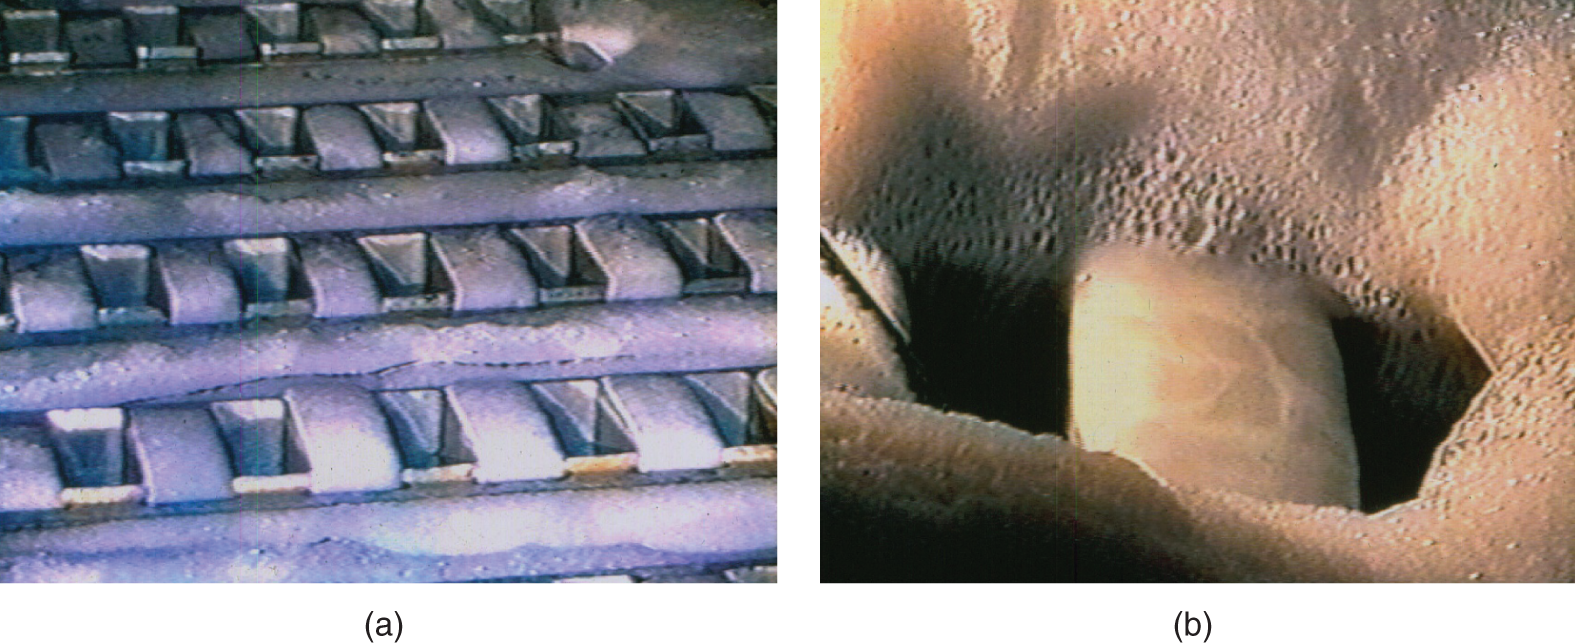
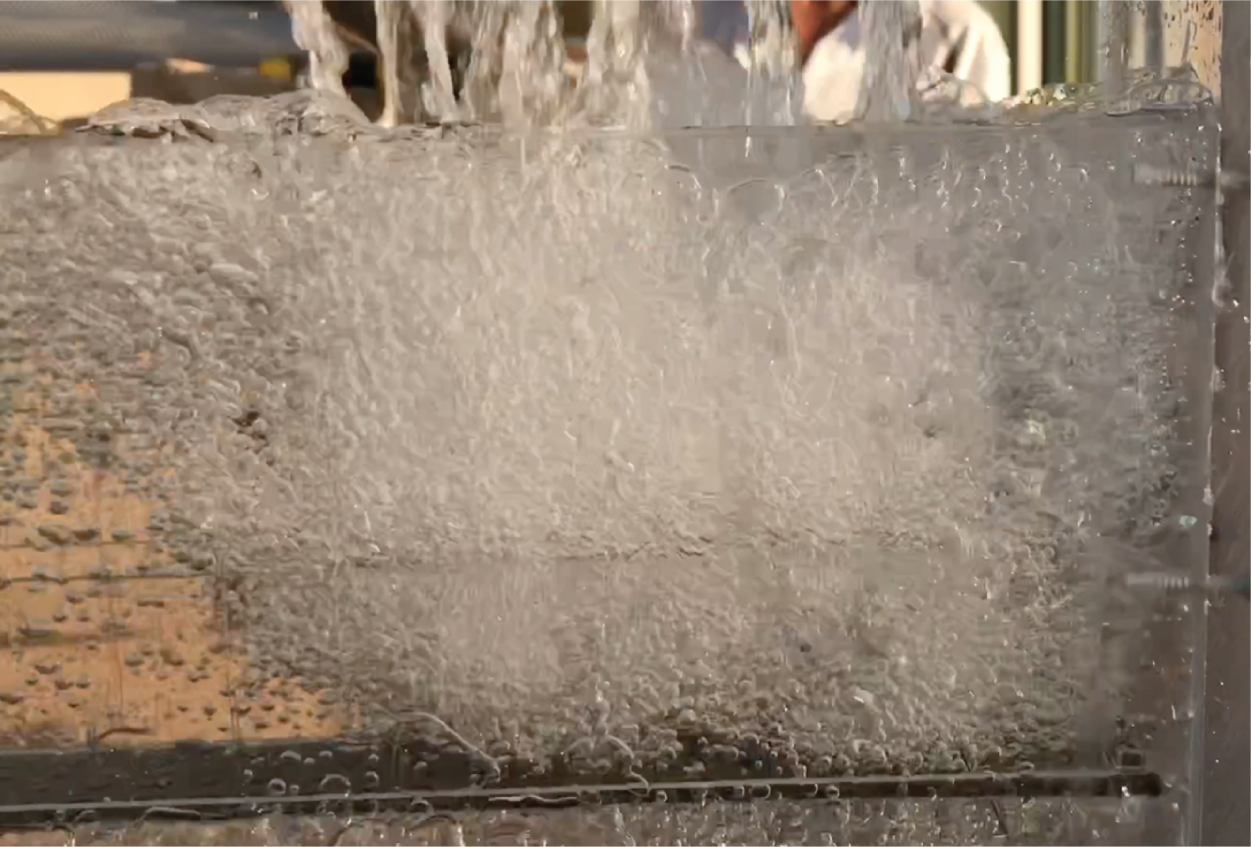
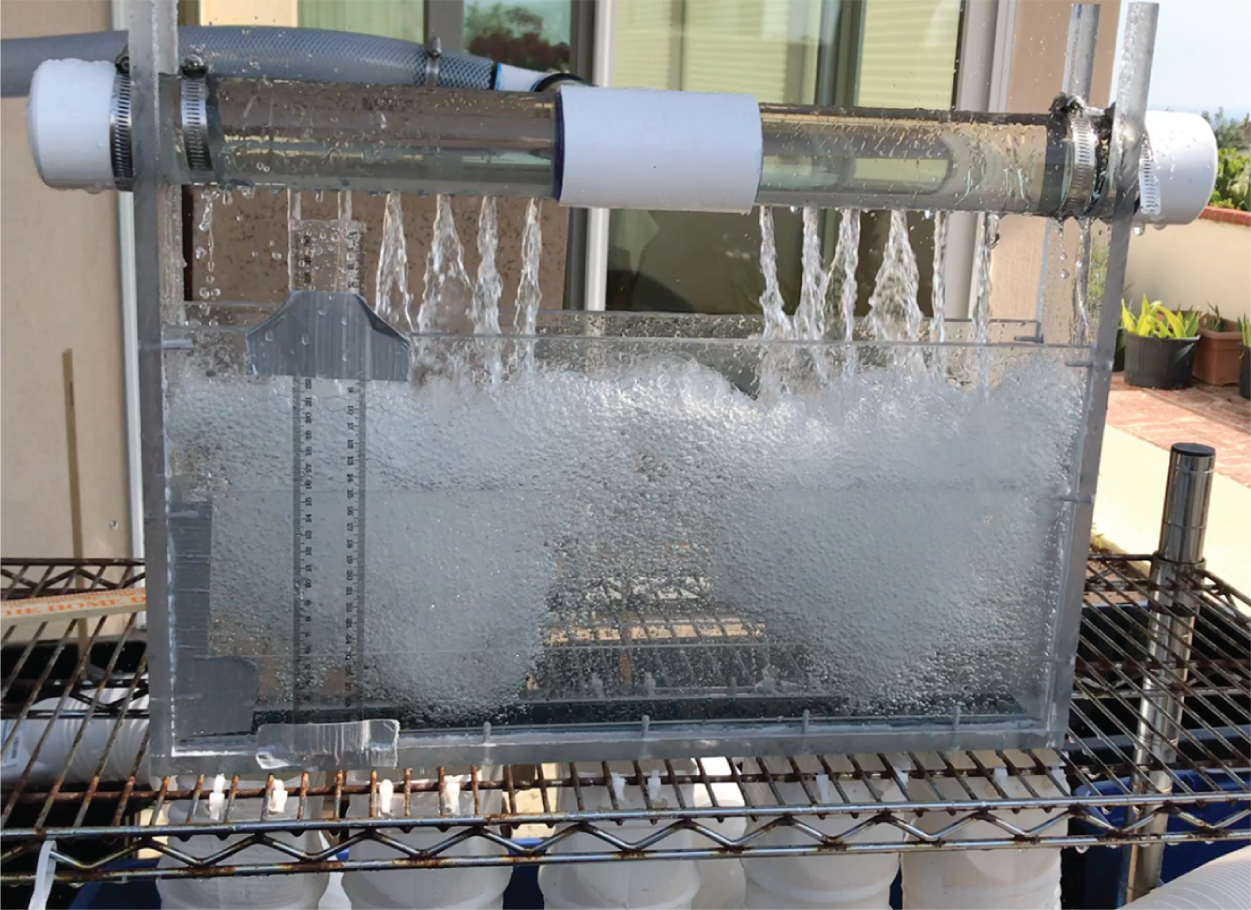
4.6.3 Overflows in Collectors
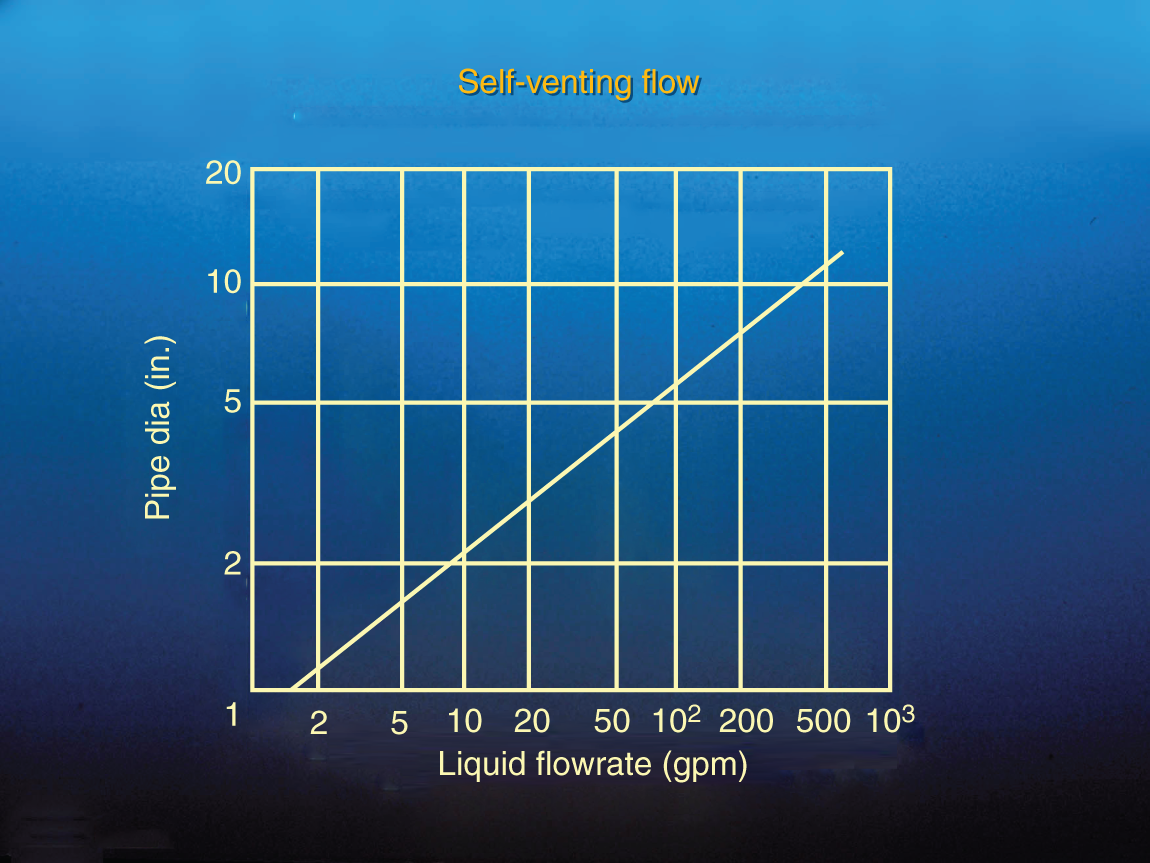
4.6.4 Overflows due to Plugging, Foaming, Impingement
4.7 TROUBLESHOOTING MALDISTRIBUTION AT TURNDOWN
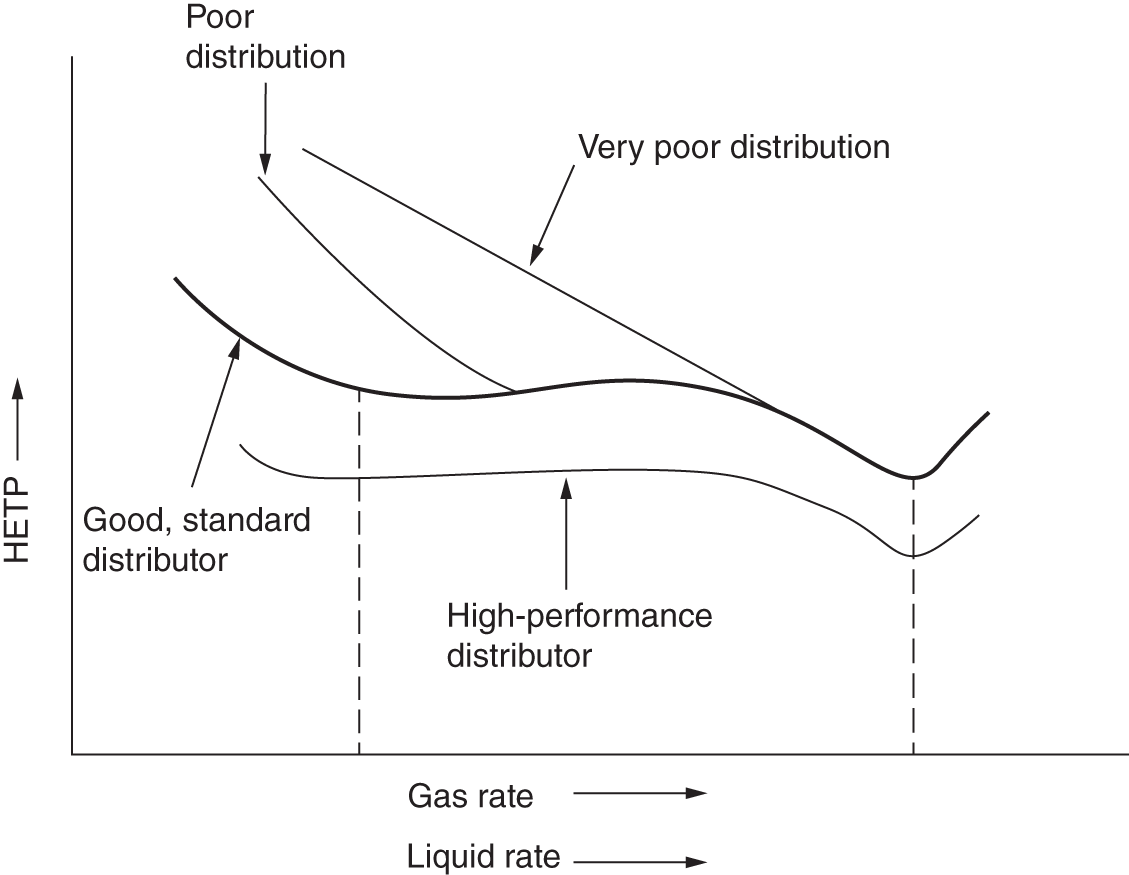
4.8 TROUBLESHOOTING DISTRIBUTOR OUT-OF-LEVELNESS
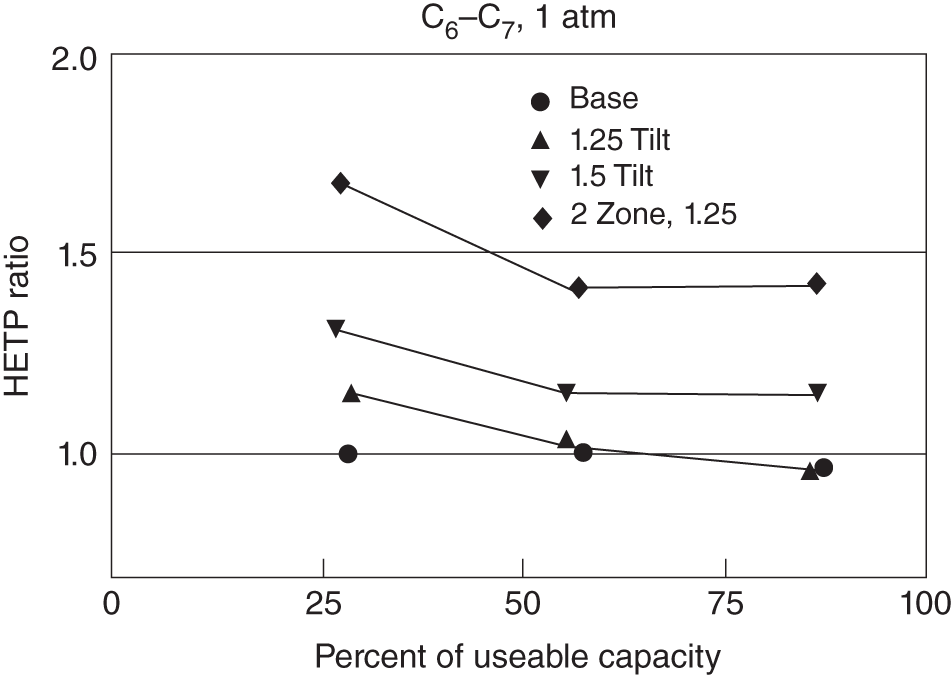
4.9 TROUBLESHOOTING DISTRIBUTOR FEEDS
4.10 EVALUATION OF DISTRIBUTOR IRRIGATION QUALITY
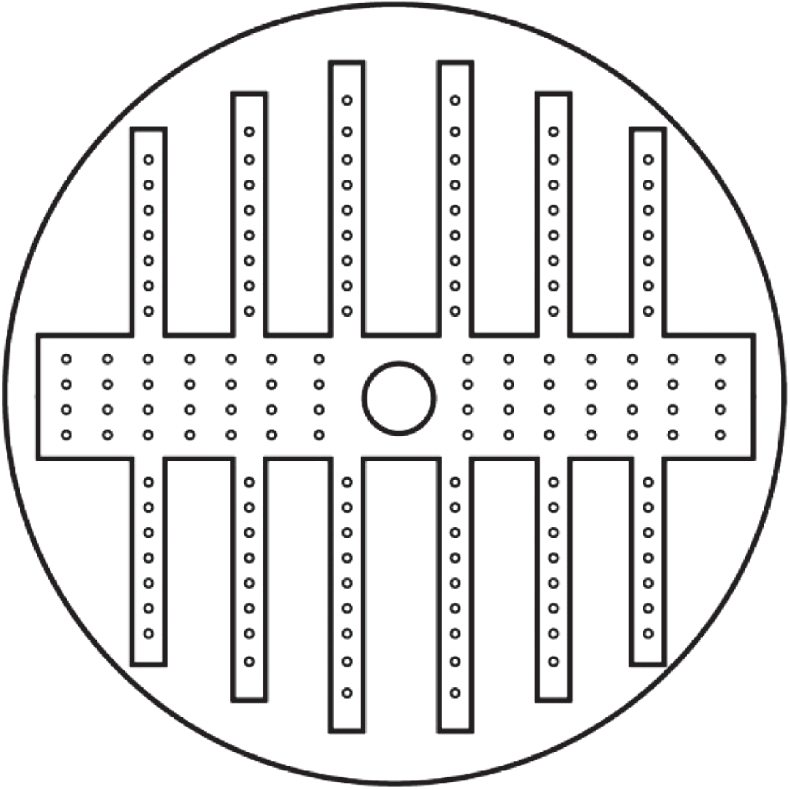
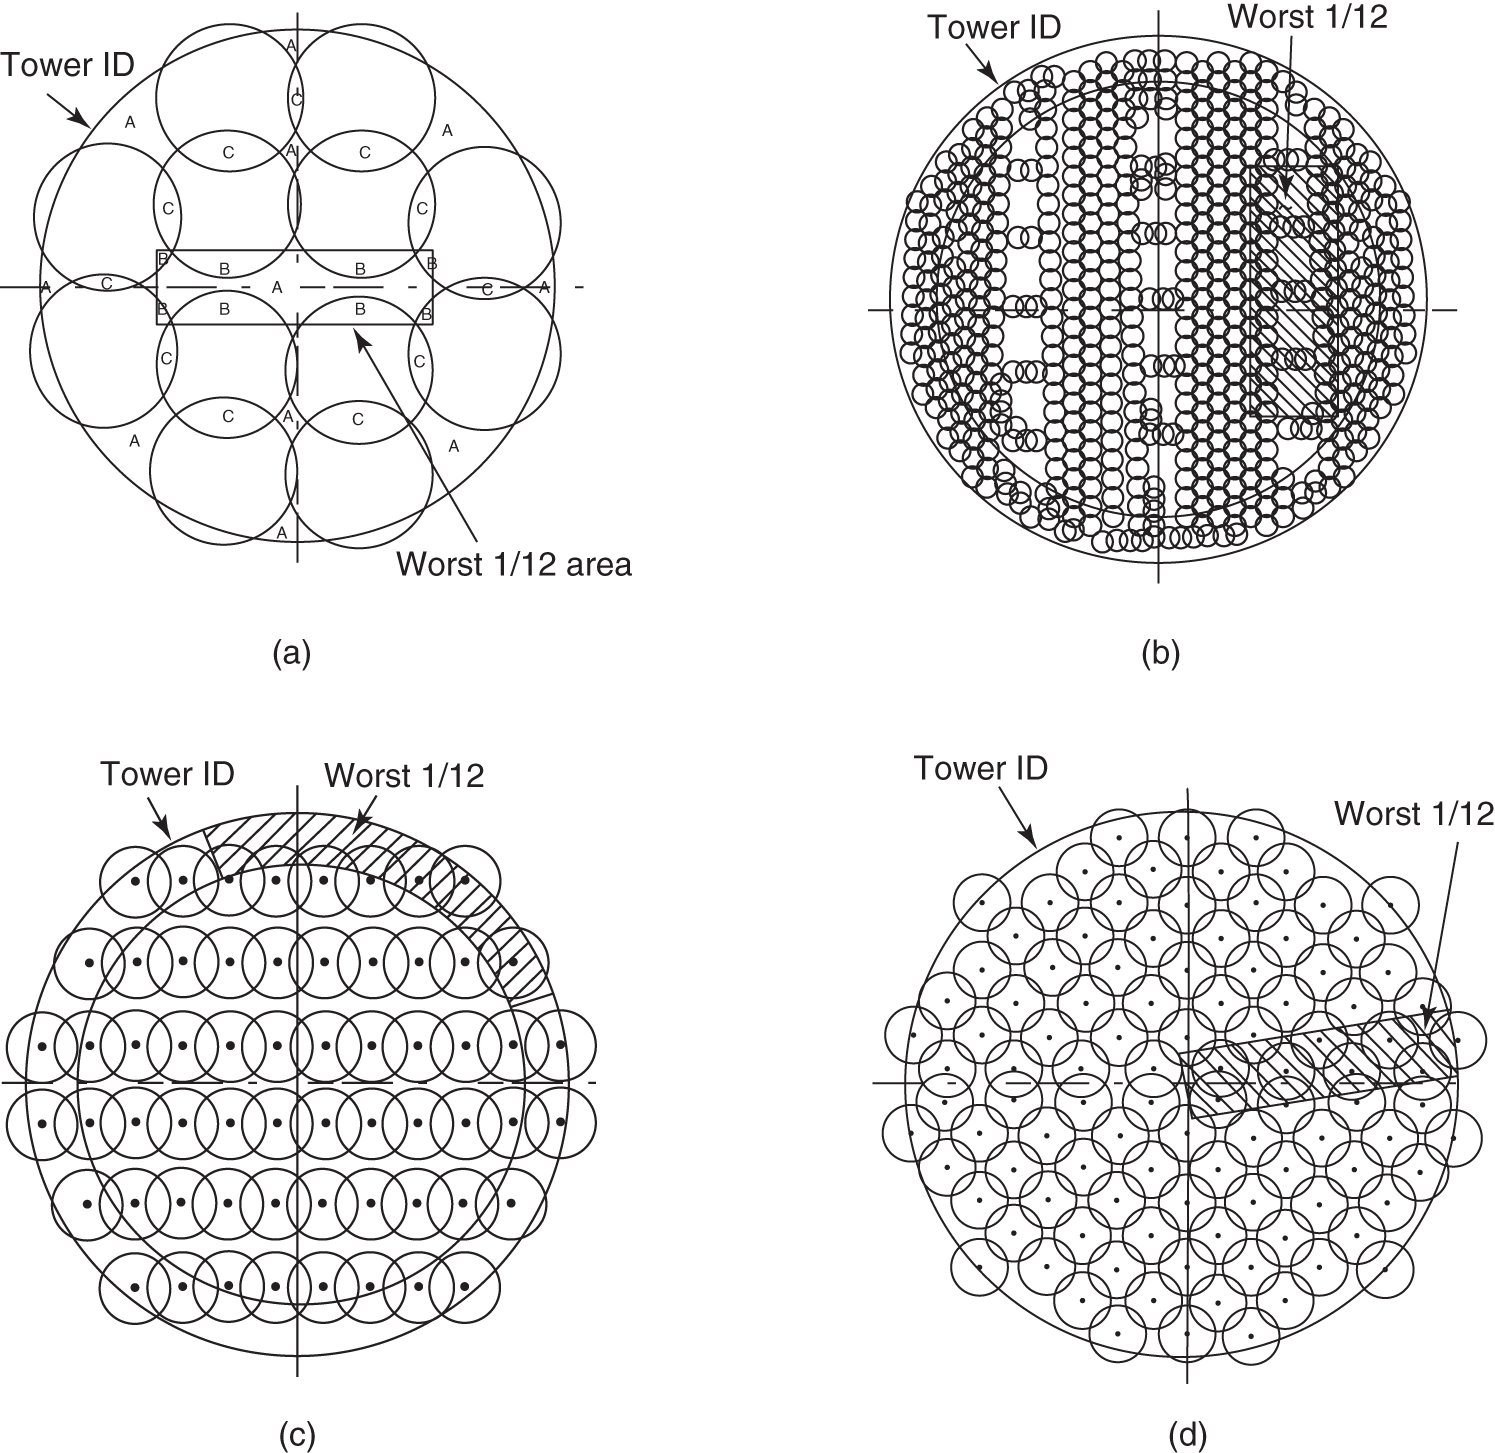
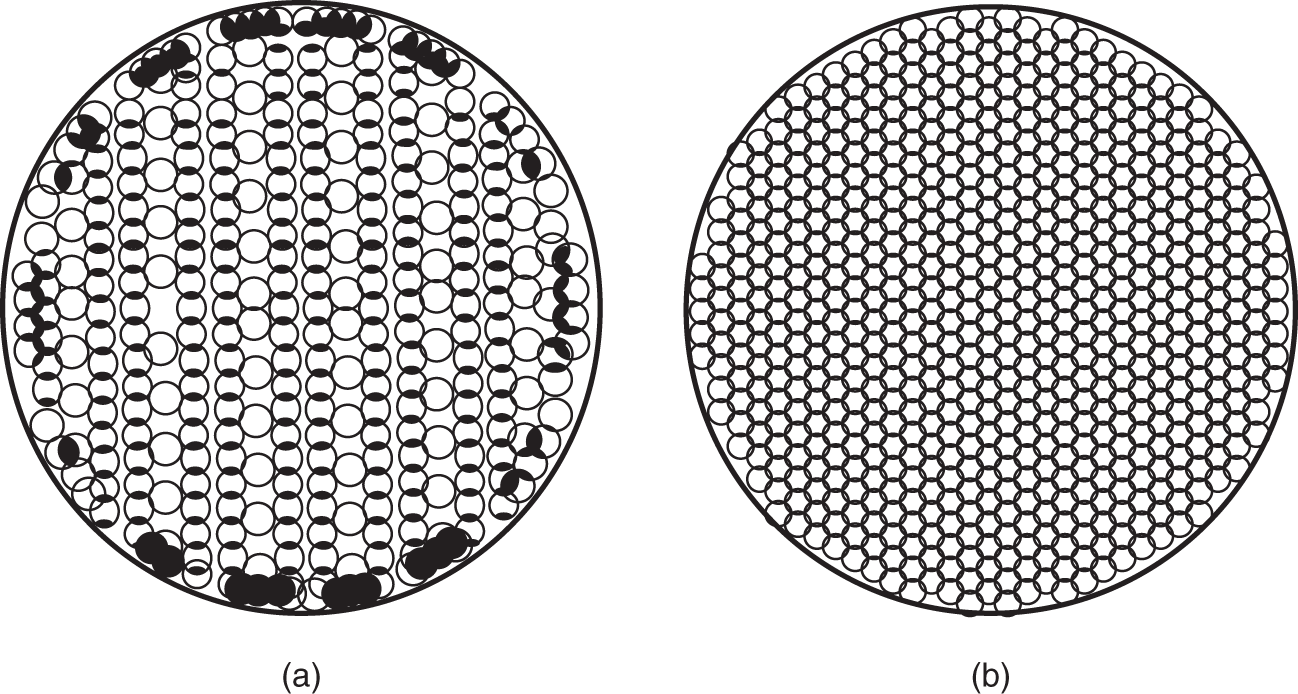
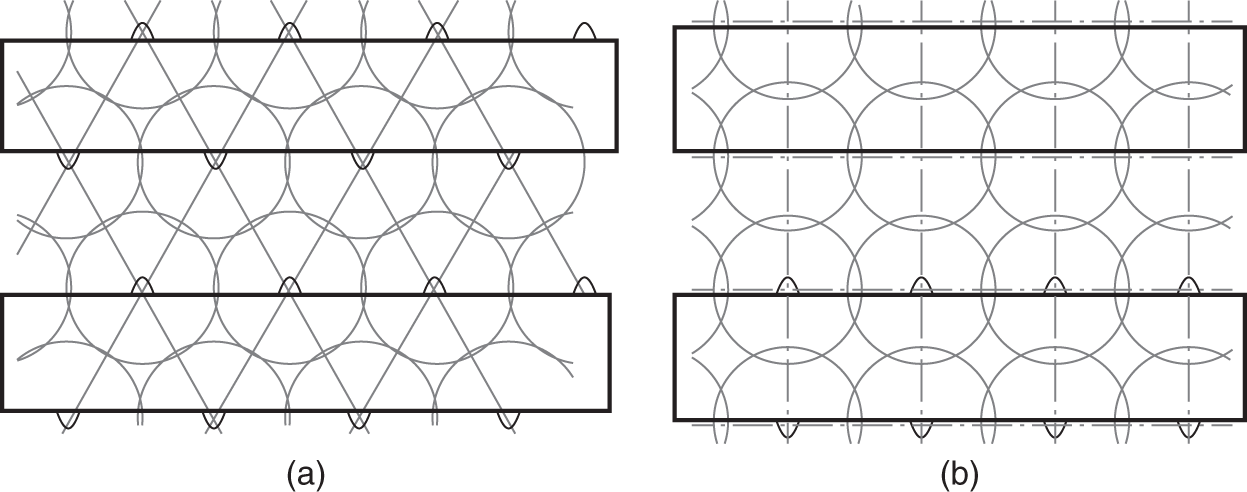
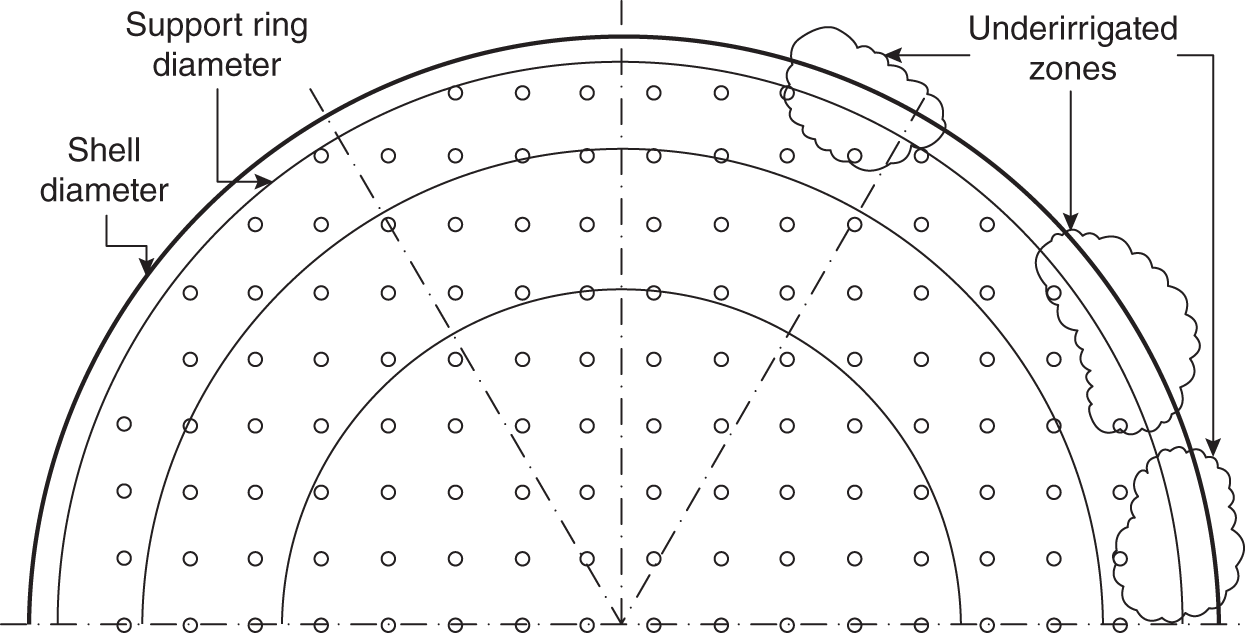
4.11 TROUBLESHOOTING FOR VAPOR MALDISTRIBUTION
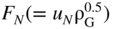 [uN is the vapor velocity at the narrowest area of the inlet pipe or nozzle, ft/s, and ρG is the gas or vapor density, lb/ft3] exceeds 22 ft/s (lb/ft3)0.5, or the kinetic energy of the inlet gas exceeds eight times the pressure drop through the first foot of packing, or the pressure drop through the bed is less than 0.08 in. water/ft of packing. Cases of poor packing performance at high FN values have been reported (69)
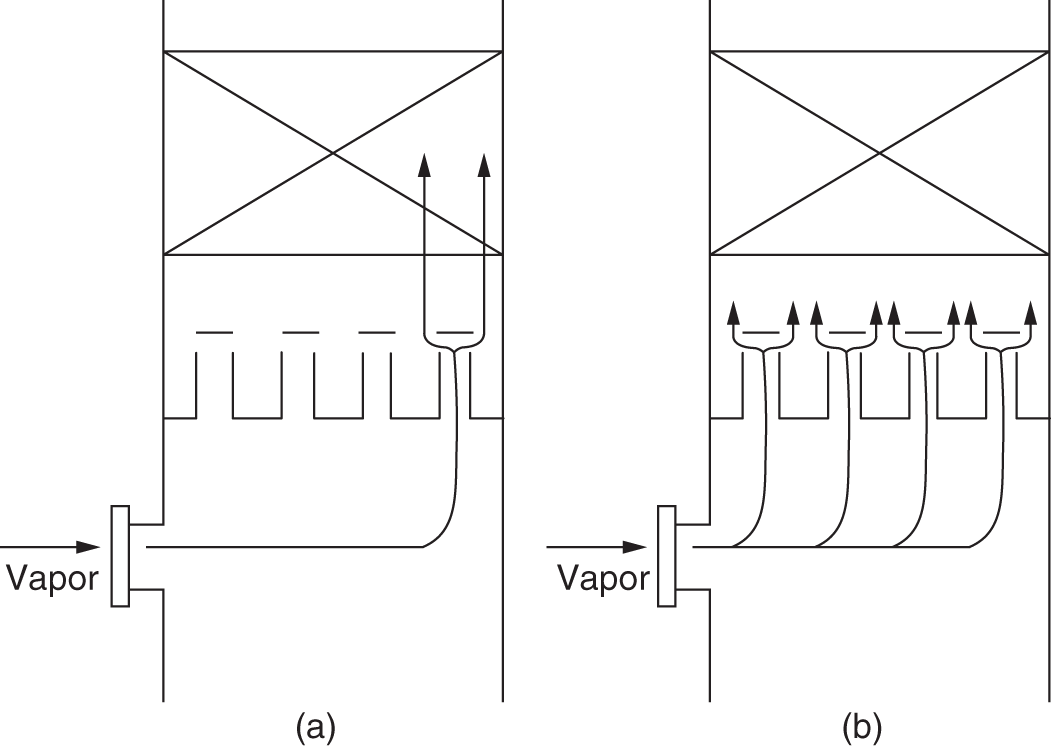
4.12 VAPOR MALDISTRIBUTION IN THE FEED ZONE TO REFINERY VACUUM TOWERS
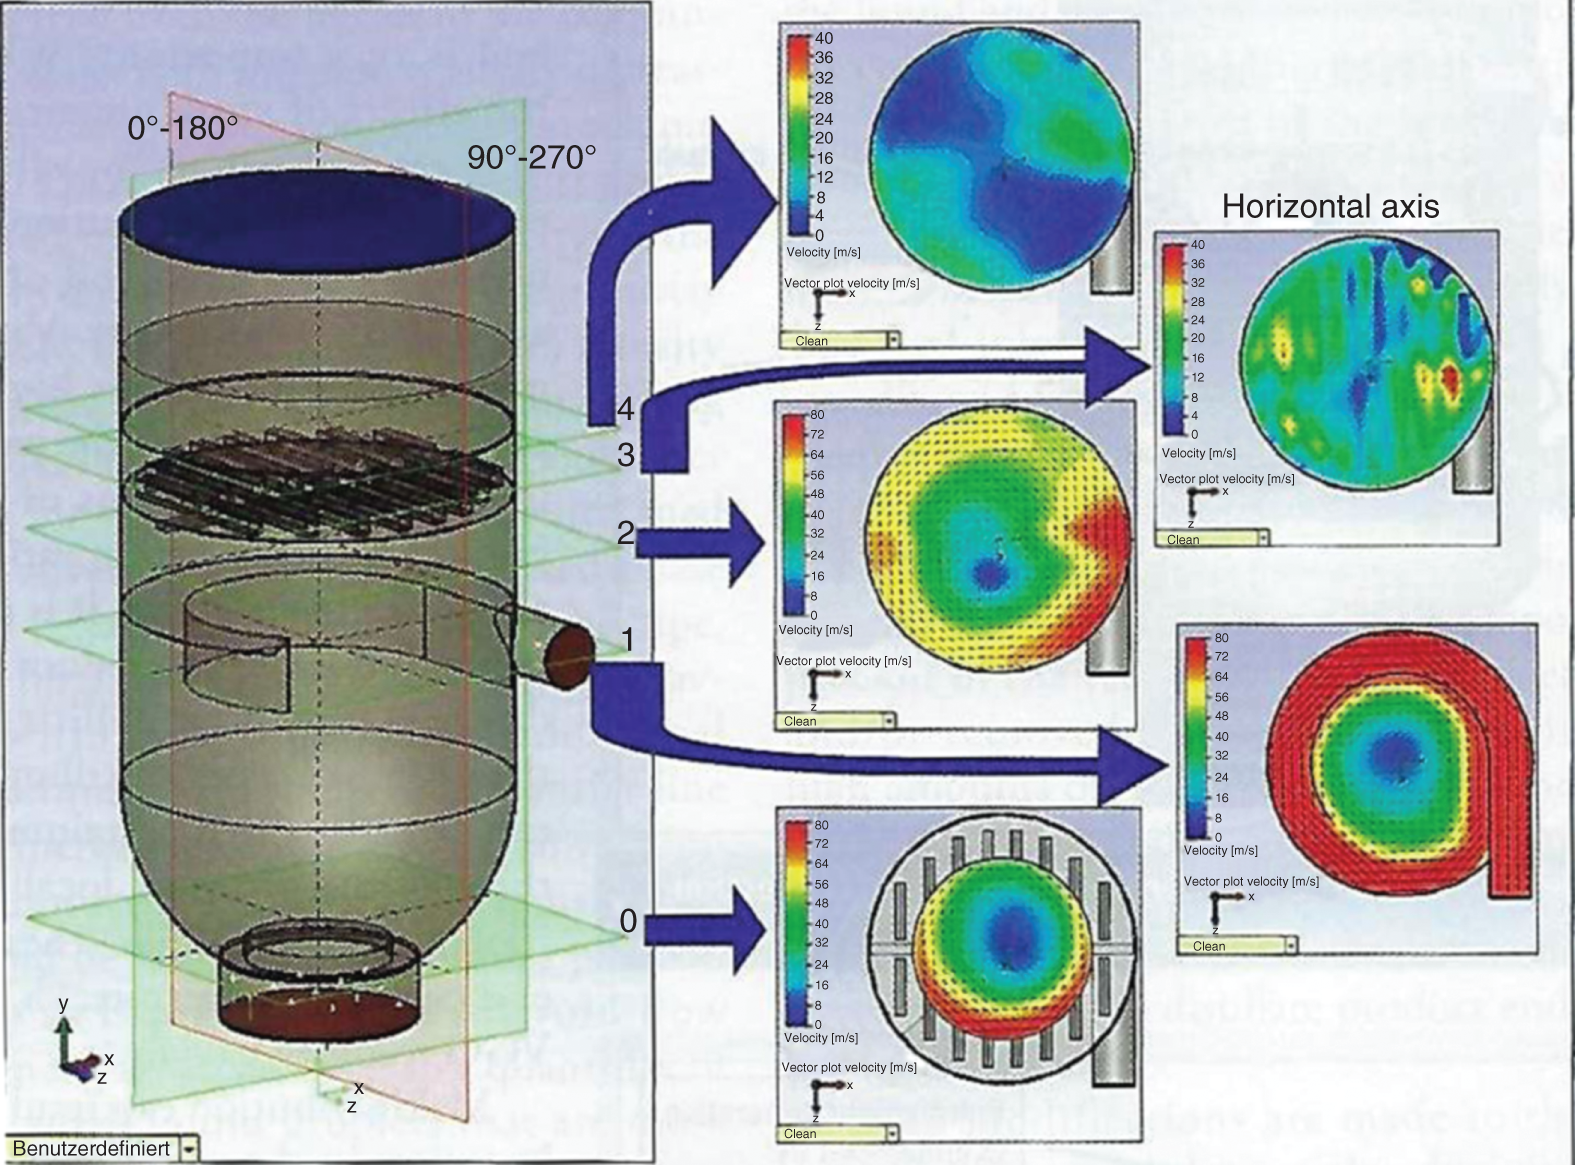
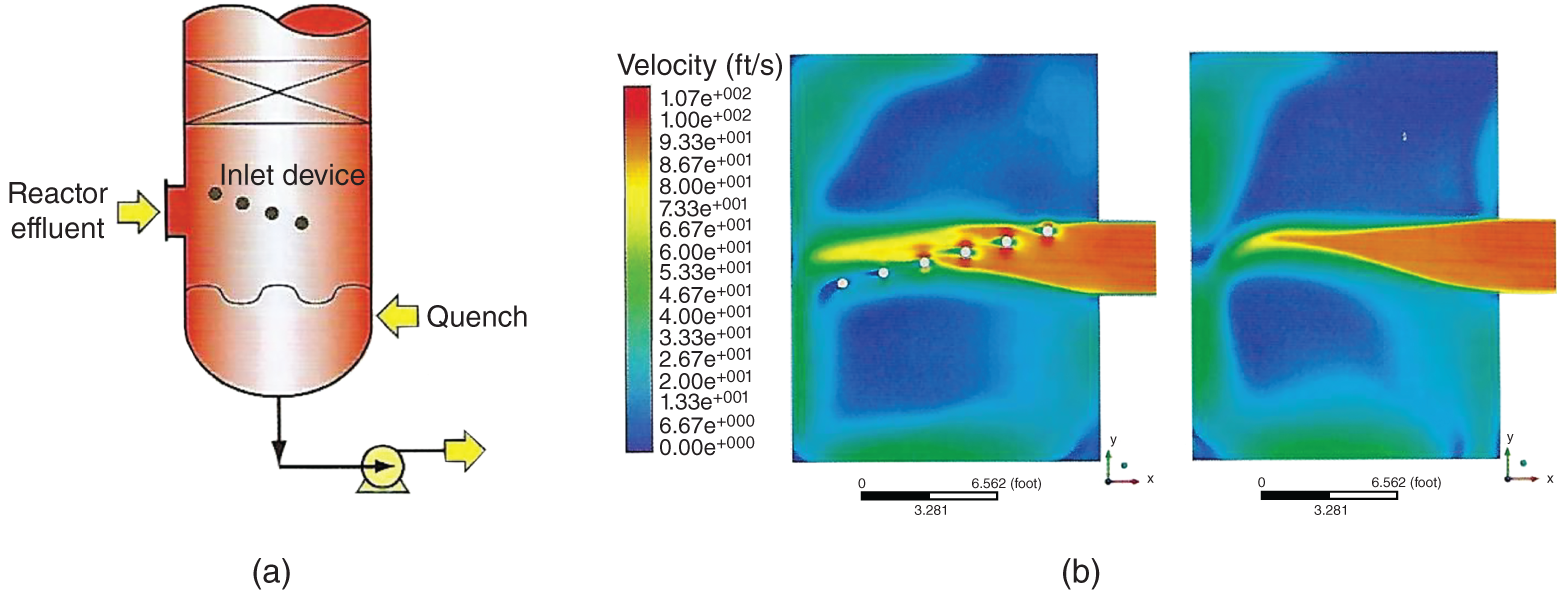
4.13 TROUBLESHOOTING FLASHING FEEDS ENTRY
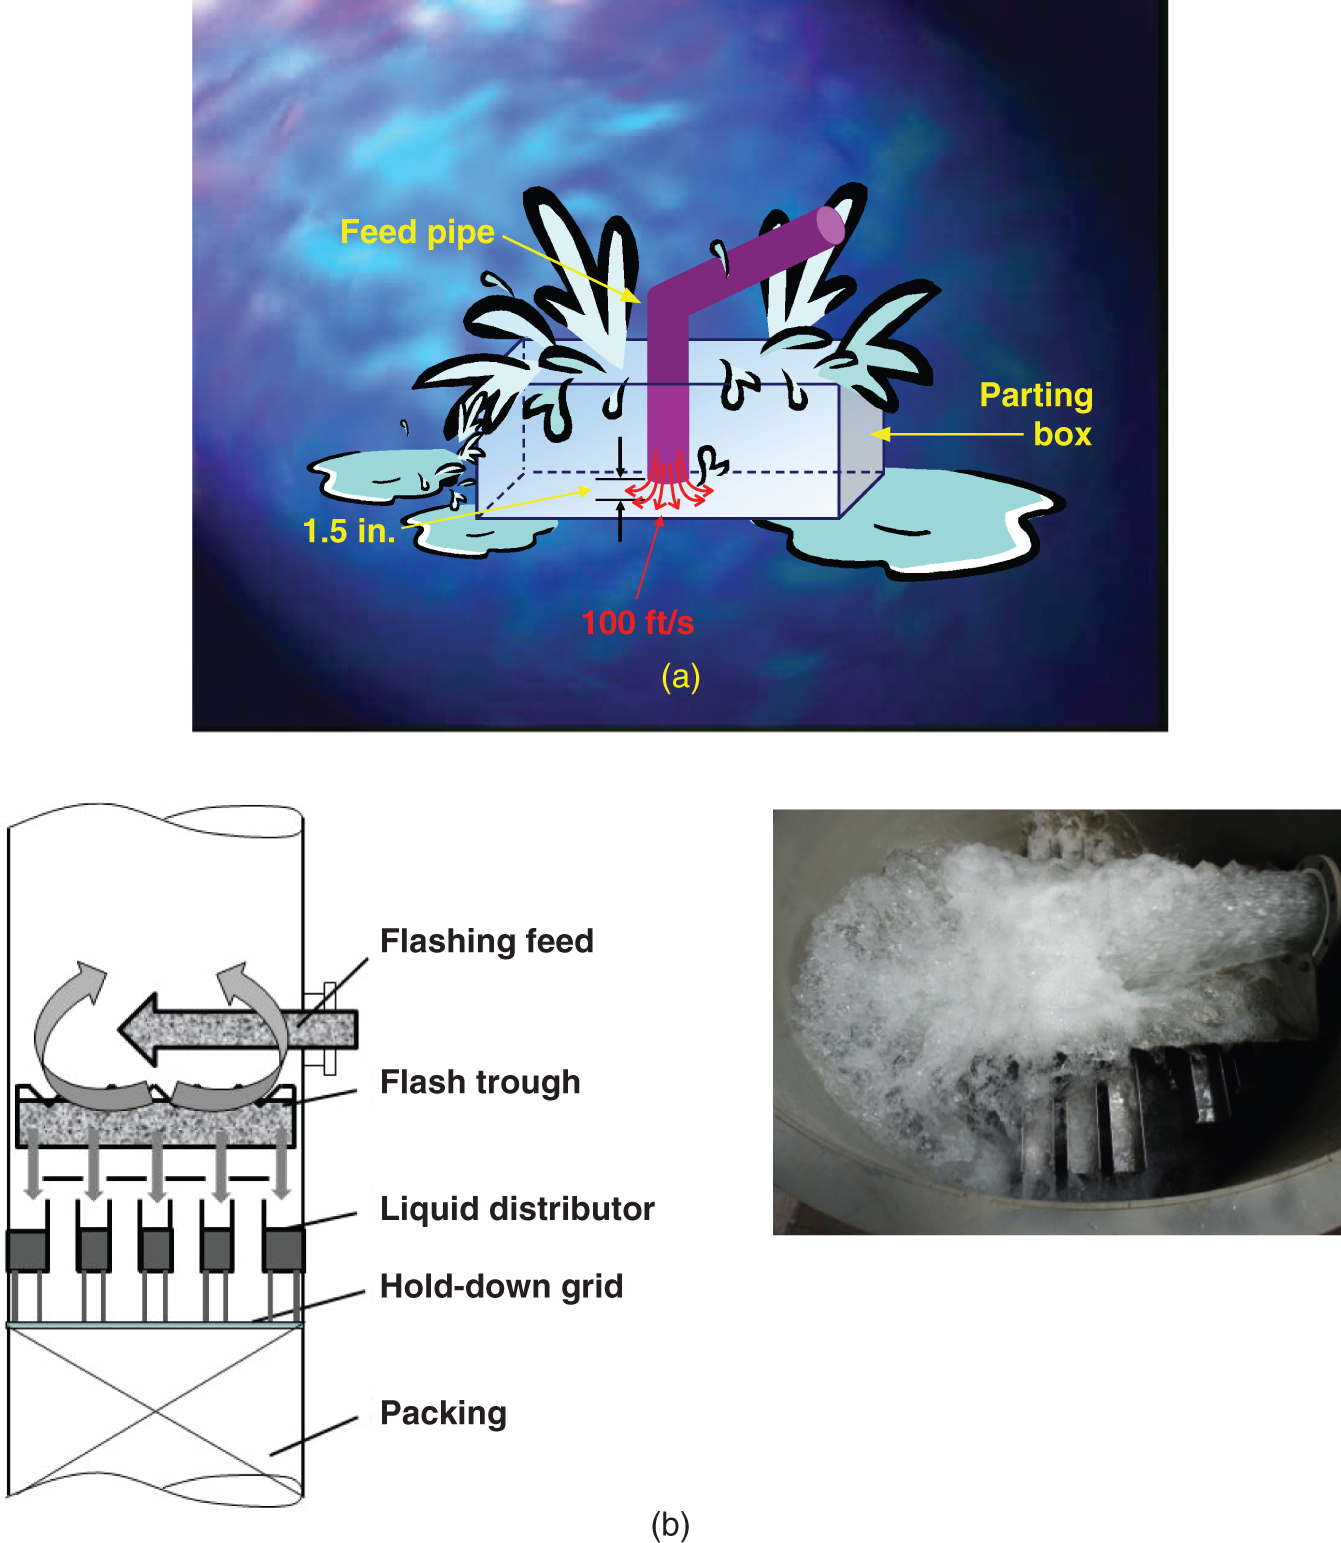
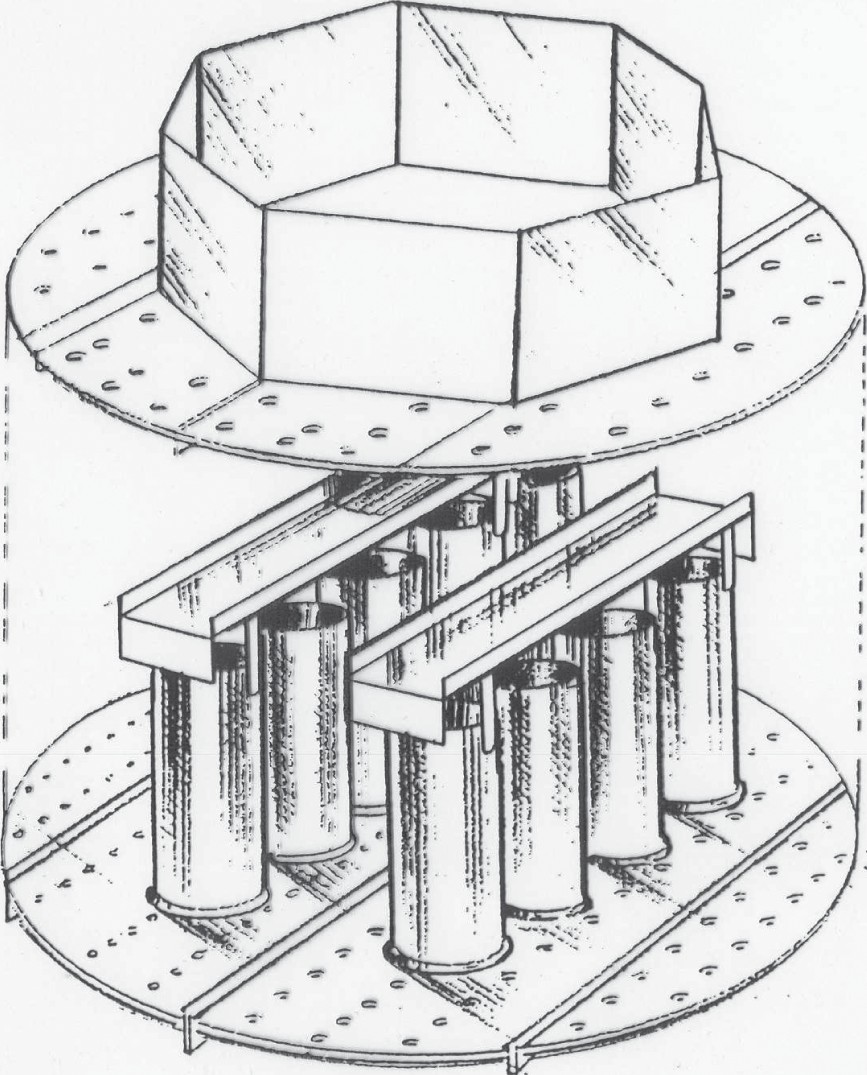
4.14 TROUBLESHOOTING NOTCHED DISTRIBUTORS
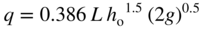
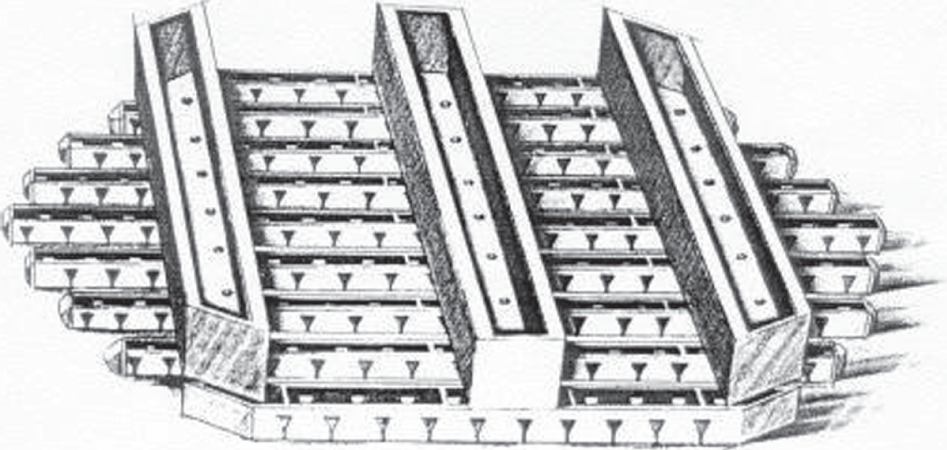
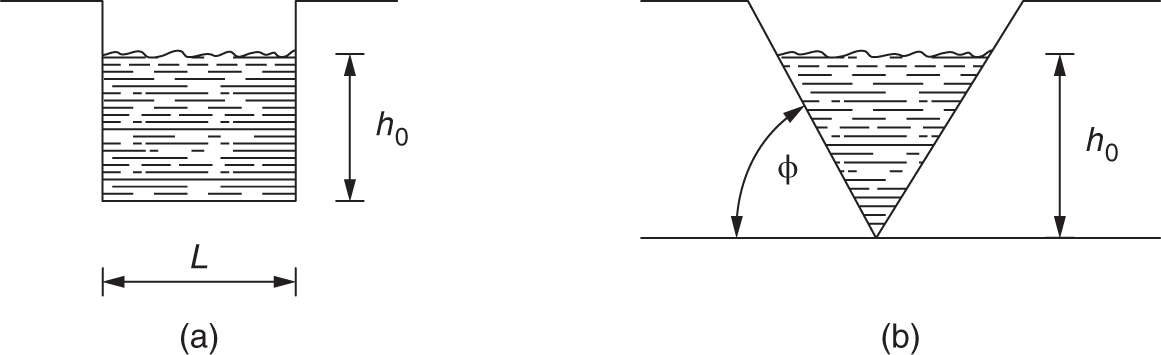
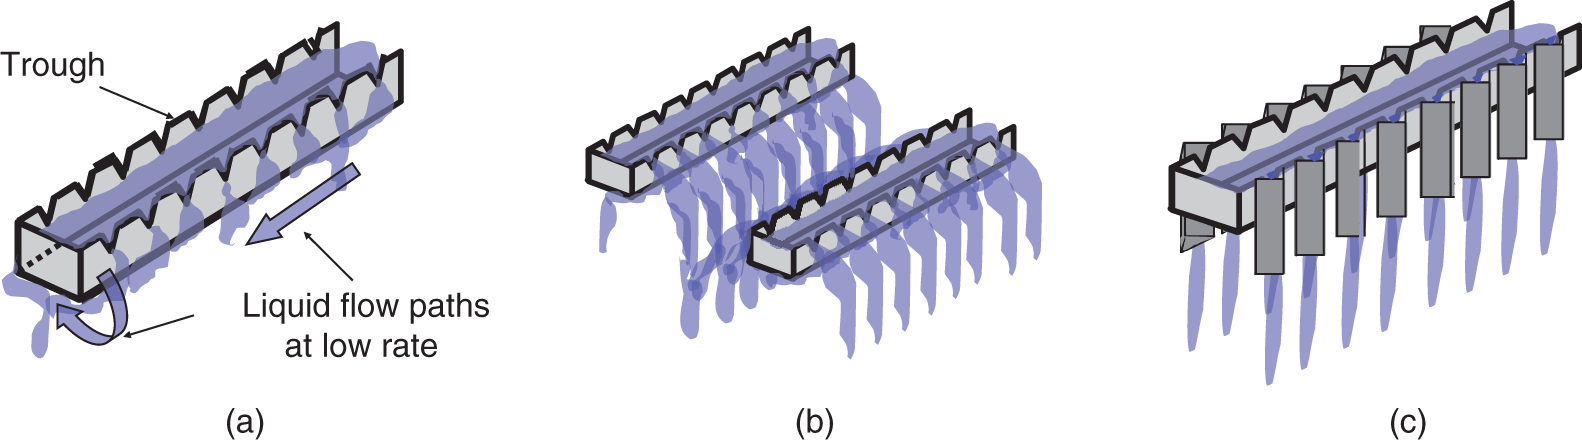
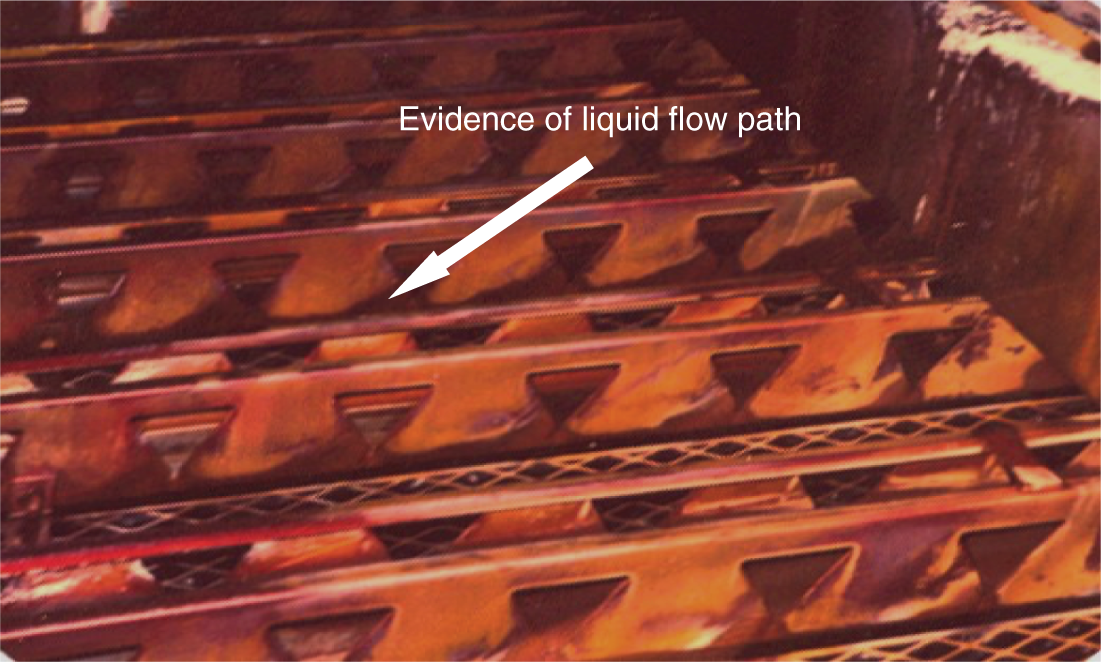
4.15 TROUBLESHOOTING SPRAY NOZZLE DISTRIBUTORS
4.16 DISTRIBUTOR WATER TESTS
4.16.1 Gravity Distributor Water Tests in the Supplier Shop
4.16.2 Gravity Distributor Water Tests In situ
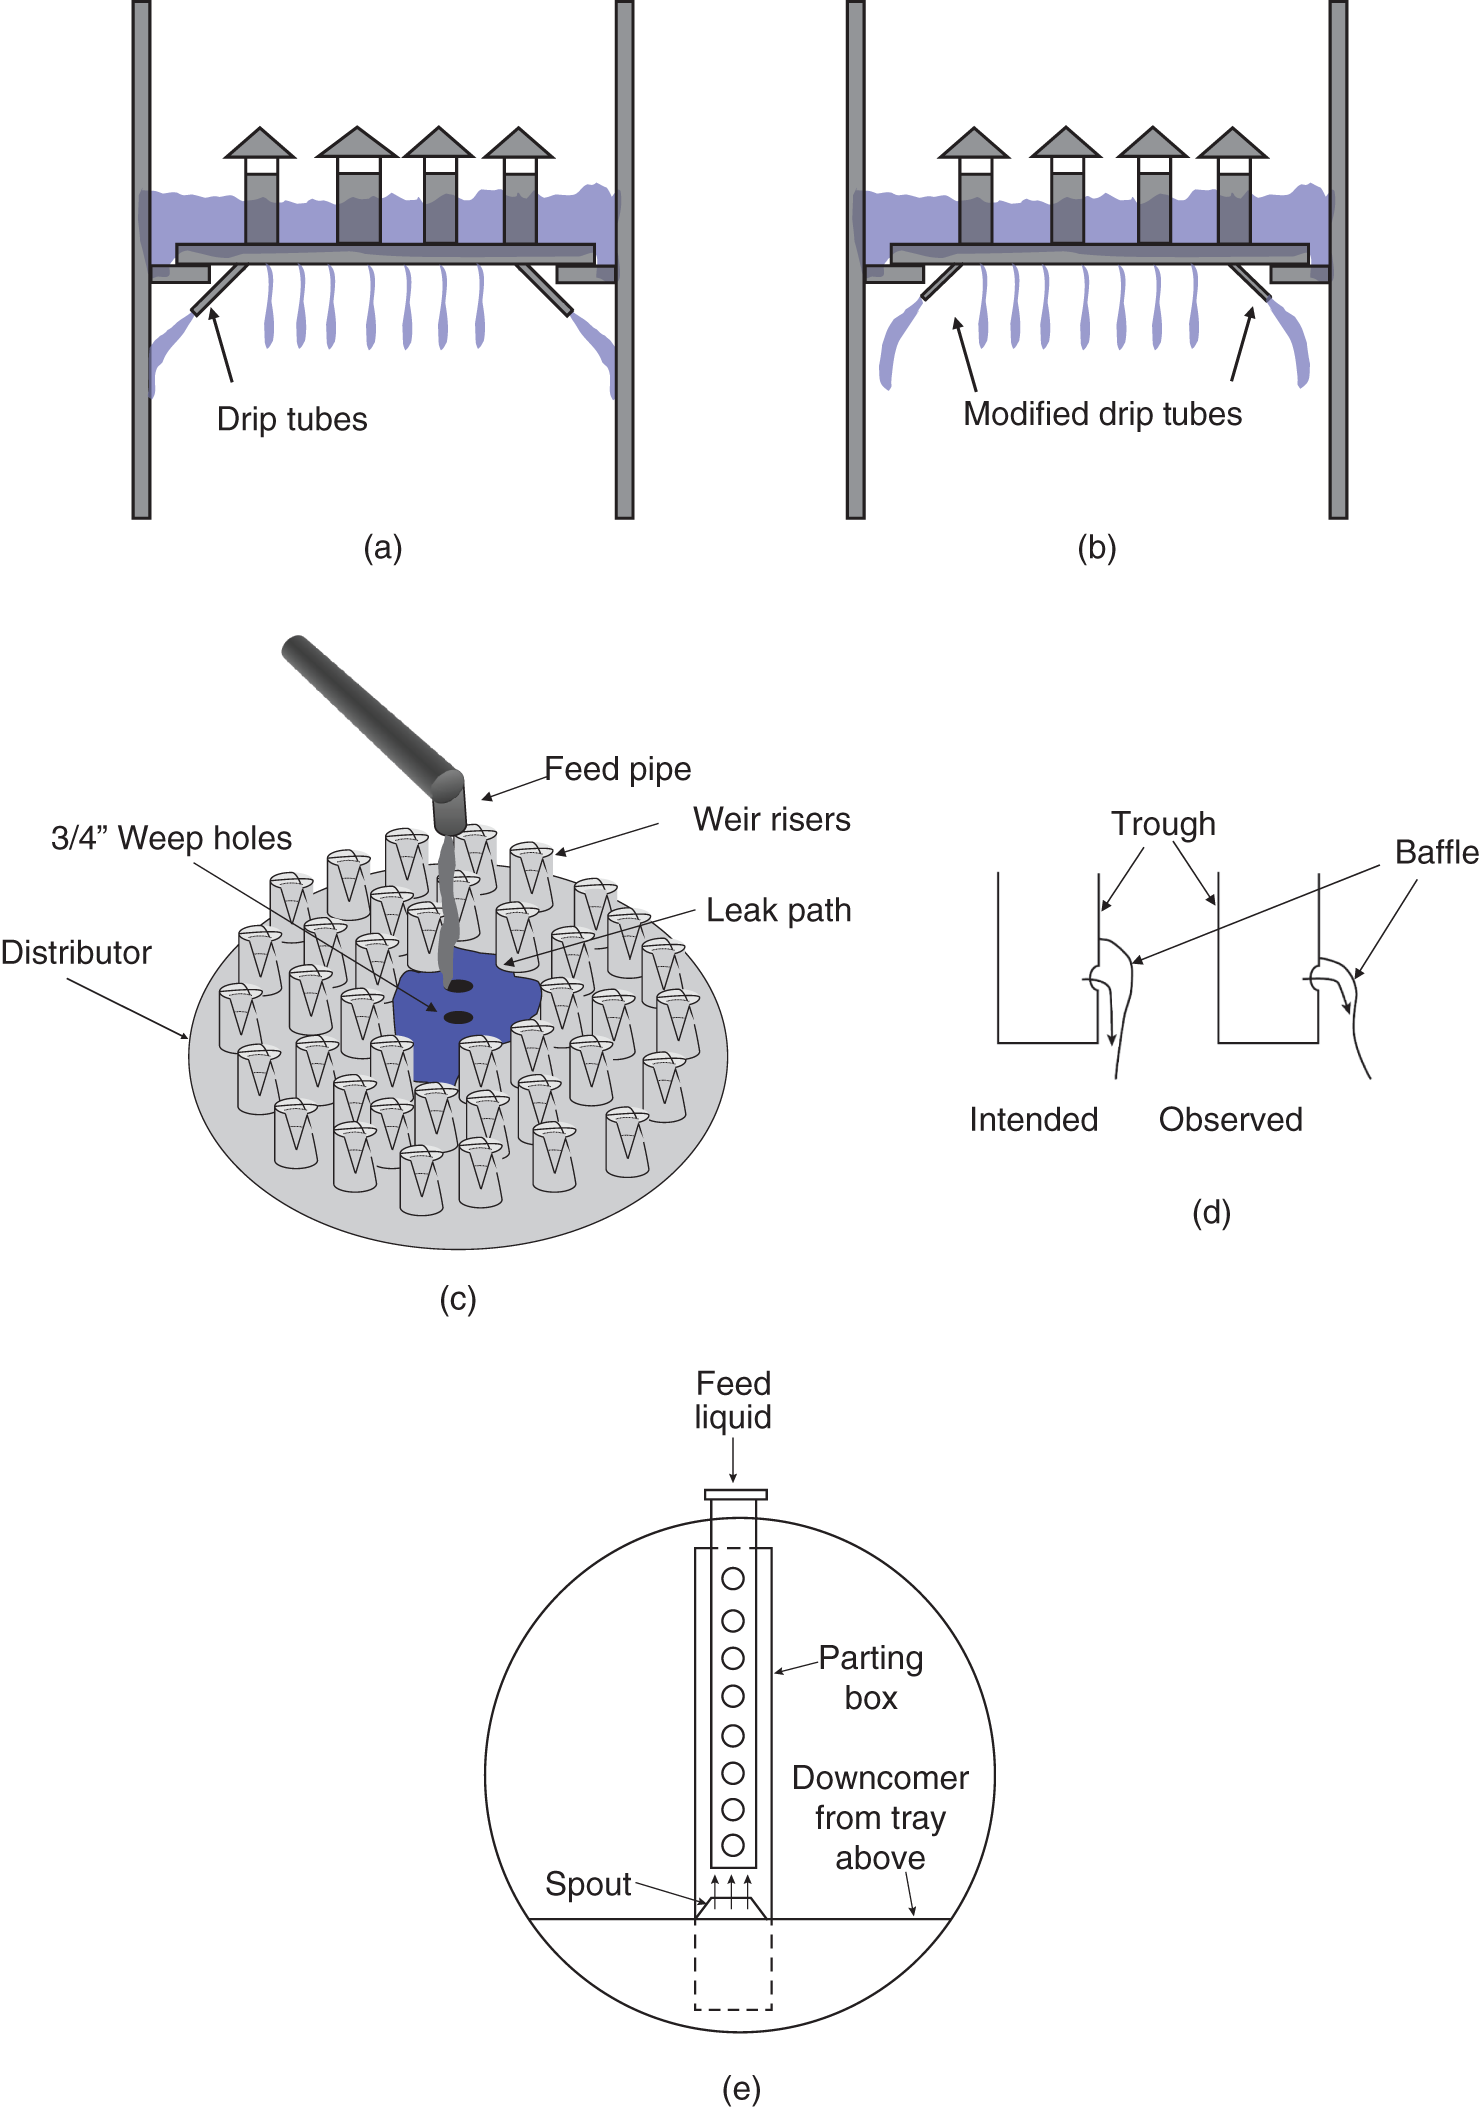
Diagnosing Packed Tower Maldistribution
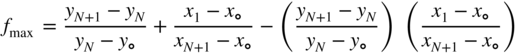


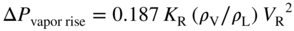
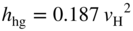

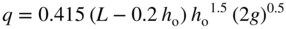
(4.8)
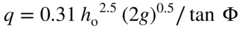
(4.10)