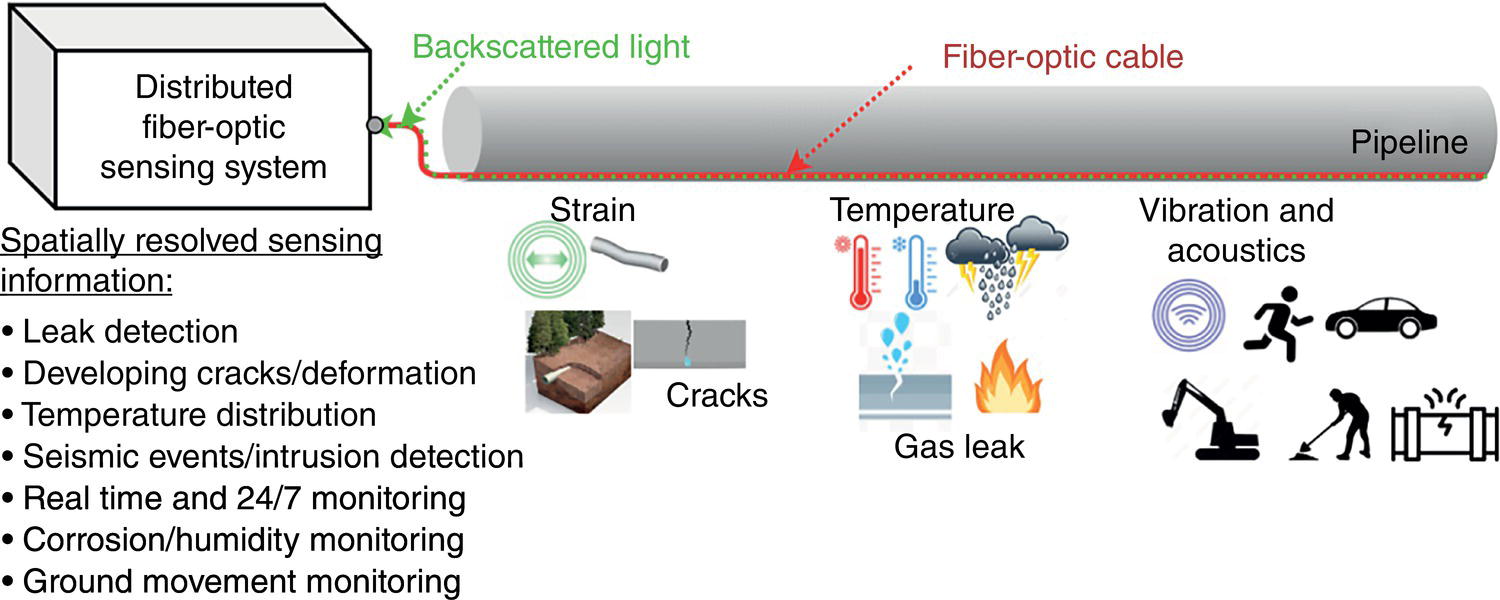
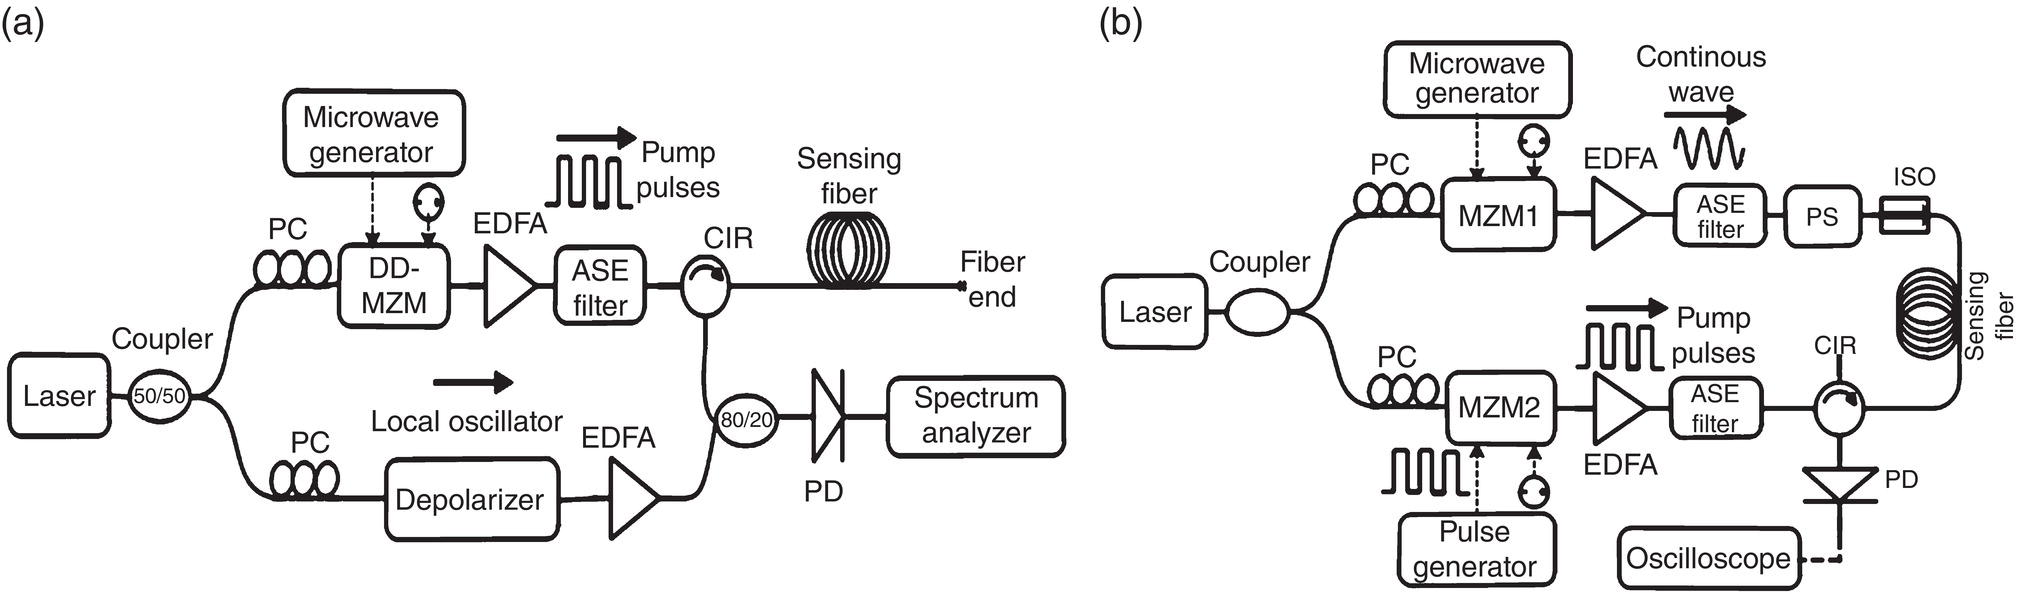
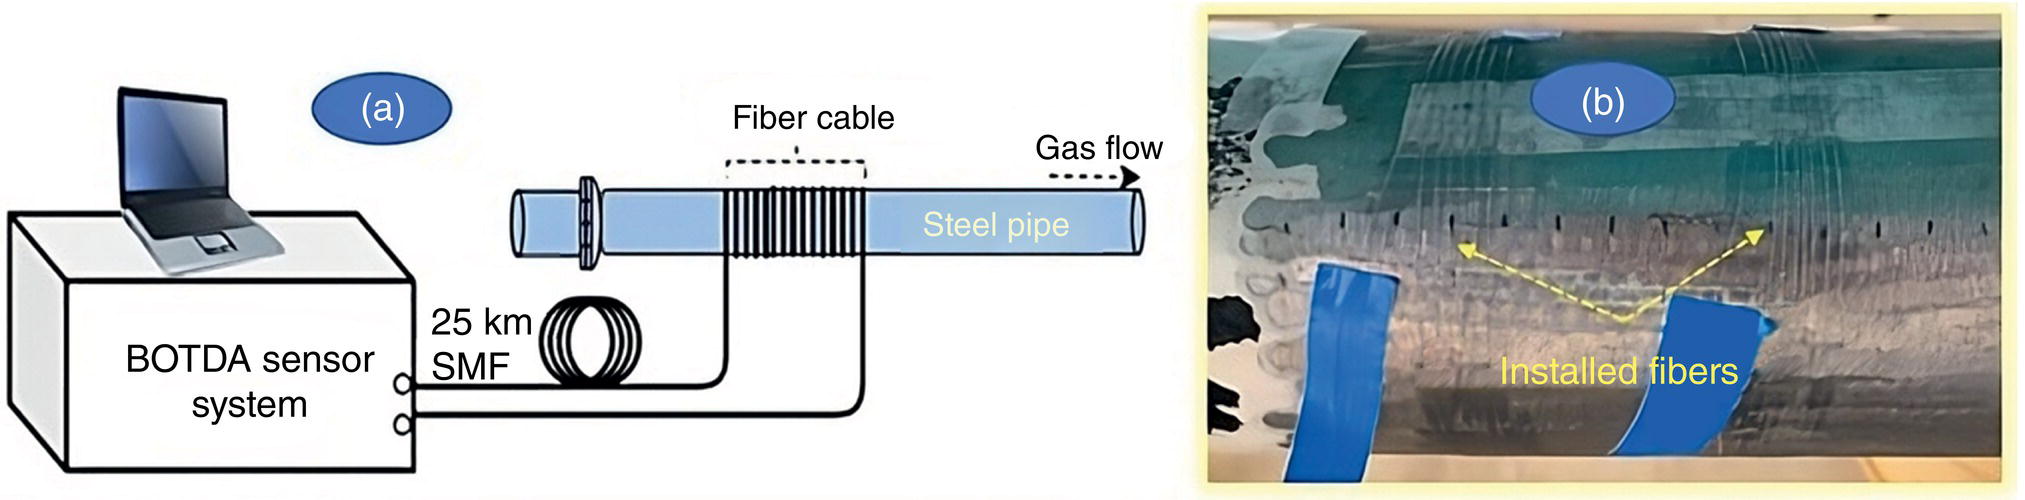
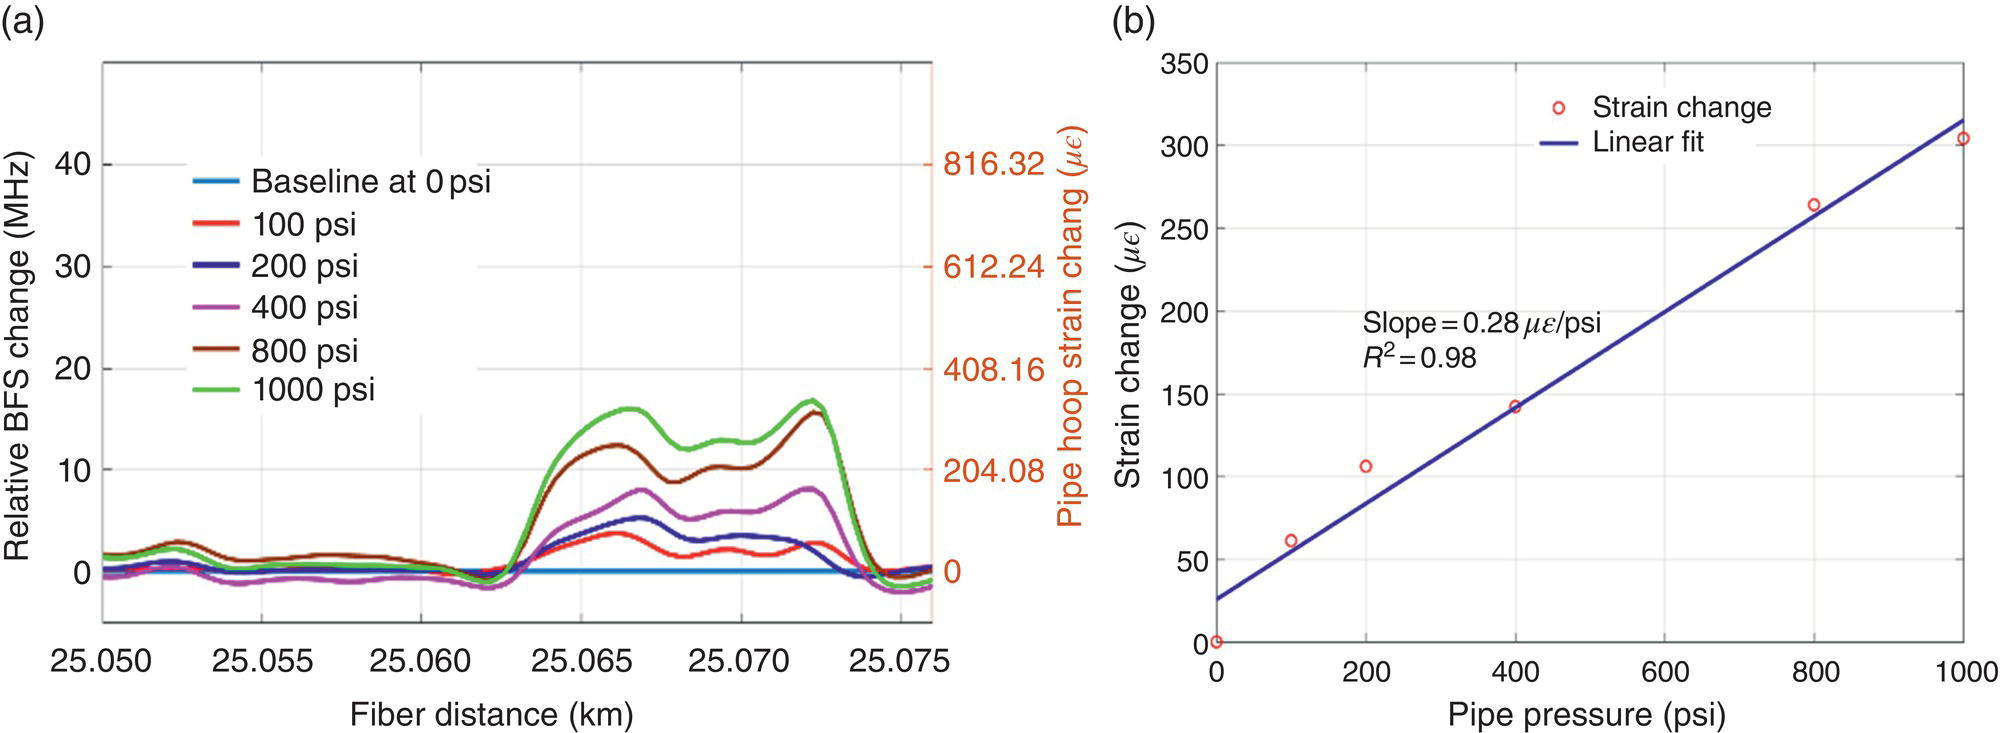
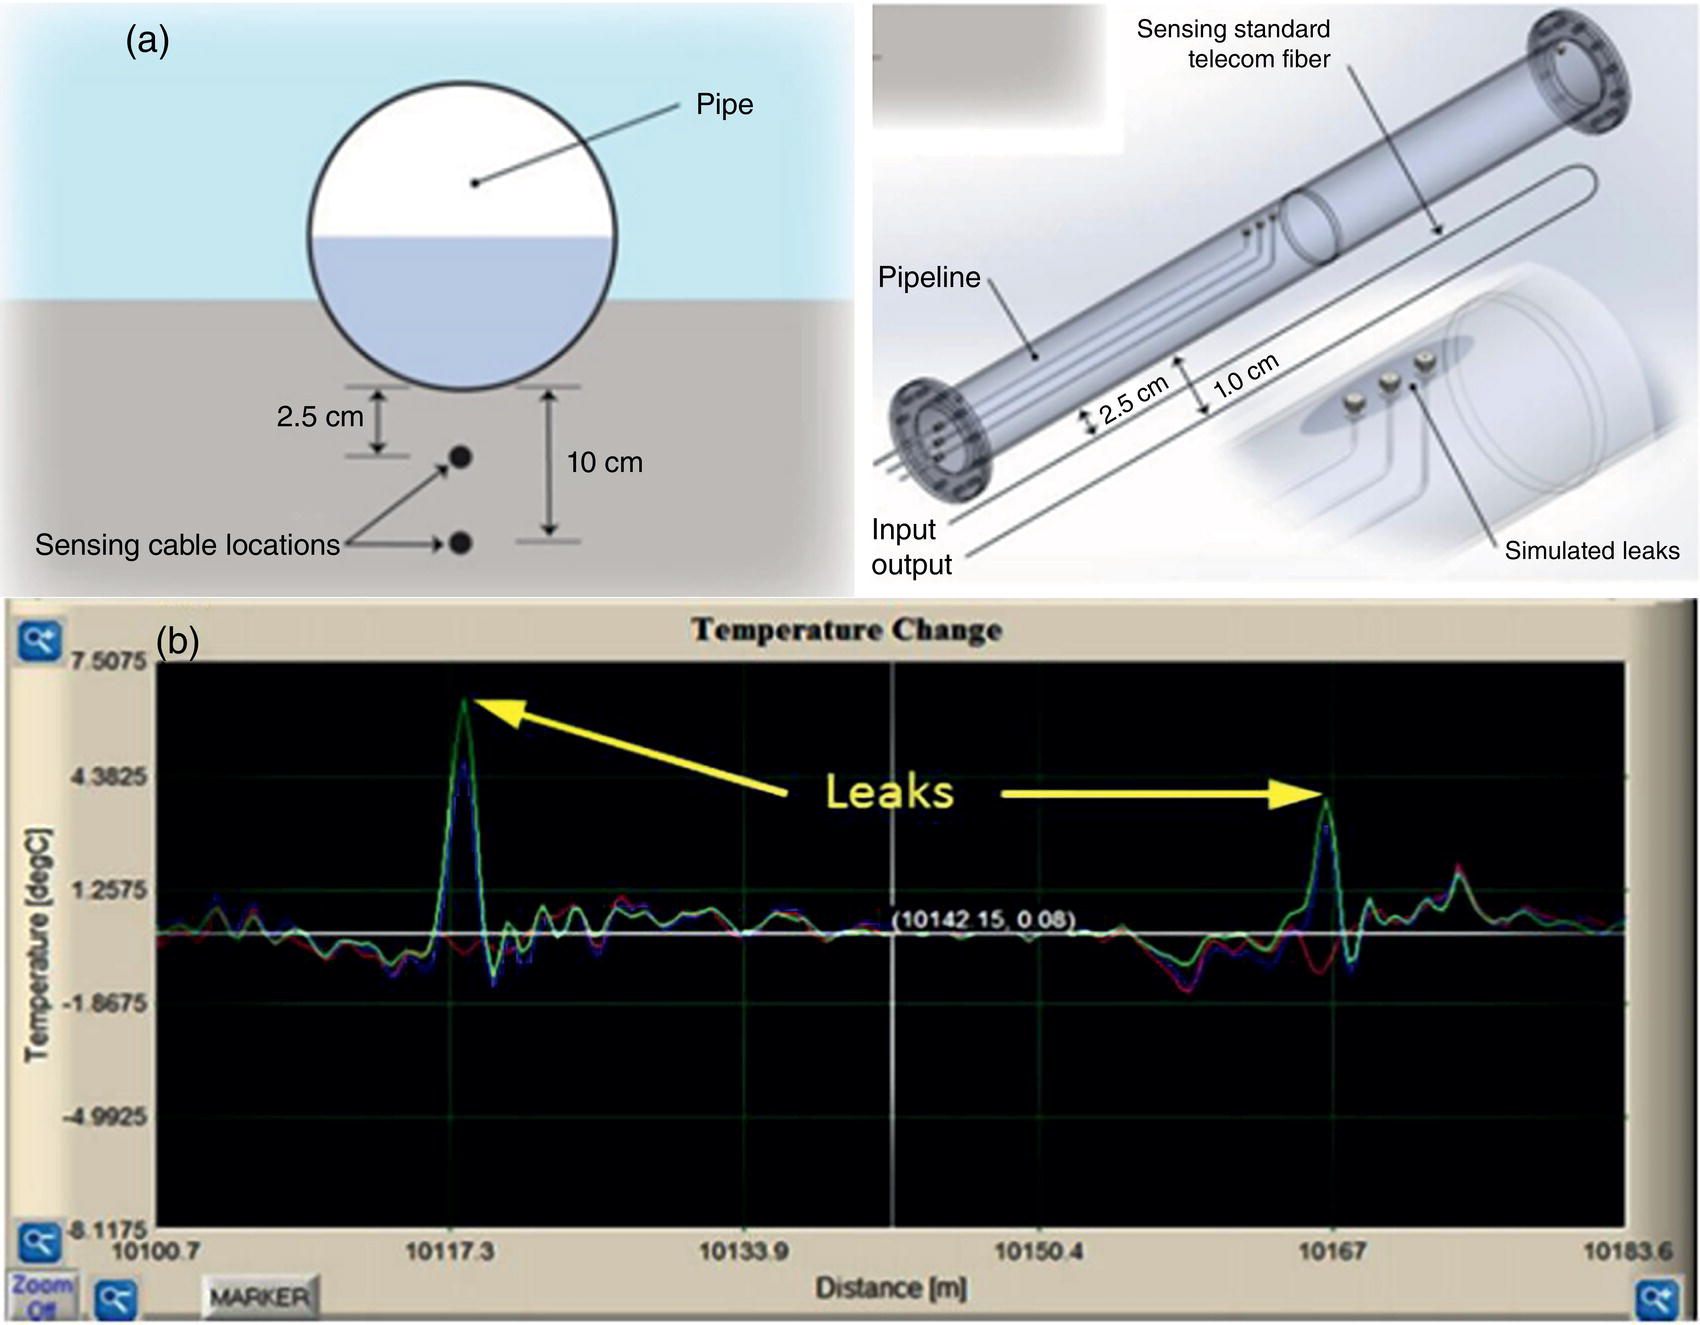
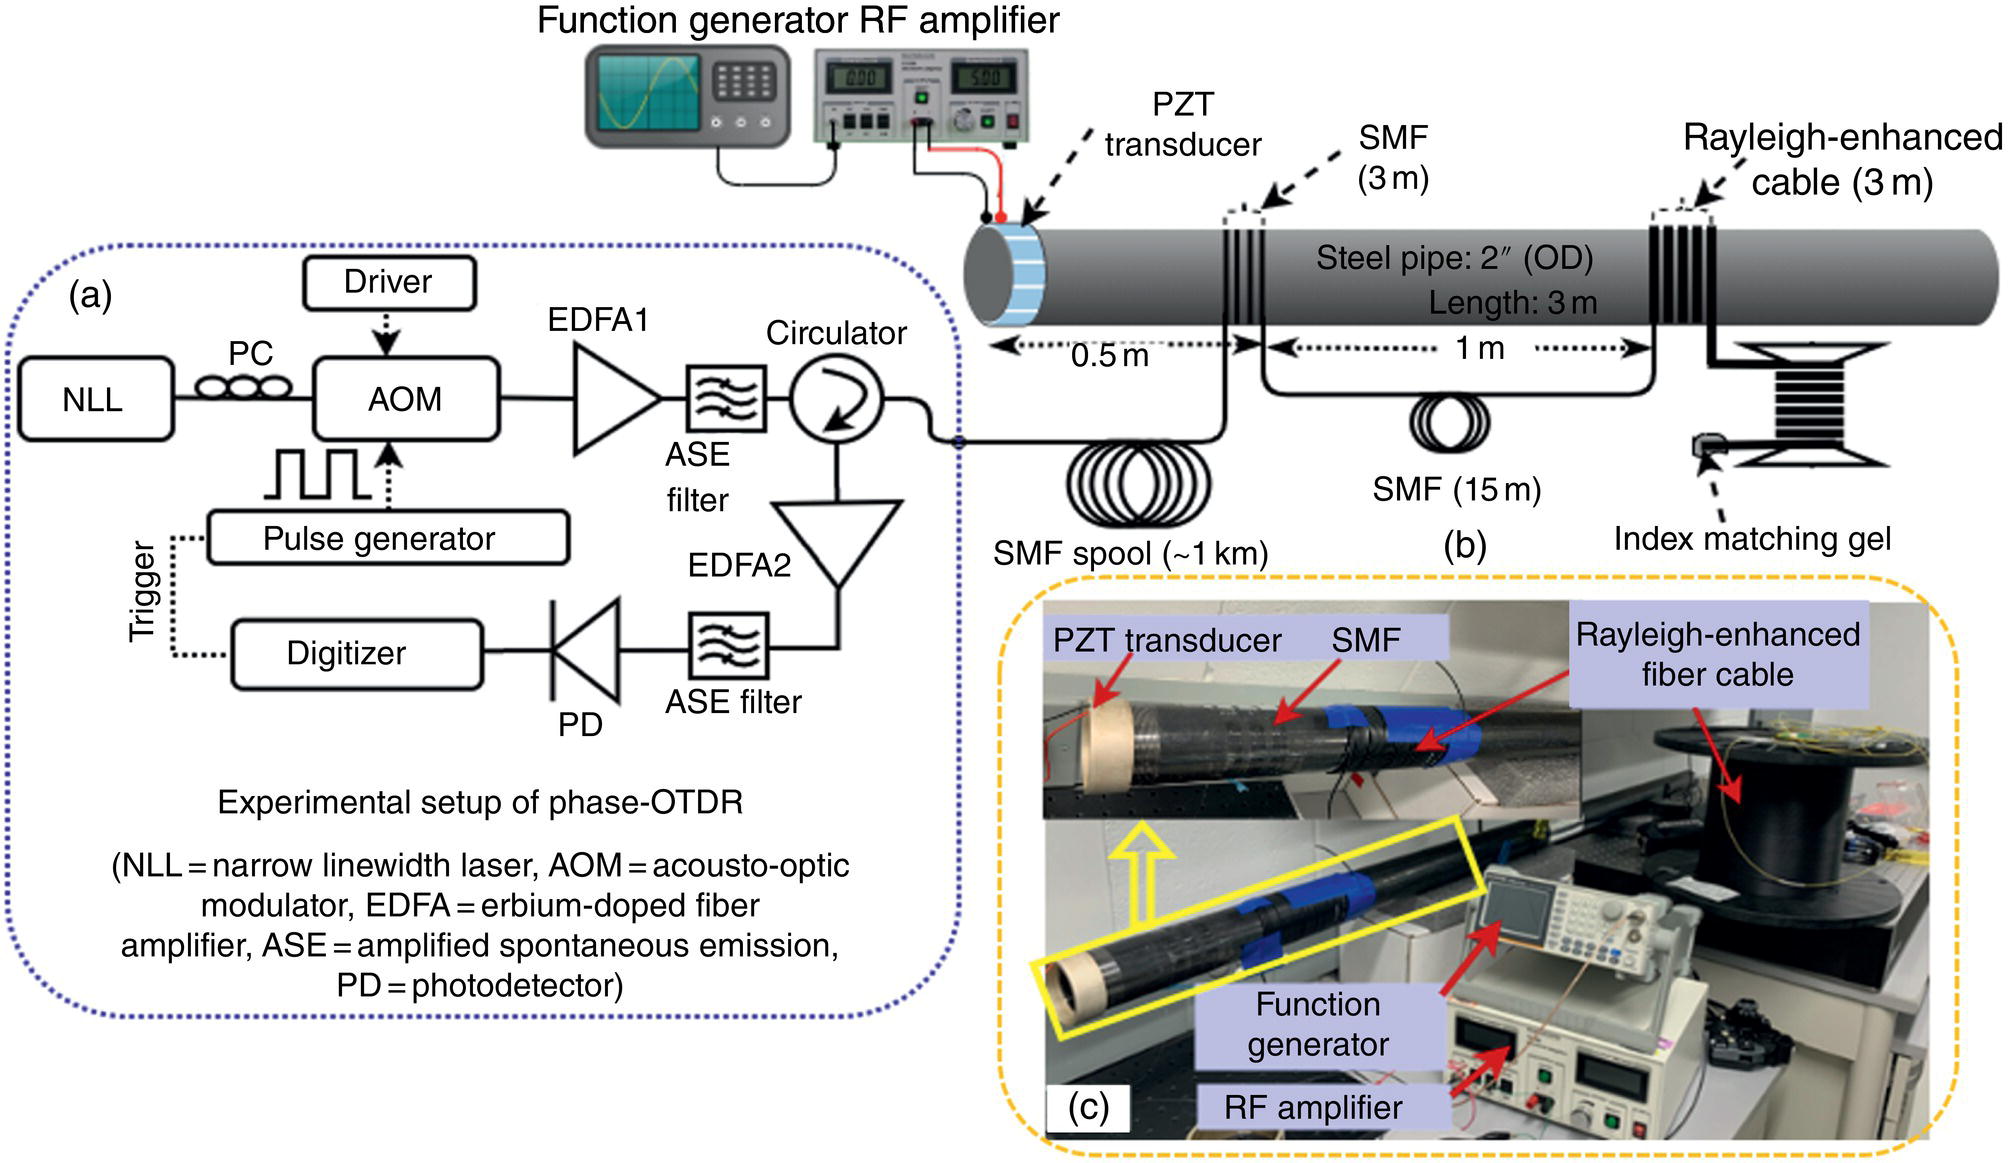
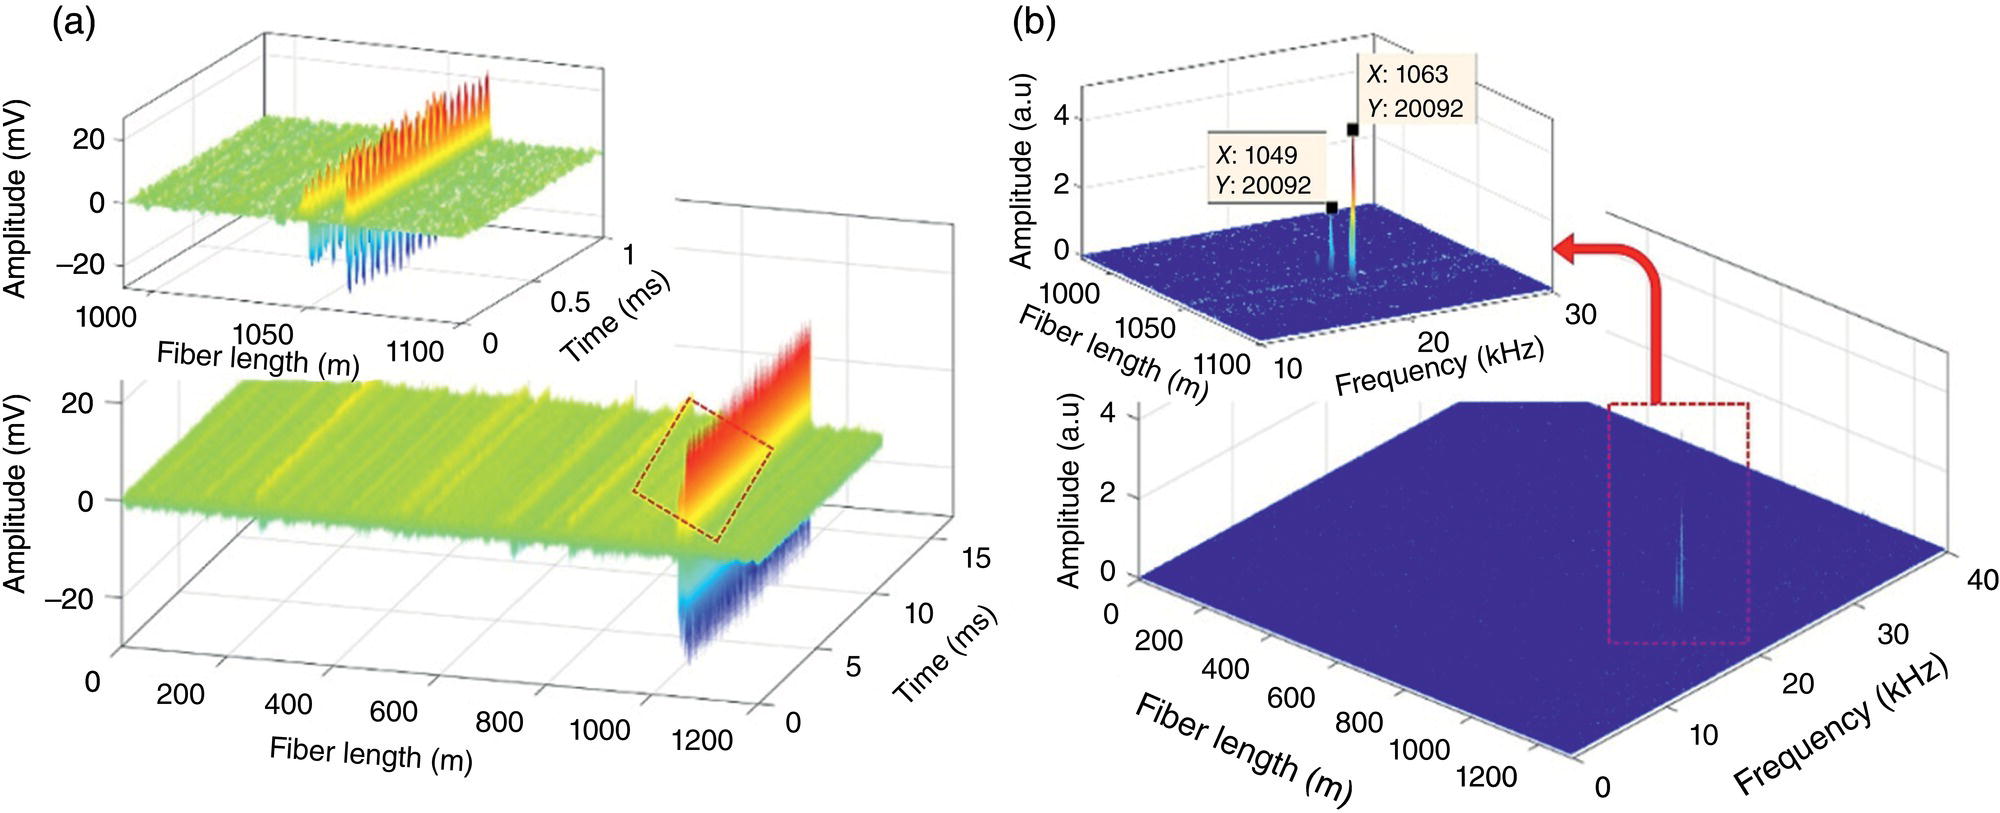
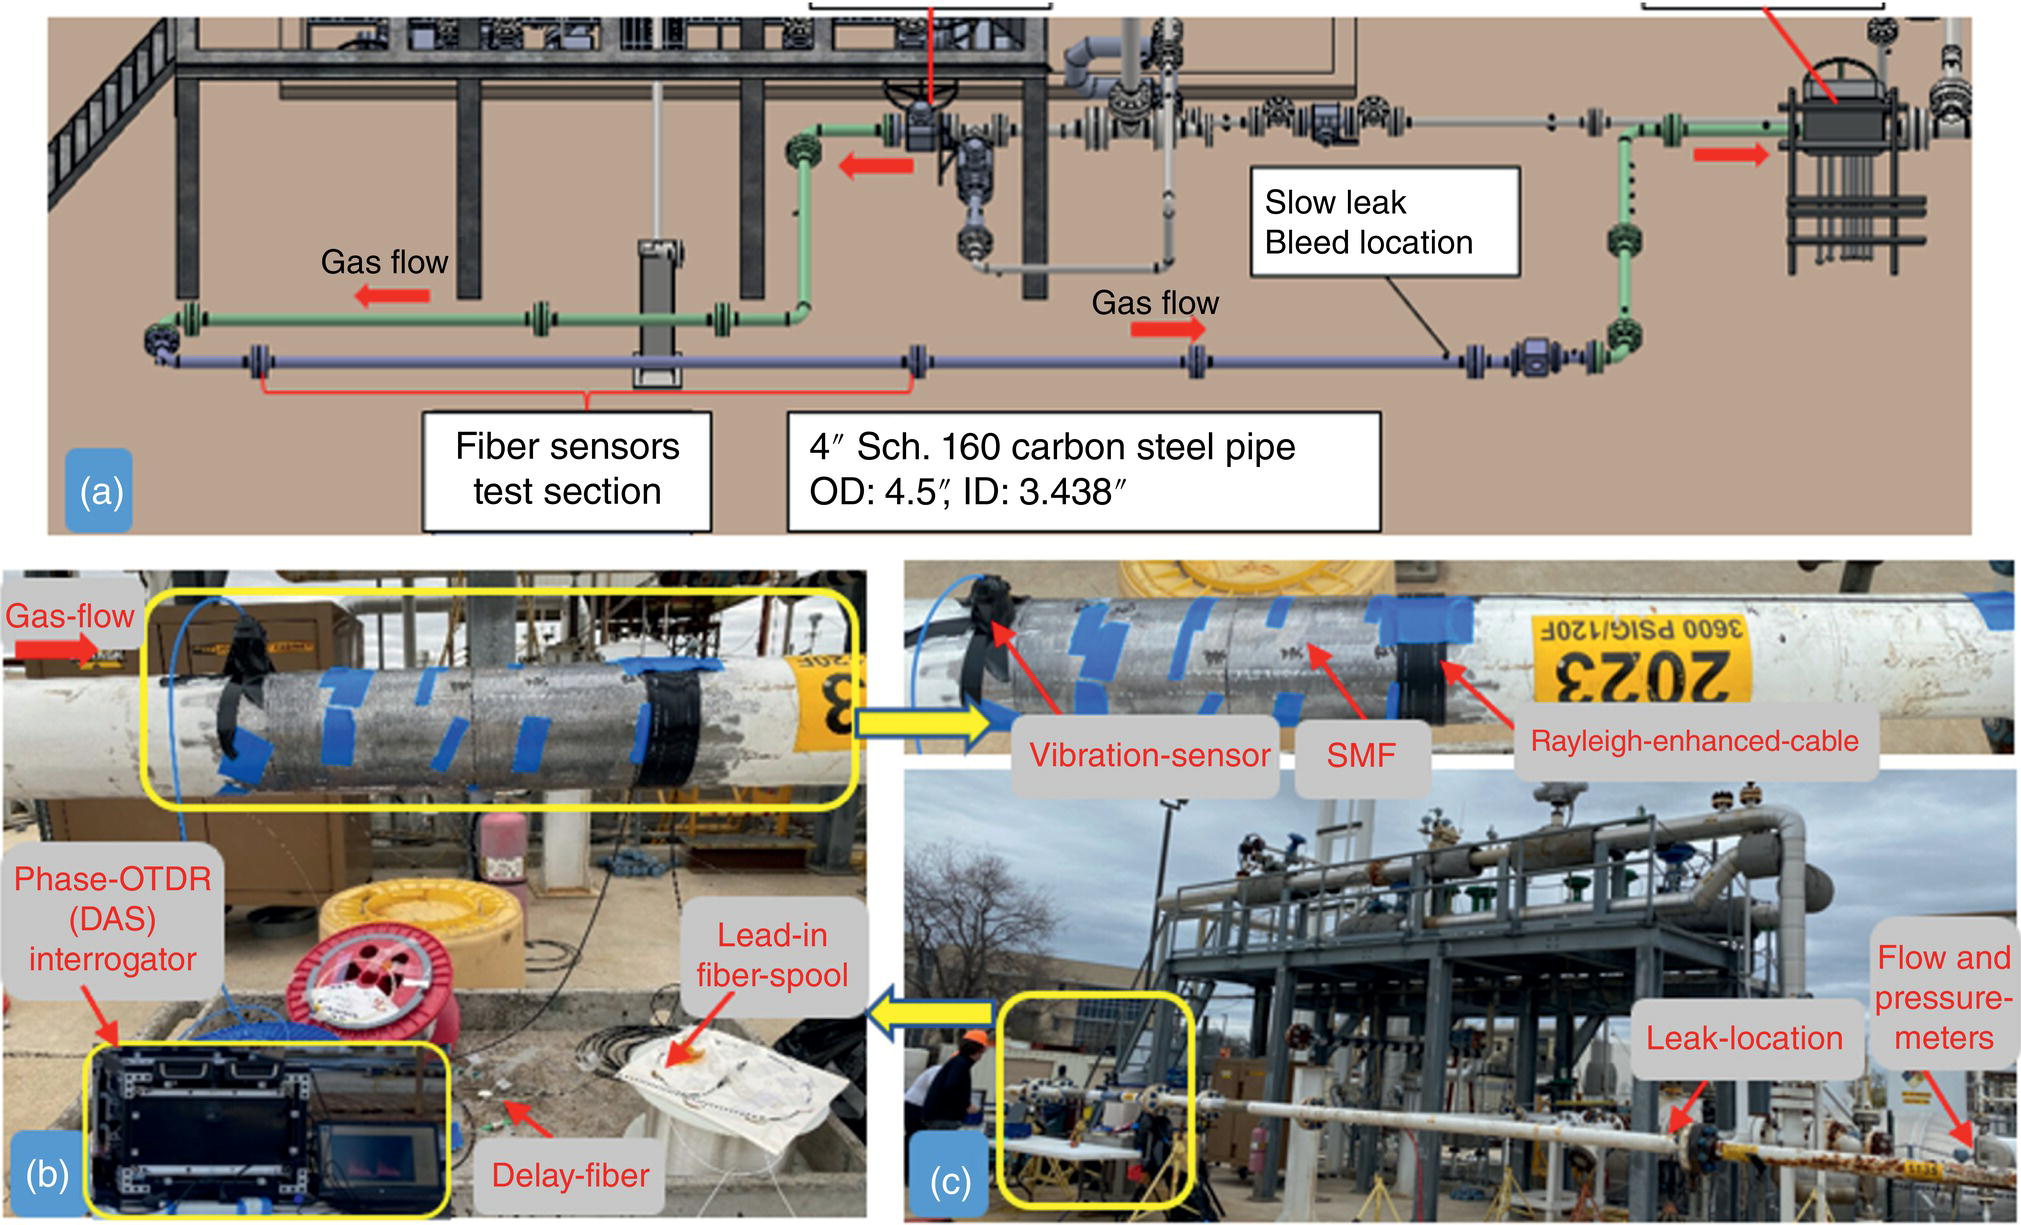
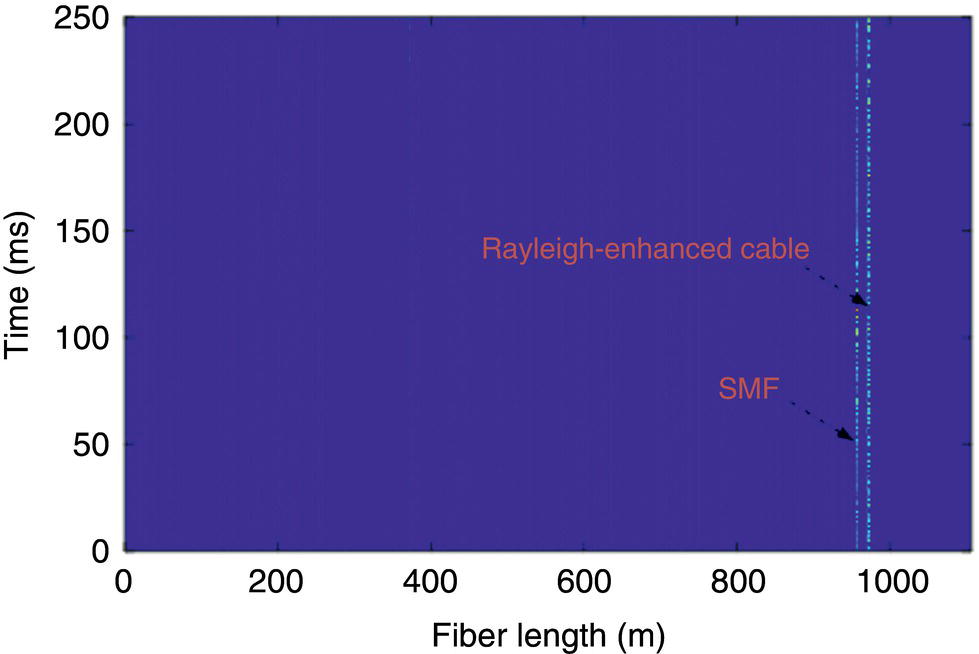
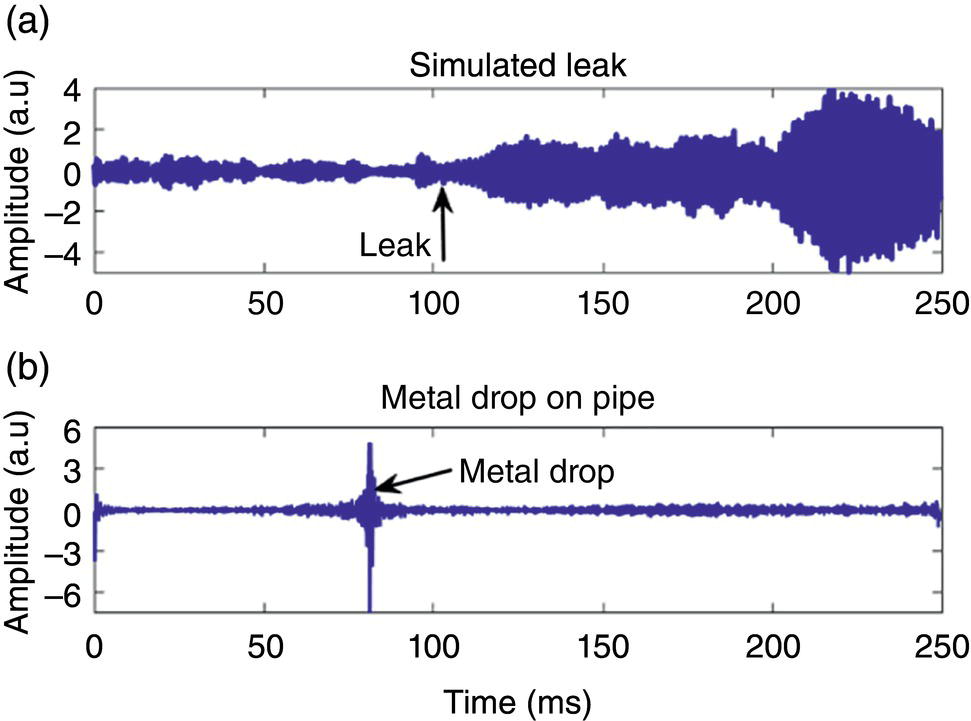
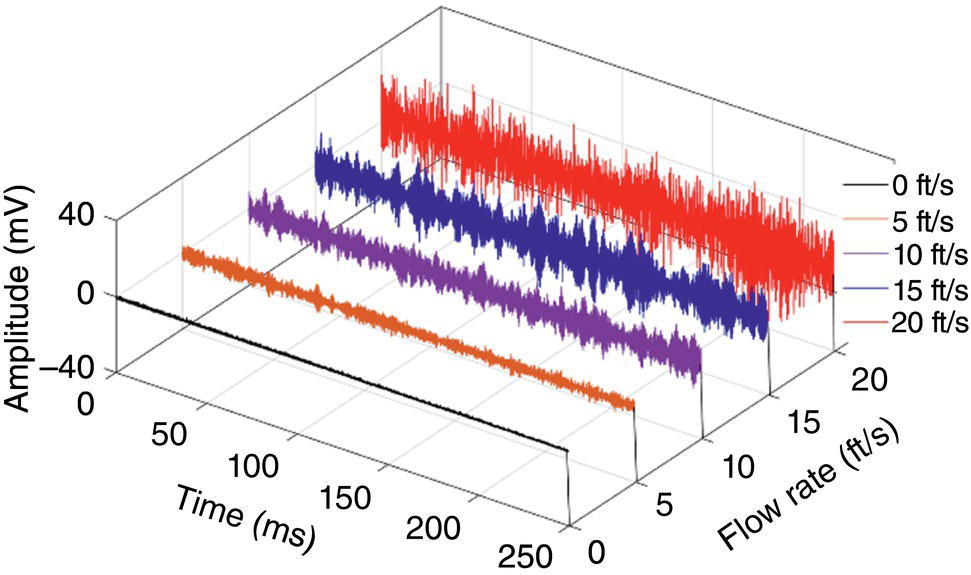
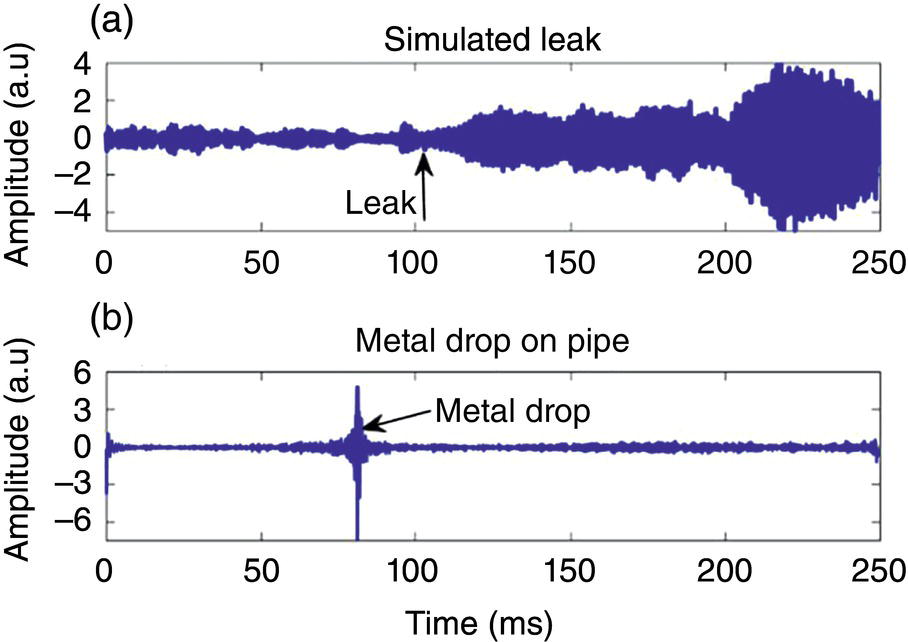
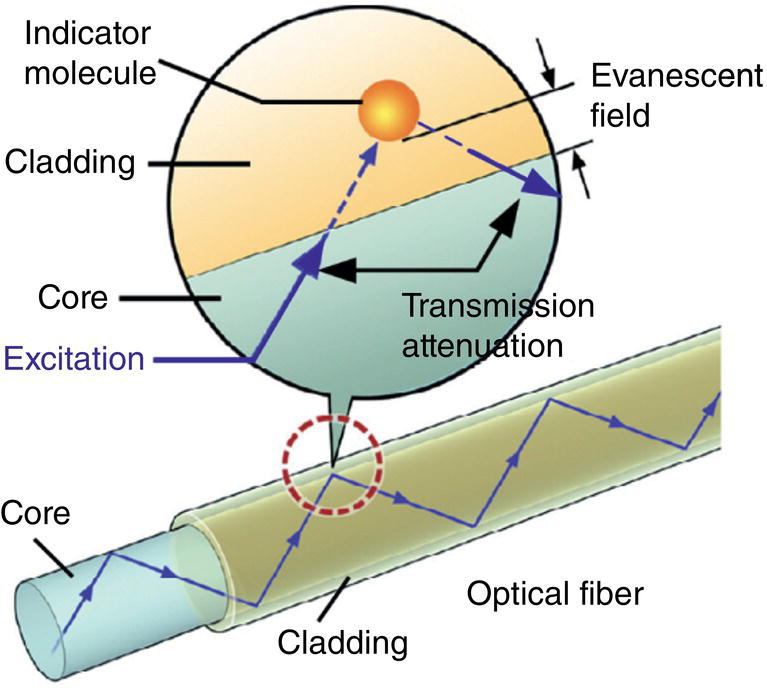
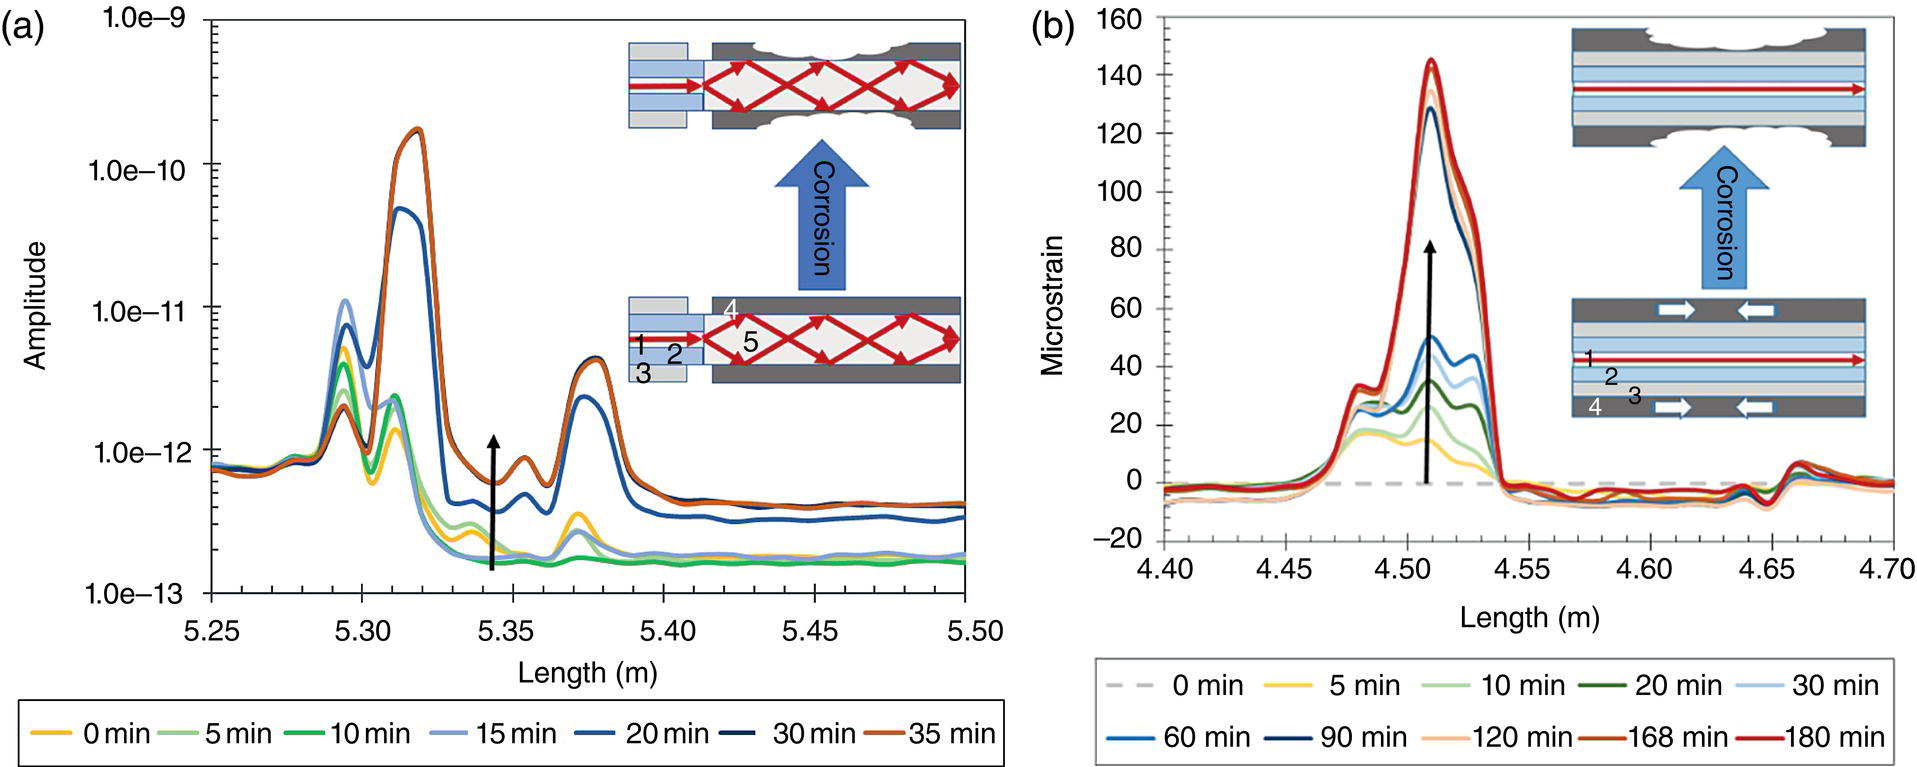
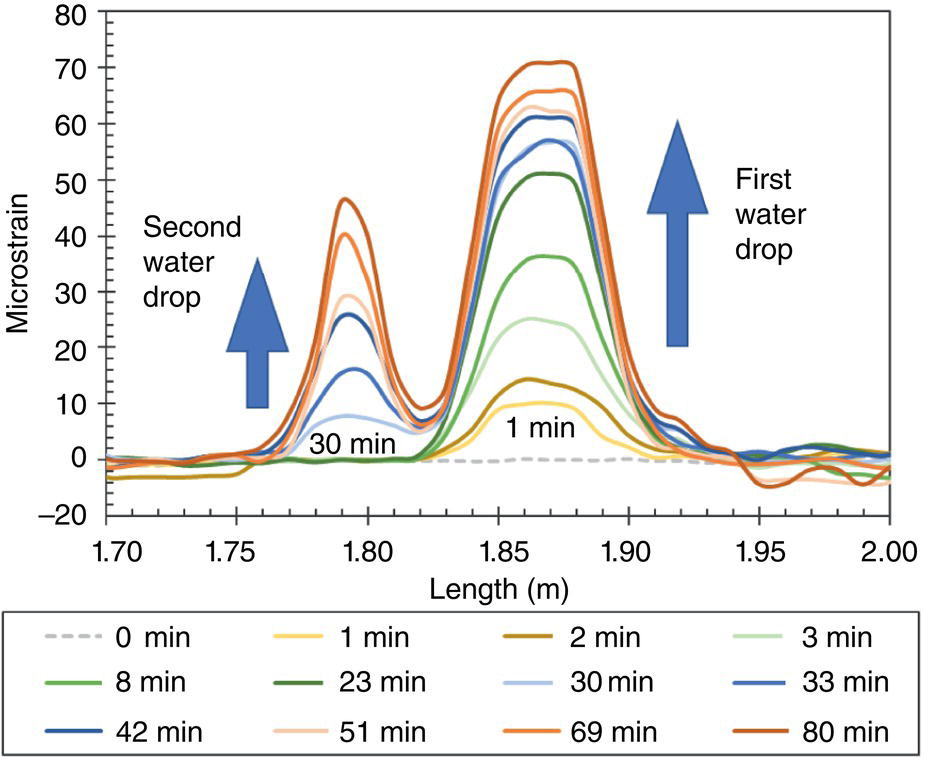
Nageswara Lalam1,2 and Ruishu Wright1 1National Energy Technology Laboratory, Pittsburgh, PA, USA 2NETL Research Support Contractor, Pittsburgh, PA, USA The field of fiber-optic sensors (FOS) for pipeline inspection and monitoring has witnessed significant advancements, positioning it at the forefront of pipeline infrastructure management. For point, quasi-distributed, and distributed sensing applications, a wide range of FOS technologies have been developed to monitor different physical (strain, temperature, and vibration) and chemical (corrosion, pH, gas species, etc.) parameters. Fiber Bragg grating (FBG), long-period grating (LPG), microstructured fibers, fiber ring lasers, multimode interference, Mach-Zehnder interferometer (MZI), Fabry–Perot interferometer, Michelson, and Sagnac interferometer are the examples of discrete fiber sensor architectures [1–4]. The use of distributed fiber-optic sensors (DFOS) has grown significantly and attracted much attention throughout the past decades. Based on Rayleigh, Brillouin, and Raman scatterings, DFOS provides a cutting-edge technique for spatially resolved distributed measurements [5, 6]. A compound annual growth rate (CAGR) of 6.4% is predicted for the DFOS market, which was valued at USD 1.35 billion in 2021 and will rise to USD 2.5 billion by 2030. Among various application industries, the oil and gas segment dominated the industry with a revenue share of more than 35.40% in 2022 [7]. The adoption of DFOS has become widespread for continuous monitoring along the entire length of pipelines [8]. This technology enables the detection of temperature, strain, acoustic signals, and chemical composition (e.g., corrosion) at every point along the fiber-optic cable, providing a real time and spatially resolved profile of the pipeline’s condition. Applications range from leak detection to the identification of structural deformations. By enabling predictive maintenance and reducing the need for manual inspections, these sensors help operators optimize resources, minimize downtime, and extend the lifespan of pipeline assets. The schematic representation of pipeline integrity measurement capabilities using the DFOS system is illustrated in Figure 26.1. The fiber installation of distributed sensors for the pipeline acts as a major difficulty to the growth of the DFOS, especially for retrofitting DFOS to existing pipelines. For pipeline integrity monitoring, the installation and protection of fiber-optic cables need proper protocols to ensure high-quality sensor data collection. The fiber-optic cable is typically installed alongside the pipeline, and it can be challenging to install the fiber-optic cable inside the pipeline, especially for existing buried pipes. In 2022, N. Lalam et al. [9] demonstrated a robotic fiber-optic deployment tool (FODT) for internal deployment to pipelines. This FODT internal deployment tool demonstration with distributed sensing offers a substantial retrofitting option for existing pipelines. Compared to point sensors, DOFS enables continuous real-time monitoring over the entire pipeline length with reduced cost per unit of length. DOFS systems are based on the light backscattering along the optical fiber length. The interrogator acts as the source of light and the detector of the reflected signal, and the fiber-optic cable serves as both the sensor and the data transmission medium simultaneously. By examining the modulated backscattered signal, a distributed measurement throughout the entire fiber length can be constructed: a one-dimensional array of measurements along a single optical fiber. There are three kinds of backscattering signals originating from the fiber optic cable: Rayleigh, Brillouin, and Raman scattering. By interrogating different backscattered signals, different interrogators can be developed such as phase-sensitive optical time-domain reflectometry (Φ-OTDR), optical frequency-domain reflectometry (OFDR), Brillouin optical time-domain reflectometry (BOTDR), Brillouin optical time-domain analysis (BOTDA), and Raman-based distributed temperature sensor (Raman-DTS) with various ranges of interrogation lengths and spatial resolutions. For the long-distance (tens of kilometers) strain and/or temperature measurements, BOTDR based on spontaneous Brillouin scattering and BOTDA based on stimulated Brillouin scattering are widely recognized techniques. Whereas, for a shorter range (100s of meters) and high spatial resolution, Brillouin optical correlation-domain reflectometry (BOCDR) based on laser external modulation and OFDR based on laser wavelength sweeping are the most recognized technologies [10, 11]. Rayleigh-based Φ-OTDR [also called distributed acoustic sensing (DAS)] is a widely adopted technique, particularly for pipeline monitoring applications. Table 26.1 illustrates the main DFOS sensing systems with their distinct sensing performances that are utilized to monitor various parameters. Figure 26.1 Schematic of distributed fiber-optic sensor system for pipeline integrity monitoring. (Reference [9].) In this section, we discuss the operating principles, and pilot-scale demonstrations of DFOS sensors, and their crucial role in ensuring pipeline infrastructure safety and reliability. In the field of pipeline monitoring and inspection, distributed strain and temperature measurements are essential for safeguarding the integrity and resilience of critical pipeline infrastructure. By utilizing the inherent characteristics of optical fibers, such as Rayleigh, Brillouin, and Raman scattering, these sensors can provide physical perturbations, such as strain, temperature, acoustic vibration, pressure, etc., along the entire length of the fiber. The combination of strain and temperature sensors enhances the precision of leak detection, enabling rapid response to minimize environmental impact. Distributed strain sensing (DSS) enables the early detection of deformations, stress concentrations, and potential integrity threats. Distributed temperature sensing (DTS) provides insights into temperature variations, helping in the identification of hotspots, ensuring material integrity, and optimizing thermal performance [12]. As shown in Table 26.1, there are a few DFOS interrogators that can measure distributed strain or temperature, including BOTDR, BOTDA, OFDR, etc. Conventional single-mode FOS are widely adopted as a fiber under test for strain or temperature monitoring, and strain and temperature cannot be differentiated for single-mode FOS. In the literature, numerous methods have been demonstrated to show discriminative measurement of strain and temperature using specialty fibers. For instance, the use of multi-Brillouin peak fibers, few-mode fibers, double-core fibers, and photonic crystal fibers interrogated by BOTDR or BOTDA systems has been demonstrated for discriminative strain and temperature monitoring. Table 26.1 Sensing Performance Comparison of Different Distributed Fiber-Optic Sensor (DFOS) Systems The schematics of BOTDR and BOTDA sensing systems are depicted in Figure 26.2. The BOTDR system needs access to the single end of the sensing fiber and has straightforward implementation approaches. In contrast, the BOTDA system has complex system implementation and requires access to both ends of the sensing fiber. Based on stimulated Brillouin scattering, the BOTDA system makes use of a counter-propagating continuous wave coupled in the opposite directions of the same fiber. With coefficients of 1.18 MHz/°C for temperature and 0.05 MHz/με for strain of the silica fiber, respectively, the Brillouin frequency varies linearly with these changes [13–15]. Therefore, the Brillouin frequency shift (BFS) can be used to calculate the strain or temperature changes around the sensing fiber [16]. DSS is critical for monitoring pipelines to detect and locate changes in strain or deformation along their length and is crucial for ensuring the structural integrity of the pipeline and for identifying potential issues before they become critical. DSS can be installed helically or longitudinally along the pipe and measure hoop strain or pipeline deformation caused by geohazards. The hoop strain (circumferential strain) of pipelines can serve as an indicator of inner pressure fluctuation and the wall thickness reduction of pipelines. One example is depicted in Figure 26.3. A fiber-optic cable (around 10 m in length) is wrapped around the pipeline and spliced to a 25 km long lead-in fiber and then connected to the BOTDA sensor system, where short pulses of light launch into the sensing fiber and backscattered signals are collected for analysis of physical quantities, such as hoop strain. The baseline measurement was first made at zero pressure before the pipeline was pressurized. To determine the distributed strain, a series of measurements were taken at various pressures up to 1000 psi. The relative backscattered BFS variation for different pipeline pressures is visible, as shown in Figure 26.4a. After calibration, the calculated change in pipeline hoop strain at various pipe pressures is illustrated in Figure 26.4b. Hoop strain changes at a specific location can be identified early, enabling proactive maintenance, and preventing potential failures, contributing to the overall integrity and safety of the pipeline infrastructure. Figure 26.2 Schematics of DFOS. (a) BOTDR, (b) BOTDA for ultralong-distance interrogation for >100 km range. Figure 26.3 Pipeline hoop strain measurements. (a) Schematic illustration of a high-pressure natural gas pipeline with installed fiber-optic cable, and (b) Photograph of the pipeline with installed fibers. Figure 26.4 Measured pipeline hoop strain at different pressures, (a) Brillouin frequency shift and corresponding hoop strain change over the installed fiber distance, and (b) average hoop strain change at various pipe pressures. DTS can be used to detect and locate gas or liquid leaks from the pipelines. Using temperature changes for gas/liquid leak detection in pipelines offers a reliable and effective method for minimizing the risk of catastrophic failures, and ensuring pipeline safety. The DTS system provides continuous, real-time monitoring capabilities that are highly sensitive to temperature anomalies caused by the leaks. For example, because of the Joule-Thomson effect, leaks of pressurized natural gas would result in a cold spot, leading to a detectable temperature drop around the leak location. [17]. On the other hand, leaks of liquid natural gas (LNG) or other liquefied gases cause a phase change from liquid to gas. This phase transition absorbs heat from the surrounding environment, resulting in a significant local temperature drop [18]. Heating transportation is one way to reduce the viscosity to efficiently flow highly viscous crude oil in the pipes, and the leak of heated oil results in a temperature change outside the pipelines, which can be detected through DTS [19, 20]. It has been demonstrated in [21] that a DTS system provides an efficient way to detect and locate leakages along pipelines. The BOTDA system was also used in an experimental field test for pipeline leakage detection through temperature monitoring conducted by OZ Optics Ltd. [22] in 2014. In their experiment, a 10.3 km long sensing fiber was loosely placed inside a metallic cable along with several buffer layers. To measure the temperature change before and after a leakage event, the sensing fiber was positioned 2.5 and 10 cm below the pipeline. A 15 ns pulsed source was used to achieve a 1.5 m spatial resolution. The Brillouin data was acquired every 4 min at a sampling rate of 250 MS/s. A baseline measurement was performed before the occurrence of any leaks. This baseline serves as a reference to which all subsequent measurements will be compared. Figure 26.5 shows the temperature changes induced when a large leak occurred at an injection pressure of 400 psi. Two peaks corresponding to two separate leaks occurred around 10.117 and 10.167 km. This demonstrated that DTS is an effective tool for locating leaks in pipeline applications. Furthermore, the system could find the leak within 2 min, which represents a vast improvement over manual inspection. Pipeline monitoring is one of the many applications where DAS technology has grown in popularity. Along the pipeline’s length, acoustic waves are detected and analyzed using fiber-optic cables acting as sensors. A fiber-optic cable is installed along the pipeline route. This cable can be buried alongside the pipeline or attached to its surface. The fiber-optic cable serves as a continuous sensor, with the ability to detect acoustic signals, such as gas leaks, and third-party intrusion events. These can provide insights into the condition of the pipeline, helping operators schedule maintenance activities proactively. DAS relies on the principle of interferometry. When light pulses are sent through the fiber-optic cable, they interact with the acoustic signals along the cable. Changes in the backscattered light caused by the acoustic signals are analyzed to determine the location and characteristics of the disturbances. Figure 26.5 (a) Configuration of pipeline leakage monitoring using BOTDA system, (b) leakage detection snapshot with 400 psi injection pressure, soil temperature before test: 85 °F, line temperature: 115 °F. (Reference [22]/with permission of OZ Optics Ltd.) The experimental construction of the conventional Φ-OTDR system is illustrated in Figure 26.6a. A highly coherent narrow linewidth laser (NLL) operating at a wavelength of 1550 nm is used as a laser source. An external arbitrary waveform generator drives an acoustic-optic modulator (AOM) with a 200-MHz frequency shift to produce pump pulses after the light polarization is controlled by a polarization controller (PC). With an 80-kHz repetition frequency, the pulse width is set at 20 ns, giving 2 m of spatial resolution. Next, the output power is tuned for the sensing fiber’s input power level using an erbium-doped fiber amplifier (EDFA-1). To remove the amplified spontaneous emission (ASE) noise originating from the EDFA, a narrow band-pass filter with a bandwidth of 0.8 nm is employed. The pump pulses are then introduced into the sensor fiber via a circulator. After that, the Rayleigh backscattered signal is amplified by a second EDFA-2, while ASE noise and undesired sideband components are removed with a narrow band-pass filter. Thereafter, the signal is received by the 250-MHz bandwidth photodetector and digitized at 250 MS/s. The laboratory test pipe configuration is schematically illustrated in Figure 26.6b. At one end of the pipe section, a 2-in. outer diameter (OD), 10-foot-long steel pipe was wrapped circumferentially with a 3 m of standard single-mode fiber (SMF) and a 3 m of Rayleigh-enhanced fiber cable using a strong epoxy adhesive. In between, 15 m of delay fiber was employed, as shown in Figure 26.6b. The Rayleigh-enhanced fiber has improved the signal-to-noise ratio by 13 dB compared to SMF. To create well-controlled acoustic disturbances that travel the length of the pipe, a PZT (Lead Zirconate Titanate) transducer cylinder was fastened to one end of the pipe. The PZT was first powered by a low-frequency RF amplifier and a function generator. The PZT cylinder was excited sinusoidally at 20 kHz with an amplitude of 5 Vpp. Figure 26.7a depicts the reconstructed time-domain signals, where the axes display the fiber distance, time, and amplitude. By computing the fast Fourier transform (FFT) of the reconstructed time-domain signals at each position over the sensing fiber, the spatial-frequency 3D spectra were produced. Figure 26.7b displays the resulting frequency domain spectra. The Rayleigh-enhanced fiber cable and SMF were installed on the steel pipe at two different locations and are shown by the two peaks in Figure 26.7, which have respective locations of 1049 and 1064 m. Due to the installation of a 15-m delay fiber in the test pipe arrangement, there was a gap between these two fiber segments. Two peaks in the frequency and time-domain 3D spectra are depicted in the zoomed plot displayed in Figure 26.7 insets, which also accurately indicate the vibrations given to these two fiber segments (where PZT is driven by a 20-kHz frequency and 5 Vpp amplitude) [10]. Figure 26.6 (a) Experimental setup of phase-OTDR (DAS) system, (b) schematic illustration of lab-scale pipe setup installed with SMF, Rayleigh-enhanced cable, and PZT excitation source, and (c) Picture of a laboratory pipeline test setup. (Reference [10]/Springer Nature/CC BY 4.0.) Figure 26.7 3D spectra at 20 kHz sinusoidal vibration on pipeline in (a) time-domain and (b) corresponding frequency domain. Insets: zoomed-in view of corresponding time/frequency domain plots of SMF and Rayleigh-enhanced fiber cable. (Reference [10]/Springer Nature/CC BY 4.0.) A field demonstration at a high-pressure loop natural gas pipeline under typical operating conditions was conducted after verifying the vibration sensing performance in the laboratory. Figure 26.8a shows the schematic diagram of the entire closed flow loop, natural gas flow test section with recirculating flow direction, installed fiber sensors, and simulated leak location. The test section pipe has an inner diameter (ID) of 4.5 in. and a length of 245 in. It was tested at 1000 psi and had set gas flow rates of 5, 10, 15, and 20 ft/s. Figure 26.8c provides an overall high-pressure loop natural gas test facility at Southwest Research Institute (SwRI), San Antonio, Texas. Using a strong adhesive glue, the sensing fibers were wrapped around the pipe at a specific pipe section. A 15-m delay fiber was placed between a 6-m SMF and Rayleigh-enhanced fiber cable. Figure 26.8b shows the installed fiber sections on the pipe, delay fiber, and lead-in SMF fiber spool. In addition, a commercial piezoelectric vibration sensor was installed on the pipe to compare its results with the Φ-OTDR system. The number of circumferential wraps on the pipe is higher than normal considering the length of the test pipe section. This boosted the fiber-to-pipe bonding coverage and, consequently, the measurement sensitivity for weak gas flow rates. Fiber installation along the pipe axis can be taken into consideration for longer-distance monitoring purposes. At a fixed pipe pressure of 1000 psi and a flow rate of 5 ft/s, the vibrations caused by the varying gas flow are recorded. Figure 26.9 shows the reconstructed power spectral density plot. Figure 26.10 illustrates measured time-domain traces in the presence of gas flow of 5 ft/s and 1000 psi. The amplitude level of measured time trace using Rayleigh-enhanced fiber cable exhibits a wider range compared to the SMF and piezoelectric vibration sensor, which shows higher vibration sensitivity. The flow rate was increased to 10, 15, and 20 ft/s at a constant pressure of 1000 psi. The vibration traces that resulted from these changes were recorded using Rayleigh-enhanced cable, as shown in Figure 26.11. Figure 26.8 (a) Schematic diagram of the high-pressure loop natural gas pipeline system, (b) pipeline test section mounted with standard SMF, electrical vibration sensor, and Rayleigh-enhanced fiber cable, (c) overall high-pressure loop natural gas pipeline test facility at Southwest Research Institute. (Reference [10]/Springer Nature/CC BY 4.0.) Figure 26.9 Power spectral density of differential amplitude traces. The gas flow-induced vibrations at fiber installation locations on the pipeline can be observed clearly for both standard SMF and Rayleigh-enhanced fiber cable. (Reference [10]/Springer Nature/CC BY 4.0.) Figure 26.10 Demodulated time-domain traces of standard SMF, Rayleigh-enhanced fiber cable, and piezoelectric vibration sensor at a fixed pressure of 1000 psi and flow rate of 5 ft/s. (Reference [10]/Springer Nature/CC BY 4.0.) Figure 26.11 Time-domain traces of Rayleigh-enhanced fiber cable at 1000 psi pressure and different gas flow rates of 5, 10, 15, and 20 ft/s. (Reference [10]/Springer Nature/CC BY 4.0.) Figure 26.12 The time domain signals from Rayleigh-enhanced fiber during (a) control valve leak, and (b) metal drop on a pipeline. (Reference [10]/Springer Nature/CC BY 4.0.) Figure 26.11 shows that the recorded vibration amplitude fluctuations increase with an increase in flow rate. Ten Φ-OTDR measurements were obtained at each flow rate, and the average root mean square (RMS) amplitude was computed and fitted to a second-order polynomial curve, as shown in Figure 26.11 inset. There is a clear quadratic trend (R2 = 0.99) between the flow rate in the pipeline system and the measured vibration RMS amplitude. Furthermore, pipeline leak detection and third-party intrusion monitoring are highly desirable and help prevent pipeline damage and catastrophic failures. Therefore, we demonstrated gas leak detection by opening a control valve at one of the flanges (shown in Figure 26.8c; the leak location is ∼4 m away from the installed fiber sensors), leading to rapid de-pressurization of the pipeline with a distinct vibration signature. A measured time-domain trace using the Φ-OTDR system is displayed in Figure 26.12a, indicating a significant vibration amplitude caused by instantaneous gas leaking. The sensing fiber recorded different vibrations with a higher amplitude level, which are attributed to the propagation of leak-induced vibrations down the pipeline. Following the discovery of the leak, the flow rate was restored to 5 ft/s at 1000 psi. One meter away from the installed fiber sensors, a small metal bolt was thrown onto the pipe to show third-party intrusion detection. Extrinsic acoustic signals were produced by the metal drop and traveled through the pipe. The measured time-domain trace, which is depicted in Figure 26.12b, indicates the source of the strong amplitude peak in the pipe disturbance. The distributed fiber sensors above measure physical parameters (e.g., temperature, strain, acoustic waves, and leak vibration), which can be used to measure corrosion and pipeline failures through consequences of corrosion; however, it would be more proactive to monitor corrosion inside and outside the pipelines and detect early corrosion onset before significant mass loss and structural integrity are compromised [8]. Distributed chemical sensing (DCS) is less mature compared to DTS, DSS, and DAS but shows promising potential to monitor chemical and corrosive environments before or upon early corrosion onset to mitigate risks associated with corrosion. The chemical sensitivity of optical fiber sensors is often enabled by functional chemical sensing coatings mostly on the fiber core or cladding, such as metallic films [23], oxides [24], polymers [25], nanomaterials [26], and metal-organic frameworks (MOF) [27]. Figure 26.13 illustrates one example of the evanescent field-based chemical sensor [28]. To allow proper light interaction with the chemical sensing layers on the core or cladding, the optical fibers can be modified or manipulated via etching, tapering, or side-polishing [29]. In addition, microstructured optical fibers provide a new type of fiber structure with great potential for DCS since its inception in the 1990s [30]. These fibers are often featured with air holes running parallel to the longitudinal axis along the entire fiber length, and one of them is photonic crystal fibers (PCFs) with the air holes periodically arranged in the cladding matrix. Hollow-core PCF and index-guided PCF sensors could detect gases such as methane, H2S, CO2, and acetylene with high sensitivity (ppm level) through direct interaction of light with gases in the holes [31, 32]. The use of PCF LPG sensors have been studied for Cl– and humidity monitoring [33]. More sensing applications can be found in [34–36]. Although microstructured fibers offer high sensitivity and flexible designs, mass production and commercialization are still limited due to the cost of the fibers. Figure 26.13 Schematic of evanescent field-based chemical sensor with a colorimetric indicator contained in the cladding of optical fiber. (Reference [28]/with permission of Elsevier.) DCS for corrosion monitoring can be generally fit into two categories: direct corrosion monitoring and indirect corrosive environment monitoring. For direct corrosion monitoring, metallic coatings were integrated with the distributed FOS platform to monitor corrosion directly as a distributed optical “corrosion coupon.” The corrosion-proxy distributed FOS is envisioned to be installed along the pipelines to monitor internal and/or external corrosion. Metallic film-coated optical fibers have been demonstrated for distributed monitoring of corrosion when interrogated using OFDR. As shown in Figure 26.14, mass loss of the metallic coating is monitored via spatially distributed measurements of (1) optical power intensity change [8] or (2) strain change along the optical fiber [23]. The power intensity increases in the corroded region because the light absorption of metallic film decreases as the film becomes thinner. The increase in strain is caused by release of the compressive internal stress induced by electroless deposition of Ni film. Both sensing mechanisms allow for spatially distributed corrosion monitoring, while the intensity-based sensing is subject to higher light attenuation along the fiber and needs to boost the light along the fiber for a longer distance. The distributed humidity/water and corrosion sensing experiments using internal fiber deployment and an OFDR system were carried out at the same testing site as DAS, and comprehensive findings are available in reference [37]. Corrosive environments such as pH, water content/humidity, electrolyte conductivity, and acidic gas CO2 or H2S are critical factors for corrosion and can determine the environmental corrosivity for indirect corrosion monitoring. Although DCS has only been demonstrated in fewer cases, there have been studies and development of chemical sensing materials for a broader group of FOSs, which can be potentially adopted for DCS to monitor corrosive environmental factors. For example, there are various pH sensing materials for integration with FOS, including localized surface plasmon resonance (LSPR) Au or Ag nanoparticles (NPs) incorporated composites [38], organic dyes [39], fluorescent molecules [40], polymers [41], pH-sensitive hydrogel [42], etc. Optical fiber pH sensors and pH sensitive materials are reviewed in more detail in [43]. Water and salinity as prerequisite conditions for corrosion can also be monitored by FOS. A fully distributed water sensor was demonstrated using optical backscatter reflectometry (OBR) based on the hygroscopic property of the intrinsic polymer jacket of a commercial SMF. Water absorption into the polymer jacket caused swelling-induced strain changes on the fiber which were spatially interrogated using OBR (Figure 26.15) [44, 45]. The water drops on the fiber were accurately monitored in real time along with the water drop size. The coatings of graphene oxide film and polymers (e.g., polyimide) have also been studied for water or humidity monitoring [46]. Cl– and salinity can also be monitored based on the refractive index changes detected using tapered optical fiber, U-shaped fiber, SPR coating, or fluorescence sensitive material for chloride [47]. Figure 26.14 Metallic film coated FOS for distributed corrosion sensing interrogated using Optical Backscatter Reflectometry (OBR): (a) Rayleigh backscattered light increases as corrosion of Fe proceeds. (Reference [8]/MDPI/CC BY 4.0.) (b) Microstrain on the fiber increases with mass loss of coated Ni film. (Reference [23]/NACE International.) Note: 1—single-mode fiber core; 2—cladding; 3—polymer jacket; 4—coated metallic film; 5—multimode fiber core. Figure 26.15 Demonstration of distributed water detection in air based on the swelling-induced strain changes interrogated with OBR. The first water drop was added at 1 min and the second water drop was added at 30 min. (Reference [44]/with permission of SPIE.) For acidic gas monitoring, gas sensitive coatings, or gas absorption layers are often used to functionalize FOS and achieve acidic gas monitoring. CO2-absorbing MOFs have been studied for CO2 monitoring and demonstrated quick and reversible responses [48]. CO2 sensors also leverage pH indicators (colorimetric or fluorescent dyes) within various sensing layers such as silica gel coating, polymer matrix with quantum dots, and sol–gel matrix with silica NPs [49]. H2S monitoring often utilizes reactive sensing materials such as Ag [50], Cu [51], ZnO [52], CuO doped SnO2, CdO, and fluorescent or luminescent indicators [53]. Table 26.2 lists some examples of FOS chemical sensing layers for corrosivity monitoring. DFOS is an emerging technology for pipeline monitoring with the unique advantages of spatially distributed monitoring over long-distance pipelines and increased safety with inert optical fibers compared to electrical based sensors in flammable gas environments. There are still some challenges in the broad adoption of DFOS by pipeline operators. The cost of the DFOS interrogation systems is still high ($50k–$150k) for some companies with limited resources for pipeline integrity monitoring, although the optical fiber cables are relatively cheap. Installing fiber-optic cables can be a complex process, especially for retrofitting into existing pipelines. Ensuring proper alignment, protection from external elements, and avoiding damage during installation are critical to guarantee the sensors’ effectiveness. Proper installation of fiber cable and calibration are also essential for accurate measurements. In addition, a massive amount of data is generated by fiber-optic cables over the extended pipelines; yet operators frequently lack the staff with the specific skillsets needed to analyze and turn the raw data into insights that can be put to use. Integrating DFOS systems with existing pipeline infrastructure and control systems also needs to be considered. Ensuring compatibility and seamless integration without disrupting regular operations is crucial for successful deployment. Moreover, the development of industry standards and guidelines for the deployment of FOSs in pipeline inspection has made slow progress. This standardization ensures uniformity in sensor implementation, data interpretation, and reporting, fostering greater confidence in the reliability of these technologies. Table 26.2 Chemical Sensing Parameters and Examples of FOS Sensing Layers for Corrosion Monitoring Source: Reference [8]/MDPI/CC BY 4.0. a Assumed as RT and 1atm when lack of clarification on test conditions. DFOS systems offer a great opportunity for predictive monitoring and maintenance of the entire pipeline, allowing operators to address potential issues before they escalate. This can lead to cost savings by minimizing downtime and reducing the need for emergency repairs. In addition, machine learning and artificial intelligence can play a crucial role in faster data processing speed, analyzing complex sensor data patterns, enhancing the accuracy of defect detection, and facilitating predictive maintenance strategies. Operators can gain insights into the overall health of the pipeline, allowing for strategic decision-making regarding maintenance, upgrades, and resource allocation. Emerging quantum sensing technologies show promise in enhancing the sensitivity and precision of FOSs. Quantum-enhanced measurements have the potential to detect even subtle changes in pipeline conditions, further improving the reliability of inspection and monitoring processes. As regulatory bodies recognize the benefits of distributed fiber-optic sensing in pipeline monitoring, compliance standards, and guidelines are likely to evolve, providing a framework that supports the implementation of these technologies and fosters industry-wide acceptance. The integration of FOSs with Internet of Things (IoT) platforms enables seamless data transmission, remote monitoring, and control. This connectivity enhances the efficiency of pipeline management by providing real-time insights, facilitating timely decision-making, and enabling swift responses to emerging issues. Distributed FOSs have the advantages of nondestructive monitoring, in-situ distributive measurements, long reach, small size, light weight, flexibility, inherent immunity to electromagnetic interference (EMI), compatibility to optical fiber data communication systems, and improved safety in the presence of flammable gas/oil as compared to electrical based sensors. Distributed monitoring enabled by DFOS technology is particularly suitable for long-distance pipeline monitoring. DTS, DSS, and DAS have been developed and matured over the last two decades for physical parameters monitoring. The integration of distributed optical fiber sensors has proven to be a transformative approach, enabling the detection and localization of potential threats to pipeline integrity such as leaks, temperature variations, and structural deformations. As a less mature technology, DCS shows promising potential to detect early corrosion onset and monitor corrosive environments such as direct mass loss, pH, water, salinity, and acidic gases before or upon early corrosion onset to facilitate corrosion mitigation. It is crucial to have effective deployment of sensors in the pipeline infrastructures with low-cost, long-distance, and high-spatial resolution interrogation. Furthermore, this chapter addresses the challenges associated with the implementation of distributed optical fiber sensors, providing valuable insights into ongoing research and development efforts aimed at overcoming these hurdles. The integration of distributed optical fiber sensors represents a significant leap forward in ensuring the resilience and safety of pipeline systems, fostering a future where distributed optical fiber monitoring technologies play a pivotal role in safeguarding critical pipeline infrastructure.
26
Distributed Fiber-Optic Sensors for Pipeline Inspection and Monitoring
26.1 Introduction
26.2 Distributed Strain and Temperature Sensing
Technology
Sensing Range
Spatial Resolution
Measurement Time
Measured Parameters
Brillouin-OTDR (BOTDR)
Hundreds of kilometers
Meter
Minutes
Strain, temperature
Brillouin-OTDA (BOTDA)
Hundreds of kilometers
Centimeter to meter
Minutes
Strain, temperature
Brillouin-OCDR (BOCDR)
Hundreds of meters
Centimeter
Minutes
Strain, temperature
Rayleigh-OFDR
Meter to kilometer
Micrometer to centimeter
Seconds
Strain, temperature, corrosion, gas composition
Rayleigh-OLCR
Meter
Millimeter
Minutes
Strain, temperature
Rayleigh Φ-OTDR or DAS
Tens of kilometers
Meter
Seconds
Vibration/dynamic strain
Raman-OTDR or DTS
Tens of kilometers
Meter
Minutes
Temperature only
26.3 Distributed Acoustic Sensing
26.4 Distributed Chemical Sensing for Corrosion and Corrosivity Monitoring
26.5 Challenges and Opportunities
Parameter
Sensing Layer
Test Condition
Performance and Comments
Corrosion
Fe
30 °C, 1 atm, CO2 saturated 3.5 wt% NaCl
Distributed sensing, nm scale mass loss sensitivity
FeC
0.18–1.8 mol/l H2SO4
10 s of uW increase in light transmission in <10 min
Al
0.05 mol/l NaOH
uW increase in light transmission in 5 min
pH
Au-NP in SiO2 matrix
Room temperature (RT) and 80 °C, 1 atm
pH 2–12, quick response
Organic dyes in SiO2 matrix
RT, 1 atma
pH 3–12
Polyaniline
RT, 1 atma
pH 2–12, >1 month stability in air
fluorescent Poly (p-pyridinium phenylene ethynylene)
RT, 1 atm
pH 1–10
pH-sensitive hydrogel
RT, 1 atm
Wavelength 1.94 nm/pH, pH 3–10
Water
Polyimide
30–50 °C, 1 atm
38.5 ± 1.9 microstrain/%Relative Humidity (RH)
Graphene oxide film
27–67 °C, 1 atm
Wavelength 0.145–0.915 nm/%RH for 32–97.6% RH; Intensity 0.427 dB/% RH for 58.2–92.5% RH
Salinity or Cl–
SPR-based Al/TiO2
RT, 1 atma
Accuracy 0.1‰ salinity
Fluorescent Lucigenin
RT, 1 atma
Detection limit 0.02 mol/l Cl–
CO2
Zeolitic imidazolate framework-8 (ZIF-8) MOF
RT, 1 atm
10 s of seconds response, Reversible, Linear calibration
Dyes (e.g., methyl red) in SiO2 gel
15–60 °C, 1 atm
2–3 s response
Fluorescent dye HPTS (1-Hydroxypyrene-3,6,8-trisulfonic acid trisodium salt)
5–35 °C, 1 atm
Sol–gel matrix doped with silica particles improved sensitivity
H2S
Ag layer
30 °C, 1 atm
90% transmittance drop in 15 min in 0.1 mol/l H2S solution
CdO in porous SiO2
450 °C, 1 atm
25–30 min response time for 1–100 ppm H2S, Irreversible but regenerable
SPR based Ag/NiO doped indium tin oxide (ITO)
RT, 1atma
100 ppb–100 ppm H2S, sensitivity decreased with H2S concentration
26.6 Conclusion
References