“A theory without a test is B.S.” —(Norman P. Lieberman and E. T. Lieberman, Ref. 295) The first part of this chapter deals with efficiency testing. The second part deals with various sources of poor separation, other than those covered in Chapter 2 (flooding, foaming, channeling, loss of downcomer seal), those in in Chapter 4 for packed towers (maldistribution of liquid or vapor), and those associated with control instability that are covered in distillation control texts (50, 192, 431, 453). The incentive for efficiency-testing a poorly performing column is obvious. The simulation with the expected efficiency shows how the tower should perform, while that based on the measured plant data provides the real efficiency. In the absence of flooding, a real efficiency below the expected one signifies issues such as maldistribution or channeling in trays and packings, poor hydraulic design, fouling, corrosion, or damage. In many cases (e.g., 195, 197, 234, 286, 351), a mismatch between simulation and plant data, or a low efficiency obtained from good plant data, was the key for correct diagnosis and an effective solution to an operating problem. A well-documented performance/efficiency test report is essential even for a well-performing unit, for the following reasons: Good performance/efficiency testing is rigorous and effort- and time-consuming. The cost-effectiveness of the rigorous procedure is often questioned, and a shortcut version is advocated. A suitable shortcut procedure can evolve from the rigorous procedure outlined here and in Refs. 4 and 192 by skipping over guidelines that are considered less critical. The best procedure to adopt depends on the objective of the test. A shortcut test is best suited for detecting gross abnormalities and is often performed as a part of a troubleshooting effort. When investigating a gross malfunction, rigorous testing may slow down the identification and rectification of the fault. When a column appears to perform well, there is no urgency, so the focus should be on obtaining reliable data for future reference, favoring a rigorous test. A shortcut test is unsuitable and often misleading for detecting subtle abnormalities, for obtaining column efficiency, for checking the design, for optimization, and as a basis for debottlenecking modifications. The author is familiar with many cases where shortcut tests applied for these purposes needed repeats, yielded conflicting data, provided inconclusive results, and led to ineffective modifications. In most of these cases, the test objectives were not met even though the total time, effort, and expense spent were severalfold those that would have been spent had a single rigorous test been performed. The author therefore strongly warns against applying a shortcut procedure for these purposes. This recommendation is shared by others (515). Hanson, Golden, and Martin (126, 153) strongly warn against using shortcut tests, as well as using the plant management information system (MIS) or plant information (PI), as the sole basis for performing a revamp. They question the validity of some of these data, the ability of the statistical methods to detect faulty instruments, and the absence of key data not gathered by the plant systems. Sloley and Fraser (446) add concerns about MIS data gathering being often designed to analyze data trends, most suited for plant operation, rather than the absolute values needed for evaluation and revamps. Rigorous testing can fully take care of these concerns. “The surest way to have a successful, low investment revamp is to carefully (rigorously and correctly) define your current operating basis” (126). The author endorses their recommendation. Shortcut tests range from those that do little more than taking a set of readings and samples from the column to those that incorporate checks of material, component and energy balances, and key instrumentation. Even for shortcut tests, the author recommends incorporating the above checks and spending time on preparations to ensure that key indicators provide adequate data. The key items can be extracted from the list of preparations and checks recommended here and in Refs. 4, 192. General It is best to carry out a test encompassing the whole unit. Individual testing of columns, one at a time, increases the total effort and time consumed and reduces the reliability of measurements. Testing the entire unit provides several material balance cross-checks and enables better identification of erroneous meters and lab analyses. For instance, if the column feed analysis is off, the column component balance may not be sufficient to reveal which analysis is erroneous; but if data from a component balance on upstream and downstream equipment are also available, the incorrect analysis can readily be identified. A shortcut to the above recommendation may be acceptable when the plant inlet rate and compositions have not significantly changed since the last plant test and the problem areas are well known. In such cases, it may suffice to test only the specific column area (192, 515). Another shortcut is often acceptable when the column is near the end of a processing train that yields reasonably pure products. Product analysis and metering tend to be far more reliable than intermediate-stream measurements, and there is usually more to be gained from cross-checks with downstream measurements than with upstream measurements. In such cases, it may suffice to restrict the testing to the column and downstream equipment. Safety, health, and environment Test procedures must conform to all statutory and company safety, health, and environmental regulations. The test plan should be reviewed with persons familiar with safety, health, and environmental requirements and amended as necessary to fully conform to these. Duration “Snapshots” are never a suitable basis for efficiency tests and validating simulations. Plants seldom run in the steady state. There are always peaks and valleys in key variables. Over a short duration, test data are likely to be biased toward such peaks or valleys. Over a longer time interval, these deviations average themselves out. The key to success in efficiency tests is collecting data over a long enough period of steady and stable operation. This raises the question of what is a long enough period. In the author’s experience, for smaller columns (<40 trays, <10 ft diameters, <3 packed beds), one shift (eight hours) is long enough. In larger fractionators (refinery main fractionators, superfractionators such as C2 or C3 splitters, ethylbenzene–styrene towers), a day or two minimum is needed. In either case, the key is steady operation. This again raises the question of what is steady operation. If a reflux or feed flow rate bounces between 80 and 120 units, it is not steady. On the other hand, if this flow varies between 99 and 101 units, it is very steady. The criterion should be deviations and standard deviations from the average. Compositions, too. If product impurity varies between 0.5% and 5%, it is not steady. In contrast, if it varies between 0.8% and 1.2%, it is usually considered steady. At least three successive samples should show essentially constant composition (4). Finally, temperatures. The temperatures in the sections that have the highest temperature gradients are the most sensitive and best indicators of steady operation (4). The author has had success with two alternative options based on the above discussion: Option 1. The traditional test option (4, 192). Carry out a performance test over a two- to three-day period. This option is ideal when testing several towers at the same time, as advocated earlier. This option is also strongly preferred for towers that experience fluctuations in key variables. During shorter periods, variations in plant conditions may introduce serious errors. Over a period of two days, fluctuations are averaged out. Further, column control problems may make it difficult to obtain a sufficiently long period of steady operation if the test is short. Over a 2-day period, the column should be running continuously under steady conditions at least for one shift or so. If product or charge tank levels are to be gauged to obtain accurate flow rates, the test period should be long enough to measure tank displacements within 1–2% (4). One drawback of this option is that if the plant experiences an upset during this test, it is likely that the test will need to be terminated and later repeated. Option 2. This option is most suitable for towers that usually do not experience fluctuations in key variables and is often favored by operation personnel. It requires computerized data collection for all key process variables. A commitment needs to be made to operate the tower steadily over three to four days for smaller columns or over a week for larger columns. Minute-by-minute data are recorded for the tower and other relevant units. For each meter, averages, mean deviations, and standard deviations are compiled for portions of the test periods. From these, a period of minimum deviations is selected as the test period. The meters are averaged over this period. This period needs to be at least 8 hours for smaller towers and 24 hours for larger towers and can be as long as one wishes, providing the deviations remain small. Longer periods include more lab analyses. One can also select two steady periods and compare them. With this option, it is important to collect the minute-by-minute data. If the time interval is much longer, it may hide important swings and counteracting conditions. This option can handle a major upset during the test. Data collected over the upset will show large deviations from the average and will be discarded. However, this option requires enhanced effort from the lab and those taking local meter readings, as frequent lab analyses and local readings are needed throughout the total longer test duration. Table 3.1 is a summary of the recorded test data for a simple C3 stripper tower, showing minimum and maximum values and standard deviations. Using similar summary tabulations was also recommended by other studies (4, 418, 465). A rule of thumb by Summers (465) for the length of time it takes to establish the steady state following an operational change is to multiply the liquid holdup of the tower (including the sump and reflux drum holdup) in weight units by the reflux ratio and divide this by the mass flow rate of the feed. Consideration should be given to the possibility of unsteady state accumulation (“bulging”) of intermediate components (139, 199, Section 2.14). Figure 3.1 is an example of a column that separates a 50/50 mixture of methanol and heptanol. The reboiler receives a feed of butanol at a rate of about 0.1% of the feed rate. The tiny amount of butanol builds up to 80–90% in the liquid at the middle of the tower, dominating the tower composition (and temperature) profile. It accumulates in the column over a period of time, during which the column will be in an unsteady state. Data taken under the accumulation conditions are likely to be of little value for determining tray efficiency. Unsteady-state accumulation of an intermediate component must be avoided during the test, either by changing top or bottom temperatures to allow it to escape or by drawing it via a side draw or by eliminating it from the feed during the test (199). Timing The best time to carry out a performance test is when the plant is stable. In most plant situations, weekends are ideal, as changes due to fluctuations in upstream units are minimized. Table 3.1 Data collection summary for a C3 stripper tower. This is the most important phase of the test. An erroneous meter, a leaking block valve, or an incorrect lab analysis during the main test can dramatically reduce the reliability of the results, defeating the purpose of the test. This is the time to eliminate all potential problems and complications. The following considerations are important and are based on the author’s experience as well as many literature sources (4, 47, 121, 139, 153, 286, 319, 418, 426, 447, 465, 515). Figure 3.1 Relatively small amount of intermediate component can build up to large concentrations within a distillation column, interfering with the separation and generating an unsteady-state accumulation that makes tray efficiency very difficult to determine. (From Graham, G., P. Pednekar, and D. Bunning, Chemical Engineering, p. 30, February 2018. Reprinted with permission.) This should include a detailed list of instruments to be checked and required laboratory analyses. Consider the following: Figure 3.2 Ultrasonic flow meter installed too close to pipe fittings. (From Sloley, A. W., “Reuse and Relocation: A Case history Part III: Troubleshooting Approach and Technique”, in Kister Distillation Symposium Proceedings, AIChE Spring Meeting, Virtual, April 18–22, 2021. Reprinted with permission.) Check with the various departments how long it will take to carry out the preparations for the test. Add a “Murphy’s law” factor and set the earliest date at which the test can be carried out. A good “Murphy’s law” factor is half the longest preparation period, or 1 week, whichever is longer. For instance, if the instrument department advises that it will take four weeks to calibrate all instruments, allow another two weeks for delays. Better Murphy’s law factors can be determined by experience in each situation. Once the preparations are completed, set the time most convenient for the plant operation personnel. Stable operation during the test is essential, and the operation personnel can anticipate periods of potential instability best. An efficiency test usually means increasing the lab workload, and the lab supervisor will need to schedule additional personnel. Obtain a commitment from the lab supervisor to complete the analysis by a reasonable date. The longer a sample sits on the shelf, the lower the reliability of its analysis because of possible leakage or chemical reaction and the higher its chance of being lost. Inform all parties involved about the proposed dates and duration of the test. Check for scheduled maintenance work or unusual feed conditions that can interfere with the test. The author has seen cases when minor maintenance such as filter cleaning interrupted a test. Do not forget to inform upstream and downstream units and check for potential bottlenecks. Troubleshoot for any linked operations that may adversely affect the test. In one case (444), the reboiler heating liquid also heated rail cars. High heating loads on the rail cars would rob the reboiler of some of its heating duty. Check the reliability of the data acquisition system and to what extent you can use it without interfering with normal operation. Check the time intervals at which key readings are updated and ensure they fit the test needs. Compare acquired data to control board readings. Investigate any discrepancies. When more than one system is used to acquire data (e.g., a distributed control system and a separate on-line process analytical system), the system clocks should be synchronized and any offsets noted so that data acquired from different systems can be matched to each other. It is frequently possible to have a control computer or data acquisition system programmed to prepare a special report of data, to store key data points more frequently, to trend key variables, to add to its records normally unmonitored data, and to calculate deviations and standard deviations for selected time periods. These options should be considered and utilized as needed. For readings of computer data logs, it is a good idea to offload 1-minute data from the computer and to later transform them into an Excel spreadsheet, which calculates the maximum, minimum, average, and standard deviation for each measurement over the test period or selected increments of the test period. For other readings, it is best to use the modified versions of the log sheets used by the shift personnel. This is particularly important if the shift team is requested to take readings over the night shift. A new data sheet may confuse them and reduce their cooperation. Readings such as levels, control valve positions, and times at which readings are taken may not appear important but later turn out to be valuable in analyzing results. For instance, a reboiler control valve setting can provide useful information for determining whether the steam side is flooded with condensate. These should be included in the data collection sheets. Include ambient measurements (temperature, barometric pressure, precipitation). They may be valuable for test result interpretation. Case 25.1 in Ref. 201 describes how the correct barometric pressure was central to vacuum tower evaluation. Aim to include as many sets of data as possible on each data sheet to reduce the volume of paper. An attractive flow sheet enhances cooperation from those taking readings. This validates the items on the data sheets and identifies the measurements that were left out. It is too late to discover those during the test. Eliminate any unnecessary readings, but be careful in doing this. For instance, a pressure gauge reading that appears unnecessary may turn out to be the deciding factor between two conflicting readings. Do temperatures, pressures, and flows move in sensible directions? If not, investigate and resolve. Ensure that these close within ±5% (4). Leaking valves and exchanger tubes affect the mass balance, and these leaks need to be identified prior to the final test. Meters have read incorrectly even when the instrument technicians were sure they were right. Ensure that density corrections are adequately applied for all flow meters; correction equations are described elsewhere (4). Reference 361 has superb guidelines for and listing of flow corrections for a wide variety of flow meters. Verify the accuracy of flow meters; use the orifice diameter and pressure drop across it to calculate the flow using the orifice equation as described by Summers (465). Ensure the valves on the lines connecting the orifice taps to the flow meters are correctly set. A material and component balance closure within ±3–5% and an energy balance closure within ±5% are advocated for the final test (4, 187, 192). Some experts (465) accept closure within ±10%, while preferring ±5%. Others (153, 447) target a stricter criterion of ±2% for the mass balance, but recognize that this may not be achievable. When the closure of any of the balances exceeds ±5%, the author strongly recommends performing a sensitivity analysis to define the impact of the nonclosure on the efficiency and only accepting the data when the nonclosure makes little difference to the result or when there is an independent verification of the key meter readings. Sensitivity analysis is discussed in steps 10–14 in Section 3.1.6. In one case, the energy balance on a giant tower closed within ±8%. The sensitivity analysis found this error to be too high to provide a suitable basis for the intended revamp. The plant process engineer solved the problem by diverting the reboiler condensate into a large rectangular trash bin (“Dempsey dumpster”) and timing its filling to give the condensate flow rate. After a couple of trials, the engineer got repeatable results, which accurately matched the steam orifice meter. This test successfully established the reboiler duty as the correct basis for the simulation and revamp. Pay attention to flow measurements of streams near their bubble point or dew point. Flashing of liquid or condensation of vapor can lead to major errors. Any “noisy” or heavily dampened flow meter signal may indicate unexpected flashing or condensation. Whenever practical, cross-check the mass balance against direct weight or volume measurements (e.g., from product tank levels). Make sure you can determine the density of liquid in the tank; you would most likely need to have temperature and composition measurements of the tank liquid. Table 3.2 is a checklist for troubleshooting the nonclosure of material, component, and energy balances. Follow the guidelines in the first two points under step 1 above. Check relief valve bypasses and drains for leakage. Use a pyrometer to find whether these are warm. Leakage will affect the material balance. If it cannot be prevented, check whether it can be estimated from flare or vent header analysis for certain components. Adjust the nitrogen flow to the flare or vent header accordingly. Table 3.2 Checklist for troubleshooting nonclosure of material, component, and energy balances. aCheck for separation quality and nonclosure of component balances only. bCheck for nonclosure of energy balances only. All unmarked items affect mass, component, and energy balances. A flow meter on a liquid stream leaving the column or drum can sometimes be checked by heavily throttling the control valve on the stream for a measured short time period and timing the level rise in the column or drum. The mass accumulated in the tower or drum can be calculated from the level rise and can be used to check the change on the flow meter. In case of a gross mass balance nonclosure, compare the measured flow rates to those calculated from control valve opening, pump curves, and/or ultrasonic flow meters. If practical, perform this comparison over a range of flow rates rather than a single flow rate. These checks are not accurate, but can often identify the meter that is grossly out of line. Component balances for the main components, as well as other components for which the separation in the column is important, should close within ±3–5% as prescribed in step 6 above. For minor components, the lower the concentration of the component, the higher the percentage error in the component balance is likely to be (4), which will easily exceed the 3–5% closure. At low concentrations, these components are difficult to analyze, and they may azeotrope with others. Usually, these small components do not affect efficiency determination, and one can get away with even large nonclosure of their component balances. The author encountered situations where even a factor of 2 or 3 in the component balance of a minor component made little difference to the column and its efficiency determination. In cases where the split of the minor components is important, the AIChE Column Testing Guide (4) suggests estimating their concentration from downstream units, where they are concentrated and can be analyzed more reliably. Other cases where the component balance closure may be relaxed are pseudo-components of petroleum fractions, or dilute components, where a 10% closure is considered realistic (4). A useful check for component balances (4, 192) is preparing a log–log plot of the ratio of distillate to bottoms concentrations for each component against its relative volatility in relation to the heavy key component. Relative volatility is calculated under average column conditions. Except for columns that are primarily stripping or rectifying, this plot should give a straight line or a smooth curve approximating a smooth line. This plot can help resolve discrepancies in component balances. An incorrect reflux meter or a leaking steam trap will not show up in the material balance. Ensure closure is within ±5% (4, 166, 192), but see step 6 above for a possible exception. Ensure that the temperatures of subcooled condensate leaving the reboiler and of superheated vapor (or steam) entering the reboiler are monitored. It has been stated (278) that this is critical for reliably establishing column internal flows. Often, there is no temperature indicator on either. Either add indicators or measure using a pyrometer. As a general rule, plant steam is inherently wet (399, 400). The common belief that letting down steam from a higher to a lower pressure through valves can create saturated (or even superheated) steam is often fallacious. Risko (399) shows that letting down 5% wet steam from 200 psig to 50 psig will only reduce the wetness to 2–3%. Audit the steam line to the meter for sources of condensate such as poor condensate trapping (check all steam traps), damaged insulation (check with a temperature gun), and other heat sinks such as uninsulated flanges. Be on the watch when saturated steam or vapor is used to heat a reboiler or preheater. Any water present in the steam will generate a significant error in the heat duty. Check whether the steam temperature can be raised for the test to prevent condensation or whether the condensate can be trapped ahead of the flow meter. For reboilers heated by heat transfer fluids, check the system for contamination, leaks, and degradation products. These may affect liquid physical properties (115), introducing errors in heat duty calculations. Seek guidance from the fluid supplier as needed. Pay special attention to exchanger duties calculated from small temperature differences (e.g., from the cooling water flow and the difference between inlet and outlet temperatures, where the temperatures are less than 10°F apart). Often, the flow can be throttled to increase the temperature difference; if this is impractical, high-accuracy temperature indicators and/or pyrometer checks may be required. Often, cooling water flow measurement is unavailable, but can be achieved using an ultrasonic flow meter. For air condensers, measure the air temperatures into and out of each bay, as well as the pressure difference across the fan. These measurements may prove crucial for evaluating and checking the condenser duty and tower heat balance. For flashing feeds, determining feed enthalpy from feed temperature is often inaccurate, particularly if their boiling range is narrow. Further, the pressure at the feed temperature measurement point is often unknown due to the pressure drop between that point and the column feed zone. A better estimate can often be obtained from the temperature at the last point where the feed exists as a single phase (prior to flashing). This procedure affords an additional validation check when the feed prior to flashing is at its bubble point (e.g., when it comes from the bottom of a previous tower). Using its temperature and composition (per component balance in step 7 above), the bubble point pressure can be calculated and compared with the measured bottom pressure in the previous column. If the feed is preheated, calculate the preheater duty from the heating side (steam side duty or, if liquid heating, the temperature difference between the inlet and outlet temperatures multiplied by the specific heat and multiplied by the flow rate). Similar considerations apply to feed precoolers. If the temperature of a vapor–liquid mixture needs to be measured, an effort should be made to measure pressure as close to that point as possible. Alternatively, the temperature measurement should be as close to the column as possible where the pressure is known. Use a thermal camera to identify any regions of major heat losses. In some high-temperature vacuum columns, columns with small (<2 ft) diameters where the surface-to-volume ratio is high, or uninsulated columns, or where insulation is damaged, radiation and convection heat losses may be significant. In these cases, heat losses need to be estimated or measured and accounted for. In most cases, these losses are negligible (4). Check temperature increases along lines that are heat-traced. This can be achieved by cutting holes in the insulation at the beginning and end of the line and measuring the temperature difference using a pyrometer. There have been instances (240) where heat tracing caused flashing in a reflux line. Check for steam leaks through reboiler and preheater steam traps. These can be detected by comparing the temperatures entering and leaving the trap with a pyrometer. Heat-integrated towers should be evaluated simultaneously for proper checking of the energy balances (465). Once they are ready, data can be quickly processed and inconsistencies easily detected before or during the test, before it is too late. If operating near a pinch, a “pinch test” is worth considering. Immediately after completing the main test, the column can be retested at another two or three reflux ratios. The reflux ratios should be higher if no azeotrope and lower if one product is near the azeotrope. If the column is near a capacity limit, before raising the reflux for this test, it may be necessary to reduce the feed rate. The AIChE Guide (4) recommends that at least three successive samples of each stream should show essentially constant composition. Below are some actions that help make this happen: A useful trick to monitor lab reliability is to take several samples of the same stream. If possible, take them yourself. Give one sample to the lab tester and request an analysis. Plug the other sample containers, ensuring no leakage. Give the same lab tester the second container several hours later, requesting another analysis (do not forget to remove the plugs first – otherwise the tester may become suspicious). Give the other containers to the lab testers on afternoon and night shifts, leaving one for the tester the next day. Compare the analyses. You may surprise yourself with the difference in results! If necessary, discuss with the lab supervisor, but avoid getting personal. Don’t forget, your objective is reliable data, and bad personal feelings will not help. Another useful check is to obtain a number of test containers early, fill them with samples, then close and plug them to prevent leakage, and record their weight. Reweigh them a number of days later; a weight loss will indicate leakage despite all the precautions. Alert the laboratory supervisor as needed. Check the sampling technique used by the lab tester for each sample. Volatile samples need to be taken in bombs, and these must be adequately purged. Compare the lab analyses against design data, previous performance test results, or by component balances. Look for anything that does not make sense. The tower bottoms stream is at its bubble point, so a bubble point calculation using the bottom composition and the tower bottom temperature should yield the measured tower bottom pressure. Similarly, the tower overhead product should be saturated liquid or vapor at the condensing temperature. Physical property measurement (e.g., liquid viscosity) may also be available and should be checked against the calculated values. Holes can be cut in the insulation in strategic locations around the tower, and wall temperatures measured by a pyrometer or a thermal camera. Wall temperatures add invaluable data for validating simulations, testing theories, detecting packed tower maldistribution, spotting accumulation (“bulges”) of intermediate components, and identifying the presence or absence of a second liquid phase. In tray towers, wall temperatures can provide a detailed tray-by-tray measurement of the temperature profile. For rigorous efficiency tests, wall temperature measurements can become the deciding factor (234) between two conflicting models both matching most of the test data. Chapter 7 has many examples in which these wall temperatures were invaluable. Some engineers use contact thermocouples when measuring wall temperature. The author’s experience with contact thermocouples has not been good. They often take a long time to reach equilibrium and are sensitive to surface irregularities. When inserting handheld thermocouples into thermowells, make sure to allow sufficient time to reach equilibrium at the final temperature. This may be lengthy, especially when measuring hot temperatures. If the calculation and measurements do not match, investigate the reason. The condenser may provide more or less than a single stage. In Case 1.13 in Ref. 201, the capacity of an entire refinery was limited by the gas rate exiting what should have been a single-stage total condenser, but became partial due to Rayleigh condensation providing more than one stage. Should the flash calculation mismatch the measurements, include additional composition, pressure and temperature measurements in the region to fully characterize the split. The author recalls a very painful exercise one time when he skipped this check. The author had been in many situations where the operating team thought the feed entered one point but temperature measurement confirmed it entered another, or the closed valve was leaking and it entered both. A pyrometer survey is invaluable. Then change to the desired feed point. Such leakage will affect the mass and energy balances. Here too a pyrometer survey is valuable. Air leakage reduces the partial pressure of the components, therefore affecting the mixture’s boiling temperature. Attempt to also estimate the point of air entry, as the boiling temperature will only be affected by the leakage from that point up. Their cooperation is crucial for obtaining reliable results. Pay special attention to shift supervisors, chief operators, panel operators, and lab testers that will be working with you; they are the key to success. Explain to them the importance of the test, seek their advice, and incorporate their input into your plans. Some of the participants are only partially familiar with the test zone. Assign areas of readings for each participant. Request each participant to perform a “dry run” and to point out any instruments they cannot locate. This is a simplified process flow diagram showing items of equipment, temperature, pressure, and key component compositions on it (Figure 3.3). Use it to take key readings during the test and to troubleshoot for gross deviations. On the sheet, show expected values and next to them leave empty boxes to enter measured values. Perform a “dry run” using this sheet before the test. Check whether this technique can be applied. Remember that steam condensate flashes, giving rise to incorrect readings. It may be necessary to cool the condensate or run it into a drum partially filled with cold water. Check for special safety, health, and environmental precautions associated with such measurements. An exchanger duty grossly exceeding its heat transfer capability based on reasonable coefficients should raise a flag and is indicative of an issue that needs resolving (277). If they reach a limit, they may interrupt the test. Preparing the program and simulation at this stage may prove very beneficial. Make sure that they are planning to attend, are aware of the safety training requirements, and are willing and able to comply. Last-minute preparations are critical for a successful efficiency test. Problems that arise at the last minute most likely persist during the test and may lead to meaningless test results. The guidelines below are based on the author’s experience, supplemented by Refs. 4, 47, 121, 192, 286, 319. Figure 3.3 Flag sheet comparing measured test data (red) with simulated values (blue) for a C3 splitter tower. This flag sheet was prepared following the test, after a test simulation became available. A similar flag sheet should be used to keep track of the test, but in the absence of a test data simulation, the blue should show expected or design values. When preparations are adequately carried out, the test should proceed smoothly. The main watchouts in this period are as follows: Tidy-up The test is incomplete until all special equipment (e.g., instruments, tags, labels, ladders) is properly removed. Any temporary equipment remaining may turn into a safety hazard or a nuisance. Temporary instruments may become lost or damaged. Labels may confuse the operators. Poor tidy-up is one of the most frequent sources of complaints against test organizers. It is best to first obtain instructions from operation supervisors as to which items need removing and how soon and which items (e.g., some instruments, labeling) constitute a beneficial addition to the unit. Retaining items (e.g., instruments) should be approved both by the operation team and by the department supplying them. The rest of the items should be promptly removed. The first step is compiling material, energy, and component balances for the unit based on the test data. These should close per the guidelines in steps 6–8 in Section 3.1.3. Verify laboratory analyses using dew point and bubble point calculations. Some flows and compositions may need readjustment to satisfy the balance equations. Any inconsistencies must be resolved before proceeding with result processing. Prepare a master flag sheet with the test data. This master flag sheet will serve as the test data input to the simulation. Column efficiency determination To determine column efficiency, follow the steps below: Thermodynamic properties are critical for the validity and success of a simulation model (4, 139, 171, 176, 313, 414, 418, 446, 465, 522). Addressing column design, one expert (315) went as far as stating “The choice of the thermodynamic option for any process simulation is invariably the most critical of all the choices you will make. This is true for any process simulator. A mistake at this stage will be fatal to the accuracy of your results.” Another expert (314) stated (and demonstrated) that “correlations from commercial simulators need to be evaluated and validated.” Errors in relative volatility (α) are the most underrated factor affecting tray efficiency. Direct effects of errors in volatility are independent of the reflux ratio, while indirect effects are additional effects that depend on the reflux ratio. Figure 3.4 shows the direct effect of the errors (82, 193, 202, 404). At very low relative volatilities (α < 1.2), small errors in volatilities have a huge impact on tray efficiency. For instance, at α = 1.1, a 3% error gives a tray efficiency 40–50% higher than its true value. Since the accuracy of relative volatility is seldom better than ±2% to 3%, tray efficiencies of low-volatility systems become meaningless unless accompanied by VLE data. Likewise, comparing efficiencies derived for a low-volatility system by different sources is misleading unless using identical VLE. This applies to both trayed and packed towers. Figure 3.4 Direct effect of errors in relative volatility on errors in tray efficiency. (From Kister, H. Z., “Distillation Design,” Copyright © McGraw-Hill, 1992. Used with permission of McGraw-Hill.) Figure 3.5 Indirect effects of errors in relative volatility on the value calculated for tray efficiency from test data. The apparent calculated efficiency is double its true value due to a relatively small error in relative volatility. (From Kister, H. Z., Chemical Engineering Progress, p. 39, June 2008. Reprinted Courtesy of Chemical Engineering Progress (CEP). Copyright © American Institute of Chemical Engineers (AIChE).) Figure 3.4 also shows that direct errors in relative volatility are a problem only at low relative volatilities. For α > 1.5–2.0, VLE errors have a small direct impact on tray efficiency. For measurements at the finite reflux ratios used in commercial towers, the indirect effects of VLE errors (below) compound the direct effect of Figure 3.4. The indirect effects are enhanced errors in tray efficiency due to the enhancement of the VLE errors by the reflux ratio. Consider a case where αapparent < αtrue and test data at a finite reflux are analyzed to calculate tray efficiency (Figure 3.5). Consider the minimum reflux Rmin and actual reflux R (molar units). Due to the volatility difference, Rmin,apparent > Rmin,true. Since the test was conducted at a fixed reflux flow rate, (R/Rmin)apparent < (R/Rmin)true. A calculation based on the apparent R/Rmin will give more theoretical stages than a calculation based on the true R/Rmin. This means a higher apparent efficiency than the true value. In Figure 3.5, this effect doubles the number of calculated stages from 24 to 48. The indirect effects add to those of Figure 3.4, widening the gap between the true and apparent efficiencies. The indirect effects exponentially escalate as minimum reflux is approached. Small inaccuracies in VLE or reflux and mass balance measurement alter R/Rmin. Near minimum reflux, even small R/Rmin errors induce huge errors in the number of stages and therefore in tray efficiency. Efficiency data obtained near minimum reflux are therefore meaningless and potentially misleading. Verification of VLE data should include reviews by thermodynamic specialists, as well as comparisons with in-house or published VLE data. Blind use of commercial simulator VLE has led to many invalid simulations. The checks should focus not only on the quality of the data and data regression, but also on how well the data extrapolate to the tower temperature, pressure, and composition ranges. With high-purity products, the data available often do not extend to very low concentrations, causing significant – even major – errors (76, 171, 311, Case 1.6 in Ref. 201), or to different temperature conditions (76, 313, 315, 494). With nonideal systems, it is common to have a low-volatility zone (“pinch”) near an azeotrope or near a pure component (139, 311), with enhanced sensitivity to VLE errors. Again, when αapparent < αtrue, it can lead to a gross overestimate of the number of stages from test data. Many nonideal systems experience the formation of a second liquid phase, and inaccurate liquid–liquid equilibrium (LLE) values can largely reduce simulation reliability (139). Lack of information about the process chemicals and their interactions, unexpected column chemistry, and possible product degradation lead to uncertainty in the reliability of the VLE, and experimental verification may be necessary (139). The author could not emphasize the importance of correct VLE more, especially when dealing with low relative volatilities. In one case (289), a new C3 splitter tower (these are large and expensive towers) was constructed based on a simulation that implied that the existing tower was too small. A slightly different relative volatility would have yielded the conclusion that the existing tower was adequately sized, and its throughput was constrained by the undersized 3-in. steam condensate drain line backing up condensate into the reboiler and restricting boilup. This includes the physical properties (such as densities and latent heats) that convert tower external mass flow measurements into the internal molar flows used in the simulation. When the measured apparent molar reflux ratio is less than the true reflux ratio, a calculation based on the measured reflux ratio will give a higher apparent efficiency than the true value. As with the indirect VLE effects, the effect of errors in mass balance and reflux measurements on tray efficiency exponentially escalates as minimum reflux is approached. Again, efficiency data obtained near minimum reflux are therefore meaningless and potentially misleading. Based on test data, it was concluded that the HETP of one packed tower was twice what it should have been. It was intended to split the bed and change distributors. A later thorough review of the thermal properties found the latent heats in the simulation program to be low, making the true molar reflux and boilup rates significantly lower than those simulated. Revising these data brought up the number of stages and reversed the conclusion. The packings performed well; the separation problem was due to insufficient reflux and boilup. In many absorption, stripping, and reactive systems, rate-based simulation methods have given better results than the stage model. In addition to the VLE data, it is important to correctly model the interfacial area. Interfacial area correlations often yield widely different results or fail badly outside the correlation range (314). Reaction kinetics may also come into play. With these systems, it is very important to have lab or pilot plant data to tune the model (314). In common systems like absorption of acid gases with ethanol amines, commercial simulations tuned with plant data are available (501, 502), but they need to be checked and often require some adjustments for specific situations (314). Verification of the model VLE data should include reviews by thermodynamic specialists and close comparisons with data. This is a repeat of steps 6–8, 11 and 12 in Section 3.1.3. Also pay attention to the possibility of intermediate components’ bulging, as described in Section 3.1.2. If not adequately allowed for, the simulation may not match the data (176). For instance, if there are 10 C7 components and the C7 is not a key, they can easily be lumped into the 3–4 main components. Be sure to include intermediate components that may bulge in the middle of the column. In petroleum fractions, flat regions on the temperature–percent distilled curve require fewer pseudo-components, while steep regions as well as regions near cut points require more for good characterization. Feed is usually specified to enter at a desired stage, with the simulation choosing the mixing pattern at the feed stage. When there are no side draws in the vicinity of the feed and no chemical reactions and the feed is a single stream, this is usually satisfactory. In contrast, in the situations listed below, the feed entry needs to be modeled as a series of flashes that mimics the physical way in which the feed enters: The reaction block in the simulation needs to work with the correct concentrations, and these depend on how the feed liquid and column liquid mix at the feed zone. Figure 3.6 is inspired by Hanson and Hartman’s (147) crude tower case study where a 300°F vapor feed from a flash drum and a 695°F flashing feed from a heater both entered the feed (flash) zone. A special distributor on the flashing heater effluent feed separated the liquid from the vapor and directed the liquid to the stripping section below. Figure 3.6a shows a common, but incorrect, simulation, with both feeds mixed at the feed zone. In reality, the cold vapor does not contact the flash liquid due to the feed distributor. Figure 3.6b shows the correct simulation model that matched plant data (147), with the flash drum vapor not mixing with the heater effluent liquid. In Figure 3.6b, the liquid from the wash bed descended via pipes from a collector to the stripping section and therefore bypassed the flash zone; had it rained from the bed, that liquid would have needed to go into the mixer rather than the stripping section. A typical example of this is a refinery vacuum tower, where the major side product, the heavy vacuum gas oil (HVGO), is drawn one or two stages above the feed. In this application, modeling by a series of flashes has been highly recommended (19, 131, 135). Unless there is a reason not to, it is common to assume uniform efficiency throughout a tray column (465). For columns containing sections packed with different packing types or sizes, it is common to apply rule 4 in Section 2.16 for the efficiency of each section. This initial guess needs not be accurate. From knowledge of the actual number of trays and the assumed tray efficiency, or packed height and assumed HETP, estimate the number of theoretical stages. The author and others (48, 169, 465) strongly recommend analyzing test results using theoretical stages and avoiding the efficiency options in the simulations. The efficiency options in the simulation are Murphree or vaporization efficiencies, and these are complex concepts that tend to be variable in the tower. Recently, Braswell et al. (48) showed that these efficiency options are often incorrectly applied in major simulators, violating thermodynamic principles, and leading to incorrect temperature and composition profiles. There is also experience of these options producing erroneous results at low efficiencies (465). In some situations, especially when dealing with absorptions or stripping with chemical reactions, or with chemical reactions inside the tower, the stage model is not suitable and a rate-based model should be preferred (474, 501, 502). Figure 3.6 Feed entry simulation with two feeds. (a) Incorrect, as flash drum feed in this tower did not mix with liquid in heater effluent; (b) correct, no mixing of flash drum vapor with liquid effluent from heater. Useful hints for good architecture and organization of simulation blocks, inputs, and outputs are discussed elsewhere (414). In simple columns (two products, no side draws), it is common to specify the test-measured top and bottom product purities in the simulation, making the reflux and boilup dependent variables. The number of stages is then increased or decreased until the measured reflux and boilup in the simulation match those measured in the test. Alternatively, and often for easier convergence, the reflux and one product purity; or boilup and one product purity; or a product rate and purity; or a product rate and a temperature are specified, and the number of stages is altered to match the other product purity. When developing a simulation, seek simplicity. Simplicity reduces calculation time, makes it easier to make changes later, but most importantly, makes it easier to debug and spot errors that can adversely affect the results. Compare all simulated dependent variables (reflux rate, exchanger duties, and product purities) with measured values. If any mismatch, investigate the cause. If significant discrepancies exist, alter the number of stages in the relevant section to improve the match. Similarly, if internal column samples were obtained, check them against stage compositions predicted by the simulation and adjust the number of stages accordingly. A useful technique by Krishnamoorthy and Yang (264) plots temperature and concentration profiles showing their split among sections of the tower. Figure 3.7 shows such a plot for an ethylbenzene–styrene splitter with six packed beds. Measured temperatures (and if available, also compositions) can be superimposed on the plot to determine to what extent the number of theoretical stages in each bed is achieved. They expressed the results for each bed as a percentage of the observed number of stages to the expected number of stages at good liquid and vapor distribution. A value of 100% indicates that the expected efficiency is achieved, and less than 70–80% indicates problems. They demonstrate success with this method despite the challenge of a small temperature change (<0.2°C per stage) for this close-boiling application. The results may not be accurate, but they successfully identified the trouble areas. Figure 3.7 Temperature and concentration profile in an ethylbenzene–styrene splitter operating at 400 mbars, showing the expected change in each packed bed assuming all operate as expected. When compared with actual measurements, such a diagram can help identify low-efficiency sections. (From Krishnamoorthy, S., and L. M. Yang, “Troubleshooting EB/SM Splitters: How Can a Maldistribution Analysis Help?,” in Kister Distillation Symposium, Topical Conference Proceedings, p. 43, AIChE Spring Meeting, San Antonio, Texas, March 26–30, 2017. Reprinted with permission.) This is perhaps the most critical step in processing test data; overlooking it has been a primary source of grossly misinterpreted test data. It is not uncommon to find that column efficiency was overestimated by a factor of 2, and even more, in columns where product purity is insensitive to the number of stages. Scale-up of such misinterpreted data has proven disastrous on many occasions. Figure 3.8 shows an application of the purity versus stages sensitivity analysis to a depentanizer column. It was critical to determine the number of stages (i.e., the efficiency) in the stripping section. Figure 3.8 shows that the only number of stages that will match the measured bottom composition is 5 or 6. Any other number of stages (4 or 7) will take the composition measurement error to over 50%, which was highly unlikely. The dashed curve in Figure 3.8 examines the sensitivity of the number of stripping stages to the reflux by arbitrarily raising the reflux ratio by 50%; 50% was chosen because this test had no energy balance (the reboil meter was nonfunctional) and the only validation checks on the reflux measurement were the pump and control valve curves, which are typically of ±30% accuracy. Since Figure 3.8 showed a negligible effect of reflux on the number of stages, the lack of energy balance could be tolerated. This confirmed the conclusion that there are 5–6 stages in the stripping section. Figure 3.8 also looks at changing the sensitivity of the efficiency in the stripping section to the number of rectifying stages. The number of rectifying stages was varied widely in the simulation with no effect on the bottom composition. In this tower, there was no way of determining the rectifying section efficiency, as the product compositions were totally insensitive to the number of rectifying stages. Figure 3.8 Efficiency sensitivity checks, stripping section of a depentanizer. (Based on Kister, H. Z., E. Brown, and K. Sorensen, Hydrocarbon Processing, p. 124, October 1998.) The reason for the strange behavior in this tower was that the tower feed point was too low, so the number of stages in the bottom was near the minimum stages, where the composition depends on the number of stages but is independent of the reflux ratio. More commonly, a loss of stages in one section (e.g., bottoms) can be compensated by better efficiency in the other section (e.g., top). In a case reported by Geipel (120), poor stripping section efficiency due to fouling was partially compensated by better efficiency above the feed; in another case reported by Lee (276), it was compensated by raising the feed point. In both cases, this was established by a sensitivity study. Figure 3.9 As minimum reflux is approached, the column efficiency cannot be obtained with confidence. In this tower, efficiencies higher than 40% are impossible to quantify. (From Hennigan, S., “Full Scale Plant Column Efficiency – Measurement and Management,” in Distillation 2011: The Dr. Jim Fair Heritage Distillation Symposium, Topical Conference Proceedings, p. 151, AIChE Spring National Meeting, Chicago, IL, March 13–17, 2011. Reprinted Courtesy of S. Hennigan, INEOS Acetyls.) The difficulty of determining the tray efficiency as minimum reflux is approached is further illustrated in Figure 3.9. The minimum reflux can be inferred from the asymptote to which the model (connected dots) curve approached, which is about 103,000 units. The measured reflux is about 114,000 units. Assuming a 3% maximum error in the energy balance, the tray efficiency is between 32% and 37%, with 35% most likely. However, had the measured reflux been 106,000 units, the tray efficiency would have been anywhere between 40% and infinity. In this tower, efficiencies above 40% are impossible to quantify. Going the other direction, had the measured reflux been about 130,000 units, the efficiency would have been between 28.5% and 30.5% (assuming a 3% maximum error in the energy balance) with 29.5% being most likely, so the efficiency error would have been ±3%, very minor. A plot like Figure 3.5 or 3.9 also gives an evaluation of how errors in the energy balance affect the efficiency. In Figures 3.5 and 3.9, the reflux ratio or reboiler duty can be plotted instead of the reflux rate. Purity versus reflux ratio plots are most informative when plant operating data (not just the efficiency test data, which, as stated, only produce a single point) are added as shown in Figure 3.10. Neglecting the outlying points, Figure 3.10a verifies an excellent simulation that predicts the plant data very well. In contrast, Figure 3.10b shows a much poorer correlation, and since most data points fall to the right of the simulation curve, that an optimistic tray efficiency is used in the simulation. It also shows a much larger scatter of data, suggesting that other variables may play a role in the performance of the tower. When the design, hardware, internal loads, and operating conditions of the top and bottom sections are not widely different and there are no issues with packed tower liquid or vapor distribution, column efficiency should be reasonably uniform throughout the column. If the simulation indicates wide variation from top to bottom, be suspicious. It may suggest an error in the simulation or an actual performance problem. Figure 3.10 Invaluable checks of the validity and sensitivity of efficiency determination by plotting product composition against reflux ratios over a wide range of product compositions. Plant data are red points, and simulation is the continuous blue curve. (a) For a deethanizer column, showing a small data scatter, an efficiency determination that closely matches the data, and good sensitivity of composition to reflux ratio. (b) For a debutanizer column, showing a much larger scatter. The data fall to the right of the simulation curve, showing that the efficiency used is optimistic. The product compositions are quite insensitive to the reflux ratios. (From Bernard, A., “Practical Approach to Distillation Tower Revamp,” in Kister Distillation Symposium, AIChE Spring Meeting, New Orleans, Louisiana, March 31–April 4, 2019. Reprinted Courtesy of A. Brernard.) Figure 3.11 compares TBP distillation measurements with the simulation for a refinery vacuum tower. The process flowsheet is identical to that in Figure 7.2a, with heavy vacuum gas oil (HVGO) being the upper (lower boiling range) side product, the slop wax the intermediate (middle boiling) side cut, and the resid (or residue) the bottom, heavier product. Figure 3.11 Comparing simulated TBP to test data for side products HVGO, slop wax, and bottom resid. (From Kister, H. Z., “Practical Distillation Technology,” Course Manual. Copyright © Henry Z. Kister. Reprinted with permission.) The initial simulation (blue pen) gave an excellent match to the measurements for the resid. For the HVGO, the match was good below 70% LV, but there were some deviations above 70% (measurement 10–25°C above simulation). The large discrepancy was with the slop wax, where the measured TBP temperatures exceeded the simulated, especially at the higher end. The difference gradually rose from zero at 10% LV to about 110°C at 90% LV. This suggested that the heavier material (resid) is likely to be entrained into the slop wax. The simulation was revised by incorporating additional resid entrainment into the slop wax until the measured and simulated TBP curves for the slop wax matched. Likewise, to match the heavy ends of the HVGO, the reflux was slightly reduced, lowering the net draw rate of the slop wax (i.e., not including the entrainment). This pushed some heavier material into the HVGO. The revised simulated TBPs (orange pen in 3.11) are very close to the measurements. Subtract the total number of stages contributed by these devices from the number of stages calculated by the simulation. The difference is the number of stages in the column. Occasionally, the non-key separation becomes important, like when investigating the presence of 100 ppm of water in the bottom of a C6–C7 splitter. The test simulation was prepared to match the test data for C6–C7 separation, giving an optimistic separation for the water. To investigate the water separation, it was rerun with a lower efficiency. The rerun was only good for predicting the water–C7 separation, but was incorrect for the main C6–C7 separation. With some nonideal systems, especially when operating near the azeotrope point or when a second liquid phase is involved, the need to use equal efficiencies for the various binary pairs may be prohibitive, and rate-based (nonequilibrium) simulation models need to be applied (474). Rate-based models are usually preferred also in reactive distillation and gas absorption/stripping applications (474, 501, 502). To perform hydraulic calculations on the tower, tower internals, and distributors, the hydraulic loads are inferred from the simulation. This determination is not always straightforward. The following watchouts apply. Table 3.3 provides a simplified internal flows output, directly derived from a real tower simulation, for rating trays for a tower revamp. The tower was simulated as 16 stages, numbered from top (stage 1) to bottom (stage 16). There was a major flashing feed entering between stages 14 and 15. In this case, the task was to rate the internals below the feed (the stripping trays) and check whether they could handle the maximum simulated revamp loads shown. At first glance, the maximum stripping section vapor flow rate is 19,600 kg/h and the maximum liquid rate is 259,600 kg/h. These were the numbers initially sent to the tray supplier. Based on these, the supplier saw no need to change the stripping trays. The client was not happy, as they believed they observed a limitation at current rates and the expected revamp rates were higher. Table 3.3 Internal flow rates from tower simulation. (From Kister, H. Z., “Practical Distillation Technology,” Course Manual. Copyright © 2013. Reprinted with permission.) Figure 3.12 A sketch leads to the correct internal flow rates from the tower simulation. (From Kister, H. Z., “Practical Distillation Technology,” Course Manual. Copyright © 2013. Reprinted with permission.) It is imperative to appreciate that the listing of the vapor and liquid internal loads in the simulation output is often user-unfriendly, especially near the entry point of flashing, subcooled, or superheated feeds or refluxes. Directly using the numbers in the output can lead to incorrect conclusions, as it did in this case. A simple yet effective technique can easily identify the correct liquid and vapor loads: put together a sketch like Figure 3.12 and list the flows on it. In this tower, each of the bottom two stages (15 and 16) modeled three trays (33% efficiency). The internal vapor flow rate for the upper stage, 19,600 kg/h (Table 3.3), is the vapor flow to the stage, i.e., into the lowest of the three trays represented by stage 15. The flow out of stage 15, which is a lot closer to the vapor flow rate through the upper of the three trays, is a much higher 35,300 kg/h. Table 3.3 lists this flow as the vapor entering stage 14. This is nonsense; the sketch shows the flow into stage 14 to be 35,300 kg/h plus the feed flash vapor (159,300 kg/h), a total of 194,600 kg/h. Table 3.3 gives the liquid rate from stage 15. This is the flow leaving the lowest of the three trays. Figure 3.12 shows that the flow into stage 15 is significantly higher and equals the flash liquid (262,500 kg/h) plus the liquid descending from stage 14 (12,800 kg/h), a total of 275,300 kg/h. This higher number is not in the computer simulation! It is obtainable from the simulation. You need to flash the feed to column entry pressure and then add the flash liquid to the liquid flow from stage 14 (this number is in the simulation), and the result gives the liquid rate to stage 15. So stage 15 needs to be rated for 35,300 kg/h vapor and 275,300 kg/h liquid. All these numbers need to be checked with mass balances to ensure the correct numbers are plotted. In this case, the material balance for stage 15 gives: The author has experience with another major simulation software in which the vapor flash (equivalent to 159,300 kg/h in Figure 3.12) was combined with the vapor from tray 15 (35,300 kg/h) and the result was presented as vapor from stage 15. This would have required stage 15 to be rated for 194,600 kg/h, which is nonsense. In that case, the feed flash was a lot smaller, about 10% of the vapor load from stage 15, so it was missed. The problem was picked by the tray supplier who could not design trays to satisfy the excessive required vapor load. A sketch like Figure 3.12 showed that the additional 10% vapor from the feed flash should not be included in the stage 15 vapor load, and therefore, the supplier’s tray will work. Caution is also needed with highly superheated feed. The superheat vaporizes some of the tower liquid upon entry. The vapor loading peaks when all the superheat is consumed to generate dew point vapor. The simulation often misses this peak (“the bubble effect”). A classic example is a typical refinery FCC main fractionator, where a highly superheated feed at about 1000°F enters, leaving the stage above it at about 700°F. The maximum vapor rate can be inside the stage and, if not accounted for, may lead to premature flood as reported in one case (286). The author had success by rerunning the simulation with two stages above the feed and using the intermediate vapor rate between them to rate the bottom section. This rerun is only used for the hydraulic loadings, as one stage is realistic for separation. Similar considerations apply to liquid side draws or pumparound draws. The simulation output may not include the product draw rate, the pumparound draw rate, or both, in the draw tray liquid loadings. Identification of such issues is the same as outlined above: draw a sketch like Figure 3.12 and check the numbers using a material balance as described above. For packing distributor and parting box ratings, entry piping rating, and pipe distributors bringing feed or reflux, a flash calculation of the feed to tower pressure at the feed entrance point is a necessity. The distributor and piping need to be rated based on the flash vapor and flash liquid rates. The computer simulation often does not report the results of this flash, but would easily include the results upon request by the user. Skipping this flash calculation is a very common gross error in packing distributor ratings. The author has seen many cases where the feed was assumed to be liquid when the flash vapor volume at column entry pressure was more than 80% of the feed. Needless to say, the distributors designed for liquid had no chance of working with a large vapor fraction. Numbers coming out of the simulation also need to be closely reviewed with the help of sketches like Figure 3.12 with highly subcooled feeds. In one case (113), high ethylene losses occurred after replacing trays by packings in an olefin demethanizer. Inadequate allowance for the highly subcooled (70°F) feed overloaded distributor capacities. In another case (450), inadequate accounting for subcooling in tower revamp design led to premature flooding. In one more case (41), the distributor maximum liquid load exceeded the reflux pump capacity by far. The supplier design was based on the liquid rate from the top stage when it should have been based on the reflux feed to the top stage. In some applications, vapor and liquid loads change throughout a trayed section or a packed bed. A common optimizing design strategy in packings is to use the higher-capacity, less efficient packing where the loads are high, and the lower-capacity, more efficient packing where the loading is low. In this case, the vapor and liquid loadings at the demarcation point need to be evaluated, with proper allowance for the efficiency change, making sure the lower-capacity packing can handle the intermediate loads. Below are rules of thumb proposed by Hennigan (169, reprinted courtesy of S. Hennigan, INEOS Acetyls) for critically reviewing tray efficiency determinations. While not all may apply to a specific situation, they are all worth considering. Rules of thumb should always be taken for what they are: rough criteria that reflect the experience of practitioners. They are not meant to replace detailed calculations. Their merit is in providing troubleshooters with practical insight that can be useful in their endeavors. The second part of this chapter deals with various sources of poor separation, other than those covered in Chapter 2 (flooding, foaming, channeling, loss of downcomer seal), those described in detail for packed towers (maldistribution of liquid or vapor, Chapter 4), and those associated with control instability that are discussed in distillation control texts (50, 192, 431, 453). The first step when evaluating tower separation, and when preparing for efficiency testing, is to eliminate any process leaks (Section 3.1.3, step 1). Any such leaks are likely to misguide troubleshooting and efficiency determination. More importantly, process leaks can be health, safety and environmental hazards. These hazards are dealt with in safety texts and are beyond the scope of this book. Here, we focus on the effects of process leaks on separation and efficiency testing. Consider also heat exchanger leaks (see Section 7.3.5) and other extraneous materials that may affect tray or packing efficiency. For instance, seal oil leaking into the feed of a heavy water distillation tower covered the tower packings with a thin hydrophobic film, which reduced wettability and halved efficiency (70). In another case experienced by the author, gas oil leaking through the seals of a diesel product pump got the diesel off-spec. Closely watch out when one of the heat transfer streams is also the product stream. For instance, a reboiler or condenser tube leak may affect the concentration of water in one of the products, as reported in one methanol–water column (333). In another case (284), gas dehydration was poor due to feed–effluent exchanger that leaked cold, wet glycol into the heated lean dry glycol entering the top of the contactor. In one other case (138), a kerosene product from a refinery crude tower showed color because a mid-pumparound heat exchanger leaked crude in. Leakage of crude into its preheating stream (tower overhead, pumparound liquid, distillate product) is a common occurrence that contaminates distillates or plugs trays in the tower. In another case (138), a water leak overloaded the condenser, causing a 40% loss of overhead product. A similar case is presented as Case 5 below. Another case is described in detail in Section 1.2. Useful techniques for exchanger leak detection were described by Pugh et al. (386). Case 1. Off-spec ethylene product (216) The final step in ethylene plant distillation, the C2 splitter (Figure 3.13), separates the ethylene product from the ethane recycle. This is a close separation under pressure (typically 200–280 psig), which produces a high-purity ethylene product (typically a few hundred ppm ethane impurity) and requires a large number of trays, with about 100 trays common. At a turnaround, one C2 splitter was retrofitted with high-capacity trays to raise throughput. Upon restart, the ethylene purity spec could not be met. Tray efficiency was less than half the design. Eventually, the plant got the ethylene on-spec, but at the price of losing tons of ethylene in the bottoms and operating at very low throughput. For an ethylene plant, this is a performance disaster, costing tens of thousands of dollars, maybe more, per day. The plant recruited experts, troubleshooters, and gamma scans. There were meetings, discussions, brainstorming, theories, and ideas. The gamma scans surprisingly showed no apparent problems, but they were not believed. Figure 3.13 C2 splitter tower, showing the dP bypass. (From Kister, H. Z., “Practical Distillation Technology,” Course Manual. Copyright © 2013. Reprinted with permission.) Two weeks later, an operator climbed up the tower. The C2 splitter had a differential pressure transmitter (Figure 3.13), mounted right at the top of the tower. This is a good location for minimizing issues with liquid accumulation in the impulse lines (192), but is also an inconvenient spot to look at and maintain. The operator noticed that around the transmitter was a short bypass line with a ¾-in. valve. To his surprise, the valve was open, probably to isolate the transmitter and protect it during some commissioning operation. It should have been closed when the transmitter was reconnected, but this did not happen. The open valve passed a large quantity of ethane from the tower bottom to the top product. A typical differential pressure on this tower was about 8–10 psi, which will push a lot of ethane into the ethylene via this ¾-in. line. When the operator closed the bypass valve, the ethylene purity came good, the trays operated efficiently, and the consultants were sent home. The author had another similar experience with an analyzer cross-connection on another C2 splitter left open. This tower also had problems making on-spec ethylene upon restart. Case 2. Poor butene separation (216) The author was involved in consulting a client who built a new butene purification facility. The product tower, which was the largest in the plant, separated two butene isomers. Again, a difficult separation. This was a licensed process. Two licensors bid: one offered a tower with 160 trays, and the other with 100 trays. Our evaluation was that 100 trays would be tight, but would at least get close to achieving the desired separation. The large cost difference gave the client sufficient incentive to go with the shorter tower, and its licensor was chosen. Upon startup, the worst fears materialized. The tower was unable to make on-spec products without increasing the reflux to the point of significantly losing capacity. “We told you so, you get what you pay for” was heard from the skeptics that favored the taller tower. The author was called in to see whether there was anything that could be salvaged. Learning from Case 1, troubleshooting began with looking for any possible connections between the products. There was no bypass around the differential pressure transmitter. However, to reduce the number of storage tanks, the design provided the flexibility of sending either product to each of the three storage tanks (Figure 3.13). So there were cross-connections. The author checked each valve on these connections. At the time, the top product was going into tank #1, and the bottoms product to tank #3. All valves marked as “NF” or “SHUT” were shut. As the author was checking them, he put his hand on the lines on each side of the valves (the product temperatures were low enough so there was no hazard in doing so; if the lines are hotter, putting a hand on the line is a burns hazard, and a pyrometer should be used instead). One of the cross-connections felt slightly warm. The author called the operator. “Let me give you another half a turn on the valve and see if it helps,” said the operator, but he could only close it another quarter of a turn (see Figure 3.14). The next day, the operators told the author that overnight they comfortably reached the design throughput with the products on-spec. The reflux was still slightly higher than the design, but not enough to bottleneck the tower capacity. Case 3. Loss of yield For years, engineers in a refinery wondered why the diesel yield from the atmospheric crude tower fell short of the simulated value, while the gas oil product yield was higher. Eventually, a process engineer decided to troubleshoot for cross-connections between these products. She identified some pumps that could be used to pump either product, giving flexibility to perform maintenance on the pumps. So there were cross-connections. She checked the valves on these cross-connections; all were shut. She then took readings using a pyrometer. One of the cross-connection lines was hot. Closing the valve another half a turn did not help here. However, that line could be isolated and the valve replaced. Following the valve replacement, the diesel yield predicted by the simulation was achieved. Figure 3.14 C4 splitter tower, showing the connections to the storage tanks. (From Kister, H. Z., “Practical Distillation Technology,” Course Manual. Copyright © 2013. Reprinted with permission.) Case 4 Sampling from a different point (Case 8.1 in Ref. 201, contributed by Mark Pilling). Kerosene product was off-spec with a high end point. The cause was identified by taking a sample immediately off the column rather than from the product rundown line. This sample was not taken initially as it was hot and awkward to obtain. The sample directly off the column had the kerosene on-spec. Pursuing this lead showed a leaking valve between the diesel and kerosene products upstream of the normal product sample point. This leaking valve was repaired, and the column achieved the design rates and product specifications. Case 5 Sampling from a different point detects exchanger leak (432) An amine absorber unit (Figure 3.15) was revamped with high-capacity trays. Following startup, the absorber failed to provide the same removal of H2S that was achieved prior to the turnaround. The initial investigation, focused on the new high-capacity trays, did not uncover any issues. A lean amine sample from a point immediately downstream of the regenerator showed good quality. Later, an operator took a sample of the same lean amine stream but from downstream of the cross-exchanger (Figure 3.15) and noticed a slightly different color. He had it analyzed. The sample showed contamination with rich amine. The leak raised the H2S concentration in the lean amine, leading to excessive H2S in the treated gas. An examination of the exchanger in the next outage showed pin-sized holes in many of the tubes. Figure 3.15 Typical amine absorber–regenerator scheme. (From Shiveler, G., and H. Wandke, “Steps for Troubleshooting Amine Sweetening Plants,” in Kister Distillation Symposium, p. 96, AIChE Spring Meeting, Austin, Texas, April 26–30, 2015. Reprinted with permission.) Takeaway from all these stories is that the very first step in any troubleshooting of poor or substandard separations, or in planning for a tower efficiency testing, is to critically look for leaks that can impair product purity across all cross-connections and heat exchangers. Weeping refers to liquid descending through tray perforations. Some liquid may also leak at the joints where tray sections are bolted or clamped to supports. Liquid descending through the perforations or at the supports short-circuits the primary contact zone, reducing tray efficiency. At the tray floor, the static liquid head tends to push the liquid down the perforations. The vapor (dry) friction pressure drop counteracts the downward force, acting to keep the liquid on the tray. Weeping occurs when the static liquid head exceeds the dry pressure drop. For most trays, some weeping takes place under all conditions. Sloshing and oscillations create localities in which the static head exceeds the dry pressure drop, inducing intermittent local weeping. Some weeping, as much as 20% (106), can be tolerated without an appreciable loss in efficiency (74, 106). Tray weeping may be nonuniform (17, 300). Liquid weeping near the tray inlet drops to the outlet of the tray below, bypassing the contact zones of both trays, making it much more detrimental to tray efficiency than uniform weeping. Liquid weeping near the tray outlet drops to the inlet of the tray below, bypassing very little of the contact zones, with less efficiency loss than uniform or inlet weeping. The maximum amount of weeping that can be tolerated therefore varies with the system and with the location of weeping on the tray, with typical values between 10% and 30%. Excessive tray weeping significantly reduces tray efficiency. Maldistribution of liquid and/or vapor to multipass trays can also induce nonuniform weeping. In addition, in two-pass and multipass moving valve trays, multiplicity of steady states (348) may create another type of nonuniform weeping, in which some panels weep and others do not. Amazingly, in some polymerizing services where the polymer forms on dry surfaces, a mild amount of weeping can be beneficial. In such services, a polymerization inhibitor is usually injected into the top reflux, protecting the wet upper side of the trays. If the underside of the trays is unwetted, the inhibitor does not get there, and the polymer will accumulate underneath. In this case, it is beneficial to allow some weeping, which will keep the underside wet. Hydraulic calculations are the best methods to evaluate weeping. For lower-pressure systems (<150 psig), the author and others (74) have had an excellent experience with the method of Lockett and Banik as modified by Colwell and O’Bara (74). The author has also had good experience with it in high-pressure non-distillation systems like amine absorbers (223). For high-pressure distillation systems, the author and others (74) prefer the Hsieh and McNulty correlation (179). Both of these correlations and their ranges are presented and discussed in detail in Perry’s Handbook (245) and Distillation Design (193). The above correlations are based on uniform weeping and do not account for intensification due to nonuniform weeping. In addition, the above correlations make no allowance for the intense inlet weeping generated under channeling conditions as described in Section 2.12, which is detrimental to tray turndown. In one air separation column with sieve trays at 160 mm tray spacing and excessive open area, the products went off-spec at rates below 95% of the design (514). In some services, corroded tray support rings are replaced by an internal support structure in the tower. The author had an experience with extensive weeping with this technique, which is unaccounted for by the above correlations. When performing the calculations, audit the uniformity of vapor load in the section under consideration. In some applications, such as steam stripping of hydrocarbons or organics, there is a large variation in vapor loads. This is illustrated in Table 3.3, where the internal vapor flow rates in the stripping section of a refinery crude tower varied from 4500 to 35,300 kg/h, or from 4158 to 8300 m3/h. On a C-factor basis (Eq. (2.1)), this is a variation by a factor of 4–5. If the trays in that section are all of the same design, weeping will be intense in the lower trays. A successful strategy to minimize weeping is to progressively reduce the tray open area from top to bottom in this stripping section (156, 165). Another useful concept in weeping evaluation is the Summers et al. stability factor (468) defined by Eq. (2.6). When the stability factor exceeds 0.6, weeping is less than 30% and the tray is stable. Weeping and pass maldistribution rapidly escalate at lower stability factors, with 50% weeping or more by the time the stability factor declines to 0.4. Recently, Summers (467) analyzed Fractionation Research Inc. (FRI) data to extend the range of physical and mechanical parameters in the stability factor equation. His revised elaborate equations are presented elsewhere (467). Equation (2.6) is still a good first approximation, but the revised stability factor can have values lower than 0.6 for high-pressure distillation systems and higher than 0.6 at low operating pressures. The author has extensive good experience with the earlier version, but only limited experience with the updated correlation. To test for weeping, efficiency testing can be repeated at turndown, and the efficiency difference evaluated. Some towers are constantly operated at low rates with poor separation. If excess weeping is confirmed by hydraulic evaluation, these should be tested by increasing reflux and reboil. Separation should improve, as it did in Case 4.4 in Ref. 201. Leakage, distinct from weeping, refers to the passage of liquid from openings in the tray that are not intended for vapor flow during normal operation. These include (448) leakage around tray support rings, along joints in the tray deck, and through weep holes. Leakage is usually insignificant when a tower operates at high rates, but it may become significant at turndown. It is also important in downsized columns that have been retrayed for internal vapor loads much lower than the original. Seal welding or gasketing and close inspection (Sections 10.3.6 and 10.3.7) are key. Reference 445 contains useful guidelines. To distinguish tray weeping from other types of internal leakage, the vapor and liquid sensitivity tests described in Section 2.7 may help. The difference is that here one is not looking for flood but for tray efficiency change, so the tests need to be run long enough to afford a reliable efficiency determination. This makes the period of off-spec product longer than in the flood sensitivity tests described in Section 2.7. Regular tray weeping is sensitive to vapor rate but generally insensitive to liquid rate. So for regular tray weeping, the vapor sensitivity test would show a significant efficiency loss, while the liquid sensitivity test would not. In refinery fractionators, there are often other indicators, such as internal and side product flows, that can be used to monitor the vapor–liquid sensitivity test, circumventing the need for efficiency determination. A good example is Test 4 in Section 9.2.5. A mass balance around the side draw in Figure 3.16a gives where D, L, WEEP, and SUMP LEAK are all mass flows in consistent units. The side draw will be starved either when the liquid flow rate L from tray 11 above is too low and/or when WEEP from the draw tray (tray 12) and/or SUMP LEAK is excessive. A low liquid flow rate from above can be due to a condenser limitation. In refinery fractionators, it can result from heat transfer limitations in an upper pumparound circuit (e.g., due to exchanger fouling) and/or from excessive condensation in a lower pumparound circuit, as described in some case studies (215, 312). Starving the draw forces reduction in D. The mass balance will compensate by increasing the flow rate of a lower or bottom product stream. This induces lighter material that belongs in the side draw into the bottom or into a lower product, getting them off-spec. We have experienced high WEEP due to channeling (228, see Section 2.12), and it has also been reported by Martin et al. (312). Starving the draw is a common issue when the draw tray is damaged (e.g., 310) and/or when the draw sump is leaking (e.g., 61, Cases 10.3 and 10.4 in Ref. 201). The design in Figure 3.16b allows some liquid to flow back from tray 13 to the sump, so the draw will be starved at a larger weep rate. Using leak-resistant trays, seal-welding the draw sump, and replacing the draw trays by chimney trays are measures that effectively circumvent draw starvation (156, 192). To test for draw starvation, increase the boilup, the reflux (or internal liquid flow) rate, or both. In the absence of severe damage, both should help increase the draw rate. Raising the internal liquid rate test (at a constant internal vapor rate) can help distinguish a draw starvation from an undersized draw line bottleneck. With a starved draw, the product rate should go up. If the line size is limiting, increasing the liquid flow will not raise the product rate. With a starved draw, gamma scans will show the draw lines are not liquid-full. Side Draw Connected to Two Tower Nozzles (Figure 3.16c) Some towers mix side draw streams from two different elevations to optimize product purity and flexibility. A possible issue described by Lee (276) is that the higher hydraulic head at the upper nozzle can push backflow through the lower nozzle. Symptoms include (276) poor product composition of the upper draw, same temperature at both draws, lower static pressure at the lower draw than at the upper draw, and gamma scans indicating less liquid traffic between the draws than below the lower draw. Figure 3.16 Starving a liquid draw. (a) Draw starved when weeping exceeds the intended liquid flow to tray 13. (b) Alleviated with this draw design due to backflow from tray 13. (c) Backflow at lower draw when two nozzles feed the same draw. A once-through reboiler uses a total draw via either a downcomer trapout or a chimney (collector) tray per Figure 3.17a or b, respectively, to capture all of the liquid leaving the bottom tray and feed it directly to the reboiler. The reboiler return is directed to the tower bottom sump, from which liquid is drawn as the bottoms product. No bottoms liquid is recycled back to the reboiler, hence the name once-through. Once-through reboilers can achieve one full theoretical stage of separation (if the trapout draw does not leak) and can also maximize the reboiler temperature difference. Both are advantages over circulating thermosiphon reboilers, in which the recirculation of hot liquid from the bottoms sump into the reboiler reduces the temperature difference and mass transfer stages. Once-through reboiler application is usually limited to systems in which the boilup is less than about 40% of the bottoms product rate, due to the normal limitation of 30% maximum vaporization (by weight) in thermosiphon reboilers (109, 182). An inherent issue with the trapout arrangement (Figure 3.17a) is weeping (or leakage) from the bottom tray or draw sump. Such leakage has been identified (198) as one of the two most troublesome malfunctions in reboilers. Numerous case studies were described in the literature and surveyed in Ref. 201, together with some of the author’s experiences. In one case of severe draw pan leakage (61), the bottoms specifications were hard to achieve, lights were lost to the bottom product, and steam consumption was excessive, costing US $1.5 million/year. The leakage problem is most severe during turndown and startup, where the vapor rate is low. There have been towers that could not be started up due to this leakage. When all the liquid bypasses the reboiler, the reboiler will have nothing to boil, and the lack of vapor will perpetuate the leakage. In most cases, leakage from the trapout arrangement will give a symptom of reboil shortage with lights in the tower bottoms. It is best diagnosed by measuring the bottoms temperature, the reboiler return temperature, and the temperature of the liquid draw from the bottom tray. A flash calculation based on the temperature measurements can estimate the fraction of liquid leaking. If there is no leak, the bottoms temperature will be the same as the reboiler return temperature. The closer the bottom temperature is to the liquid draw temperature, the larger the leak. If one of these temperatures is not monitored, use the wall temperature measurement as described in Chapter 7. The temperatures in Figure 3.17a show a typical case in which the tower bottoms liquid consisted of about 30% of liquid weeping (about 10% of the weeping liquid flashed). Figure 3.17 Once-through thermosiphon arrangements. (a) Trapout. (b) Chimney tray. (From Kister, H. Z., “Practical Distillation Technology,” course workbook. Copyright © Henry Z. Kister. Reprinted with permission.) As the trapout provides little degassing time, rundown lines to once-through thermosiphons must be sized for self-venting flow (109, 192). When they are undersized, the trapout pan may overflow and again the overflow will bypass the reboiler. The chimney tray arrangement (Figure 3.17b) can overcome most, even all, of the above problems but is not totally immune. Leakage can occur through the joints of the tray or draw pan (seal welding or good gasketing can prevent this) or through a damaged panel. When the rundown line is undersized for self-venting flow and the liquid residence time on the tray is less than 0.5–1 minutes, overflow may occur. When the vapor velocity through the chimneys is high, it may prevent the descent of the overflowing liquid and entrain it to the next tray, which in turn may initiate flooding that can propagate right up the tower. Figure 3.17b shows the equivalent temperatures after the bottom tray in Figure 3.17a was replaced by a seal-welded chimney tray. The leakage stopped and the bottom temperature increased, indicating less lights in the bottoms. The reboiler return temperature decreased, showing a larger liquid fraction in the reboiler effluent. Liquid can enter a vapor side draw either by entrainment from the tray below or by weeping from the tray or collector above. To diagnose the source of liquid, it is useful to test at high and low rates. More liquid in the side draw at higher rates indicates entrainment. More liquid in the side draw at lower rates indicates weeping. When sampling the vapor draw from pressure columns for liquid, beware of condensation due to the Joule–Thomson effect as the vapor expands from the column pressure to atmospheric. It is best to fully open the valve from the draw line to the sample container and to throttle the sample container outlet valve. Draw a to-scale sketch of the side draw (Figure 3.18). In Figure 3.18, the bottom of the draw nozzles is 18 in. above the tray floor. Research movies (106; see also Figure 2.1a from this movie) show that when a tray operates at about 50% of jet flood, the spray height reaches 12–15 in. So at higher rates, some of the spray is likely to be entrained into the draws. Case studies of liquid entrainment into vapor side draws were presented (201, 367). In packed towers, vapor draws should be placed beneath a total liquid collector. They must not be placed inside or directly beneath a packed bed as these will draw liquid with the vapor. Check whether the vapor draw is via a bare nozzle or a perforated header. Vapor approaches a bare nozzle from the sides, from above, and from below, and the flow from below may induce entrainment. In packed towers, this flow pattern may lead to vapor maldistribution. Perforated pipe distributors, usually with upward-pointing holes, are common for vapor draws, especially in large towers, but they need to be correctly designed and have the perforations shielded from liquid weeping from above. Invaluable design and checkout guidelines are available in Ref. 441. Weeping is another source of liquid in vapor side draws. In one case (450), a revamp of a solvent stripper in which bubble-cap trays were replaced by valve trays led to solvent losses in the vapor side draw, which was believed to be caused by the increased weeping from valve trays compared with bubble caps. In Case 10.7 in Ref. 201, weeping from the weep holes of a collector mounted above the vapor draw led to liquid in the draw. Damage incidents may occur pre-startup (poor installation), during startup, or during the run. These incidents may be sudden (e.g., due to a pressure surge) or gradual (e.g., due to corrosion). The main indicators of missing trays or packings are historical tracking, pressure drop measurements, and gamma scans. Below are some troubleshooting guidelines: Figure 3.18 A vapor side draw (two nozzles in four-pass trays) that experienced liquid entrainment from the tray below. The bottom of the draw nozzles was close to the spray height on the tray. (From Kister, H. Z., “Distillation Troubleshooting,” John Wiley and Sons, NJ, 2006. Reprinted with permission.) Lieberman (287) describes a classic atmospheric crude tower case in which four uninstalled manways resulted in little separation between diesel and residue, inducing diesel into the residue. To boil off the diesel, the refinery added a new 200-MM Btu/h vacuum heater. Lieberman measured a 0.1-psi pressure drop across the four trays where 0.6 psi was expected and advocated repairing the four trays rather than adding an expensive and wasteful heater, but his recommendation was not implemented. In another tower (312), the field-measured 0.1-psi pressure drop across 11 trays diagnosed their damage. Distillation towers are material-balance-controlled (50, 192, 431, 453), i.e., the material flow in and out of the tower is controlled. For this principle to work, a product stream cannot be on an independent flow control. Note the word “independent.” The flow rate of a stream on flow control, with a cascade (or reset) by another variable such as temperature or level, is not independent; it varies as the temperature or level manipulates it. This will not violate the material balance control. In contrast, a stream on a flow control with no resets has a fixed flow rate and does not allow changing the material balance. The top product in Figure 3.19 is on an independent flow control. Consider 100 units feed, 50/50 lights/heavies, split into 50 lights top product and 50 heavies bottom product, initial steady state. Later, the feed rate is raised to 120 units, the same composition, i.e., 60 units of lights and 60 units of heavies. The flow controller in Figure 3.19 is set at 50, so it would only allow 50 units to leave in the top product. The other 70 units will attempt to leave from the bottom. But since there are only 60 units of heavies in the feed, the other 10 will be lights, and the bottom product will be off-spec for lights, even with high-efficiency tower internals. The presence of other controllers may alter the response, but will not solve the problem. If a temperature controller manipulates the steam flow rate and a reflux drum level controller manipulates the reflux flow rate, the temperature drop (due to the lights that are unable to leave at the top) will increase the boilup. The additional vapor will be condensed and returned to the tower by the reflux drum level controller. This will cool the tower, and the temperature controller will again raise the boilup, which will again raise the drum level and so on. In reality, the operator will intervene and increase the top draw. But until this happens, one of the product purities will suffer. A case study by Musumeci et al. (330) provides an excellent illustration of how correctly implementing the material balance control tremendously improved product purity. Other case studies have also been reported (192, 319). Figure 3.19 A control system violating the material balance control principle. (From Kister, H. Z., “Practical Distillation Technology,” course workbook. Copyright © Henry Z. Kister. Reprinted with permission.) Our malfunctions survey (198) identified violations of the material balance principle to be one of the three leading issues in control system assembly. It should be noted, however, that such violation usually affects the purity of only one of the products, not both. In the above example, the top product will remain on-spec. When the purity of one of the products is not important (e.g., when it is recycled to a reactor without any adverse effects), an independent flow control on a product stream may be acceptable. This is practiced, for example, when a downstream unit is limited in capacity and it is desired to keep a constant feed into it. Violations of the material balance control principle can be prevented by using the material balance control methods described in Ref. 192 and in distillation control texts (50, 431, 453). Distillation texts (e.g., 34, 193, 451, 492) teach us that to get a required separation, there is a need to provide sufficient reflux and sufficient boilup. This requirement may seem obvious, but in some multicomponent distillations, this may be difficult to achieve. A typical scenario is when there is a low-ppm spec (typically <50 ppm) for a volatile component in the bottoms, and at the same time, the feed is either much heavier than the design or deficient in a component of medium volatility. In either case, the bottoms temperature will rise, the reboiler temperature difference will be reduced, and the reboiler may be unable to produce sufficient boilup to strip the volatile component out of the bottoms. Cases 2.2 and 2.3 in Ref. 201 give examples of poor stripping of H2S from the bottoms of a revamped stripper because the feed was much heavier than the design. In Case 2.3, raising the bottom temperature and increasing the reflux ratio were enough to reinstate good H2S removal. In Case 2.2, raising the temperature was constrained by a reboiler metallurgical limitation, and it was necessary to supplement the reboil by stripping steam injection. Excess non-condensables in the feeds, or deficiency of condensable components like light keys, may constrain condensation in the overhead condenser, which in turn may restrict the reflux rate. The insufficient reflux may induce excessive heavies in the overhead product and/or may preclude the generation of enough boilup to remove small concentrations of volatile components from the bottoms product. Bu-Naiyan and Kamali (51) describe a case in which the bottom product from a hydrocracker debutanizer contained 500 ppmw H2S (design was <5 ppmw) when operating in the diesel mode with the feed much heavier than the design. A simulation study identified poor fractionation due to insufficient reflux as the root cause. The H2S concentration was reduced to 10 ppmw by spiking the feed with 2000 BPD of butane (light key, about 5% of the feed) to establish adequate reflux/lift. After the injection, the reflux rate could be increased to more than 6000 BPD, which gave the better purity. A further reduction to <5 ppmw was achieved after another problem (Case 2, Section 8.17) was solved. The author is familiar with other cases in which injection or recycle of light key into the feed solved similar problems. Excessive preheat or feed cooling can induce similar issues. One debutanizer (286) had 72% C4’s in the feed. A few degrees extra preheat boosted feed vaporization, a drop in stripping rates, and an increase in the C4’s content of the bottoms. Cases of a lack of stripping in a stripper due to excessive subcooling at the feed (149, 286, 449) were also reported. Incorrect instrument readings can mislead and induce operation at insufficient reflux and/or boilup rates. Reference 396, Tale 6 in Ref. 216, and Case 2.6 in Ref. 201 are examples. Energy balances and differential pressure checks can help diagnose. In other cases (449, and in Case 2.1 in Ref. 201), reflux flow was cut out altogether, resulting in poor separation. Good simulation based on field data is invaluable for detecting all the above issues. In some cases, the simulation shows almost no vapor. In one case (149), temperature difference and pressure drop measurements across a crude tower stripping section showed insufficient stripping steam; doubling the steam rate was a major improvement. In another case (396), pressure drop measurements helped diagnose insufficient reflux and boilup. There is a wide variety of control problems other than those discussed in Section 3.2.7 that can also increase product impurities. In most cases, these problems lead to instability and fluctuations in reflux and boilup, which in turn affects product purities. It will take a book to address these problems in a way that will do them justice. So the author is leaving their discussion to Refs. 208, 192, 201, and 206 and distillation control texts (50, 431, 453). In chemical systems, azeotroping of compounds often determines which direction certain components will travel in the column and in which product they will end up. The presence of contaminants, caustic, or salts can change the equilibrium, sending components in an undesirable direction. The author was troubleshooting the presence of water in the bottom of a debutanizer. The hydrocarbon feed contained a minute amount of water, which would normally end up in the top, with none in the bottom. The test that diagnosed the problem was letting a sample of the bottoms settle and then inserting Litmus paper into the water phase. The dark blue color indicated caustic. Subsequent analysis showed it to be over 50% weight caustic. The tower feed passed through a dry caustic bed to remove acidic components, and caustic fines carried over into the tower. Similarly, the author has seen many cases where water was supposed to form a minimum boiling azeotrope with an organic low-boiler and leave from the top. Due to salt or caustic entry, a significant concentration of water was often found in the bottoms product. Upon contact, process liquids absorb small quantities of volatile components or sparingly soluble gases. For instance, when nitrogen is used to keep up the reflux drum pressure, a small quantity of nitrogen will be absorbed by the reflux and liquid product. This can make the product off-spec or generate venting problems downstream. The contact pattern is key. Liquid splashed into the drum vapor space generates a large contact area between the liquid and the nitrogen, and the liquid will absorb a considerable quantity of nitrogen. In contrast, if the liquid line enters the drum well below the liquid level, the liquid will not contact the nitrogen and the absorption will be minimal (if any). Figure 3.20 describes a case of nitrogen used to maintain pressure in a newly added debutanizer feed drum (210). Following restart, nitrogen needed to be vented from the downstream debutanizer, deisobutanizer, and depropanizer. The plant noticed that the nitrogen control valve was opening almost fully, suggesting that a lot of nitrogen was coming in. This nitrogen had to get out, and the only open route was with the drum outlet liquid. The high absorption rate was due to the feed entry near the liquid surface. This exposed an extensive contact area between the feed liquid and the nitrogen in the drum vapor space. The author is familiar with several similar cases. Likewise, a freshwater reflux to a tower will absorb a significant quantity of volatile components, while reflux water generated in the overhead system will be saturated with the light components and absorb much less (471). In chemical systems, reactions can produce undesirable components that end in one of the products. Contaminants can azeotrope with some components and change the direction of their concentration in the tower. Reactions can also generate components that cause plugging, fouling, corrosion, or foaming. Contaminants soluble in the feed may become insoluble and precipitate out once components to which they have affinity are distilled out of the solution in the tower. Figure 3.20 Nitrogen absorbed by the liquid in a newly added debutanizer feed drum. (From Kister, H. Z., Chemical Engineering, p. 47, April 2022. Reprinted with permission.) Below are some guidelines that can be useful for troubleshooting reactions that directly (not via plugging or foaming) generate product purity issues: Another test is to operate the tower on total reflux for a short period and monitor the impurity. A growing concentration of the impurity in the top product confirms the reaction. In one tower (401), total reflux testing identified a suspected decomposition of highly chlorinated ethanes to be the root cause of poor separation in the bottom packed bed. In case study 15.1 in Ref. 201, operation at total reflux verified that the product contaminant was formed by a reaction inside the tower. When the tower bottom contains thermally unstable compounds that decompose exothermically, excessive temperatures can cause a “runaway” reaction and sometimes lead to an explosion. Some experiences with such explosions have been reported in distillation of nitro compounds, peroxides, hydrocarbon oxides, and acetylenic compounds (10, 86, 87, 255, 309). In services where exothermic polymerization occurs, hot spots may form, with the polymer around them hindering cooling by the bulk liquid. This may intensify the above reactions. In batch distillation, as the light components are depleted from the residue, the bottom heats up, often initiating decomposition and condensation reactions that generate off-spec products and/or corrosive components. A common cure is to first recover the product from the heavies. Often, this is a quick step that utilizes the high volatility gap. If an undesirable reaction is suspected, it is worth checking column products and deposits for the presence of reactor catalyst and metal fines. In one amine absorber (11), aldehyde entering the amine system caused the H2S in the lean gas to be well above the specification. The aldehyde bonded with the H2S, which inhibited H2S stripping in the regenerator. An extensive survey of failures in amine absorber–regenerator systems identified solvent contamination by degradation products or glycols to be a major cause of off-spec lean gas (274). Chemical analysis is the key to diagnosing these contaminants, as demonstrated in Refs. 6 and 432. If the contaminant is chemically unstable or explosively reacts with the column chemicals, a detonation may result; some examples were reported (86, 309). Chemical analysis and bench-scale tests are key to diagnosis. If practical, it may pay to derive the tower or plant feedstock from an alternative source for a trial period. In glycol dehydration systems, slow oxidation of the glycol into organic acids over an extended period of time caused severe corrosion (78). The reaction products should be either removed or rendered harmless, e.g., by neutralization. In one olefin plant caustic absorber (359), the buildup of reactive components when minimum flow bypasses of a compressor were open was theorized to generate additional free radical chains that intensified fouling. Long residence times in the heated zone at turndown can also promote undesirable reactions like decomposition. Often, the column pressure can be reduced to bring the temperatures down since the condenser and tower are unloaded at turndown. Increasing reflux to the tower may increase the concentration of a valuable top product component and promote its undergoing secondary reactions accompanied by a loss of product, as has been reported in one case (471). Several explosions caused by inadvertent concentrations of peroxides in a column or reboiler have been reported (87, 309); similar incidents may occur with other unstable compounds (e.g., 86, 184, 255). Hydrocarbon impurities ingressed in the air intake to air separation plants tend to accumulate as solids in the liquid oxygen at the reboiler of the air separation column. When built up sufficiently, they react explosively with the oxygen (86, 308). The hazard is greatest at shutdowns because the more volatile liquid oxygen vaporizes preferentially, concentrating the impurities.
Chapter 3
Efficiency Testing and Separation Troubleshooting
3.1 EFFICIENCY TESTING FOR TROUBLESHOOTING
3.1.1 Purpose and Strategy of Efficiency Testing for Troubleshooting
3.1.2 Planning and Execution of Efficiency Testing for Troubleshooting
Start time
20-Mar-18
15:00
End time
20-Mar-18
13:00
Description
Tag No.
Units
Min
Value
Max
Std Dev
Feeds
C3 from FCC + PPR return
ecfc03
ton/hr
22.96
23.21
24.64
0.26
Products
Stripper bottom flow rate (liquid)
efc04
ton/hr
21.91
23.05
24.75
0.51
Stripper bottom temperature
eti02
C
60.99
61.28
61.57
0.11
Stripper bottom C2H6 concentration
eac01a
ppm
80.04
97.35
126.23
14.52
Stripper bottom C3H6 concentration
eai02b
%
79.08
79.88
80.62
0.38
Stripper bottom CH4 concentration
eai01c
ppm
1.75
3.56
11.73
2.50
Stripper purge flow rate
efc07
ton/hr
0.17
0.49
0.81
0.08
Stripper condenser outlet temperature
eti08
C
45.10
46.19
47.00
0.53
General
Stripper reflux flow rate
efc05
ton/hr
23.19
24.52
25.32
0.45
Stripper LP steam to reboiler flow rate
efc06
ton/hr
3.40
3.65
3.86
0.04
Reboiler return to stripper temperature
eti03
C
60.75
61.16
61.57
0.13
Stripper overhead pressure
epc01
kg/cm2
24.4
24.48
24.60
0.03
Stripper pressure drop
epi02
kg/cm2
0.36
0.36
0.36
0.00
Stripper overhead temperature
eti01
C
50.89
51.73
52.63
0.39
LP steam temperature
eti09
C
194.25
198.22
201.7
1.81
LP steam pressure
epc11
kg/cm2
1.69
1.72
1.74
0.01
Local
Temperature after FC-07
local T1
C
10.0
Pressure before FC-06
local P1
barg
2.0
Pressure after FC-06
local P2
barg
0.0
Pressure after vent condenser
local P3
barg
23.9
3.1.3 Preparations for Efficiency Testing
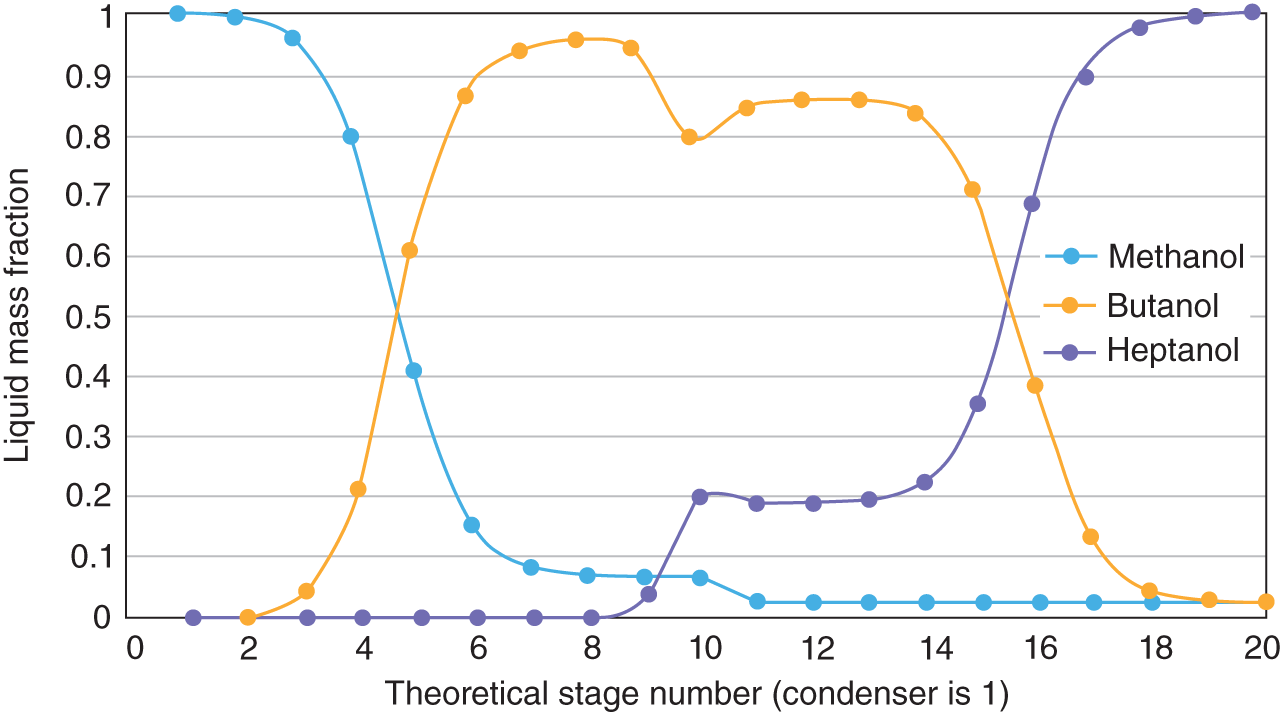
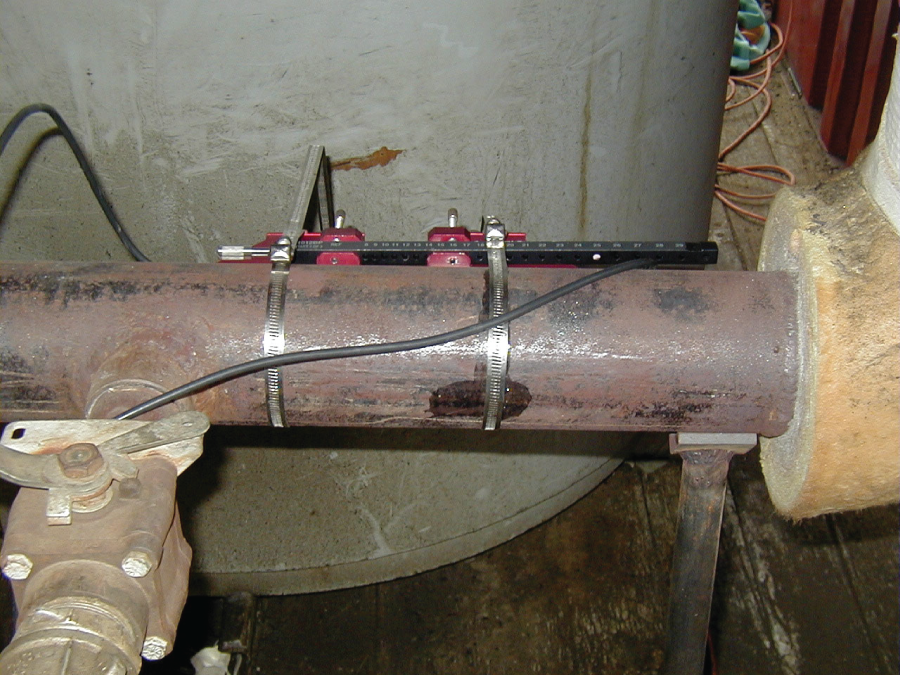
3.1.4 Last-Minute Preparations
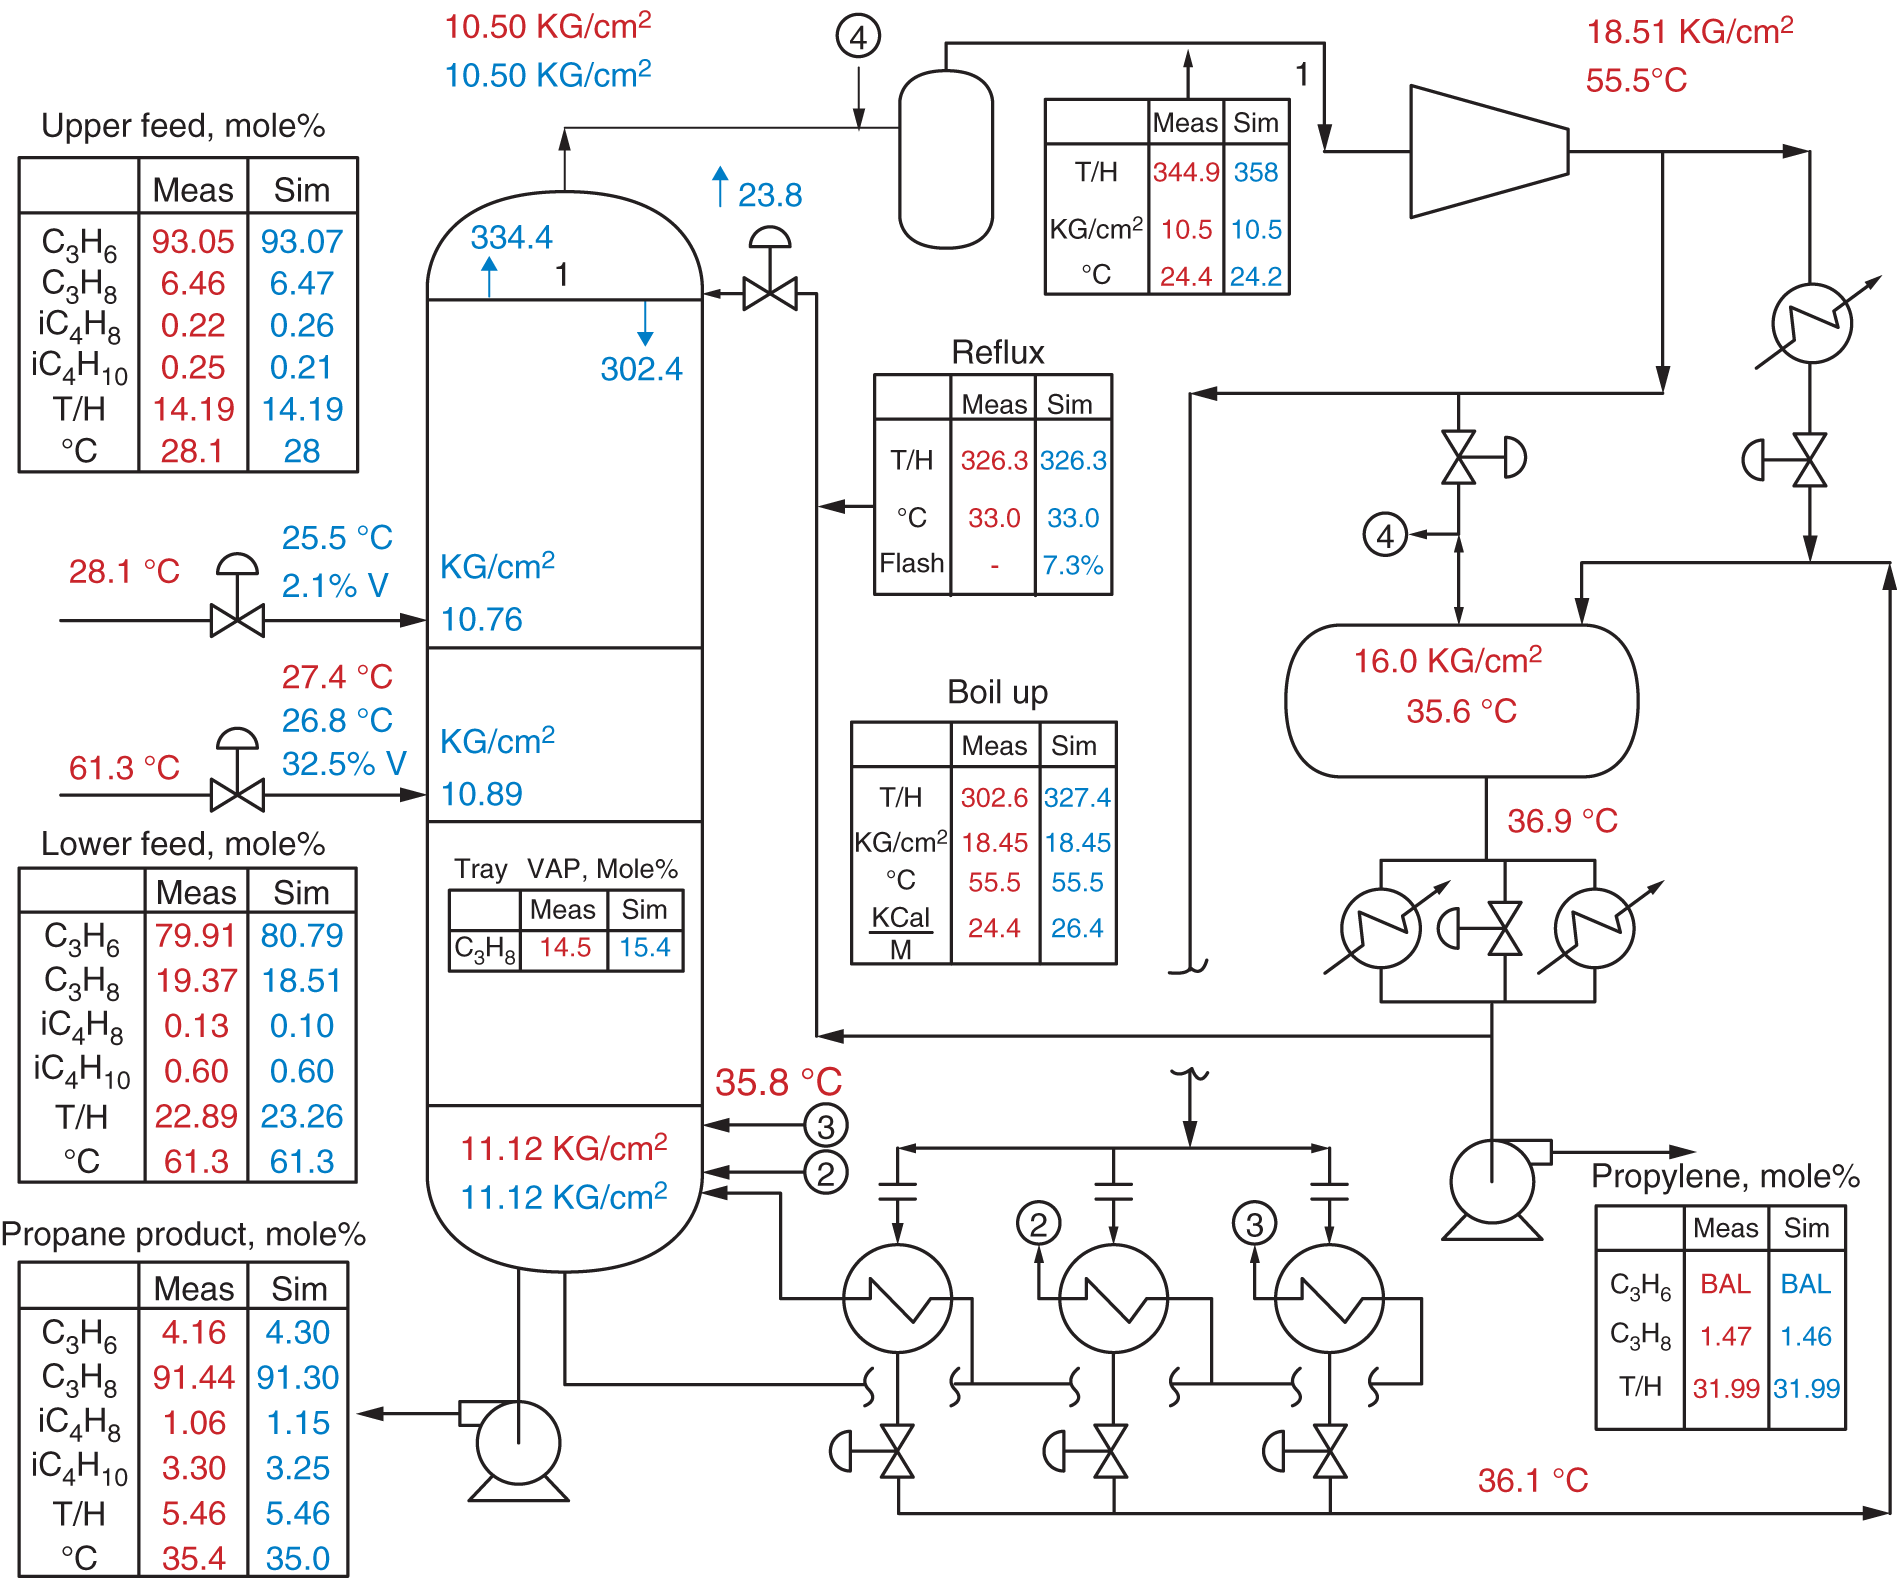
3.1.5 The Test Day(s)
3.1.6 Processing the Results
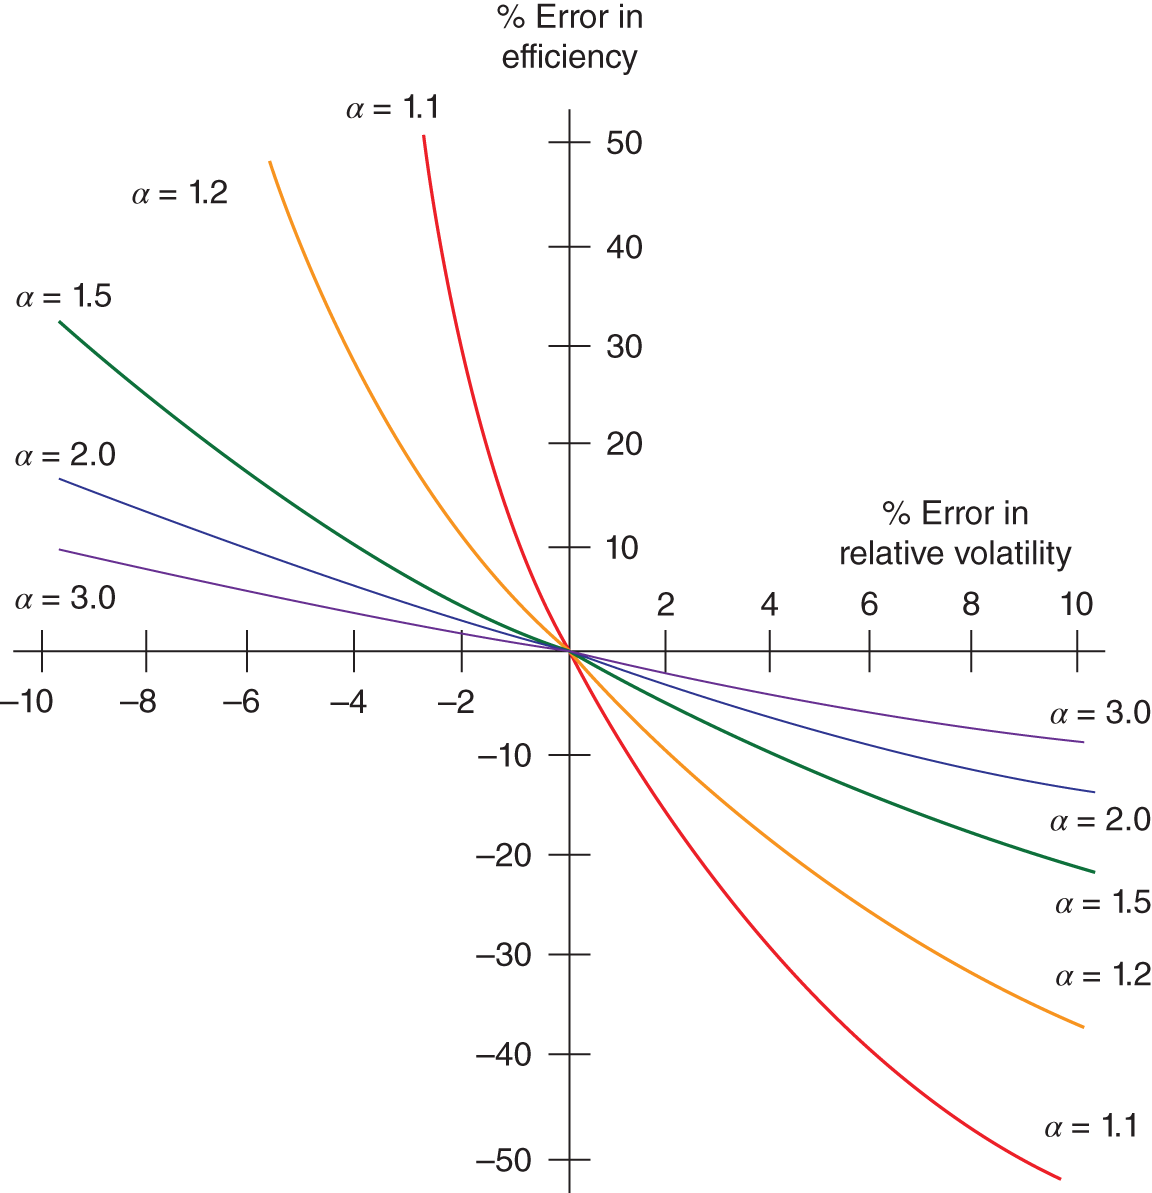
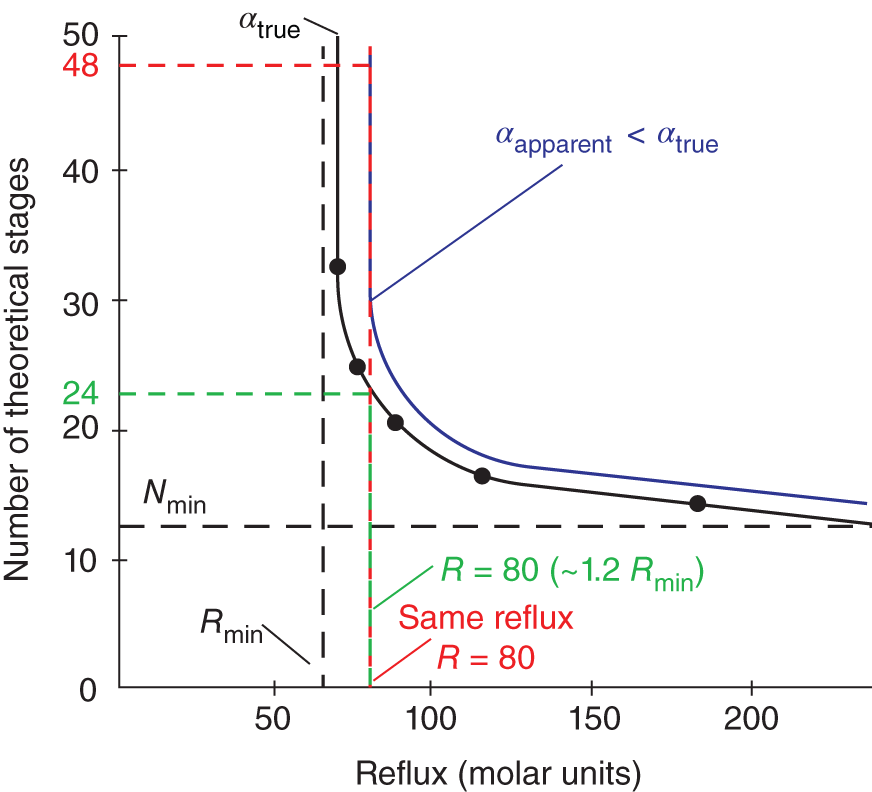
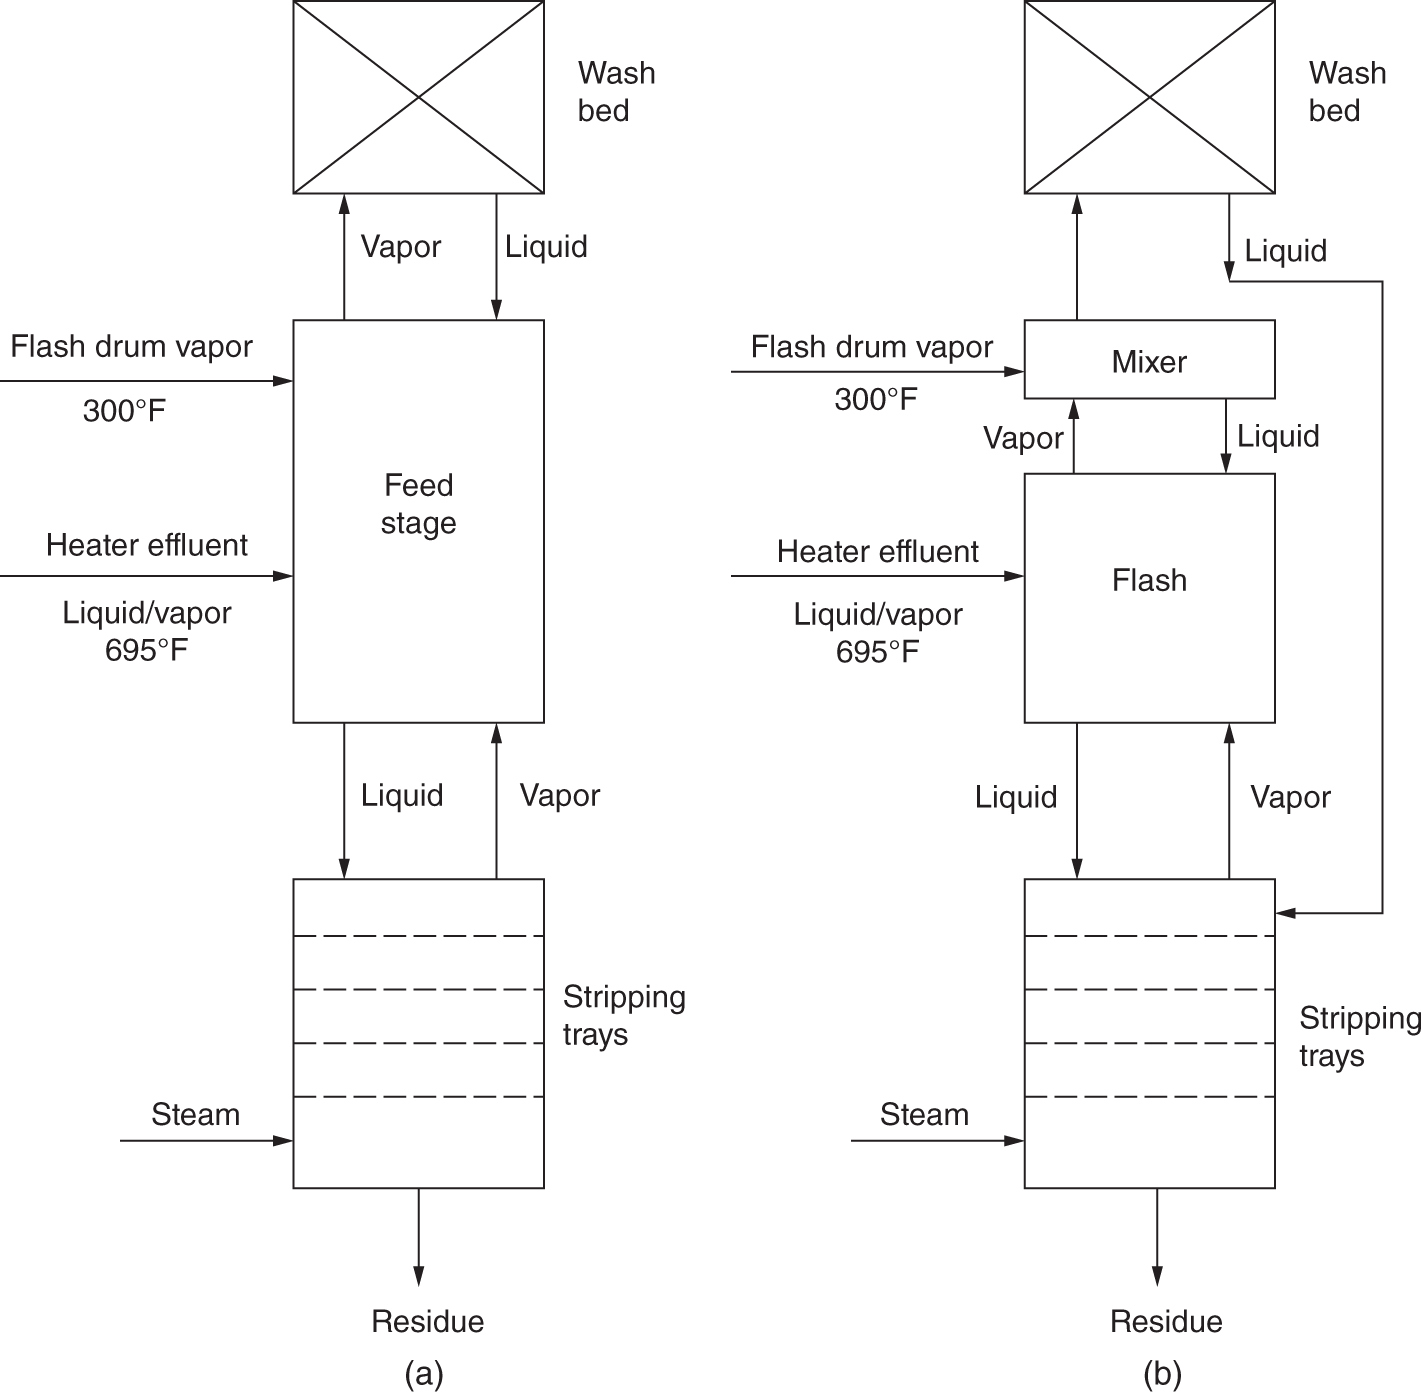
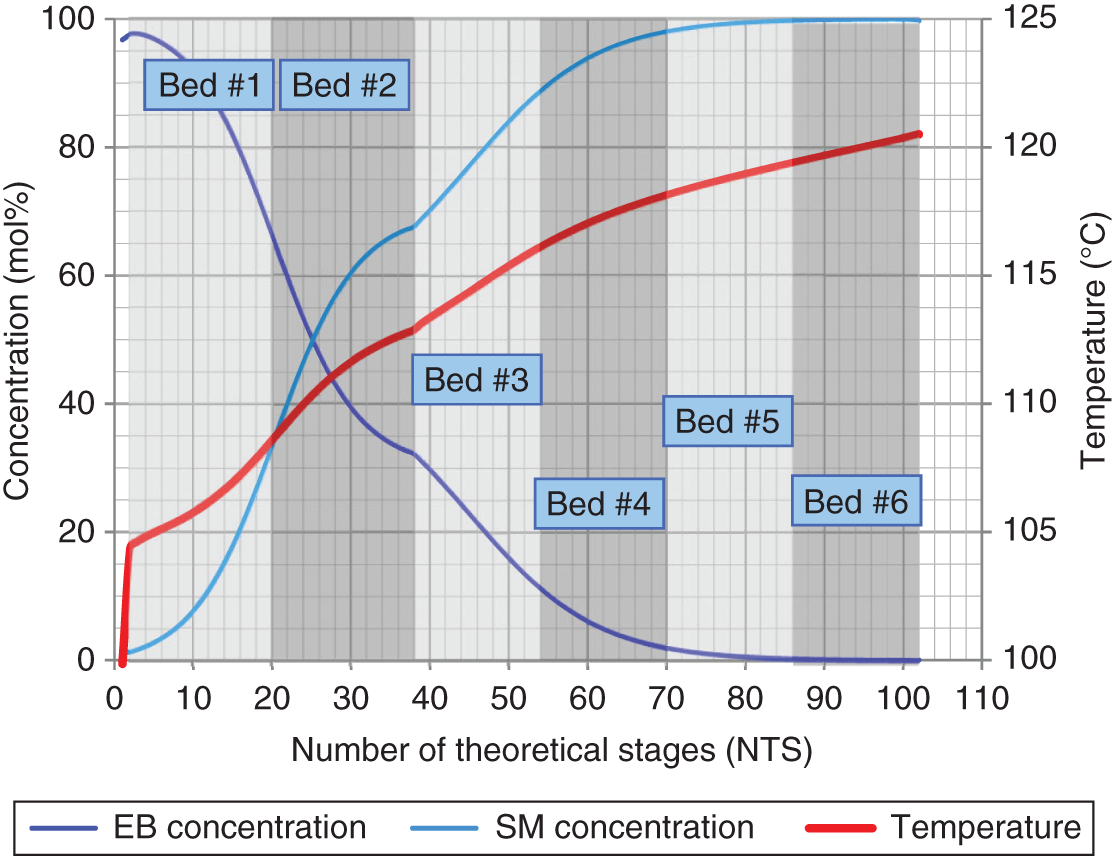
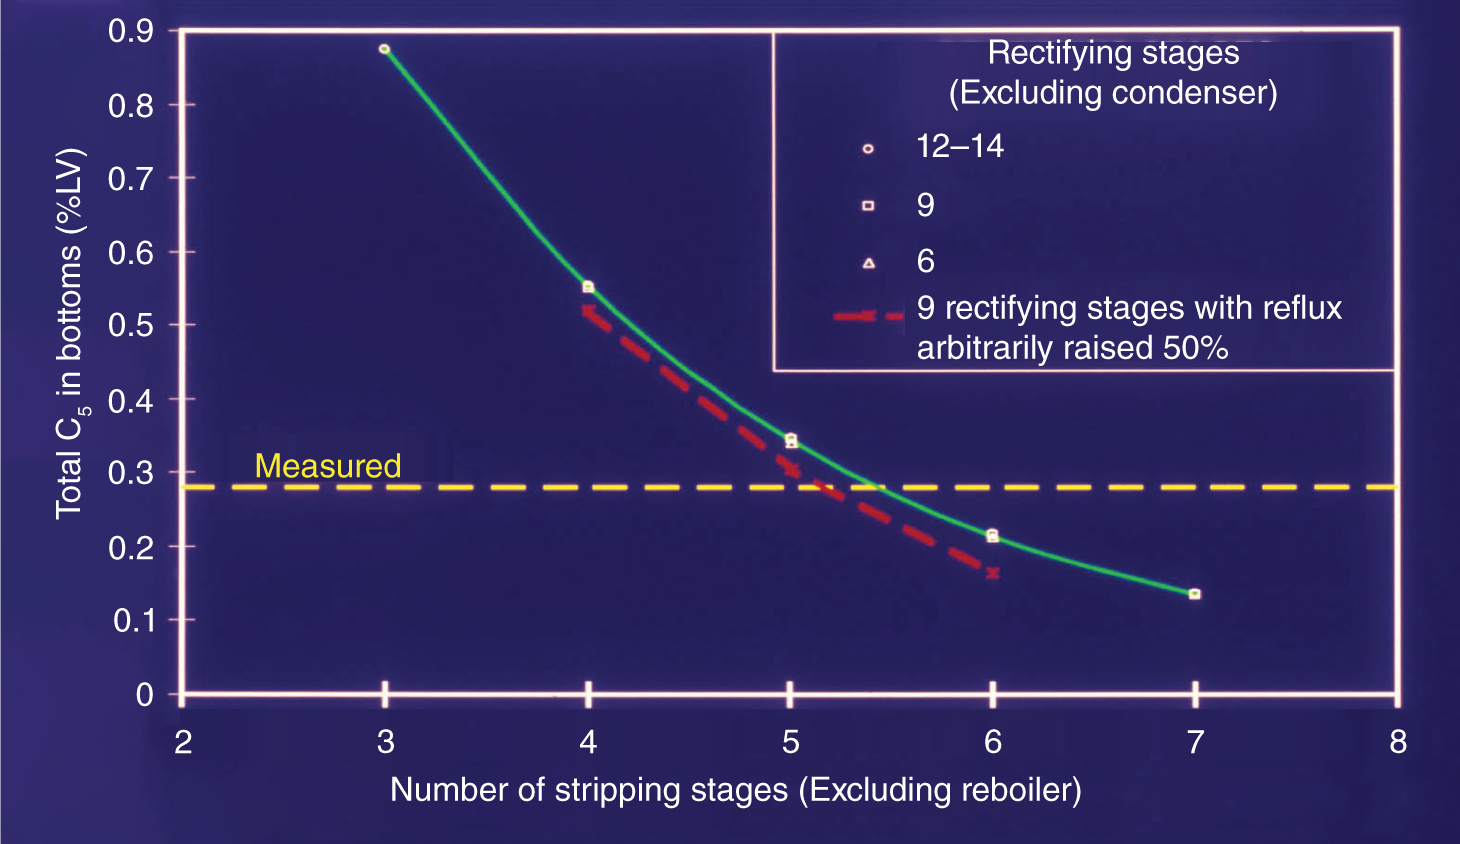
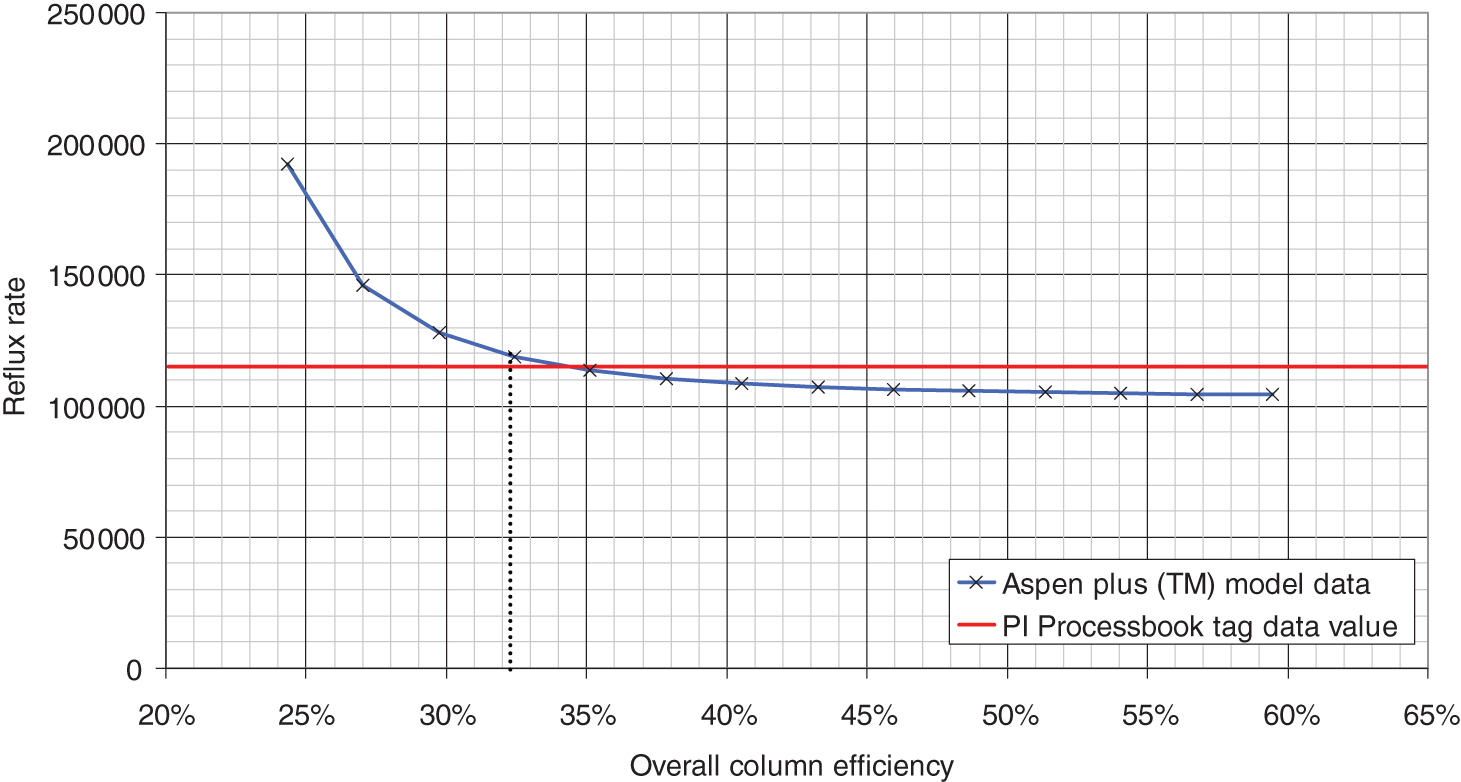
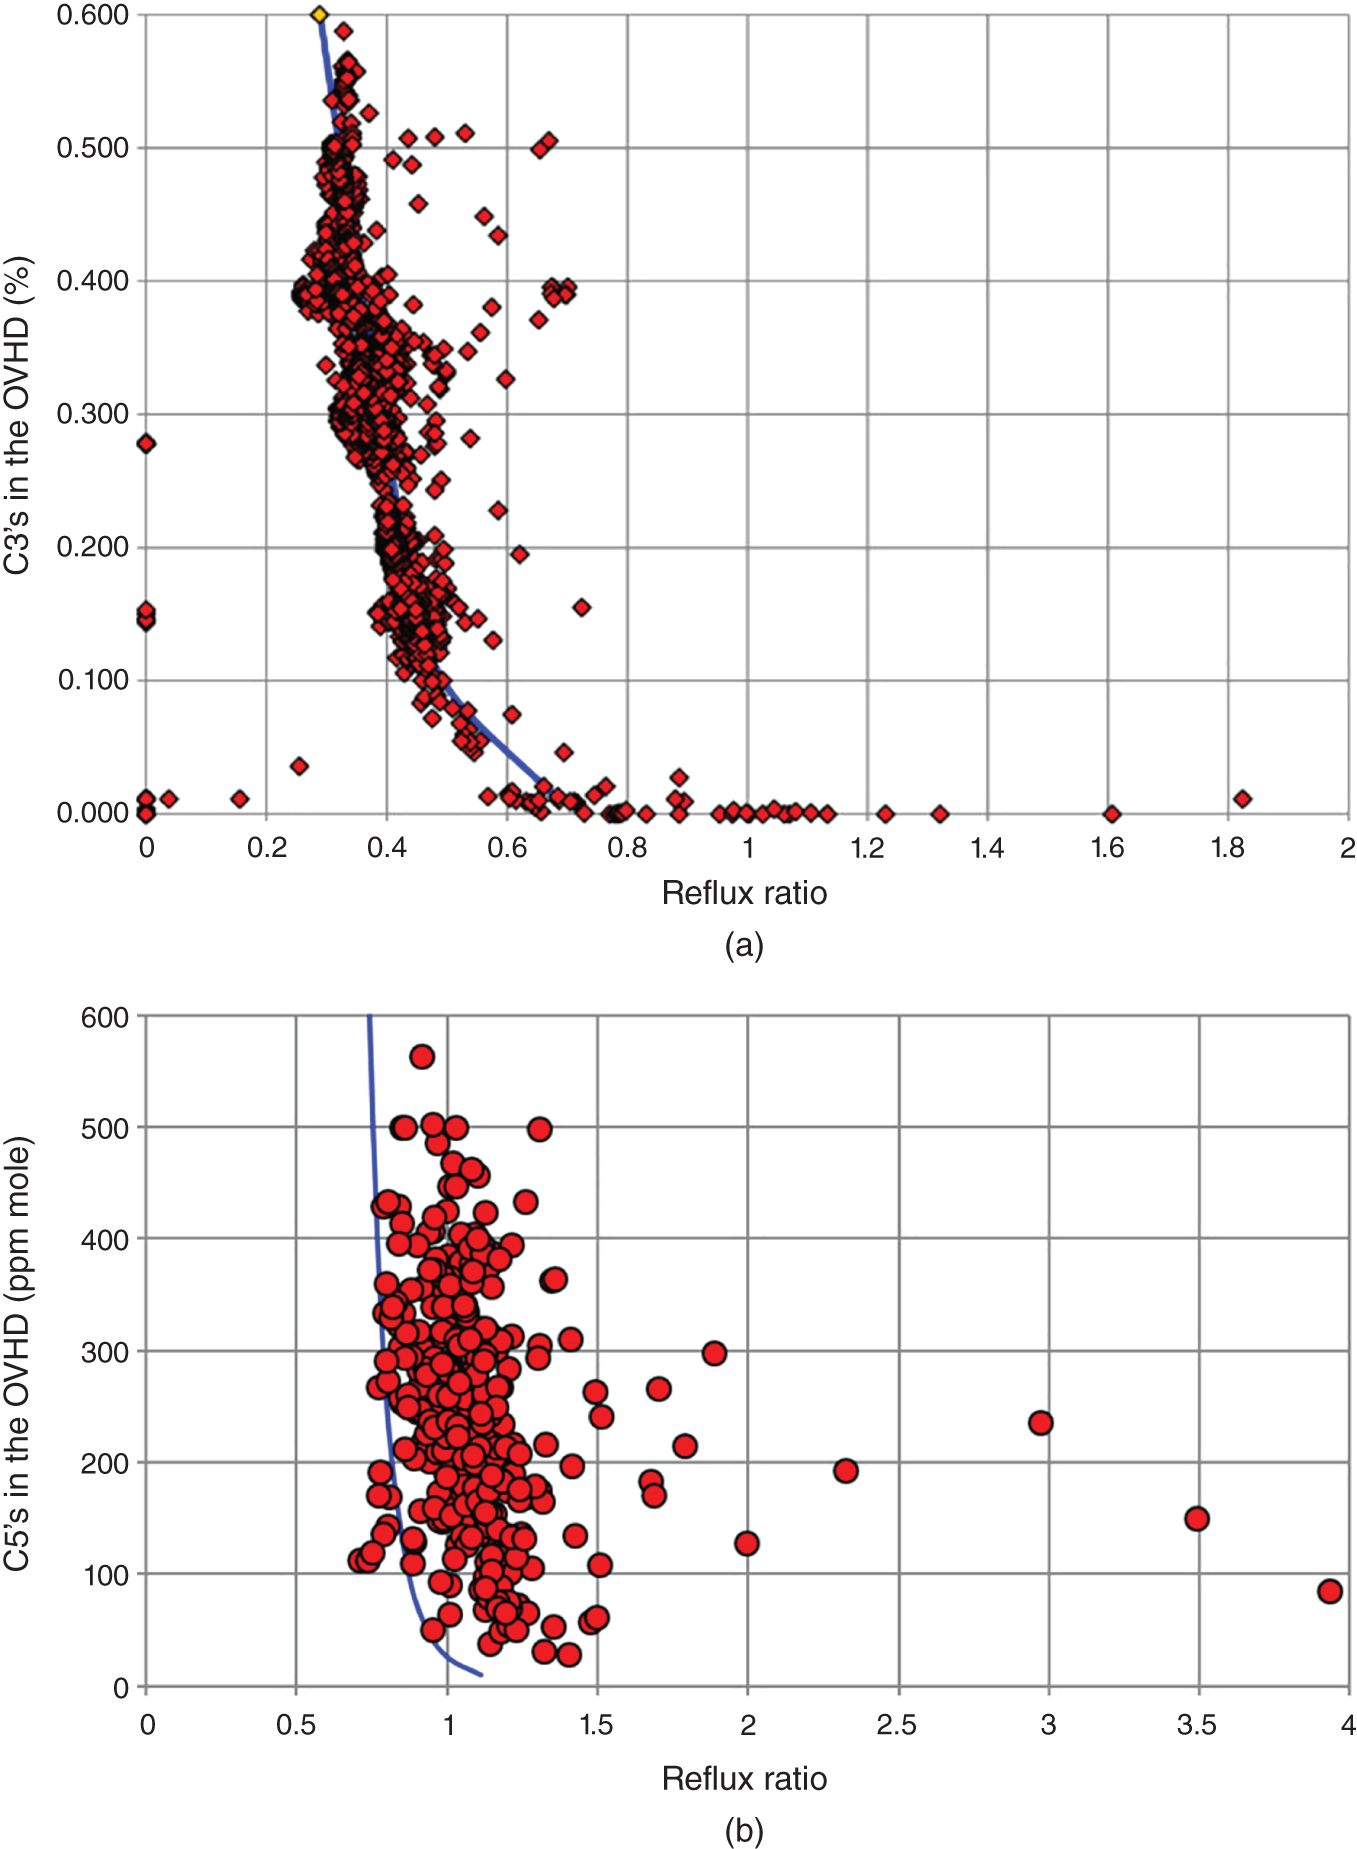
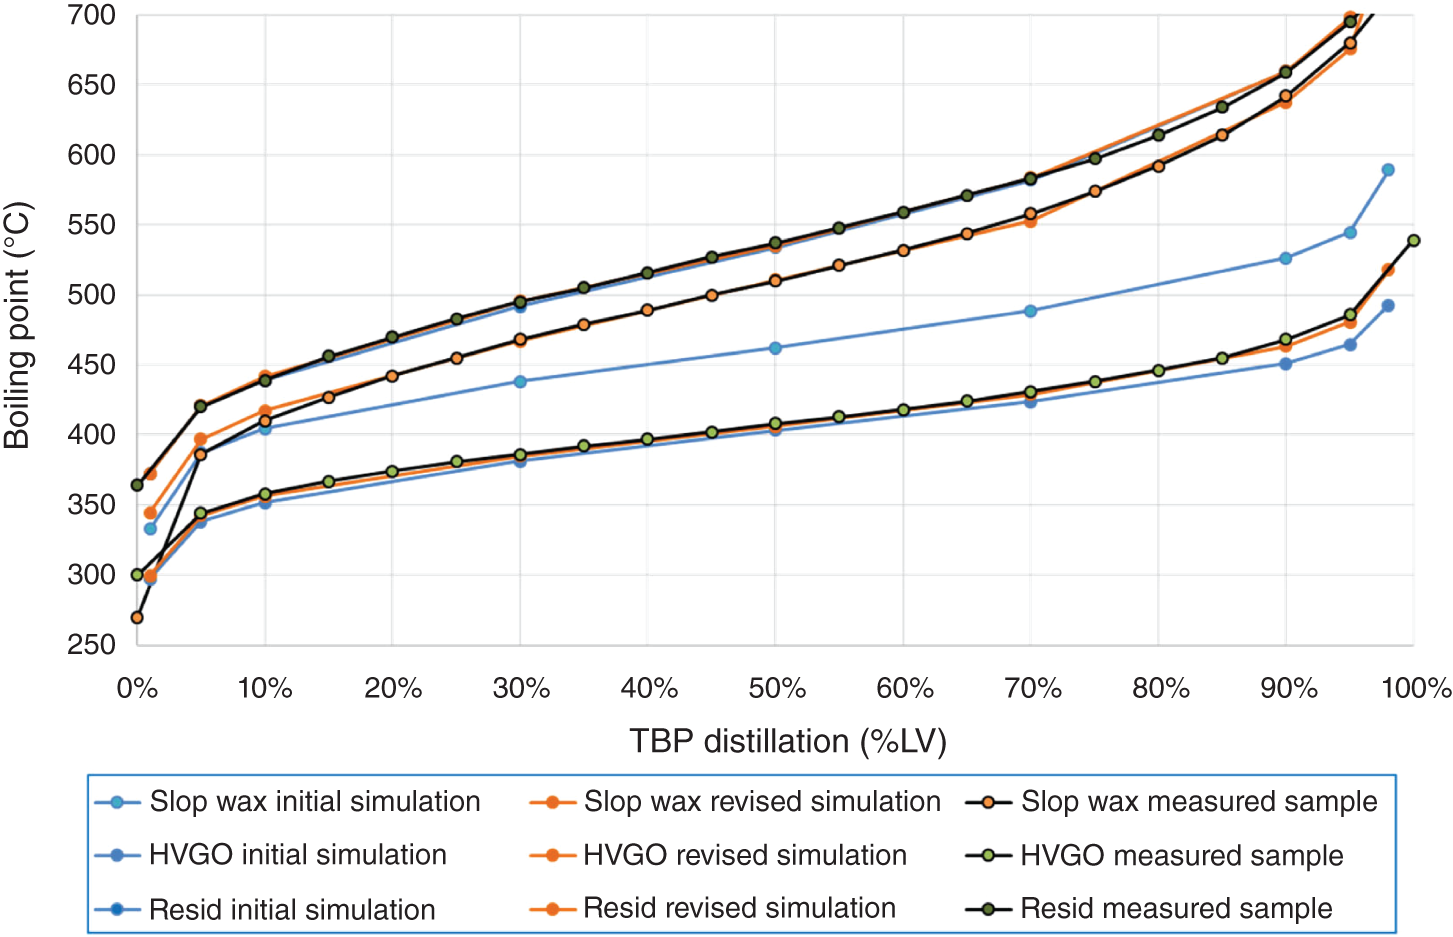
3.1.7 Determining Hydraulic Loads
Liquid profile (from tray)
Stage
12
13
14
15
16
Mass flow (kg/h)
155,400
33,300
12,800
259,600
244,500
Volume flow (m3/h)
242
52
20
375
347
Density (kg/m3)
641
635
644
693
705
Vapor profile (to tray)
Mass flow (kg/h)
225,000
215,000
35,300
19,600
4,500
Volume flow (m3/h)
29,500
29,000
8,300
6,600
4,158
Density (kg/m3)
7.633
7.415
4.258
2.963
1.082 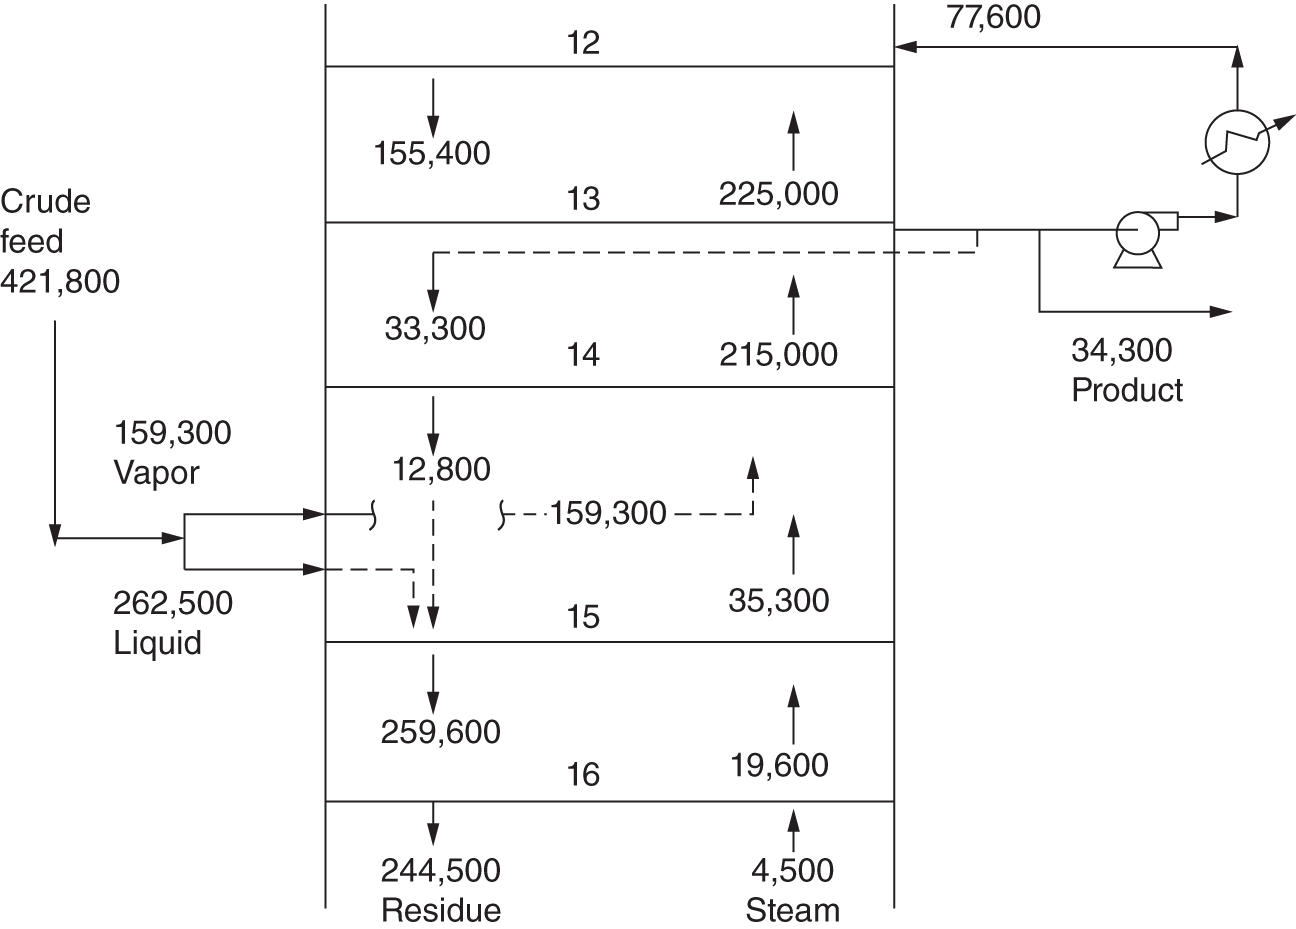


3.1.8 Hennigan’s Rules
3.2 DIAGNOSING POOR SEPARATION
3.2.1 Troubleshoot for Process Leaks
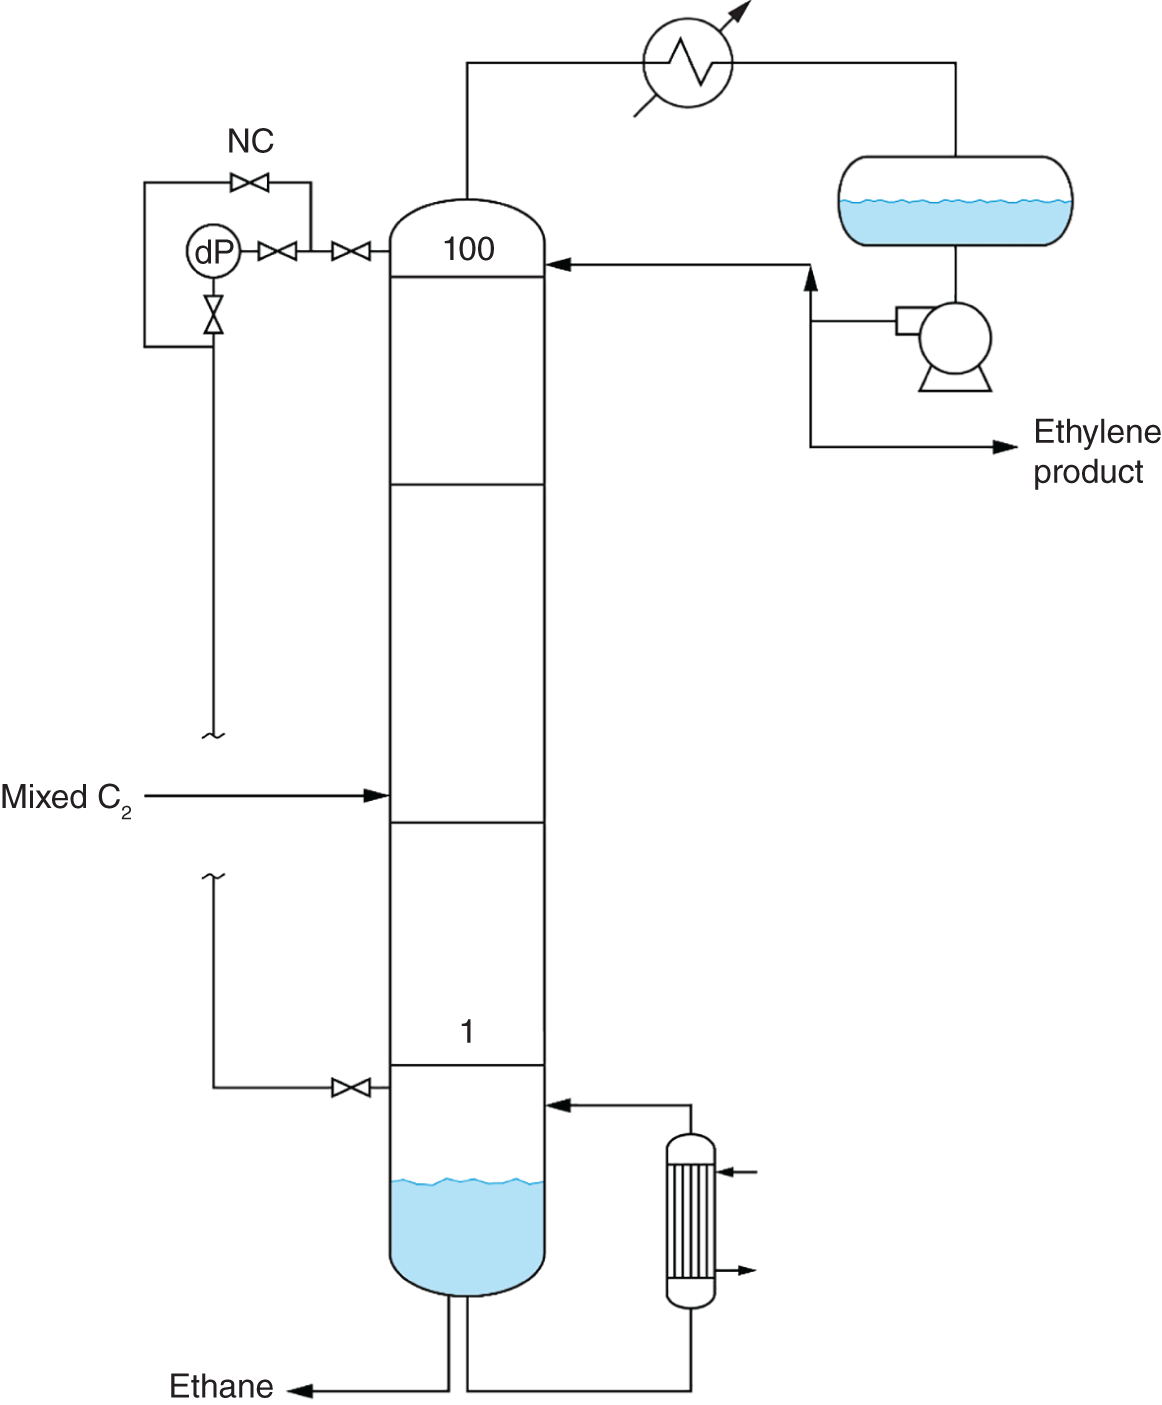
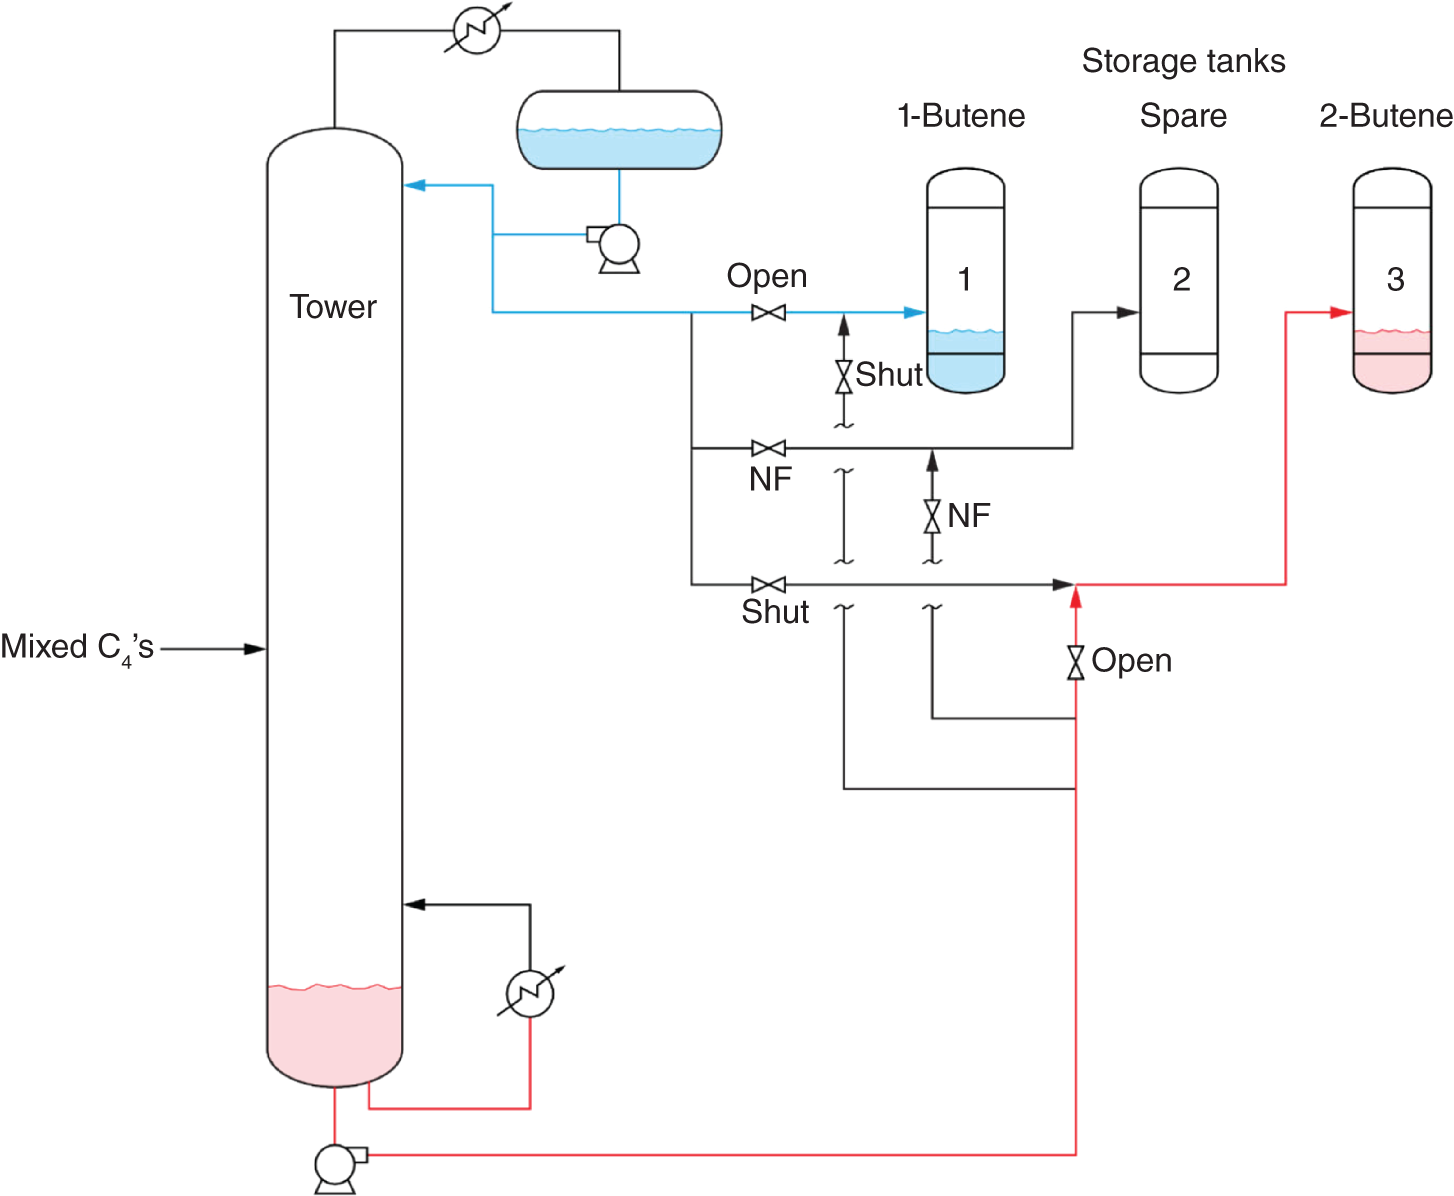
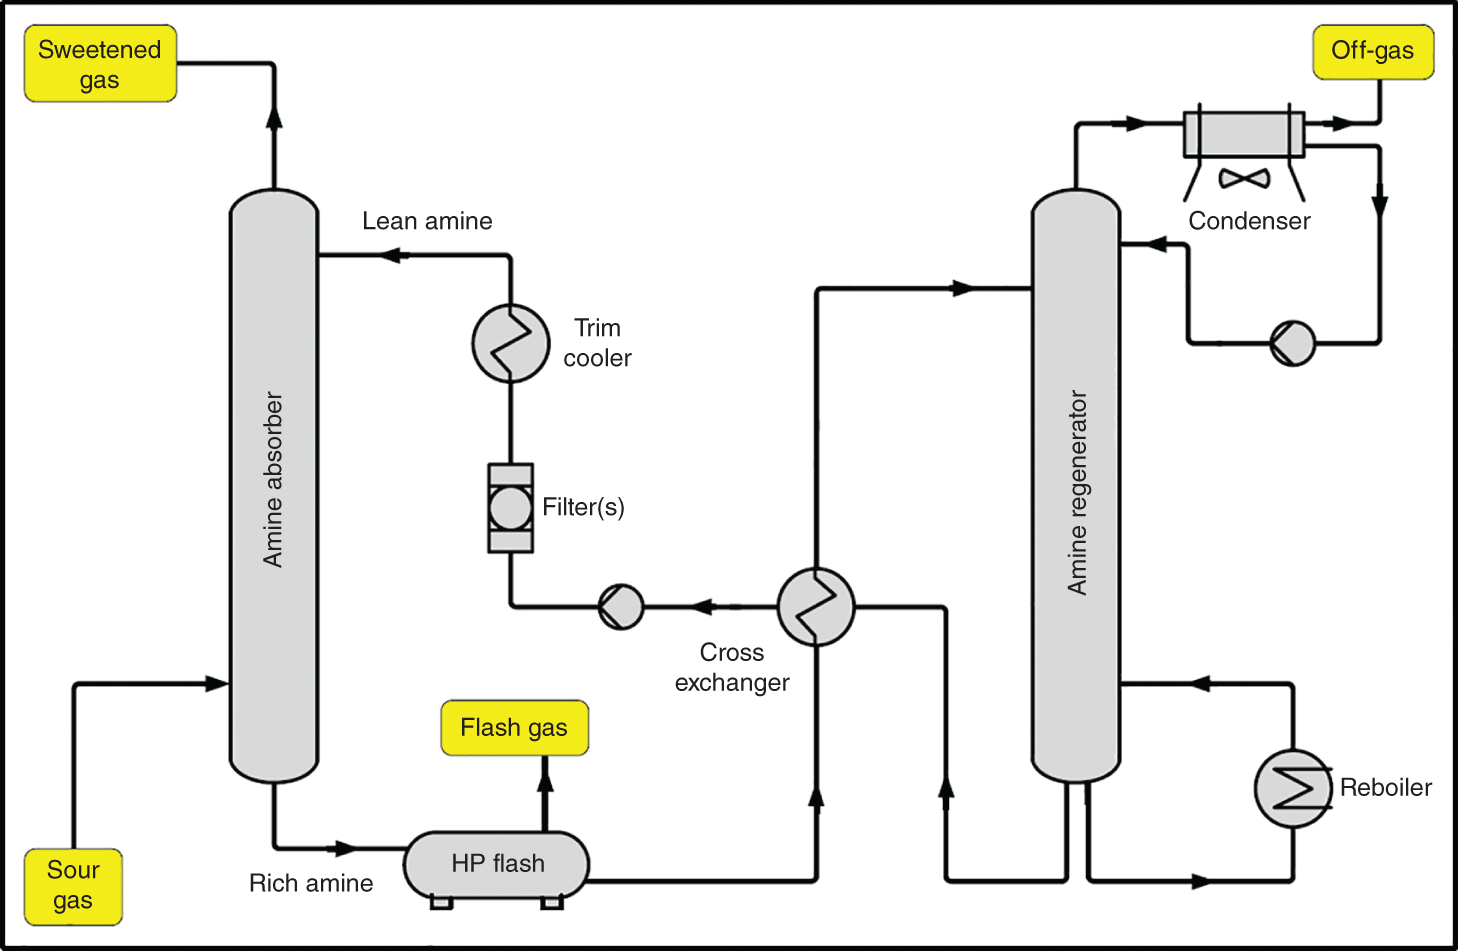
3.2.2 Troubleshoot for Tray Weeping
3.2.3 Diagnosing Side Draw Liquid Starvation

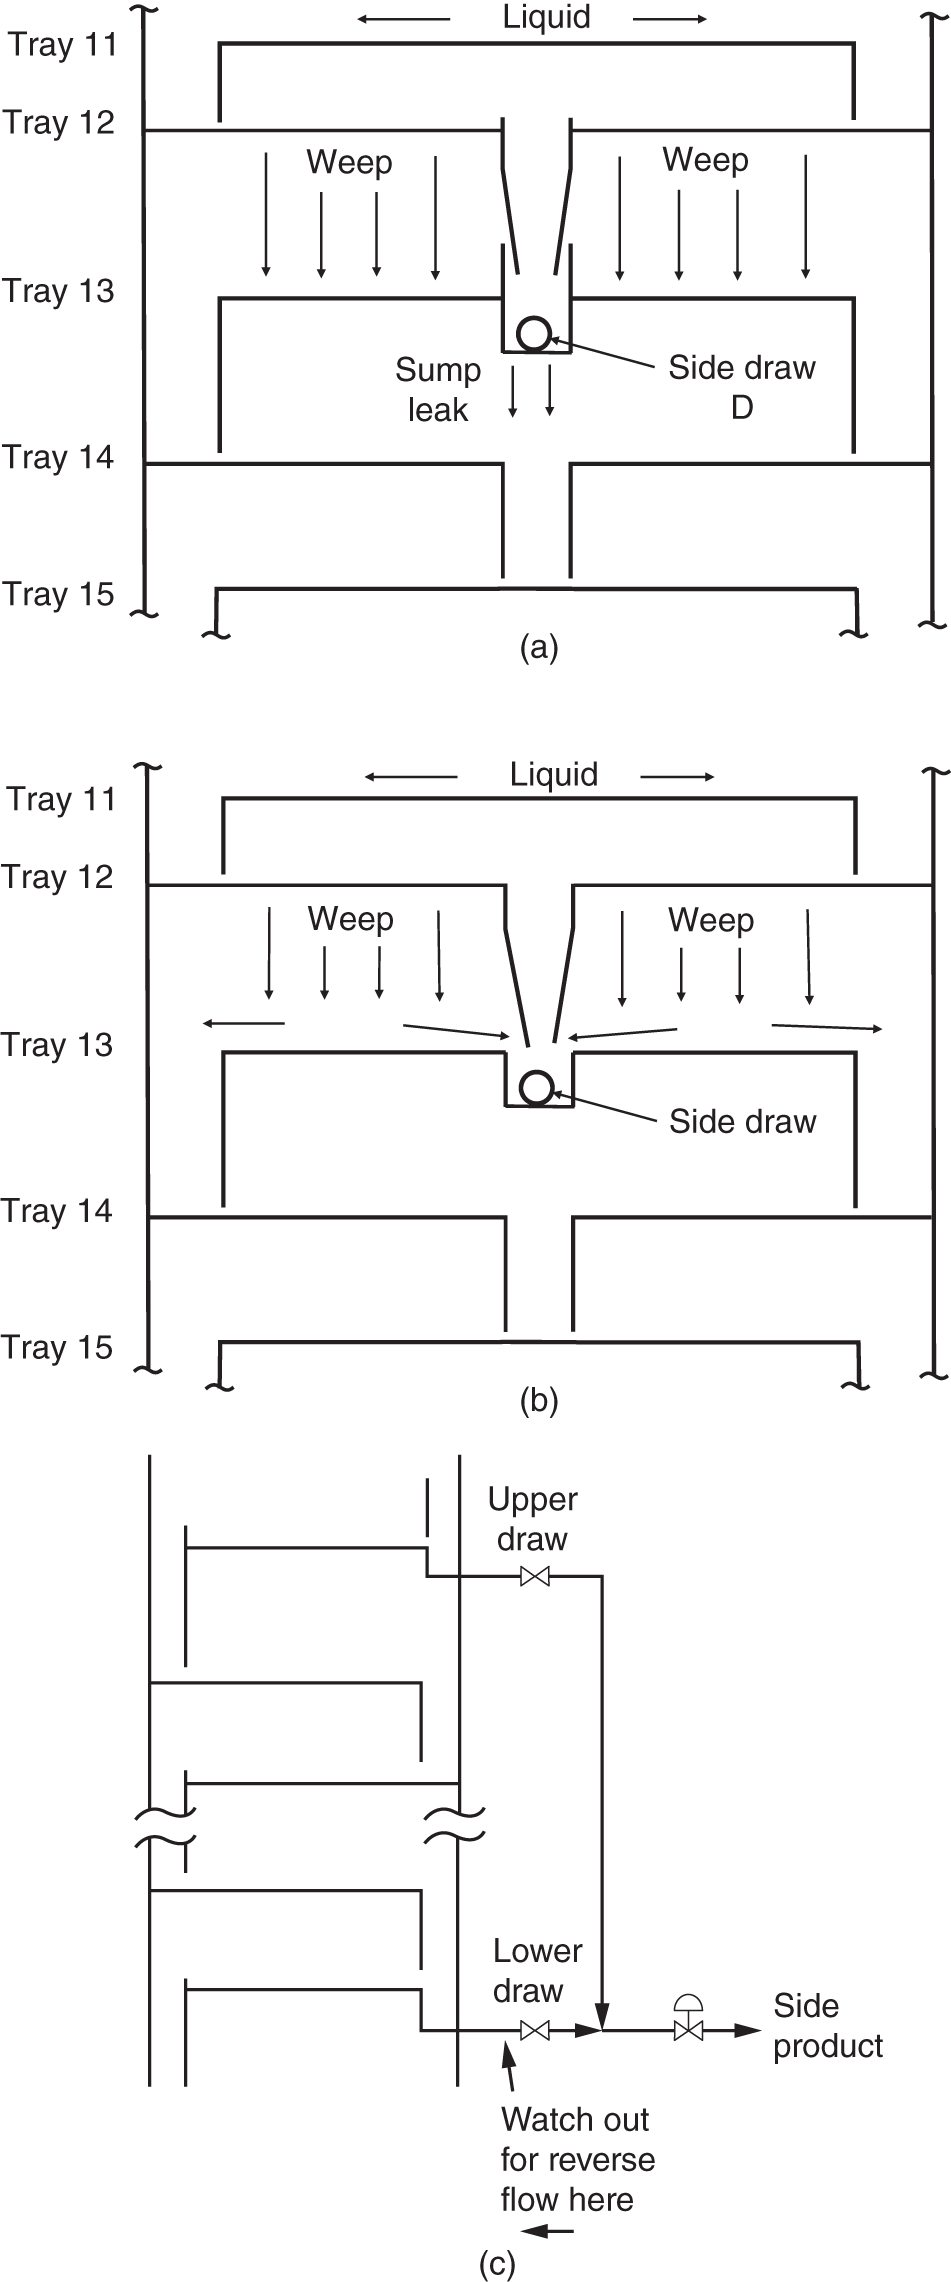
3.2.4 Diagnosing Once-Through Reboiler Liquid Starvation
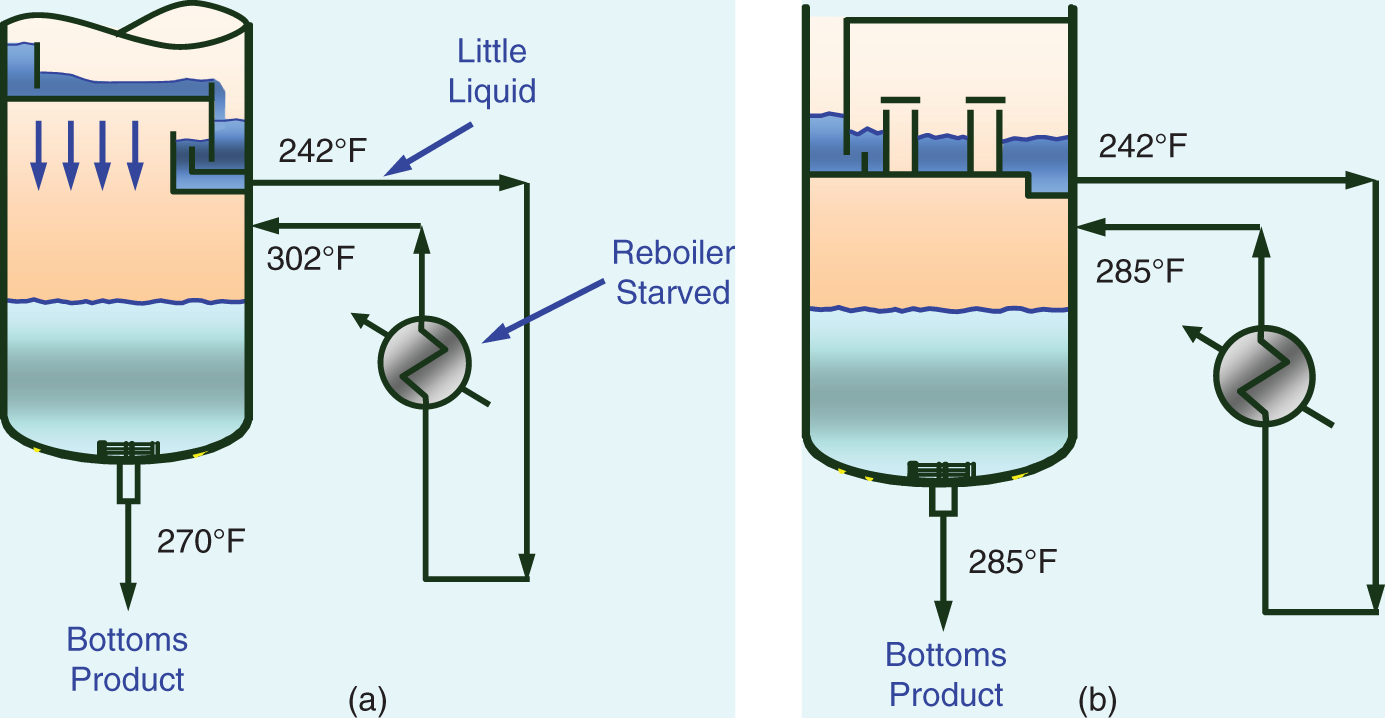
3.2.5 Troubleshoot for Liquid in Vapor Side Draws
3.2.6 Troubleshoot for Missing or Damaged Trays or Packing
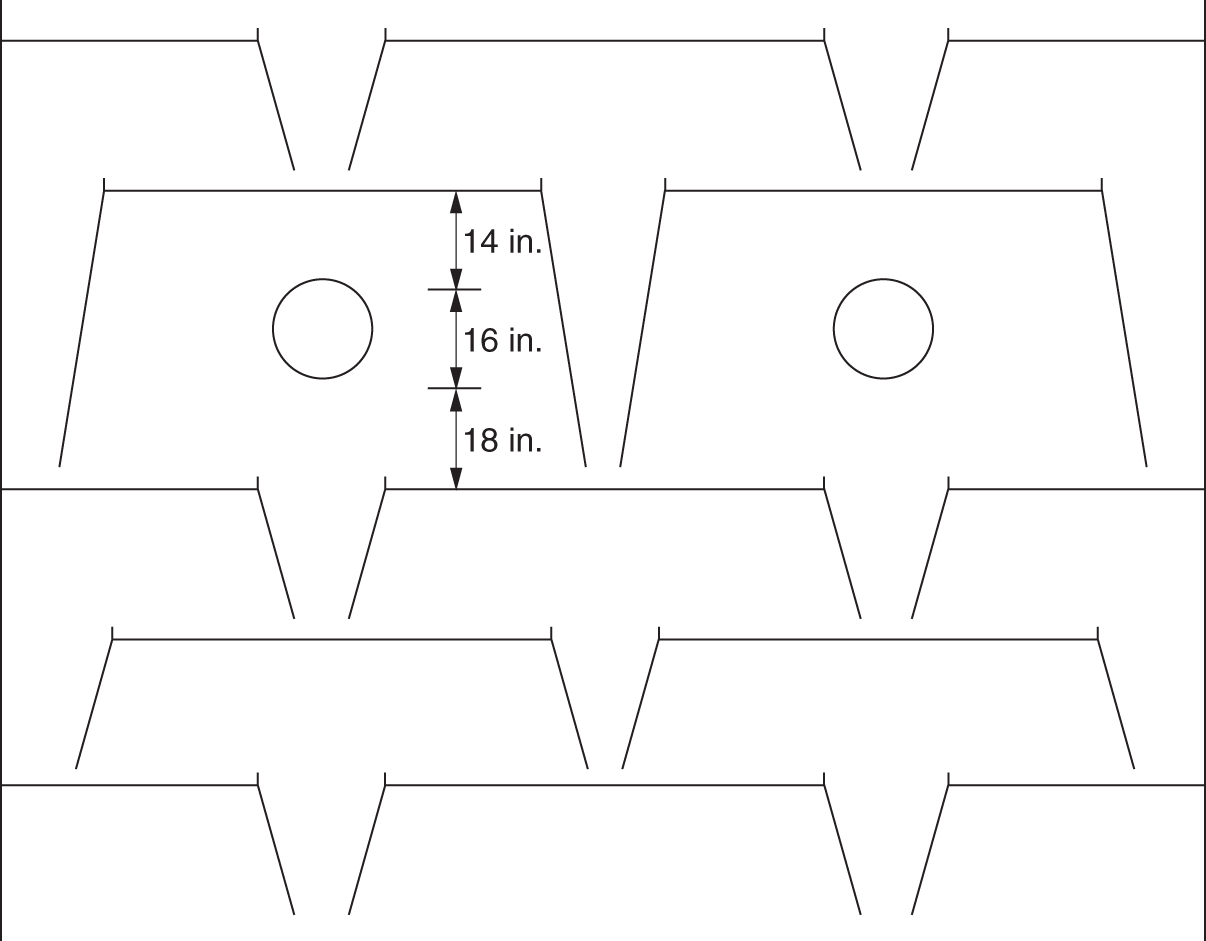
3.2.7 Poor Material Balance Control Produces High Impurities
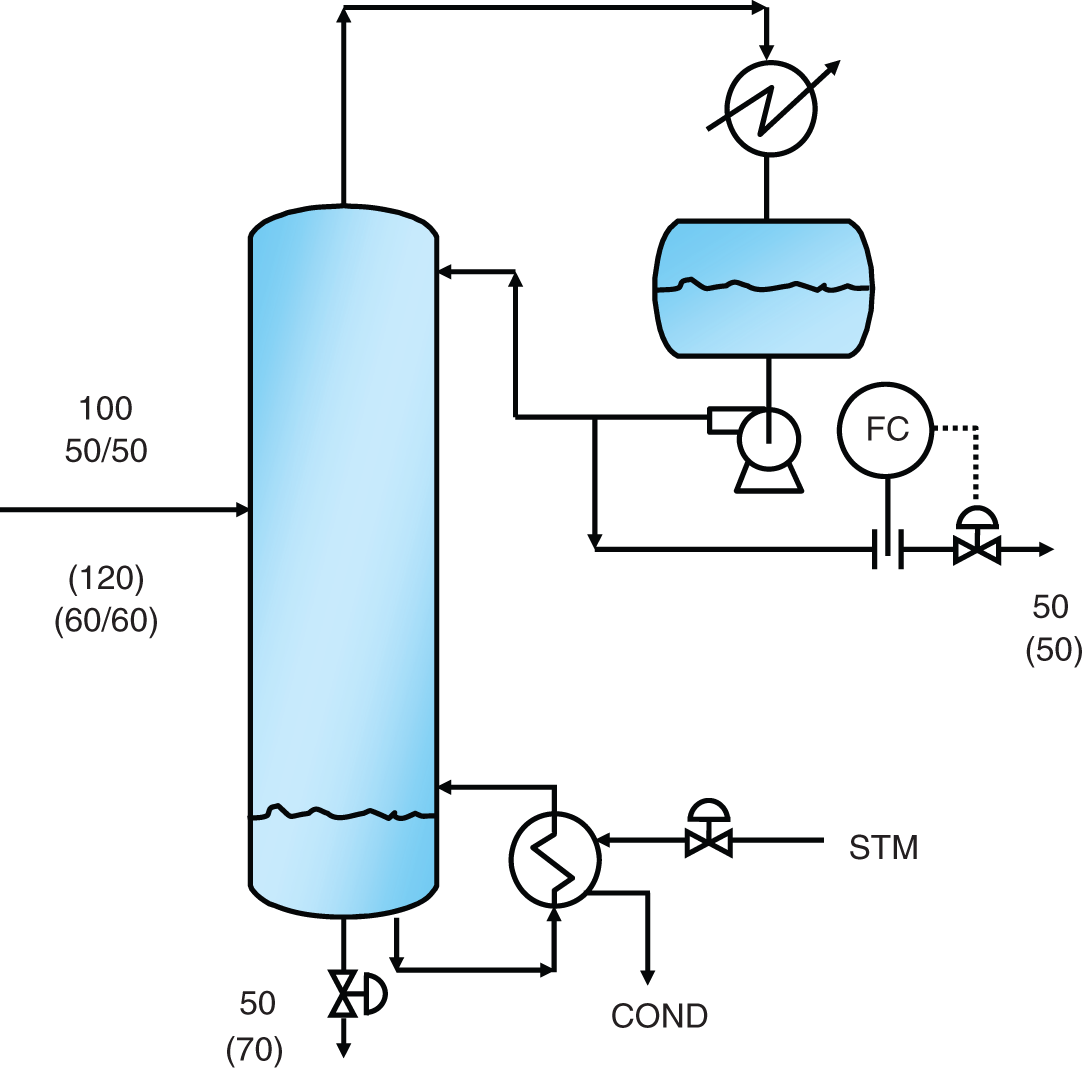
3.2.8 Limitations on Reflux or Reboil Generation
3.2.9 Control Instability Increases Impurities
3.2.10 Impurities and Contaminants Affecting Azeotroping and Product Purities
3.2.11 Absorption of Sparingly Soluble Gases Affecting Product Purity and Downstream Venting
3.2.12 Reactions and Contaminants Can Affect Product Purity
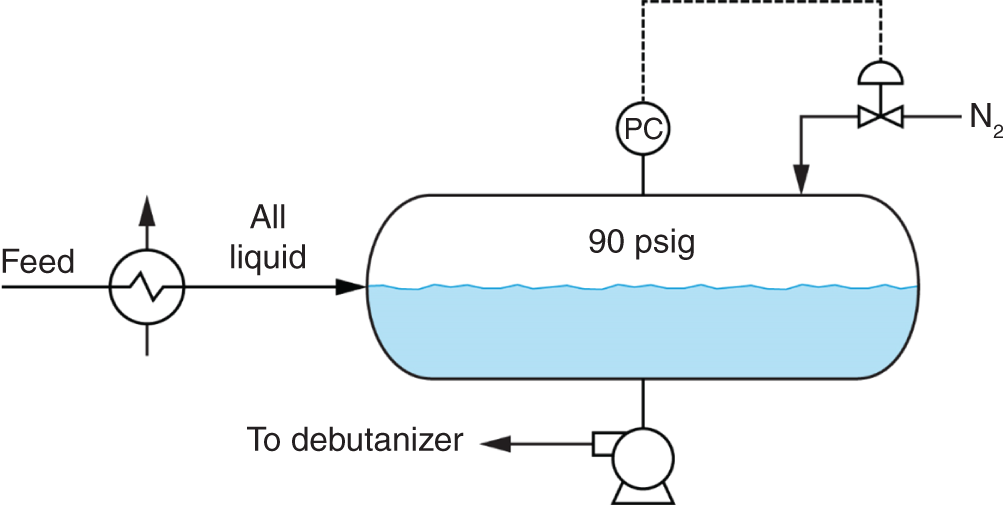
Efficiency Testing and Separation Troubleshooting
(3.1)