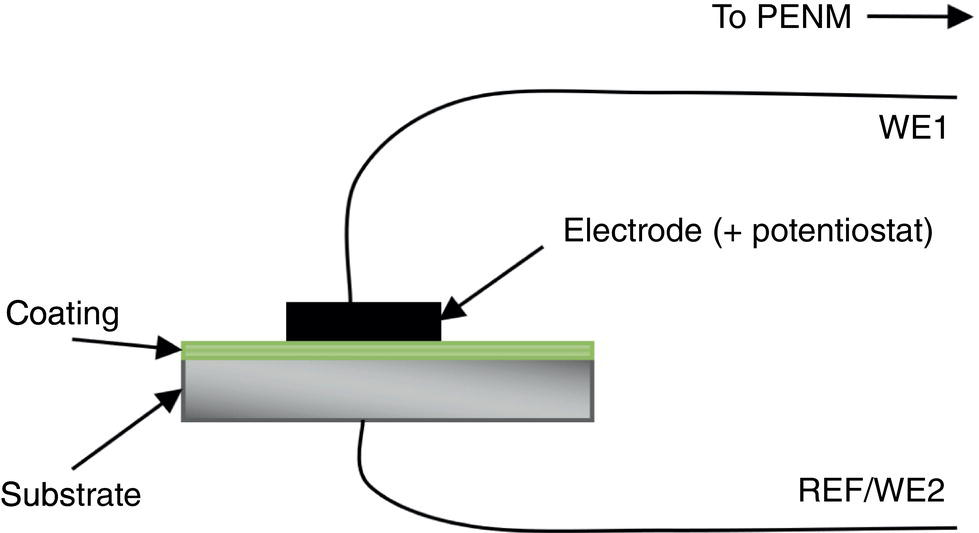
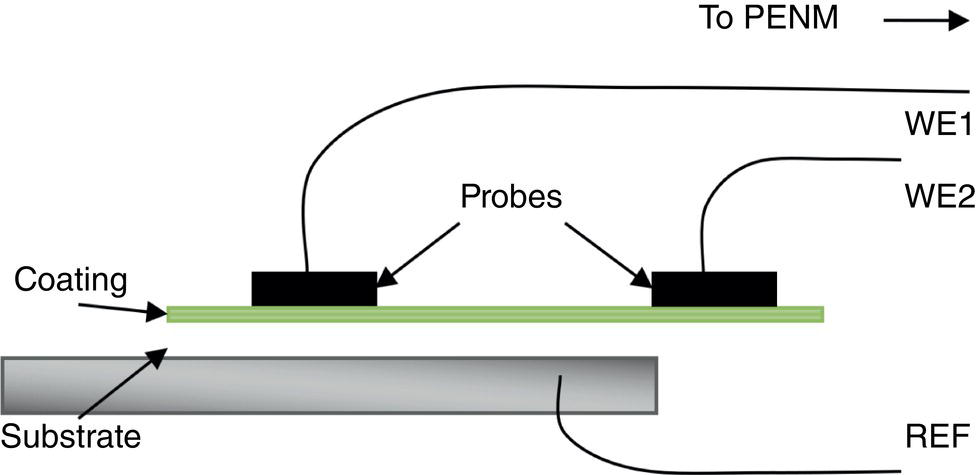
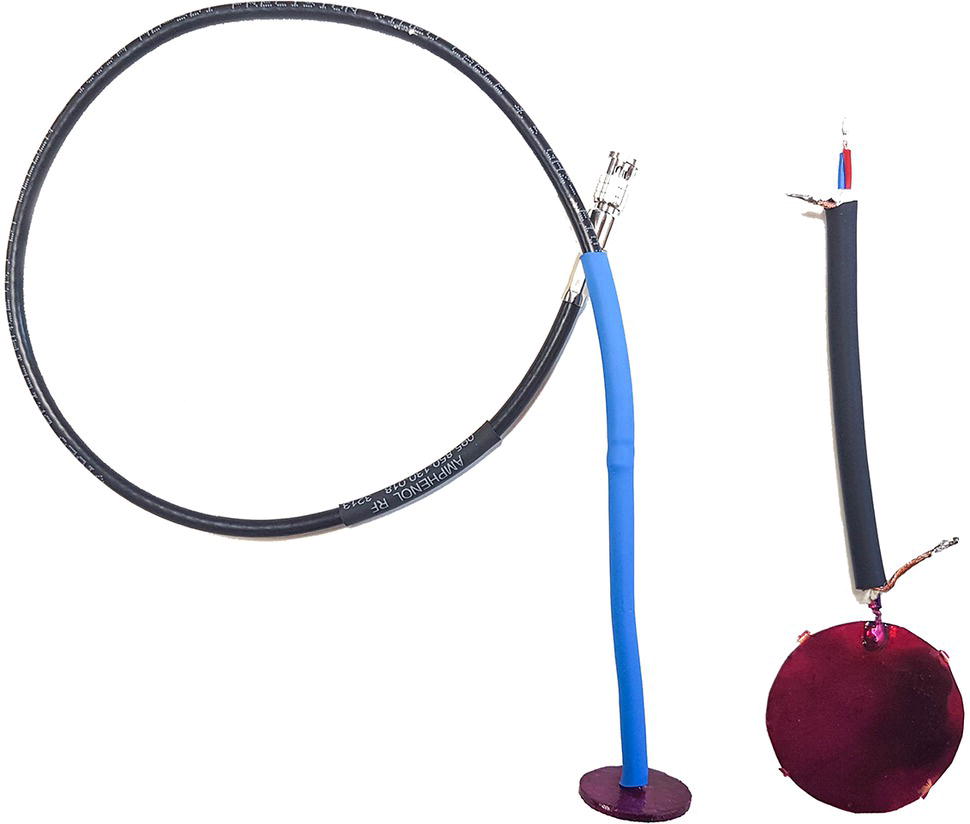
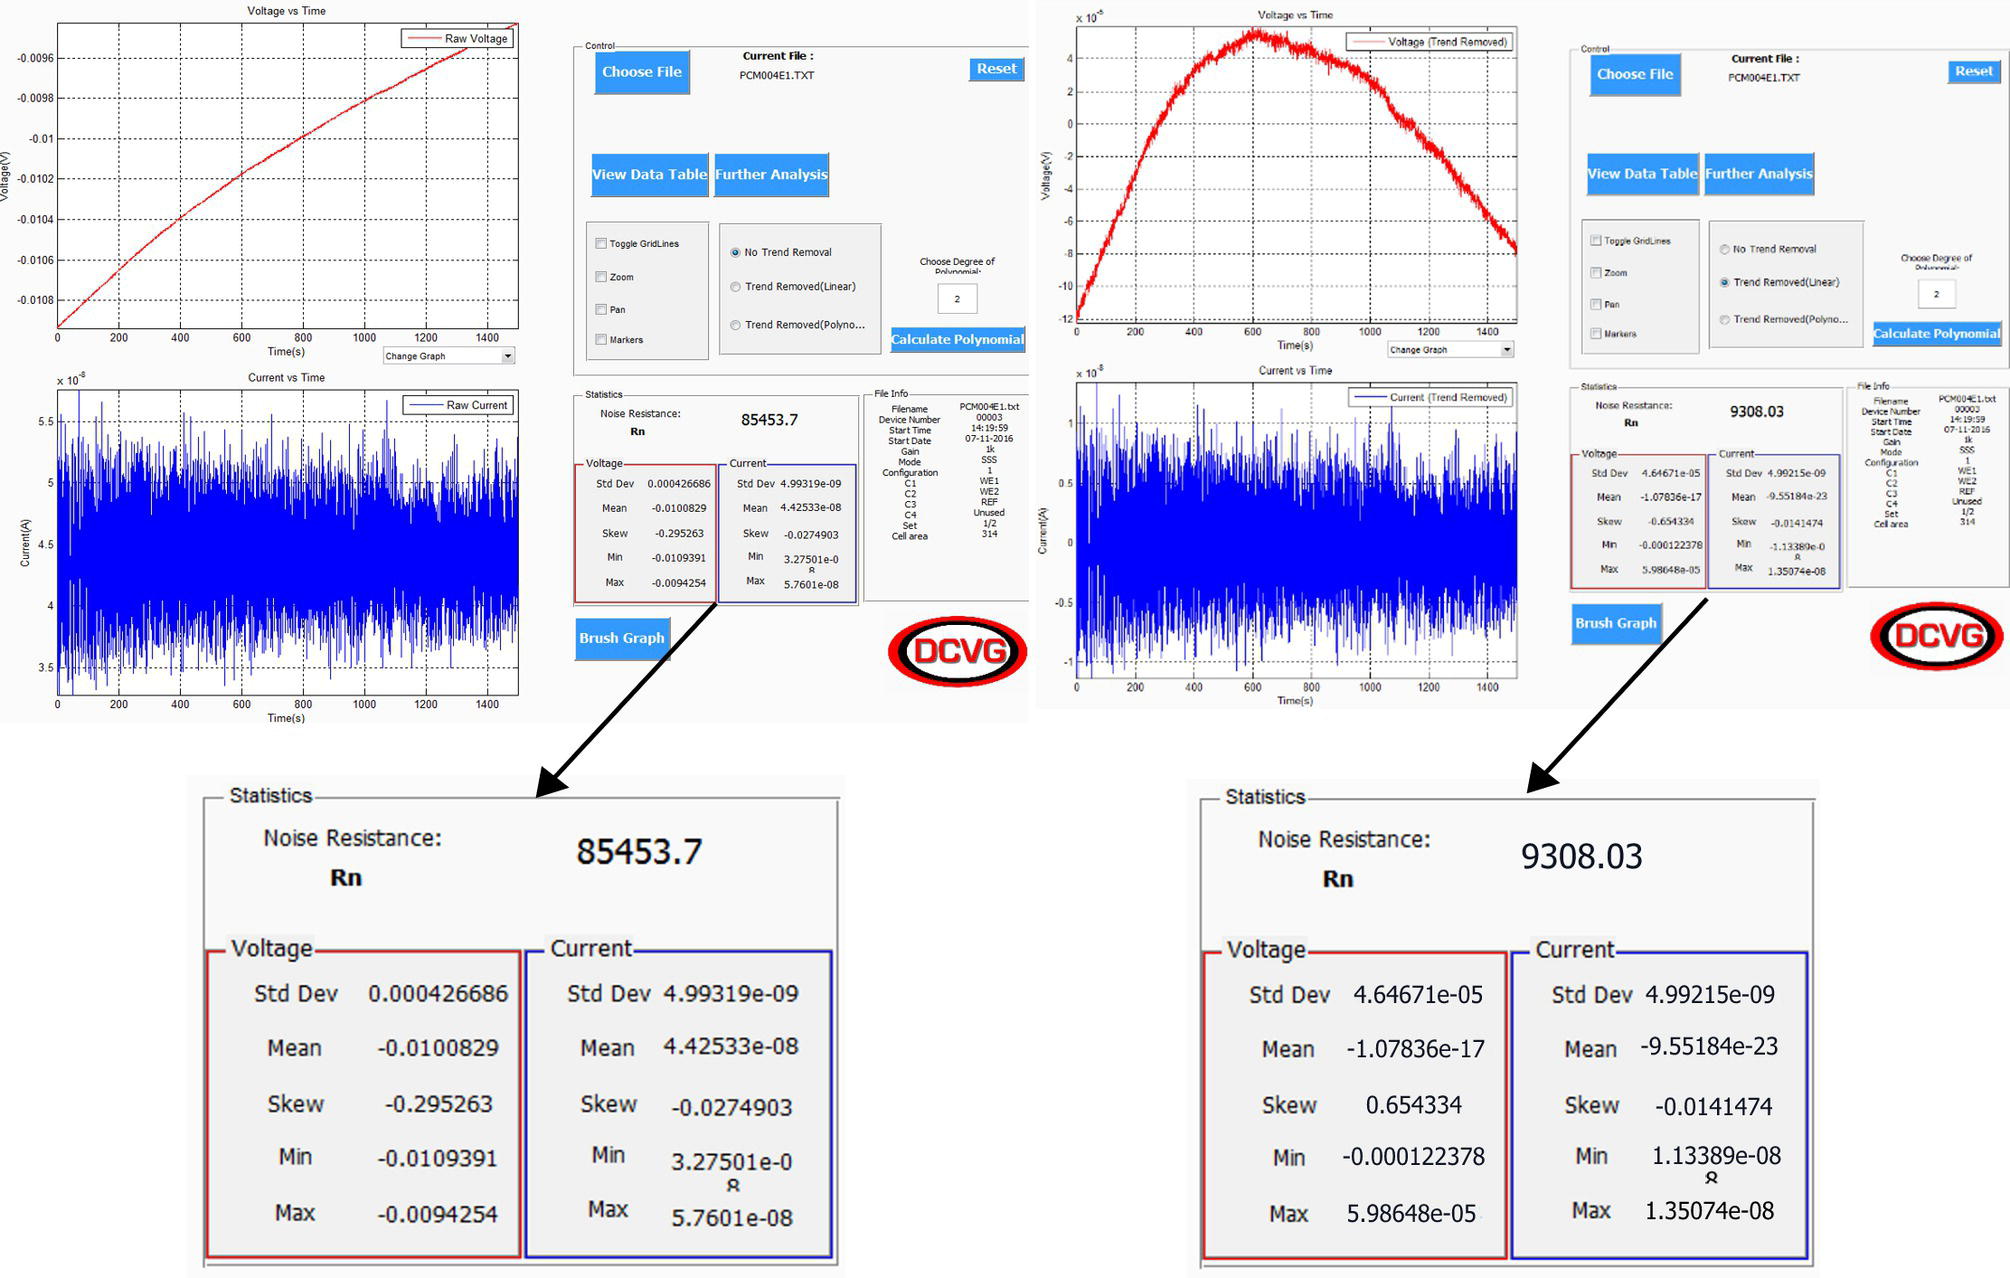
Sarah Leeds DC Voltage Gradient Technology & Supply Ltd., Wigan, UK The electrochemical noise method (ENM) has been found to be a means of monitoring nondestructively the corrosion and level of protection being provided by an organic coating on a standard coated metal, normally steel substrate. ENM has also been tested on steel and copper alloy heritage artifacts, the latter after having had thin conservation coatings applied. ENM involves measuring the very small voltage and current fluctuations that arise due to the electrochemical activities taking place within the coated system. Normally, all electrochemical noise (ECN) measurements require three electrodes. The standard method involves using two nominally identical specimens and a reference. When measurements are being conducted in a laboratory, the latter is typically a saturated calomel electrode (SCE). Measurements are then recorded into a portable monitoring device to obtain a value of resistance noise (Rn). This Rn value has been shown to be equivalent to the DC resistance, and a good correlation has been obtained between this value and the protective nature of the coating. The ENM technique is being developed to make measurements through the coating and to obtain information about the rate of corrosion underneath the coating, e.g., on a pipeline; also, pseudoreference electrodes (probes) have been developed to enable ENM to be used in the field. Coatings are the premier protection mechanism used worldwide to protect metallic structures such as pipelines, tanks, bridges, and airplanes from actively corroding. This is carried out by providing an electrical and electrochemical barrier isolating the steel structure from a corrosive environment, particularly aggressive ions, thereby stopping the natural corrosion phenomena from occurring. In doing so, the coating breaks the continuity of the electrical circuit by insulating the anode and cathode areas so corrosion cannot occur. The coating must also limit moisture uptake and prevent any further disbondment of the coating, which is typically caused by moisture penetration into the coating/steel substrate interface [1]. In oil and gas industries, metallic structures such as pipelines and tanks are further protected by using cathodic protection as a backup mechanism of protection to the coating already on the metallic substrate. Cathodic protection involves applying a current that flows from the anode groundbed through the surrounding electrolyte (soil or water) to the metallic structure surface. The principle behind cathodic protection is that if a sufficiently negative enough potential is applied and the amount of current produced is great enough, then it will overpower the current discharging from what were previously anodic sites, causing the entire surface to become cathodic and, therefore, protected. There are also metallic structures, such as sculptures, ships, historical museum artifacts, and bridges, that are protected by coatings and paints to prevent them from corroding. Industry selects certain types of metals, such as high-strength low alloy group steels, stainless steels, and aluminum, to create these metallic structures, particularly for bridges, which will often be exposed to very corrosive environments such as seawater [2]. All metallic structures, from pipelines to bridges to architectural structures to historical museum artifacts, require some sort of protective coating applied to them to prevent them from corroding. They will then need some sort of investigation to determine when to repair and what maintenance of the coating is required. Also, historical artifacts that are discovered and excavated from their resting place buried in soils or excavated from the seabed and find themselves in museums need some sort of coating to be applied to prevent further corrosion and ultimate degradation of them while under display in a museum or during storage. The coating typically has the following characteristics. It must be strippable and invisible. The coating should not impact the artifacts in any way. Typical coatings used are composed of waxes such as paraffin wax. Acrylic types of coating, such as those from the Paraloid group, have also been used [3, 4]. For pipelines and tanks, both visual and inspection surveys, such as coating surveys, including DCVG to locate problems with the coating along the metallic structures (pipelines), and potential surveys, such as close interval pipe-to-soil potential surveys, are used to determine whether the pipeline is protected or not. Both these surveys ultimately determine the areas that require repair and maintenance. Inline inspections can also be used to determine the metal loss from within a pipeline metal wall. There is a need for areas at coating faults once excavated for further information about the coating degradation. ENM is a very useful technique for determining the protective nature of the coating on the pipeline or weld joints. ENM has been found to be a very useful diagnostic tool for architectural structures, historical museum artifacts, etc. Degradation of the coated metal substrate can only be determined through visual inspection to see if any sort of rust staining, paint chalking, or flaking is occurring on the structures to indicate that recoating is required. However, usually, when this has been observed, irreversible damage has already occurred to the metal substrate. Hence there is the need for a nondestructive technique to determine the protective nature of any coated metal substrate interface. Such a technique should be able to study the electrochemical activity occurring on the metal-coated substrate interface such that it is nonintrusive, relatively quick, and easy-to-operate; the interpretation of data gathered should not be too complicated. Such a technique is ENM, which works by measuring the small fluctuations in current and voltage that occur on the metal-coated substrate interface to determine the degradation of the structure well before any detrimental damage has occurred. This, in turn, will enable the protective nature of the coating to be assessed. Around 1968, Iverson [5] introduced the first concept of ECN when he discovered that a corroding metal at EOCP generated a random burst of charge as a result of the steady state fluctuations in current and potential at a metal–solution interface. From this time onward, there have been various researchers utilizing ECN for corrosion research. Skerry and Eden [6, 7] were key investigators who, between 1986 and 1991, were the first to use the ECN method to examine organic coatings. They used the voltage and current noise between two identical coated electrodes that were immersed in an electrolyte to determine the resistance properties of coatings and low-frequency noise impedance data for the electrochemical system. ECN was a highly regarded technique whereby data could be easily obtained and analyzed, and more importantly, it did not require the samples to be polarized. The ECN technique has been varied by changing the electrode configuration in order to use the technique under field conditions. This was first seen by the development of electrochemical emission spectroscopy (EES) by Chen and Bogaerts [8], which was further advanced by Xia [9, 10]. In order to try and eliminate the need for identical working electrodes, EES used a platinum microcontroller cathode as the second electrode for the ECN measurements, as it is virtually impossible to obtain two identical working electrodes under field conditions. Mabbutt and Mills’s research resulted in the development of the single substrate (SS) and no connection to the substrate (NCS) electrode configurations, which enhanced the ECN technique from a laboratory technique to a field technique [11–13]. Cottis and Turgoose have written one of the few fundamental books about ECN and impedance detailing the technique, equipment setup, and analysis of data [14]. Cottis has been instrumental in research into the ECN technique as a means for corrosion research, enhancing its data analysis and overall understanding of the principles of ECN. He has also investigated the effect of different types of electrodes on ECN measurements and, in particular, asymmetrical electrodes [15]. A further electrode configuration, as developed by Jamali et al., is termed the single cell (SC). It required only one single working electrode with the potential and current noise data recorded in sequence instead of simultaneously, as seen in other electrode configurations. The SC was seen as an added advantage for field work as it is not as invasive as the other electrode configurations [16]. When you think of noise, you think of a sound that we hear. When we talk about noise as in ECN we are talking about the fluctuations in current and potential of an electrochemical system which are generated due to the corrosion reaction occurring on the metal substrate. Once ECN has been measured, it is then analyzed and the relevant data are assessed for the coating’s degree of protection. Figure 51.1 indicates the type of ECN signal that is obtained. Figure 51.1 Electrochemical noise signal. (Adapted from Cottis and Turgoose [14].) The ECN signal can tell us something about the corrosion processes, as detailed in Figure 51.1, whereby iron is corroding. It can detail fluctuations as corrosion film products are forming on the metal surface. As corrosion is controlled by the diffusion of oxygen to the metal surface, it will produce fluctuation with the ECN signal. ECN signals will be able to pick up the initiation of pit formation, growth, and repassivation. It will also be able to pick up localized corrosion, passive film formation, and pit corrosion as examples. Using ECN measurements, statistical treatment of the current and potential noise signals, taken with time, can thus be used to derive the noise resistance, Rn, which was obtained via statistical treatment of the noise data and can be used to predict something about the corrosion of the analyzed metal substrate. The ENM is a nondestructive technique. The ENM is based on the natural fluctuations at low frequencies (≤1 Hz) in the potential (typically in the range of μV to mV) and current (typically in the range of nA to μA) of an electrochemical cell. By measuring and analyzing these fluctuations over time, it is possible to deduce some properties of the electrochemical cell or of the coating system that it is in contact with the metal substrate. Electrochemical reactions occur on the metal-coated interface due to the penetration of water and oxygen through the coating. This can cause passivity to occur, which will slow down the corrosion processes. Likewise, corrosion can occur if the conditions are right and there is a link between the anode and cathode. The rate of this process is typically determined by the ionic resistivity of the coating. Research carried out by Pearson et al. derived the critical resistance (around 1E7 Ω) when the metal moves into the passive range [17]. The electrochemical processes generate both current and potential noise. The noise generated by both can be attenuated in the case of the current or amplified in the case of the potential, allowing the current and potential to be measured by the ECN equipment, which in turn are determined by the ionic resistance of the coating, which thereby controls more often than not the rate of the corrosion reaction [18–20]. Once the current and potential noise fluctuations have been recorded, it is possible to analyze them. A common method consists of calculating a parameter called noise resistance (Rn). The principle is to use the standard deviation of the current (σi) and the standard deviation of the voltage (σv) as the mathematical representation of the fluctuations and link them with Ohm’s law to obtain the noise resistance [21]. The noise resistance (Rn) is calculated through Ohm’s law, Equation (51.1): The noise resistance value is then used to assess the protectiveness of paint coatings. It was Bacon et al. who first found a relationship between the electrolytic resistance (Rdc) value and the protection provided by the coating to the metal substrate. They found that an Rdc value less than 106 Ω.cm2 indicates poor corrosion protection, while an Rn value greater than 108 Ω.cm2 indicates good corrosion protection, and any Rdc values between 106 and 108 Ω.cm2 indicate intermediate, fair level of corrosion protection [22]. Other work has shown that Rn is very similar to this Rdc value and is also very similar to the 0.1 Hz electrochemical impedance spectroscopy (EIS) value [23]. Furthermore, work by Skerry and Eden showed that ENM could measure high- and low-resistance coatings, which could be adapted to measure delamination and disbondment of coatings [24, 25]. See Table 51.1 for the full ECN criteria based on the work by Bacon et al. [22]. ENM’s ability to measure very small changes at the coated metal substrate interface makes it a suitable technique to monitor changes in the coating and cathodic protection applied to the metallic substrate. Although used at present for systems at their natural voltage, with further research, it should be possible to use ENM to monitor the protectiveness of the coating on pipelines that have active Cathodic Protection. Table 51.1 ECN Criteria Source: Adapted from Bacon et al. [22]. The ECN technique, as applied to bare metal specimens, has been well documented and further information can be obtained from ASTM G199-09(2014) [26] and ISO 17093-2015 [27]. The Appendix of the ISO standard describes ECN application for the assessment of paint coatings. In its simplest form, to be able to monitor ECN of a coated metal substrate requires the current fluctuations to be measured between two as close as possible identical electrodes (probes) using a zero-resistance ammeter and the voltage fluctuations to be measured with respect to a reference electrode. Both measurements are recorded with time using a data logger. The standard method used for ENM, most often referred to as the salt bridge method, utilizes two electrodes (i.e., two pieces of metal or two pieces of coated metal) that are electrically isolated within the noise box. Then, the third electrode is a normal standard reference electrode like an SCE, which is inserted in the electrolyte (i.e., 3% sodium chloride) that is in contact with both coated or uncoated samples. A salt bridge is used for connection between the two. Noise current and voltage measurements are recorded simultaneously over a set time, typically taken every half second over a time frame of 150 s and stored in a data logger connected to a computer (Figure 51.2). A second set of data is recorded after a 10-min pause. Noise data with the least drift are utilized to determine the Rn value. Standard deviations can be calculated for both current and voltage noise data, which are used to calculate the Rn utilizing Ohm’s law, as seen in Equation (51.1) [15–18]. Figure 51.2 Standard salt bridge ENM arrangement. (With permission of Dr. Sarah Leeds, © DC Voltage Gradient Technology & Supply Ltd.) The standard salt bridge ENM technique is not so applicable for industrial (field) measurements due to its requirement for separate working electrodes, i.e., finding two coated metal substrates that are electrically isolated is very difficult. Also, the electrodes should be identical as well which is not always possible (see Figure 51.2). The need to produce ENM that could work out in the field led Mabbutt and Mills [11–13] to propose a new configuration of the electrodes, which was termed single substrate (SS) or standard single substrate (SSS) (see Figure 51.3). The metal substrate is one complete unit with, in the laboratory, two cells stuck on to the coating. The cells are then filled with the electrolyte (3% sodium chloride) [19]. The metal substrate is then attached as the reference electrode, which replaces the salt bridge. Then, two standard electrodes, such as SCE, are placed into the two cells, which will act as the working electrodes (WE1 and WE2) (Figure 51.3) [20, 21]. The SSS configuration is the one that was utilized in the initial studies in the development of a portable ENM (PENM) device, and this was subsequently used to test museum artifacts and standard metal samples, which are presented later in this chapter [28, 29]. Figure 51.3 Single substrate (SS) or standard single substrate (SSS) ENM arrangement. (With permission of Dr. Sarah Leeds, © DC Voltage Gradient Technology & Supply Ltd.) Figure 51.4 No connection to the substrate (NCS) configuration. (With permission of Dr. Sarah Leeds, © DC Voltage Gradient Technology & Supply Ltd.) There are two further different electrode configurations that have been developed and are dependent on the placement of the electrodes, NCS or BNCS and SC. The NCS or BNCS, which was based on the research carried out by Mabbat and Mills [5, 12, 15] and further research by Jurak, Jamali, and Zhao [30], which involved three electrodes placed side by side in contact with the coating only. Two of the electrodes are used as working electrodes, and the last electrode is the reference (see Figure 51.4). The last configuration of the electrodes required only one electrode in contact with the coating. A second connection was made by direct contact with the metal substrate and was used for both the current and the voltage measurement. Those measurements are performed one after the other instead of simultaneously. This configuration requires the addition of an external potentiostat when measuring the current. This configuration is named single cell (SC) (Figure 51.5). The SC configuration was developed by Jamali et al., in addition to the asymmetrical working electrodes and the SS and NCS techniques [17] (see Figure 51.5). Figure 51.5 Single cell (SC) configuration. (With permission of Dr. Sarah Leeds, © DC Voltage Gradient Technology & Supply Ltd.) There was a need for the development of a PENM monitoring device that could be used outside of a laboratory environment. In the past, ENM measurement devices were quite bulky and cumbersome and generally required manual switching between the different connections of probes to carry out current noise and voltage noise measurements. Also, existing devices tended to be placed in large Faraday cages to shield out any extraneous background noise. Usually, there is only one electrode configuration used in any one ENM measurement device. This new ENM measurement device should be able to perform each different ENM configuration automatically when selected. A sophisticated analysis system not found in existing ENM devices was sought to include a unique brushing system that removes trends from the data for further analysis of more accurate Rn values. The portable electrochemical noise measuring device was researched and developed [29]. For the PENM device to measure good quality data from a coated metal substrate, there is the need to address the following factors: removal of adventitious external noise, minimizing internal noise such as from components and the electrical circuit and the electrodes themselves, which can produce noise which could interfere with the accuracy of the measurement. To ensure that these did not interfere with the ENM measurement, the PENM device was designed to take these into consideration through shielding and design of the electronics [31]. In using ENM to assess coatings, it is particularly important that the electrodes used should have very low voltage noise themselves (less than 30 μV) and all have the correct voltage, which should be within a few mV of each other. There should also be no excessive drift during the test (some amount of drift can usually be dealt with through trend removal). A voltage stability test [32] is used to check the quality of an electrode. The three different electrode configurations for ENM measurements were included in the PENM device, which was designed to have five modes dependent upon electrode configuration, and switching of the electrodes was carried out automatically dependent on the mode selected. Then, the current noise and voltage noise are measured to calculate the Rn value. [33, 34] Although the PENM device does have multiple configurations (five modes), to gather the data from the coated metal substrate, just one configuration was used on various samples, including the steel panel data described later on in this chapter. That was Mode one and is called the SSS [32]. Figure 51.6 Single substrate (SS) configuration. (With permission of Dr. Sarah Leeds, © DC Voltage Gradient Technology & Supply Ltd.) This SSS configuration places the two probes side by side, in contact with the coating only, and the reference is connected to the metal substrate (no probe is needed for this connection) (Figure 51.6). One of the most important aspects of recording ENM is that the noise values being recorded are due to the noise pick up directly related to electrochemical changes occurring on the interfacial coated metal substrate surface and not any erroneous noise pick up from the environment or from the equipment itself. Typically, in a laboratory environment SCEs are utilized. These are genuine reference electrodes and are very low noise. However, these types of electrodes can only be used by immersion into a very specific liquid which makes them unsuitable for use in industry field applications which requires the electrodes to be held directly against the coated metal substrate. Initial construction of the pseudoreference electrodes utilized activated silver/silver chloride (Ag/AgCl) discs or copper/copper sulfate (Cu/CuSO4) discs blanked off with lacomit on the sides and back to ensure that these areas did not influence the measurement. The connection was made via heavily shielded cables to ensure no extraneous noise pick up. Filter paper was also applied to the front of the electrode in contact with the sample, which was wet with electrolyte typically 3% sodium chloride solution. This is used to ensure electrolytic contact with the sample. Figure 51.7 details the Ag/AgCl electrode (left-hand side) and the Cu/CUSO4 electrode (right-hand side). Figure 51.7 Ag/AgCl (left) and Cu/CuSO4 (right) reference (electrode) probes. (With permission of Dr. Sarah Leeds, © DC Voltage Gradient Technology & Supply Ltd.) A voltage stability test was carried out on the original Ag/AgCl and Cu/CuSO4 electrodes to determine if they were of good quality. Figure 51.8 details the sort of data that should be obtained showing electrodes are of good quality. The initial electrodes constructed were not robust enough and rigid enough for industrial application, so more research was carried out to design more robust electrodes that were more flexible and could be easily attached to metal substrates like tanks and pipelines. Figure 51.9 details the more robust electrode design with a shielding up the full length of the electrode, water tight and could be used multiple times. The Cu/CuSO4 electrode can be seen on the left-hand side, and the Ag/AgCl electrode on the right-hand side. Voltage stability tests were carried out on the redesigned Ag/AgCl and CuCuSO4 electrodes to determine if they were of good quality. Figure 51.10 details the sort of data that should be obtained showing electrodes are of very good quality. When starting an ENM the PEMN device records two sets of 512 simultaneous current and voltage measurements, one every 0.5 s. Each set is then saved in a single file inside the PENM memory. Figure 51.8 Voltage stability test for an Ag/AgCl electrode with trend still included in data on left graph and trend removed in right graph. (With permission of Dr. Sarah Leeds, © DC Voltage Gradient Technology & Supply Ltd.) Figure 51.9 Updated Ag/AgCl (left) and Cu/CuSO4 (right) reference (electrode) probe design to improve robustness. (With permission of Dr. Sarah Leeds, © DC Voltage Gradient Technology & Supply Ltd.) There is a pause of 30 s at the beginning (settling step) and between each two sets. The PENM device with the newly designed electrodes was tested on a standard coated steel sheet. A trend was applied to increase the accuracy of the Rn. Figure 51.11 details the current and potential noise graphs and the statistics obtained for the two sets recorded. A linear trend removal was applied to the samples to increase the accuracy of the Rn value. The Rn was found to be 3.197 × 10⁹ Ω-cm2 for the first test and 5.029 × 10⁹ Ω-cm2 for the second one. This showed that the steel plate tested had a good protective coating on it. A high resistance coating like this provides a bigger challenge to obtain accurate noise measurements, so it was reassuring to see “good graphs” and good agreement between the two tests. Results were also obtained (not given here) using SSS mode on lower resistance coatings with the same good reproducibility between repeated runs. The PENM results agreed with other standard noise measuring equipment and with EIS and DC resistance results. Further testing was carried out in order to test the ECN technique utilizing the PENM on two coated metal substrates; one with a good coating and other with a poor coating. The results are given in the following paragraphs. Figure 51.10 Voltage stability test for an Ag/AgCl electrode with trend included in data in top graphs and trend removed in bottom graphs. (With permission of Dr. Sarah Leeds, © DC Voltage Gradient Technology & Supply Ltd.) Figure 51.11 ENM carried out on a steel-coated sheet using the PENM in SSS. (With permission of Dr. Sarah Leeds, © DC Voltage Gradient Technology & Supply Ltd.) A test was carried out to determine how effective the PENM device was at making an ECN measurement on a good coating system on a normal steel panel, a standard metal sample with a vinyl coating applied to it. The three circles, labeled 1, 2, and 3, signify the areas that the probes were attached to, to make an ECN measurement. The coating resistance of the three areas was 3–5 × 10⁷ Ω.cm2 (see Figure 51.12). As detailed in Table 51.2, the results concluded that the metal sample with the good coating did produce an Rn value in the range of 107–108 Ω.cm2 signifying that the coating system was a good coating system. Figure 51.12 Standard metal sample with three areas identified for an ENM—good coating. (With permission of Dr. Sarah Leeds, © DC Voltage Gradient Technology & Supply Ltd.) A test was carried out to determine how effective the PENM device was at making an ECN measurement on a poor coating system on a normal steel panel. A standard metal sample with an alkyd coating applied to it. The three circles, labeled 1, 2, and 3, signify the areas that the probes were attached to, to make an ECN measurement. The coating resistance of the three areas was 1 × 10⁵ to 1 × 10⁶ Ω.cm2 (see Figure 51.13). As detailed in Table 51.3, the results concluded that the metal sample with the poor coating did produce an Rn value in the range of 105 Ω.cm2 or less, signifying that the coating system was poor. ENM measurements were recorded for four samples to determine the Rn value for each sample using the PENM and software. The objective was to determine if the coating system was still protective? See Figure 51.14 for the four different samples. See Figure 51.15 and Table 51.4 for the results of the ECN measurements on the four samples. The results detailed the current and voltage noise graphs and then the Rn values calculated from these. The Rn values are circled. It can be seen that Sample 1 was an excellent coating quality; Sample 2 was a very good coating quality; Sample 3 was a fair coating quality; and Sample 4 was a very poor coating quality. Carrying out an ENM using the PENM, it is possible to grade the coating quality of the coating system and issue a repair schedule as detailed in Table 51.4. Table 51.2 Results of the ENM Carried Out on a Standard Metal Sample with a Good Coating Figure 51.13 Standard metal sample with three areas identified for an ENM—poor coating. (With permission of Dr. Sarah Leeds, © DC Voltage Gradient Technology & Supply Ltd. A PENM device could be very useful for industrial environments to make ECN measurements. It is, however, dependent on making sure that the device or electrodes do not pick up any external or internal noise, which was achieved through component selection and circuit board design along with shielding of all devices and cables. The pseudoreference probe (electrodes) should exhibit minimum drift, be robust, and repeatable for measuring good-quality data. PENM was tested on steel sheets and museum artifacts, and from these tests, information could be obtained about the protective nature of the coating. It was determined that using a PENM device was a quick and easy way to determine how protective the coating was and this eliminated any need for any intrusive detrimental methods for determining so. Overall, the SSS configuration has been the most widely used electrode configuration for carrying out ECN measurements. This configuration can be limiting for industrial application because it requires two identical electrodes to be attached to the coated metal substrate, and it is assumed that the two areas that are being measured are identical. This may not always be the case. The SC configuration gets around this by getting information from only one area. Also there needs to be further investigation into the NCS or BNCS electrode configurations as this does not require connection to the coated metal substrate. The latter may be difficult to achieve without temporarily removing some of the coating. Research has also confirmed that that the Rn value is a good indication of the degree of protection that the coating affords to its metal substrate. The ENM method has been successfully applied to assessing the coating for museum applications. Utilizing the PENM device, differing levels of protection could be determined for the museum artifacts based on the Rn value. This means that the PENM could predict when the preservation coating needs replacing. The research carried out has further proved that ENM is a good method that can determine the corrosion and protection of a coated substrate. Table 51.3 Results of the ENM Carried Out on a Standard Metal Sample with a Poor Coating Figure 51.14 Four different samples were assessed by ENM using the PENM. (With permission of Dr. Michael Foong of Oil and Gas Management (M) Sdn Bhd.) More work has to be carried out to produce a probe that can be used for pipeline environments when the pipeline is buried. This would require a probe that could sense through the soil down to the coated metal substrate. At present, the PENM has an SC mode which could be used to detect corrosion under insulation as this would require only one area from which data are gathered. Utilizing this mode would eliminate any uncertainty that occurs when multiple electrodes are used. This means that disbonded coatings could be assessed using this dedicated PENM instrument out on site. Figure 51.15 Details of the Rn values after data processing of the four samples using PENM software. (With permission of DC Voltage Gradient Technology & Supply Ltd.) Table 51.4 Coating Quality check by ENM Using the PENM The next applications are those that seem feasibly possible using the ECN method being carried out with a PENM device: Thanks are given for the ongoing support and communication provided by Prof Douglas Mills and Dr Sina Jamali for their outstanding contribution to the field of ECN. Also, thanks to Dr Michael Foong and Eric Ang of Oil and Gas Management (M) Sdn Bhd for the use of photographs in Figure 51.14.
51
Electrochemical Noise to Monitor Corrosion of a Coated Metal
51.1 Introduction
51.1.1 Protective Coatings
51.1.2 History of Electrochemical Noise
51.1.3 What is Electrochemical Noise?
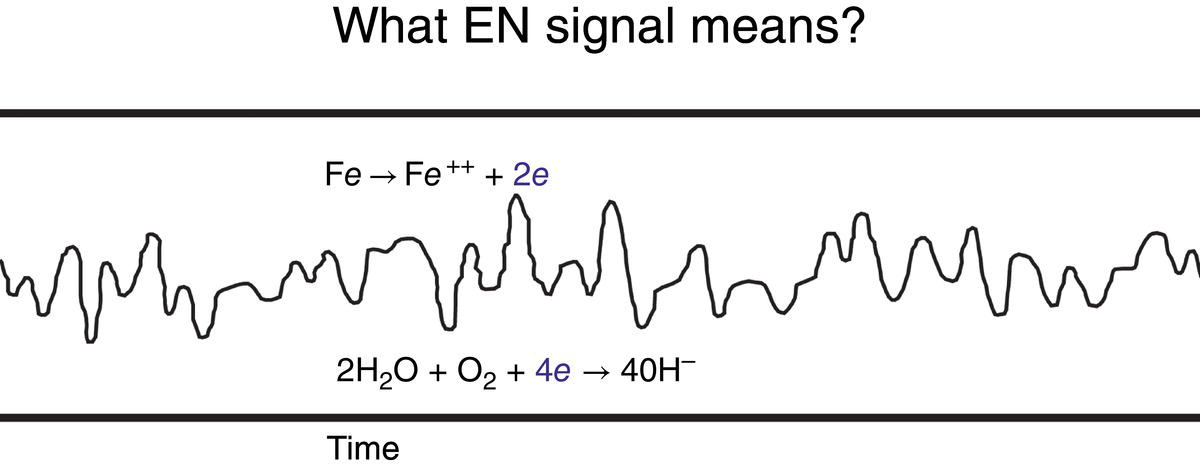
51.1.3.1 What does the Electrochemical Noise Signal Mean?
51.2 Electrochemical Noise Method
Noise Resistance Value (Ω.cm2)
Protection of Coating System
>109
Excellent
108–109
Very good
107–108
Good
106–107
Fair
3 × 10⁵–106
Borderline to poor
105–3 × 10⁵
Poor
<105
Very poor
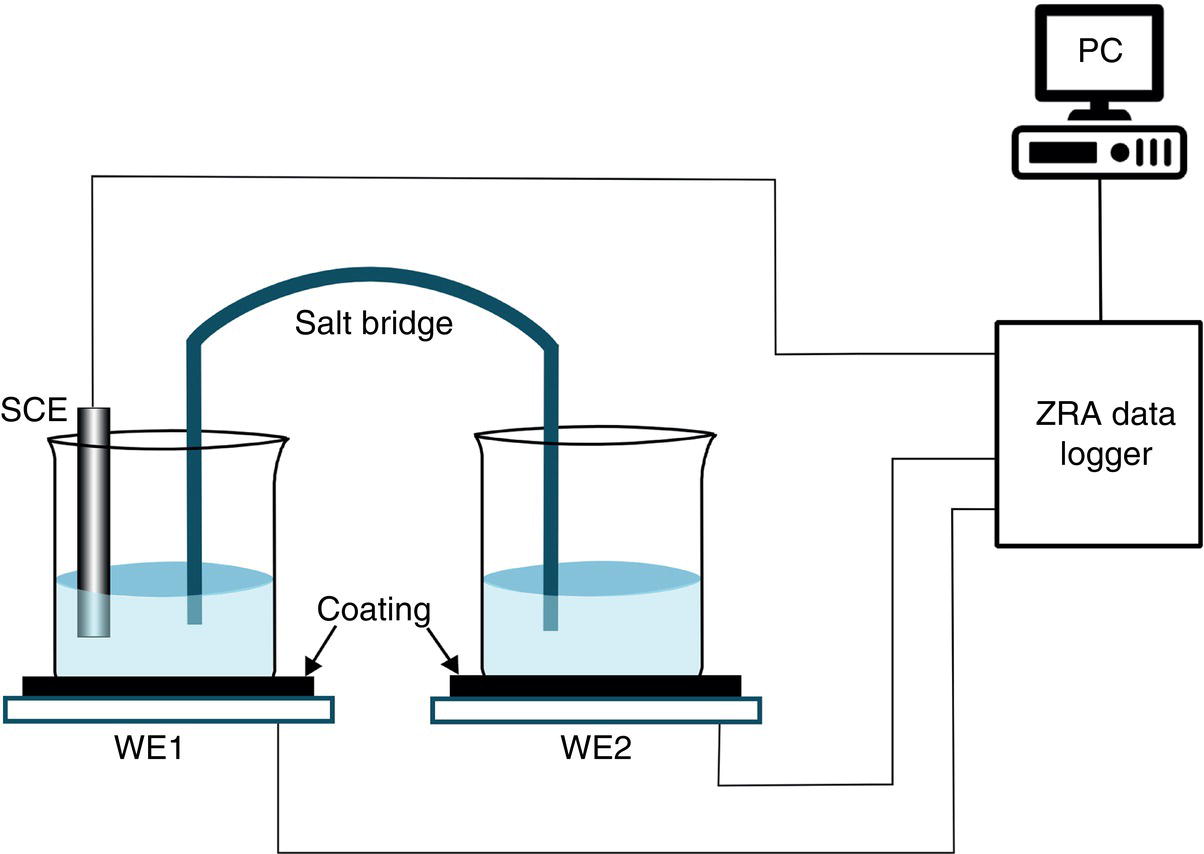
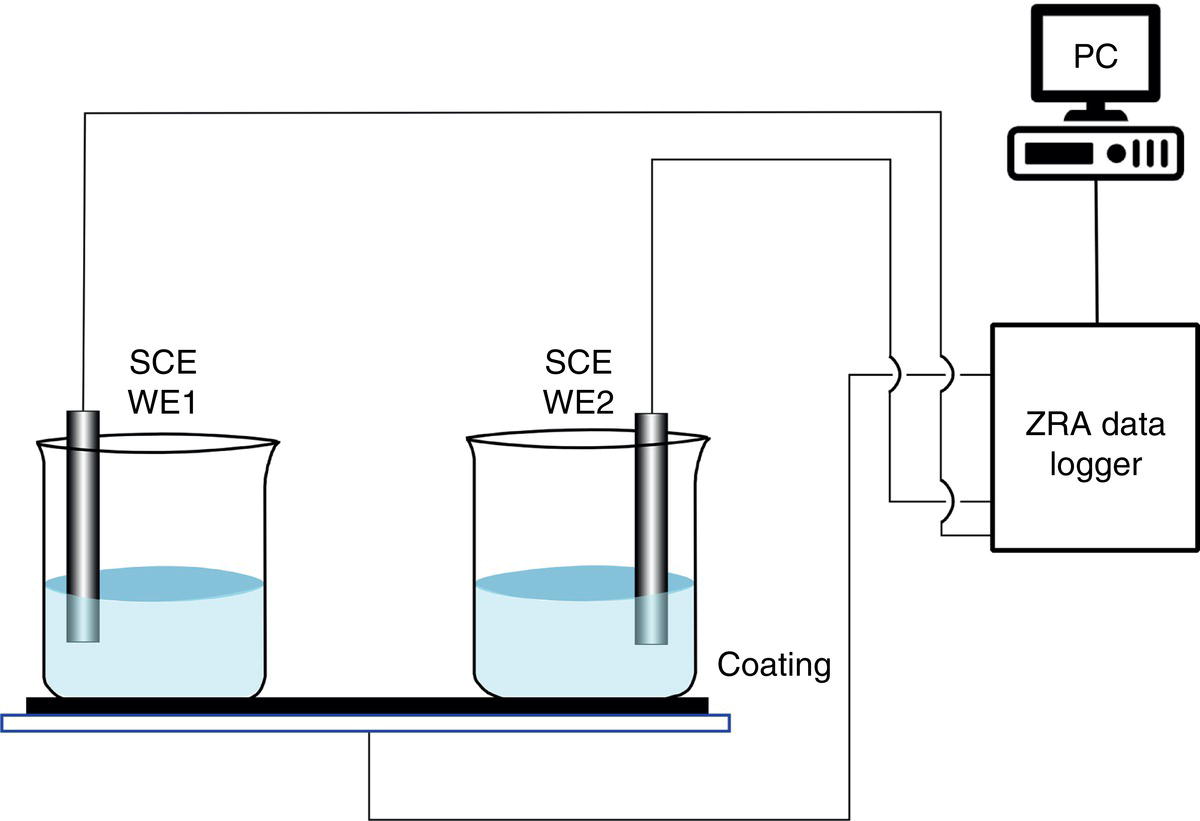
51.2.1 ENM Equipment and Measurement
51.2.2 Initial Study on Portable ENM Development
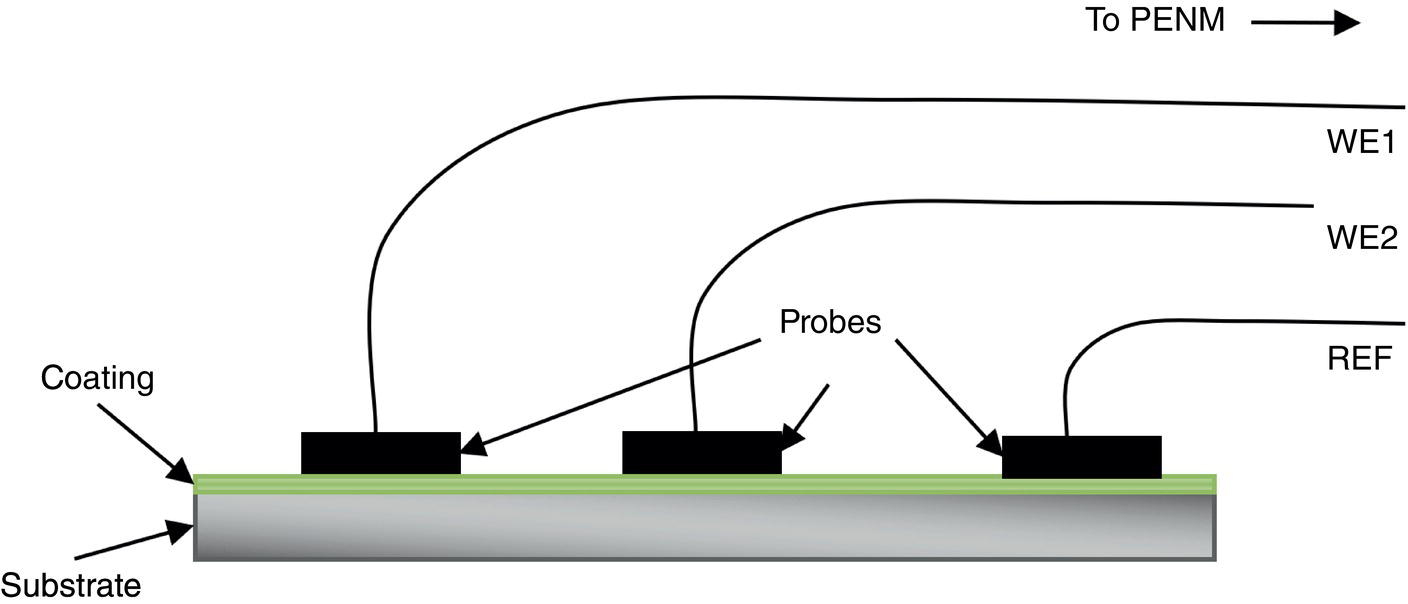
51.2.3 ENM Configuration
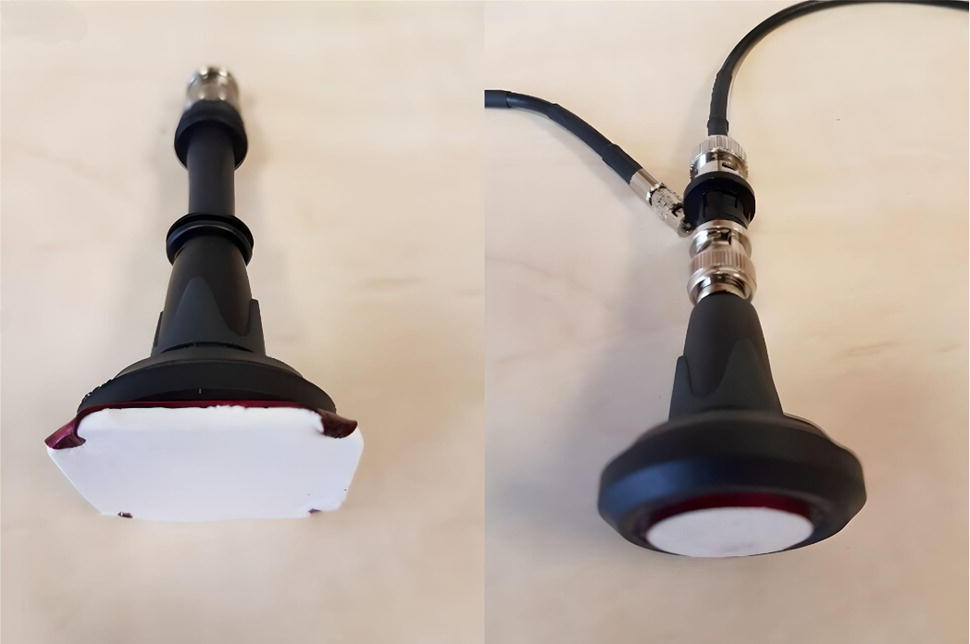
51.2.3.1 Pseudoreference Probe Development
50.4.2 Electrodes
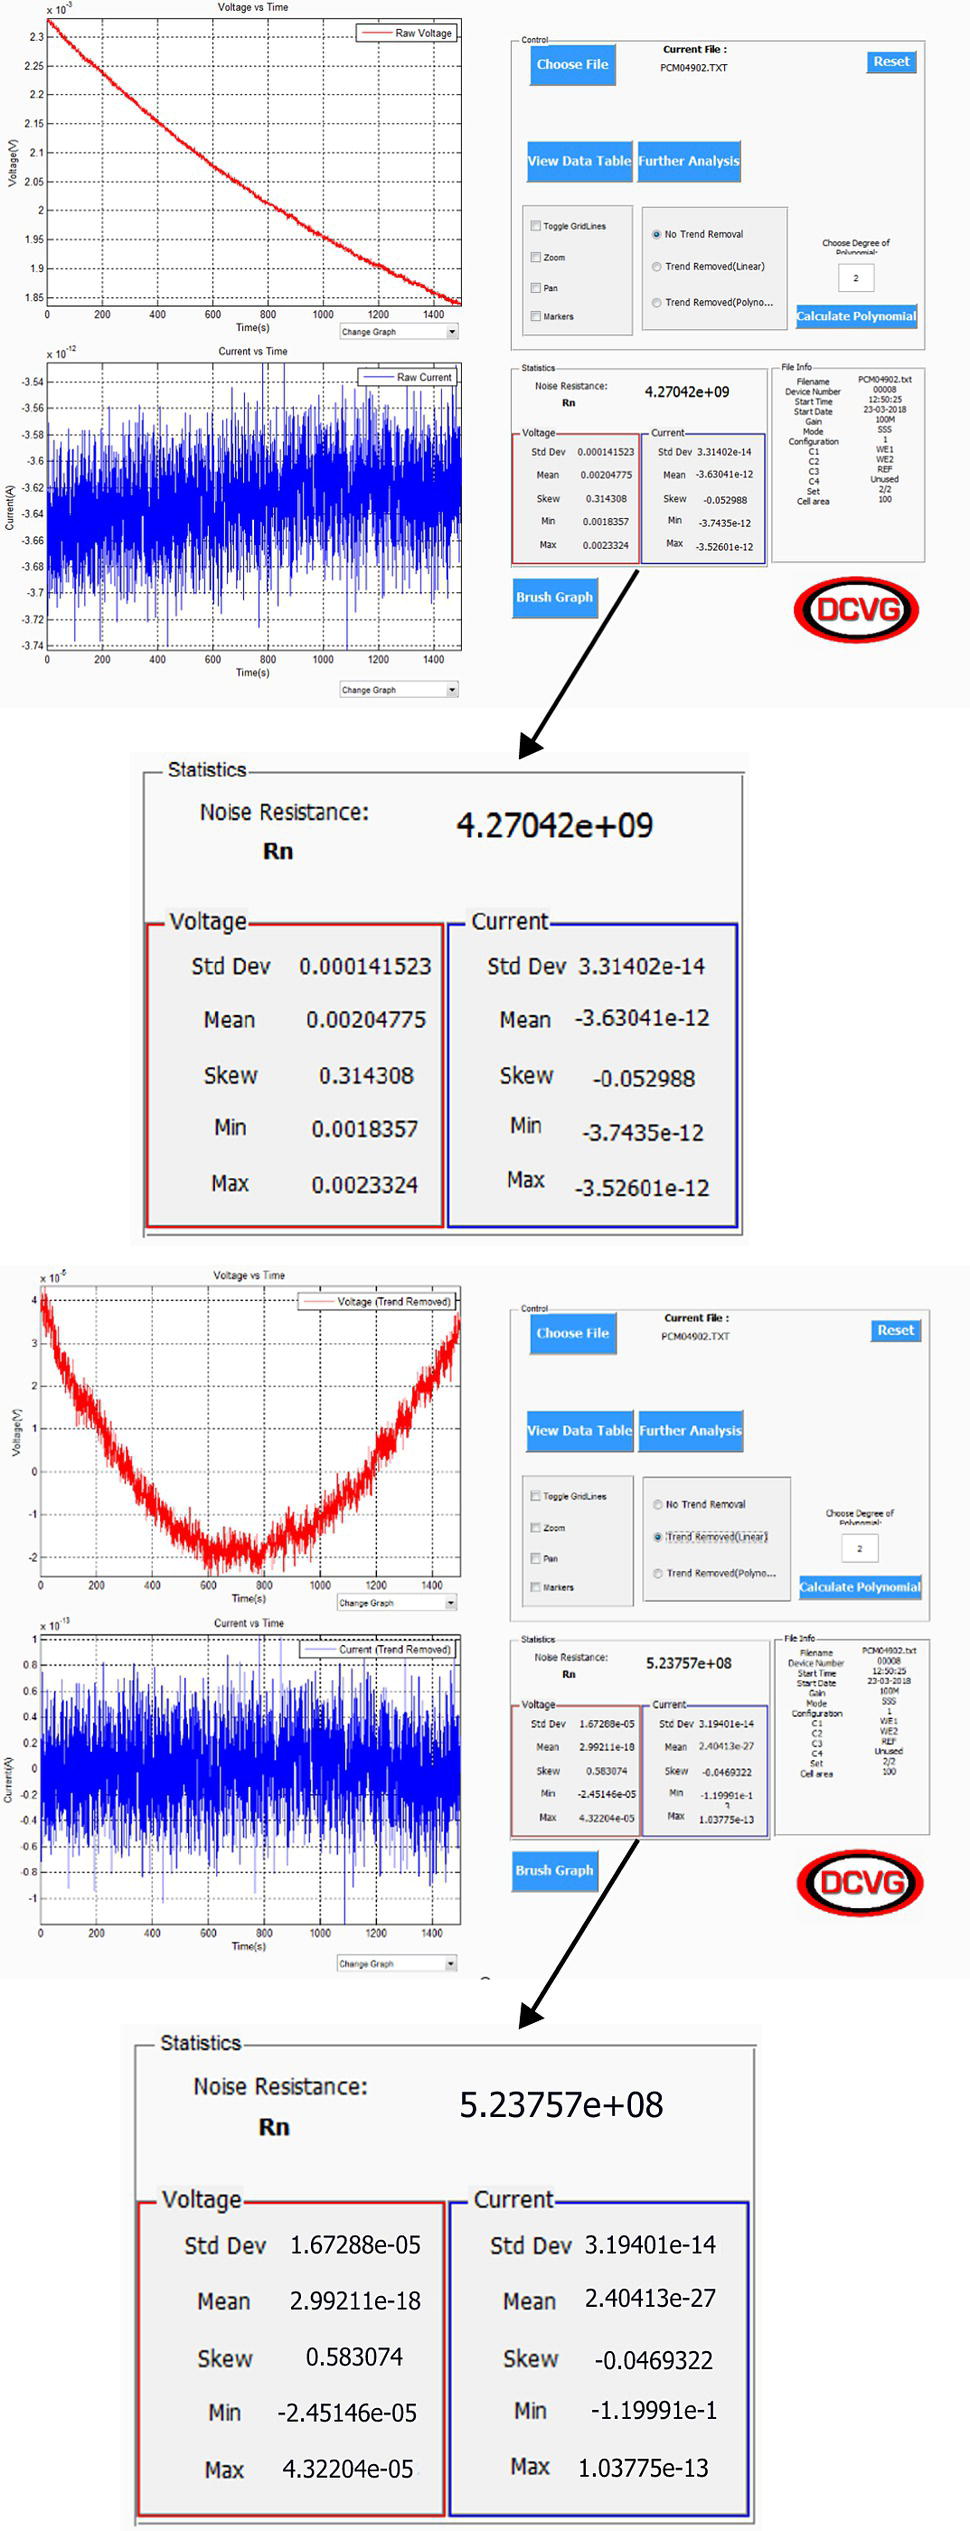
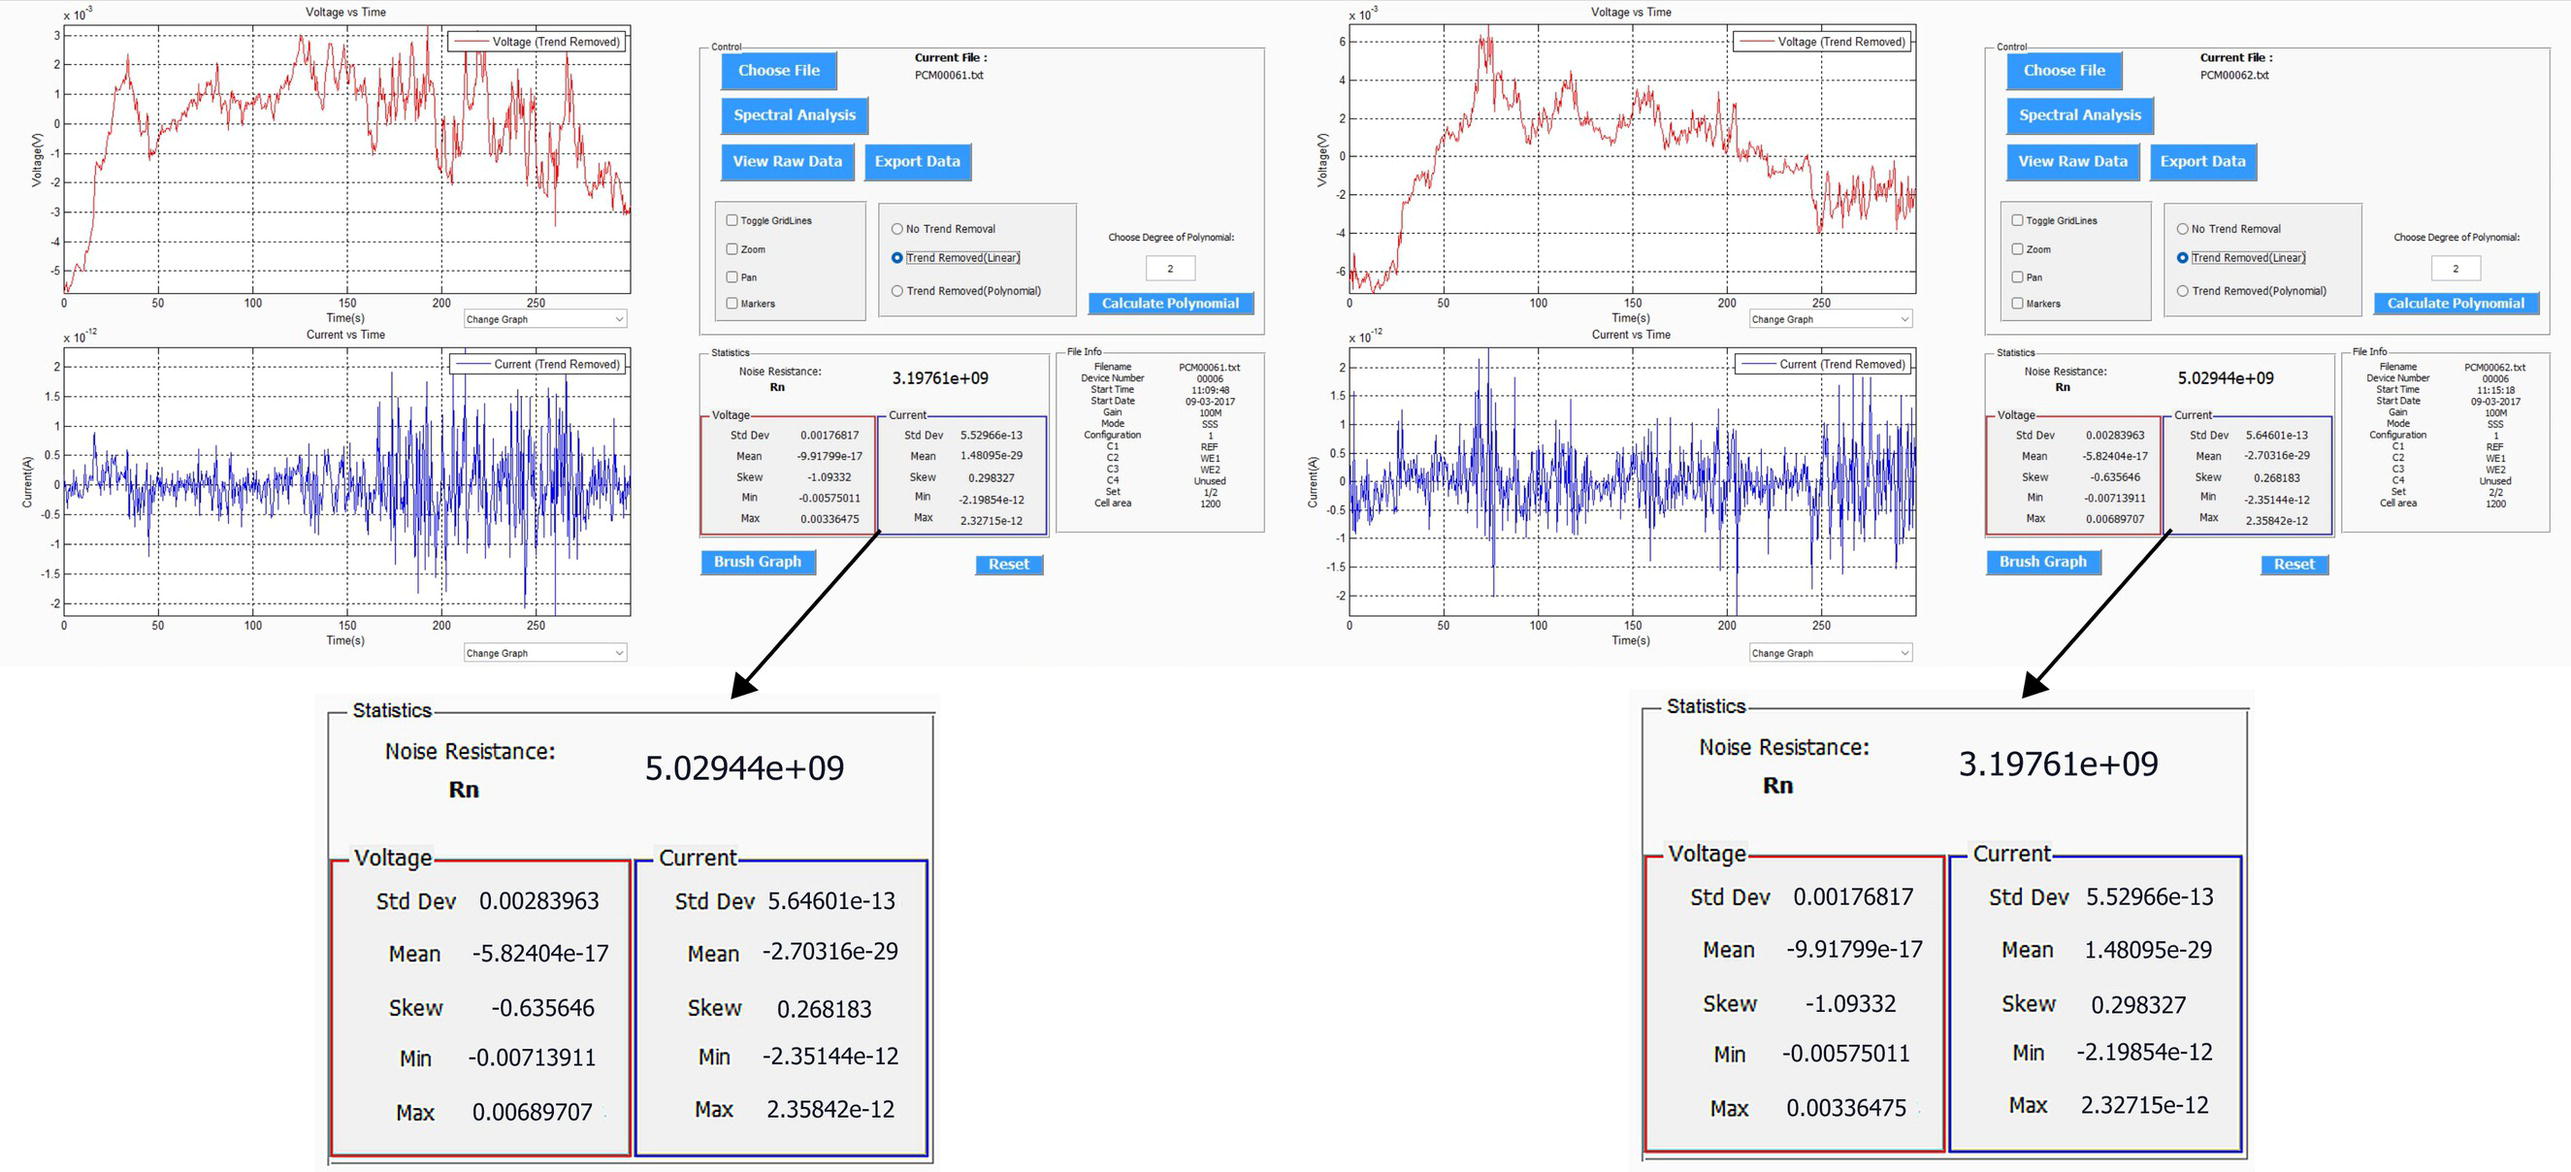
51.2.4 ENM Study of a Standard Metal Item
51.2.5 ECN Test Measurements on a Good and a Poor Coating
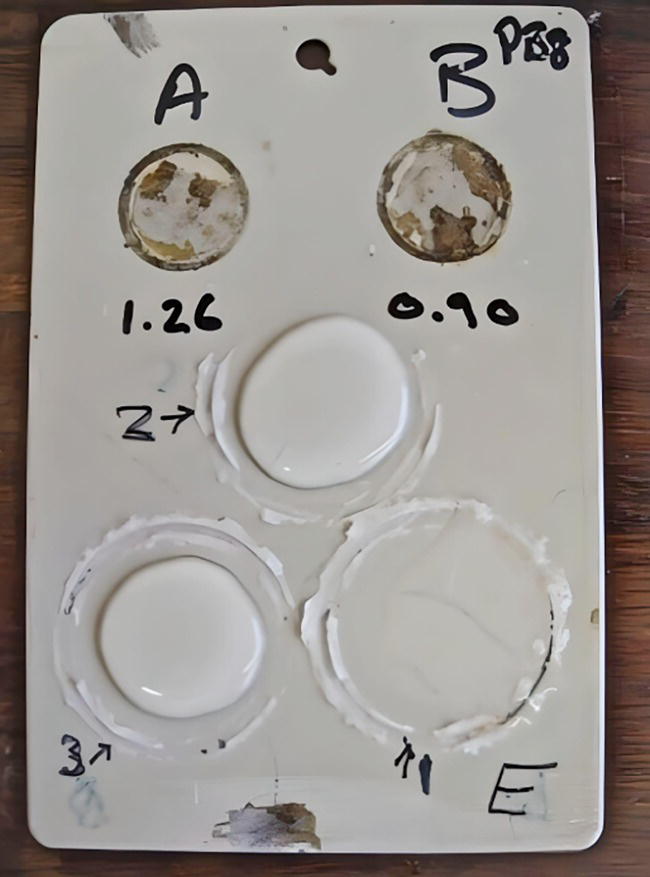
51.2.5.1 Results from Use of PENM Device on a Standard Metal Sample-2-Poor Coating
WE1
WE2
Ref
Current (A)
Potential (mV)
Rn
Pro-08 on Area 1
Pro-09 on Area 2
Pro-07 on Area 3
2.763 × 10⁻¹
−18
5.486 × 10⁷
Noise Resistance Value (Ω.cm2)
Protective Nature of Coating System
4.055 × 10⁷
3.821 × 10⁷
>109
Excellent
5.041 × 10⁷
108–109
Very good
4.652 × 10⁷
107–108
Good
3.030 × 10⁷
106–107
Fair
3.446 × 10⁷
3 × 10⁵–106
Borderline to poor
5.329 × 10⁷
105–3 × 10⁵
Poor
2.951 × 10⁷
<105
Very poor
7.168 × 10⁷
3.953 × 10⁷
5.140 × 10⁷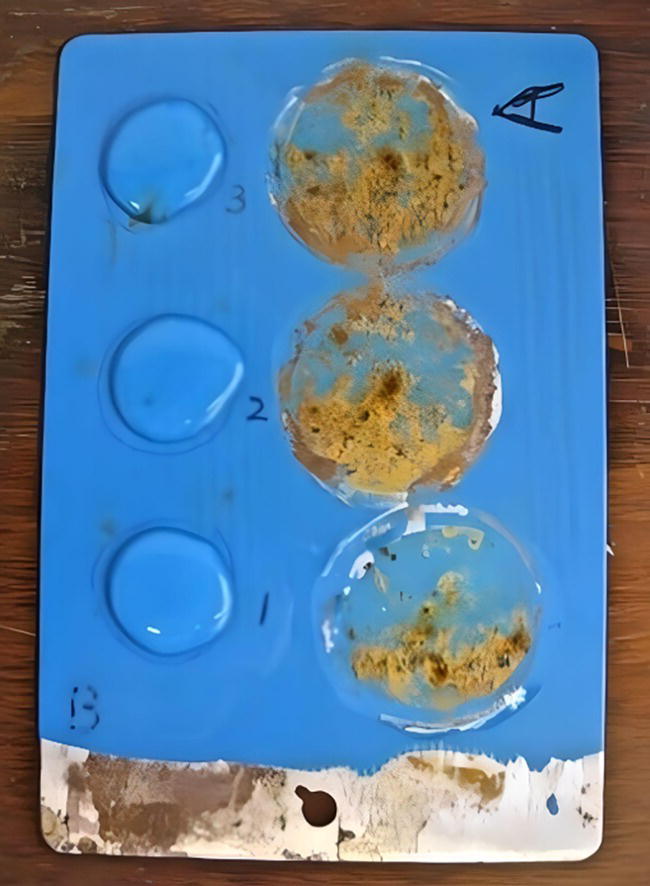
51.3 Applications of ECN
WE1
WE2
Ref
Current (A)
Potential (mV)
Rn
Pro-08 on Area 1
Pro-09 on Area 2
Pro-07 on Area 3
−9.117 × 10⁻⁸
−13.239
4.92736 × 10⁵
7.47563×10⁵
Noise Resistance Value (Ω.cm2)
Protective Nature of Coating System
1.10195 × 10⁵
>109
Excellent
7.80699 × 10⁵
108–109
Very good
6.17400 × 10⁵
107–108
Good
1.29296 × 10⁶
106–107
Fair
3.7546 × 10⁴
3 × 10⁵–106
Borderline to poor
5.742 × 10³
105–3 × 10⁵
Poor
1.19480 × 10⁵
<105
Very poor
5.68961 × 10⁵
4.4987 × 10⁴
1.0854 × 10⁴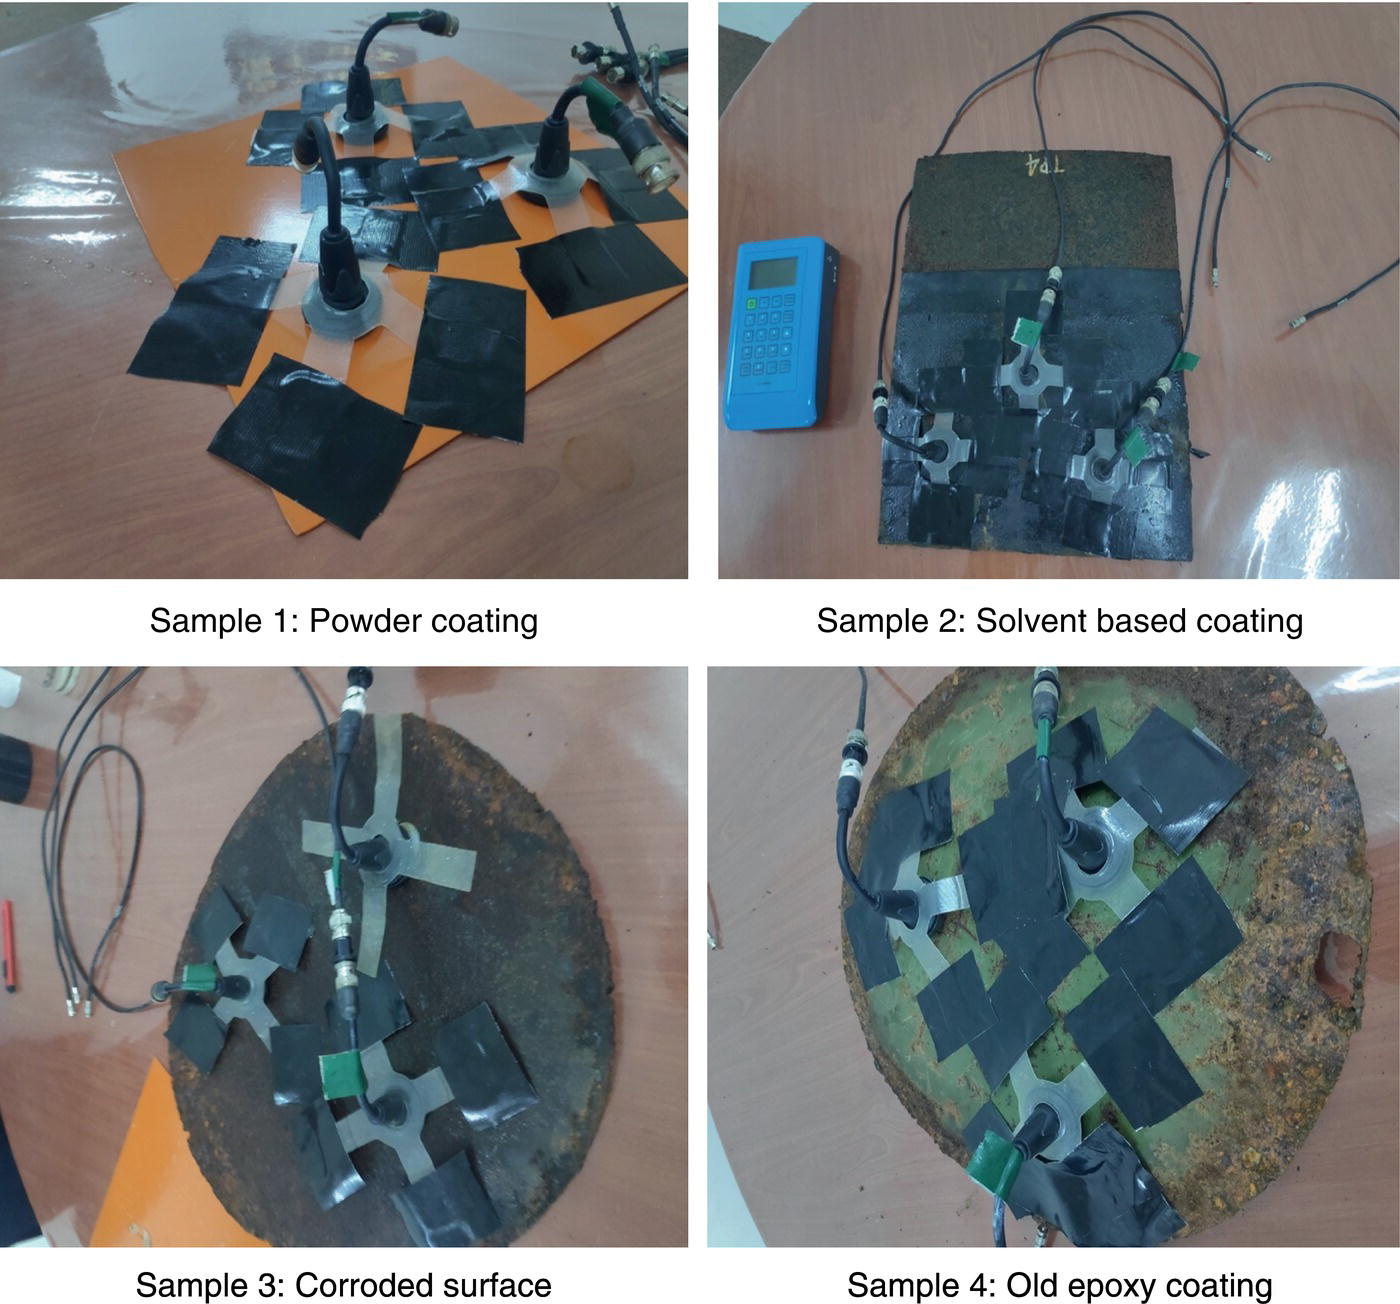
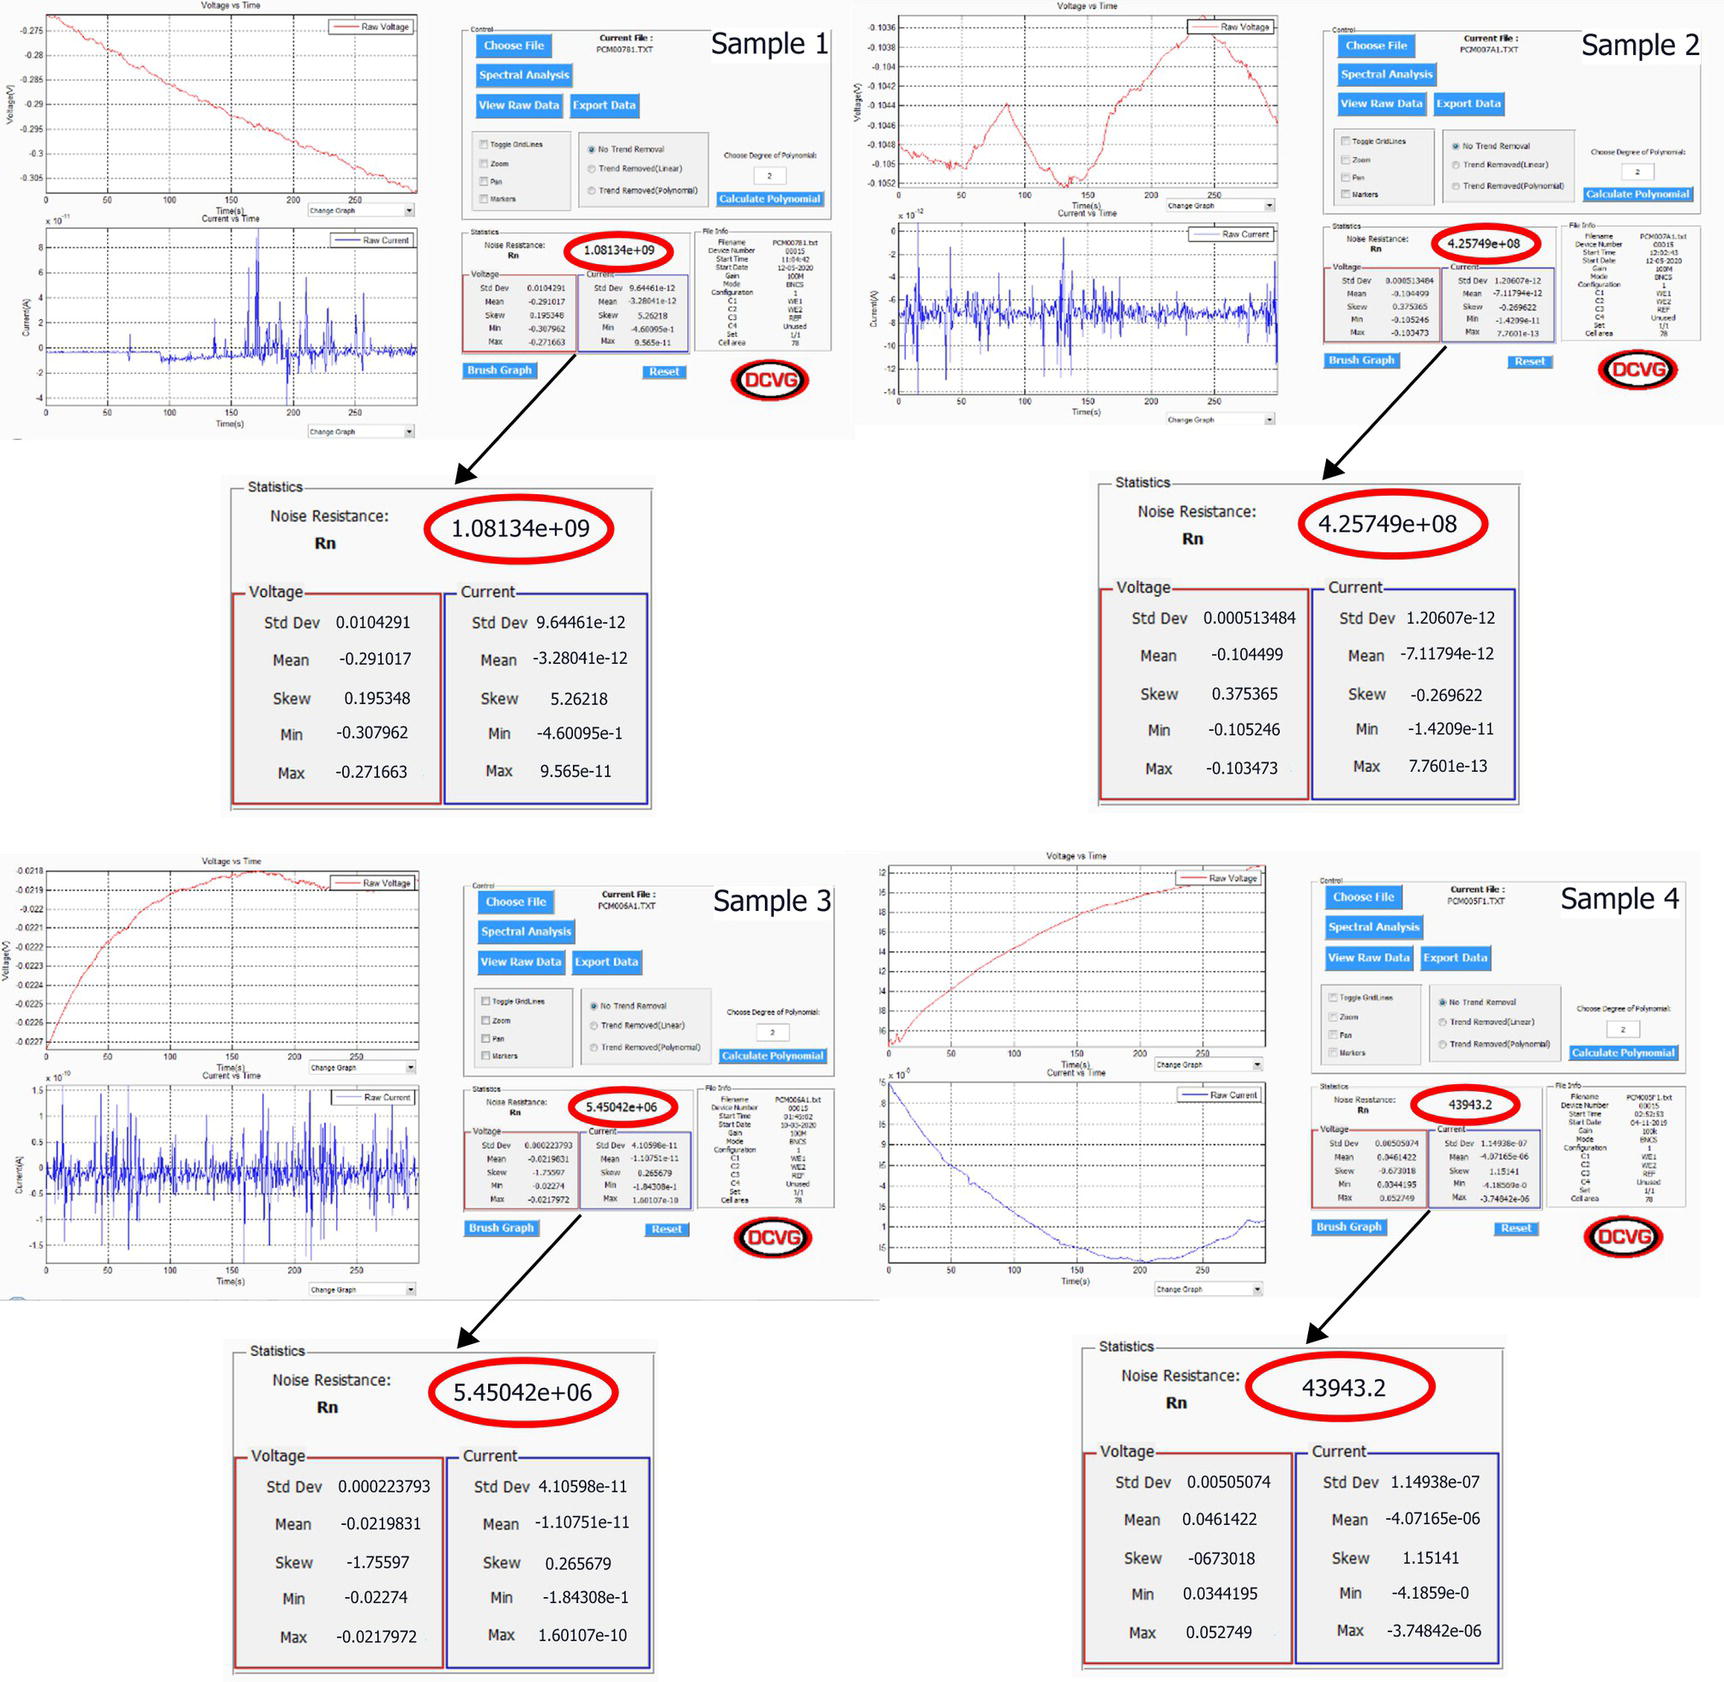
51.3.1 Examples of the Application of Electrochemical Noise
Sample
File Name
Description
Noise Resistance
Coating Quality
Remedial Action
Sample 1
PCM00781
Painted CS plate
1.08.E + 09
Excellent
Reinspect next year
Sample 2
PCM007A1
Painted CS plate
4.26.E + 08
Very good
Reinspect next year
Sample 3
PCM006A1
Painted CS plate
5.45.E + 06
Fair
Reinspect within the next 6 months
Sample 4
PCM005M1
Rusted plate
4.39.E + 04
Very poor
Refurbishment—Total recoating within the next 3 months
Acknowledgments
References
Note
