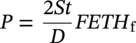
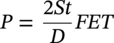
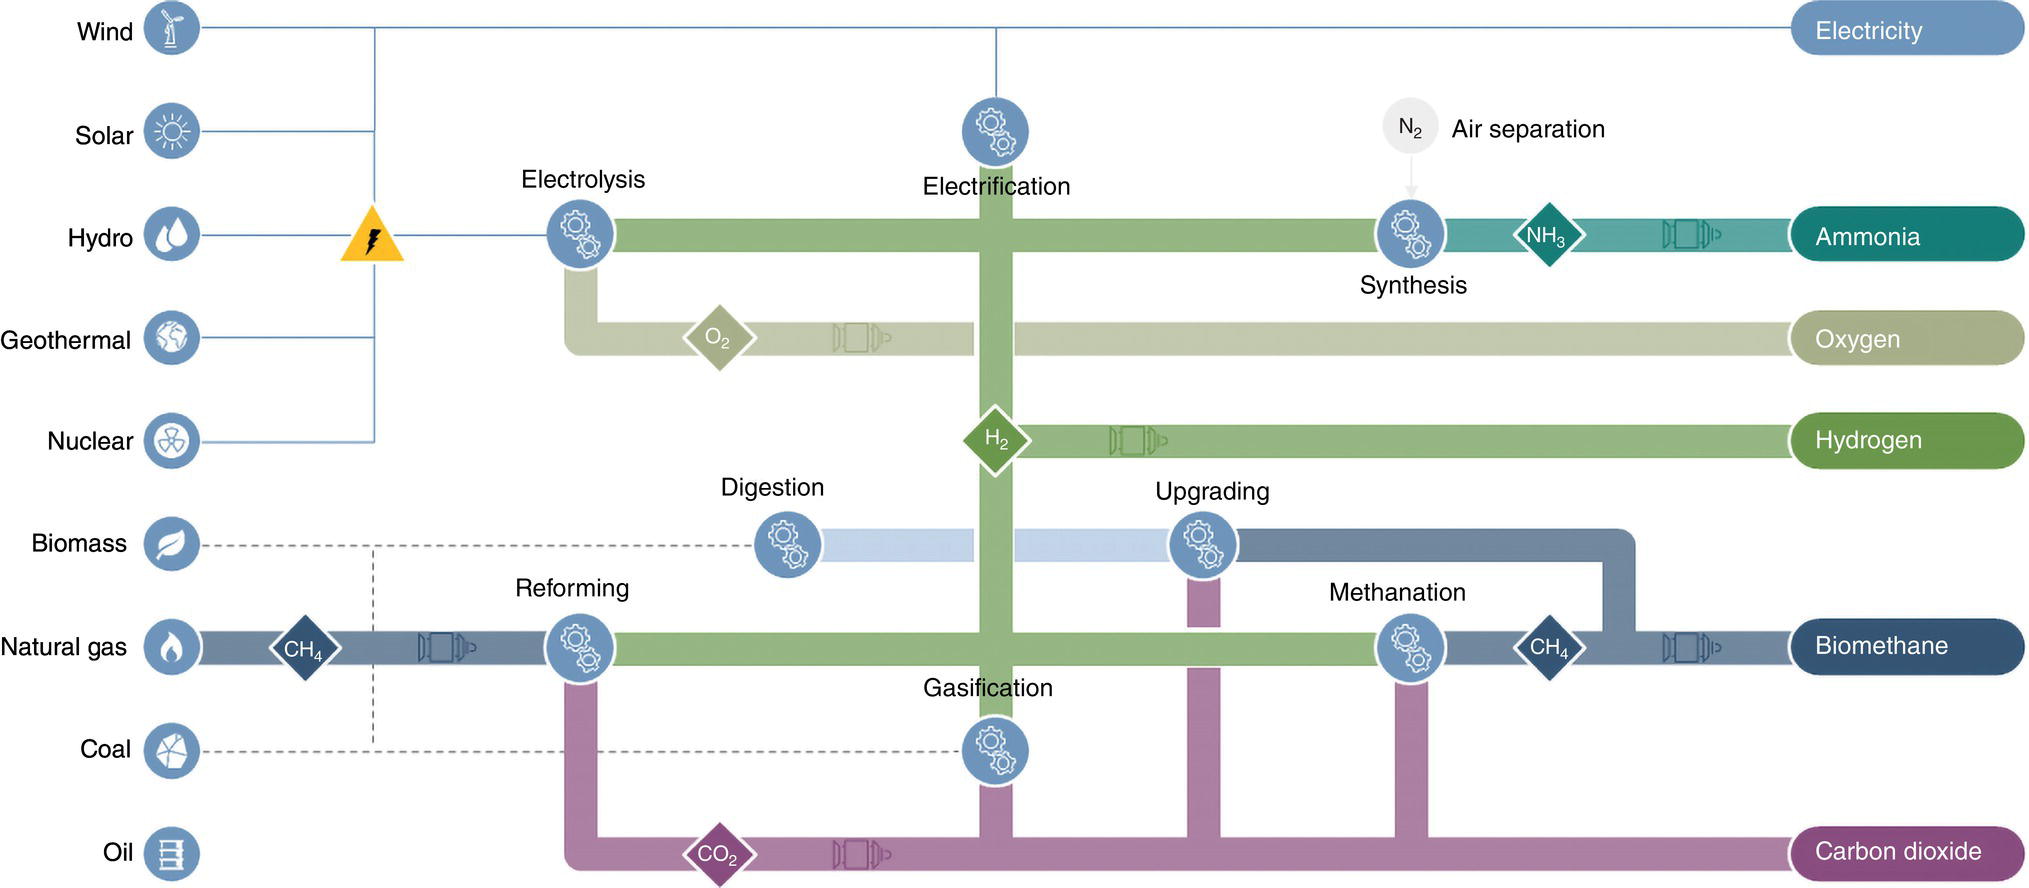
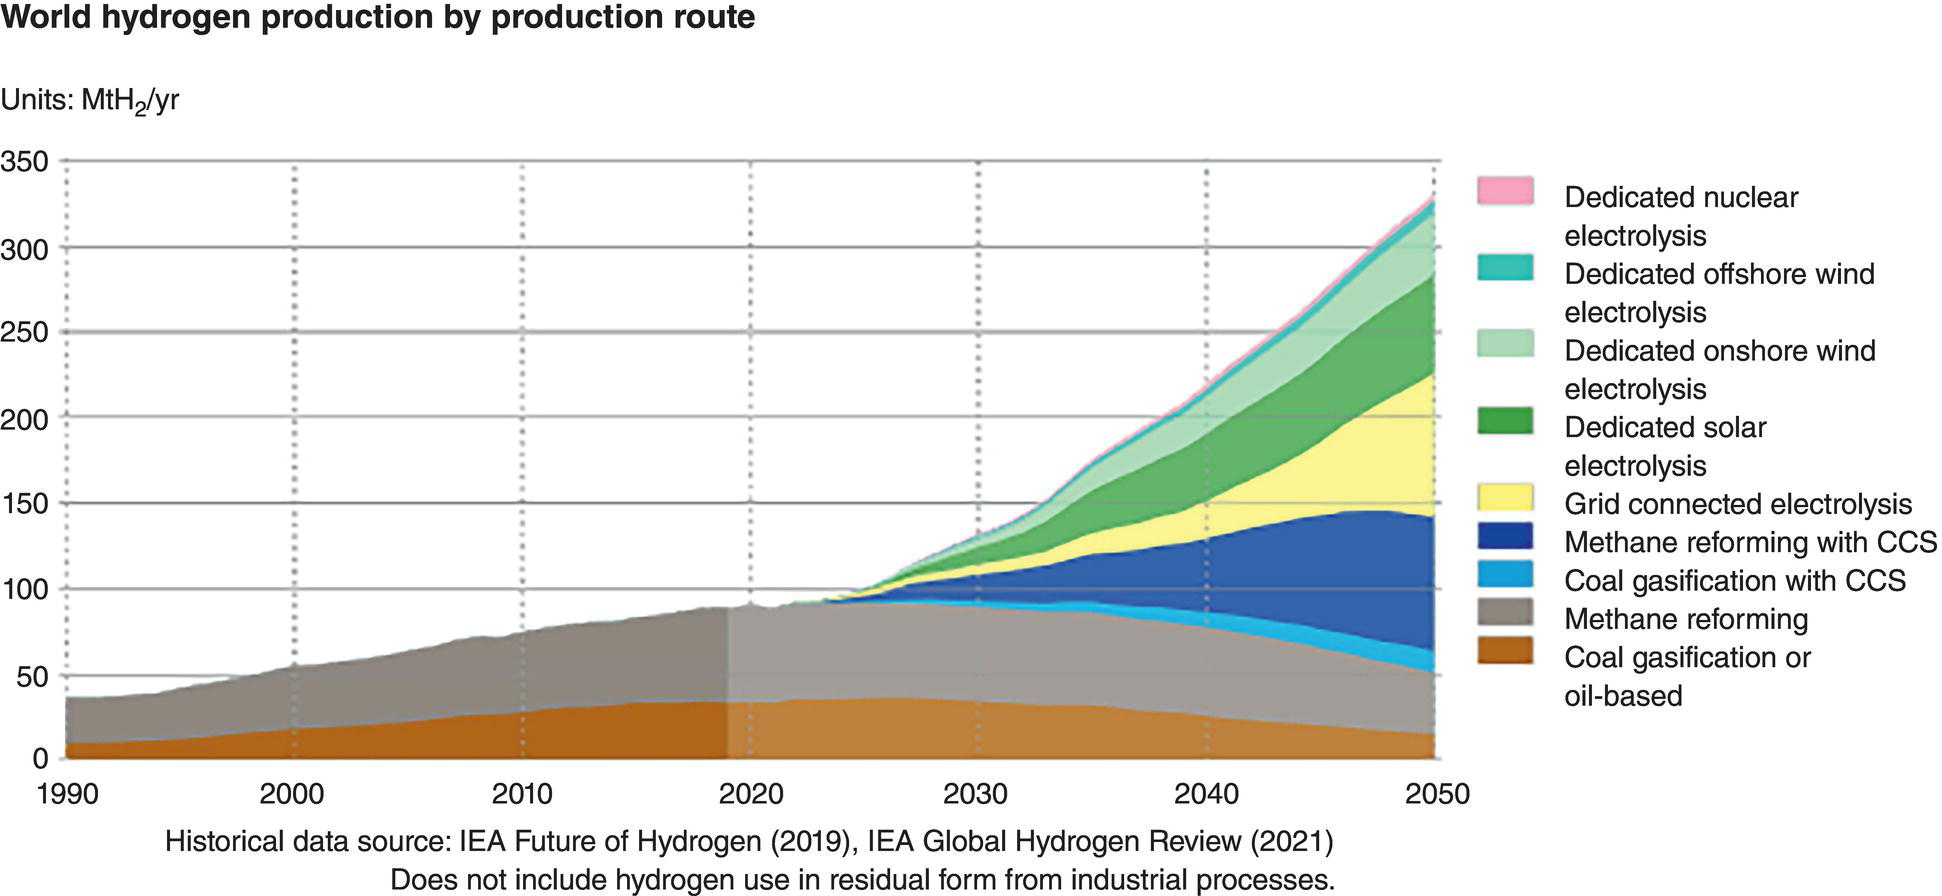
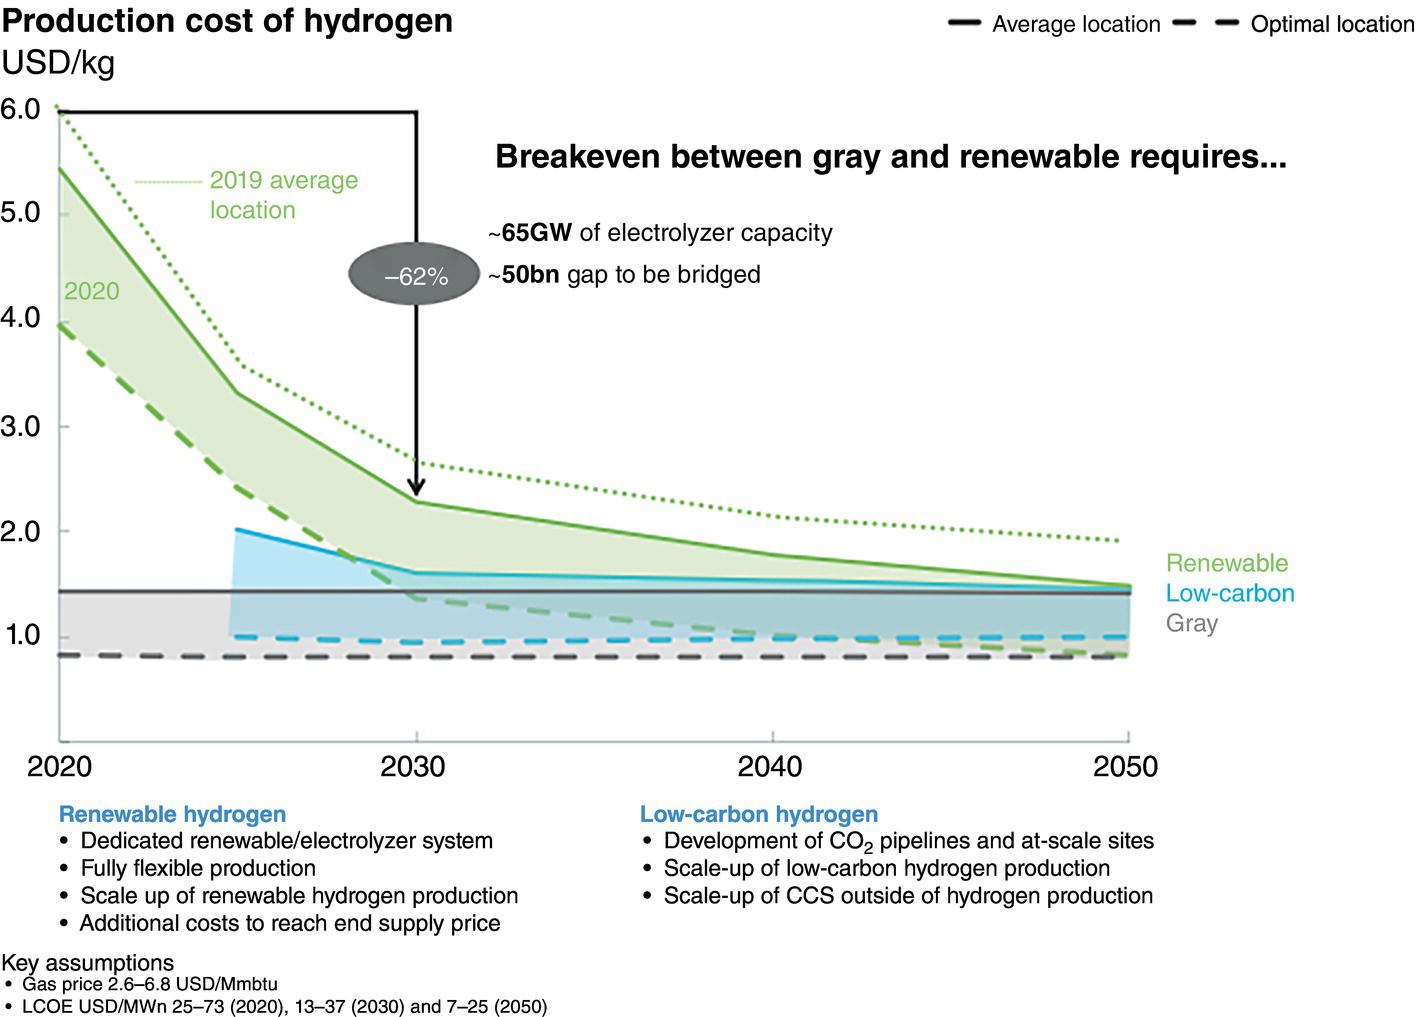
Neil Gallon and Adrian Horsley ROSEN Europe B.V., Newcastle upon Tyne, UK The role of hydrogen in the energy transition can be thought of as being a curious combination of the (very) old and the new. Hydrogen itself is the oldest element in the universe and was also the first element to form atoms. In the ~13.6 billion years since the big bang, hydrogen has been omnipresent, and it is still by a long way the most abundant element in the universe; indeed, ~74% by mass of the baryonic matter in the Milky Way is thought to be hydrogen [1]. Hydrogen has also been studied and used by scientists and engineers for hundreds of years. In the early 1500s, Paracelsus observed that a flammable gas was produced when iron filings were added to sulfuric acid, and Robert Boyle made the same observation in 1671. In 1766, Henry Cavendish followed up on these findings, isolated the gas and demonstrated that it was different from other gases, thereby becoming the conventionally identified discoverer of hydrogen [2]. The energy potential of hydrogen was soon realized when the world’s first internal combustion engine was designed in 1806 by Francois Isaac de Rivaz; it ran on a hydrogen–oxygen mixture (not gasoline) [3]. This initial exploration of hydrogen may have been driven by its ubiquity and a recognition of its unique physical properties, as outlined in Table 39.1. If measured by mass, hydrogen has an extraordinarily high energy density that is significantly higher than fossil fuels. These physical facts (hydrogen’s abundance and its high energy density) have positioned it as a major player in the future of energy. Hydrogen is not a primary source of energy, but its characteristics mean that it is peculiarly well fitted to act as an energy carrier or vector in the center of any future energy economy. Hydrogen can act as the link between the energy source (e.g., wind or solar energy) and the end user who needs the energy (the homeowner who needs to keep warm at night in the winter, when no wind is blowing and the sun is not shining). This emphasis on hydrogen as an energy vector means that storage and transportation become key. The economics of different transportation methods are still the subject of research and will depend on the volume of hydrogen to be transported and the distance it will be transported over, but it is clear that the most efficient method of transportation for large volumes over medium distances (about 100–3000 km) is in gaseous form through pipelines [5, 6]. The centrality of hydrogen, and the role of pipelines, in this future energy economy is graphically represented in Figure 39.1. This role of hydrogen as an energy carrier has led to a kaleidoscope of colors to describe the different sources of raw energy that can be used to generate the hydrogen in the first place. Although hydrogen is (and always has been) a colorless, transparent gas, it is increasingly becoming rainbowized. The current spectrum, as defined by a major UK gas network [8], is outlined in the following, although, as with so much else, the coloration is a work in progress. Green hydrogen is an overall term to describe hydrogen generated from renewable sources. Usually this involves the electrolysis of water using energy generated from wind power. Solar powered electrolysis also generates green hydrogen, although, somewhat confusingly, this form of hydrogen is also known as yellow hydrogen. Table 39.1 Physical Properties of Hydrogen [4] a LHV: lower heating value. Figure 39.1 Graphic illustration of the future role of hydrogen and pipelines in the energy transition. (Reference [7]/with permission of ROSEN Group.) Blue hydrogen is a potential low-carbon fuel that is generated from natural gas. Through the process of steam methane reforming, H2 and CO2 are formed from H2O and CH4. Although the CO2 is undesirable from a climate change point of view, blue-hydrogen production involves sequestration and storage using carbon capture and storage (CCS) technology. Hence, blue hydrogen can be considered low-carbon. Turquoise hydrogen (which is sometimes also called blue hydrogen) is similar, except that methane pyrolysis is used rather than steam methane reforming to generate the hydrogen. Pink hydrogen is generated through electrolysis powered by nuclear energy. It is also sometimes referred to as purple or red hydrogen. Pink hydrogen is therefore a low-carbon fuel, although nuclear energy has its own environmental challenges. White hydrogen is naturally occurring geological hydrogen, but currently it is not being commercially explored. Figure 39.2 Hydrogen production routes. (Reference [9]/with permission of DNV GL AS.) Gray hydrogen is currently the most common form of hydrogen in production, accounting for most of the hydrogen used on an industrial scale at this time. It is effectively blue hydrogen (formed from natural gas via steam methane reforming) without the associated CCS. Currently, the vast majority of hydrogen produced is gray, brown, or black, but projections indicate that in the future, green and blue hydrogen will become significantly more important for environmental reasons (Figure 39.2). The specific form of hydrogen to be adopted will ultimately be determined by economics. At present, green hydrogen is significantly more expensive than either blue or gray, but the amount of investment currently being announced in electrolyzer technologies appears certain to reduce this gap. A 2021 report for the Hydrogen Council [10] predicted that green hydrogen would become cost competitive with blue hydrogen under certain circumstances (for example, where there are plentiful supplies of water and renewable electricity) by the late 2020s. It would catch up with gray hydrogen in the early 2030s and continue to improve its position in the future (Figure 39.3). As a corollary to the above, it should be noted that both these predictions were made prior to the Russian invasion of Ukraine and the associated gas crisis. It appears inevitable that the prices of both blue and gray hydrogen (types that rely on methane feedstock) will increase, making green hydrogen potentially more economical sooner. As implied earlier, hydrogen is well established industrially, and there is currently an established market. Current demand split by industrial sector is shown in Table 39.2. This established industry means that there is a great deal of historical hydrogen production, storage, and transportation experience, which extends into the field of pipelines. In 2016, there were reported (Table 39.3) to be more than 4500 km of hydrogen pipelines in operation around the world, although 90% by length of these were owned by just four companies (Air Liquide, Air Products, Linde, and Praxair). Although this history offers convincing empirical proof that hydrogen pipelines can be safely operated, these hydrogen pipelines are orders of magnitude shorter in extent than the existing natural gas network. Further, as implied by who owns them, they tend to be industrial pipelines connecting industrial plants. They, therefore, have different design, construction, and operational characteristics compared to trunk transmission lines, although their basic material is similar (carbon steel linepipe often based on API 5L [12] requirements). Interest in hydrogen has grown recently, driven by the necessity of reducing greenhouse emissions and the legally binding requirements resulting from, among others, the Paris climate change agreement [13]. As of September 2021, 17 governments had adopted national hydrogen strategies, mainly in Western and Central Europe but also countries such as Chile, Canada, Colombia, and Russia (preinvasion). In Figure 39.4, the numbers of countries that announced adoption of a hydrogen strategy in 2018, 2019, 2020, and 2021 are illustrated. In the chart, “update” refers to a country releasing updates or policy documents to complement strategies already in place. In addition, 20 other countries had announced that they were actively developing theirs. Figure 39.3 Predicted hydrogen production costs. (Reference [10]/with permission of Hydrogen Council.) Table 39.2 Current Hydrogen Demand [4] Table 39.3 Existing Hydrogen Pipelines by Region [11] Figure 39.4 Annual announcements of government hydrogen strategies, 2018–September, 2021. (Adapted from Ref. [14].) The most visible manifestation of this hydrogen interest in the pipeline world is the European Hydrogen Backbone (EHB) initiative, a consortium of 31 energy infrastructure companies from 28 countries (Figure 39.5). It is envisaged that the EHB will, by 2040, be a pan-European pipeline network with a length of almost 53,000 km, largely based on repurposed existing natural gas infrastructure. It is anticipated that an estimated total investment of 80–143 billion euros (88–157 US dollars) will be required to facilitate this goal [15]. This level of repurposing and required investment has driven an increase in industry research, as exemplified in the number of papers addressing hydrogen pipelines at the industry Pipeline Technology Conference (PTC), in Berlin, Germany, which is graphically shown by year of publication in Figure 39.6. The long-term vision of the industry is for the hydrogen backbone to transport “pure” (exact composition limits have not yet been defined but are likely to be at least 98% v/v) hydrogen. However, it has been recognized that the use of blends of hydrogen and natural gas is likely to be necessary in the short to medium term. The only transmission system operator to have already converted an existing transmission pipeline to hydrogen is Gasunie with the Dow-Yara pipeline [16], which was converted to a blend of hydrogen and up to 30% methane. There are several other existing trials, notably the HyDeploy Winlaton blending project in the United Kingdom [17] and the Snam Contursi trial in Italy [18], which utilize blends of up to 20% hydrogen in existing distribution pipelines. Contemplating the role of hydrogen as a storage and transport medium in a future energy system raises the inevitable question of how this is to be achieved. Various studies have investigated different options for the storage and transportation of hydrogen, with the major options being shown in Figure 39.7 The most efficient option will depend on the volume and distance involved, although it is prima facie clear that for the large volumes required to support industrial clusters or large-scale residential demand, truck or rail/barge transport will be unfeasible. As shown in Figure 39.8, an analysis performed by Guidehouse for the EHB demonstrates that, for intracontinental transport, pipelines transporting gaseous hydrogen are significantly cheaper than ship transportation of ammonia or liquid organic hydrogen carrier (LOHC). Since hydrogen has different energy carrying characteristics from natural gas, the operational characteristics of a hydrogen pipeline will differ from those of a natural gas pipeline if the same energy throughput is required. In general terms, hydrogen has a significantly lower volumetric energy density than methane, while also having different flow characteristics leading to a lower frictional pressure drop during transport. The exact implications of these effects will differ from pipeline to pipeline; however, the general consensus is that the flow rate of a hydrogen pipeline will have to be significantly (three to five times) higher than that of its natural gas equivalent, while the pressure may have to increase slightly to maintain the same energy throughput. From this, and the different properties of hydrogen, it follows that existing (natural gas) compressors are unlikely to be suitable for a hydrogen network and will have to be replaced [20]. Transmission temperatures are unlikely to be significantly affected, although there may be some impact from the different thermodynamic properties of hydrogen [21]. Figure 39.5 Proposed European Hydrogen Backbone in 2040. Figure 39.6 Number of papers referencing hydrogen pipelines by PTC publication year. Figure 39.7 Options for hydrogen transport and storage. (Reference [9]/with permission of DNV GL AS.) Figure 39.8 Transport costs for different options. (Reference [19]/with permission of Hydrogen Council.) Given the lower volumetric energy density of hydrogen compared to natural gas, and the likely intermittent nature of the supply of green hydrogen, a greater emphasis than at present is likely to be placed on gas (hydrogen) storage. Large-scale and long-term storage is likely to be done in geological formations (salt caverns, depleted hydrocarbon reservoirs, or aquifers), while short-term and small-scale storage is likely to require tanks or line packing [4]. From the pipeline-operational point of view, this requirement for line packing is likely to lead to increased cyclic pressure loading for a hydrogen pipeline compared to a natural gas line. Given the long history of hydrogen pipelines, it is not surprising that there are existing codes that specify how to design or repurpose a hydrogen pipeline. The experience of industrial gas companies with hydrogen pipelines has been synthesized into the harmonized European Industrial Gas Association (EIGA)/Asia Industrial Gas Association (AIGA)/Compressed Gas Association (CGA) guidelines. These EIGA/AIGA/CGA guidelines [22–24] summarize the combined empirical experience of those with the most knowledge of operating hydrogen pipelines, making them a very useful guide. Currently, the most commonly referenced code is ASME B31.12 [25], which draws from both the EIGA/AIGA/CGA guidelines and ASME B31.8 [26]. There are also some alternative standards recently released in the United Kingdom and Germany [27, 28], although these are in essence similar to ASME B31.12. As would be expected, ASME B31.12 and the EIGA/AIGA/CGA guidelines are extensive, and full guidance or interpretation is beyond the scope of this chapter. Nevertheless, some highlights can be identified. The codes are unanimous in agreeing that carbon steel linepipe, based on API 5L, is a suitable material of construction for hydrogen pipelines. However, it should be noted that the codes are also unanimous in recommending tests and restrictions that are in addition to standard API 5L material. The EIGA/AIGA/CGA guidelines are more restrictive in terms of mechanical properties (principally Charpy impact energies), chemical composition, and microstructure than standard API 5L, while ASME B31.12 has similar restrictions to the (in-air) mechanical properties while also offering the option to test in hydrogen in addition to in-air testing. The pay-off of testing in a hydrogen environment is the opportunity to use a higher utilization factor (hoop stress as a proportion of the specified minimum yield stress), resulting in a more cost-effective design in terms of thinner wall pipe for a given pressure (ASME B31.12 Design Option B). In addition, existing hydrogen codes strongly encourage the use of lower-grade (<=X52 equivalent) materials by significantly reducing the allowable utilization factor for higher grades unless material qualification in hydrogen has been undertaken. Variations in hydrogen-sensitive material properties will likely exist even within linepipe and pipework of the same diameter, grade, weld type, and wall thickness sourced from the same manufacturer. The net outcome of these additional material restrictions is that, although hydrocarbon and hydrogen pipelines can both be manufactured from the same base standard material, it is very unlikely that hydrocarbon pipeline materials can be shown to meet the restrictive standard requirements for hydrogen pipelines. These same material compatibility considerations will also apply to metallic and welded in-line fittings and pipework, such as forgings and fabrications. Components that contain elastomeric or mechanical seals such as valves, flanges, and pig traps will also need to be qualified from both a material degradation (potential blistering or aging) and a functional performance perspective, although most elastomers and polymers have been shown to exhibit good material compatibility with gaseous hydrogen [22]. ASME B31.12 specifies helium leak testing for valves in line with API 598 requirements, reflecting the additional permeation and sealing challenges in a hydrogen environment due to the smaller size of hydrogen molecules. The equation governing the permissible operating pressure of a pipeline in ASME B31.12 (hydrogen) is at first sight very similar to that in ASME B31.8 (natural gas). In both Equations (39.1) and (39.2), the following nomenclature applies: ASME B31.12 includes an additional factor, Hf, the material performance factor. Although nominally similar, the outcome of applying these equations can be very different. First, the design factor differs between ASME B31.12 and B31.8 (Table 39.4). Second, the material performance factor applies in B31.12 (Table 39.5). Within ASME B31.12, there are two separate design options identified. Option A is more prescriptive and requires extensive testing in air but does not require testing in gaseous hydrogen. Option B allows a higher operating pressure to be used but requires testing in gaseous hydrogen in addition to the extensive in-air testing required by Option A. If Option B is applied, then the material performance factor can be set to 1.0 for all grades. Table 39.4 Design Factors for Different Codes It follows that, if design Option A is applied, an X80 pipeline in a Cl.1 Div. 1 location could operate at a utilization factor of 0.80 for natural gas but only 0.347 for hydrogen (i.e., more than a 50% reduction in operating pressure). If operation at low design factors is not compatible with the desired operational regime, the Option A approach essentially results in uneconomical heavy-walled pipeline designs to lower the stress level. The additional (in-air) characterization of material properties required to support Option A (PL-3.7.1 [1]) are as follows: Modern linepipe may already have suitable Charpy and DWTT test data available if procured under the PSL2 requirement of API 5L (introduced in 2000), or if supplementary testing was specified at procurement. However, upper limits on tensile properties are a hydrogen-specific requirement and unlikely to be available. Table 39.5 Carbon Steel Material Performance Factor from ASME B31.12 (Applicable to Option A Only) The Option B performance-based design method (PL-3.7.1 [2]) requires material qualification in hydrogen as well as the introduction of further constraints on material chemical composition—in addition to all those specified in Option A: Maintaining microstructural control and weld material properties in the field environment has always posed greater challenges when compared to the pipe mill. Considering the microstructural sensitivities associated with hydrogen service, it is no surprise that additional requirements for construction welding are specified in ASME B31.12 in addition to the requirements of existing pipeline construction welding codes such as API 1104. The key areas of note are the requirement to use low-hydrogen consumables to control diffusible hydrogen and potential hydrogen cracking during welding, as well as stricter limits on as-welded hardness. The first key difference is the tighter weld hardness control requirements (235 Hv10 in ASME B31.12 GR-3.10), which is lower than existing construction welding codes and analogous to those required for sour-service-rated linepipe (250–350 Hv10 in the 2021 edition of API 1104, depending on joint thickness and carbon equivalent). Validation of hardness through testing is required for welding procedure qualification (PL-3.19.8) as well as validation on random samples of production welds. It should be noted from a repurposing perspective that the requirements for hardness testing in line with current code requirements is unlikely to have existed in the construction welding standards for older pipelines. Notably, it is stated that postweld heat treatment (PWHT) may also be necessary to achieve acceptable hardness levels, particularly for heavier-wall sections. These requirements are particularly onerous from a pipeline repurposing perspective where retrospective PWHT is not particularly credible and construction weld hardness testing data may not be available. The requirement for full weld material property characterization in gaseous hydrogen as part of the procedure qualification record (PQR) is required where the “Option B” design approach is adopted. Regardless of the design option adopted, from a future integrity management perspective, weld fracture toughness testing in hydrogen may be required anyway to define acceptable weld defect limits. Traditionally, conservative workmanship limits defined by the codes (e.g., API 1104) have been used for construction welding in natural gas pipelines. These are not fitness-for-service-based criteria but generally result in conservative defect limits for natural gas duty. However, smaller critical defect sizes in hydrogen may require fitness-for-service-based approaches for defect acceptance such as those defined in Appendix A of API 1104. There is limited code-based guidance available on how to repurpose a pipeline to hydrogen. Within ASME B31.12, Clause PL3.21 offers guidance, but in total, this comprises less than one page of a 278-page document. This clause requires various different actions from the pipeline duty holder, with some notable subclauses being reproduced in the following: It can therefore be seen that, to repurpose in accordance with ASME B31.12, extensive excavations and testing works will be required to characterize materials. If these are not performed, the full suite of required material property data is highly unlikely to be available, even for the most modern pipelines where manufacturing and construction records are intact. Further, in view of the additional restrictions to mechanical properties, chemical composition, and microstructure that apply to hydrogen pipelines compared to hydrocarbon pipelines, it is unlikely that all materials will meet the requirements of either Option A or Option B. By default, it appears that the hoop stress for a converted pipeline will be limited to 40% SMYS. A (presumably unintended) consequence of this is that this hoop stress is actually higher than permissible for Option A designs for >X52 steel in Location Class 4 areas. The EIGA/AIGA/CGA guidelines have similar restrictions and requirements in Appendix H of their guidelines. It follows from the above that repurposing of pipelines to hydrogen in strict accordance with existing codes can be very challenging; indeed, the authors are not aware of any instances where these requirements have been rigidly followed. It is notable that the author is only aware of one natural gas transmission pipeline to have been converted to hydrogen service by a gas transmission company, and ASME B31.12 was not mentioned in a technical paper outlining how this was done [16]. Given the scale of repurposing envisioned by the EHB and others, it is clear that there is a need for more guidance on this topic. Various technical papers have been published outlining different approaches and options [29–31], but as yet, none of these have been formally codified. It appears inevitable that each pipeline will have to be treated on a case-by-case basis until there is more consensus. It further appears inevitable that any deterministic approach based upon the premise that an existing (hydrocarbon) pipeline can be shown to be in absolute accordance with all the design and material properties limitations required for a purpose-built (hydrogen) pipeline is doomed to failure. Successful repurposing will require a risk-based, integrity-led fitness-for-service-type approach, as shown for example in Ref. [29]. As shown earlier, an understanding of pipeline materials is required for hydrogen, and current codes bluntly mandate sampling at a rate of one per mile to meet this need. The process of characterizing material properties across an existing pipeline can be made significantly more “intelligent” using a population-based grouping approach [32] aiming to group materials with shared characteristics and similar material properties such that material data gaps can be more efficiently identified per population rather than per component. This can help to minimize unnecessary, expensive sampling and testing of the same material populations as well as avoid the potential of missing key susceptible material property changes occurring within the specified 1-per-mile sampling frequency stipulated by ASME B31.12. A number of existing MFL-based in-line inspection (ILI) technologies can support the process of pipeline material characterization through spool-by-spool measurement of pipe grade (yield and UTS). The material characterization process first involves recovery of all available material records for the pipeline (e.g., manufacturing and construction records). ILI can then be deployed to support the delineation (grouping) of pipe spool populations through the following measured parameters: An example of per-spool population output using ILI data is shown in Figure 39.9, with each population identified by the Y-axis position. Series colors represent grouped material populations sharing the same characteristics as measured by ILI. Available pipeline material records can then be overlaid onto the identified ILI populations (Figure 39.10) to facilitate the identification of material property data gaps and support the definition of the plan for closing out these gaps. Although destructive testing will be required for characterizing material properties such as fracture toughness, nondestructive measurement technologies for measurement of tensile properties and hardness are available for in-ditch measurement, with an ever-increasing array of solutions coming to the market. Figure 39.9 Example of material population ILI output. Figure 39.10 Overlaying manufacturing and construction records onto grouped ILI material populations. The differences between hydrogen and natural gas pipelines can be split into two main categories: the effect that hydrogen has on probability of failure (i.e., any deleterious effect that hydrogen can have on pipeline integrity), and the effect that hydrogen has on the consequences of any failure (different explosive characteristics, etc.). Figure 39.11 Schematic showing possible hydrogen traps. (Reproduced from Ref. [36]/with permission of Taylor & Francis.) A priori, gaseous hydrogen can potentially affect the probability of pipeline failure in one of two ways: it can either introduce new threats that were not present in hydrocarbon service (e.g., new cracking mechanisms), or it can exacerbate existing threats. A great deal of research has been undertaken into both of these mechanisms, with comprehensive reviews available for example from the Sandia National Laboratories [33] and EPRG [34]. The existing understanding is summarized in the following, with all the mechanisms relying on the presence of hydrogen in the pipe wall—as predicted by Sieverts’ law [35], which describes the dissociation and absorption of (molecular) gaseous hydrogen into absorbed (atomic or ionic) hydrogen. Once absorbed, hydrogen can segregate to various different positions within the lattice. A schematic overview is shown in Figure 39.11. Although the bulk concentration of hydrogen may be expected to be small compared to other potential sources, the literature is virtually unanimous in concluding that gaseous hydrogen can have significant effects on material properties. That said, there is very little unanimity about the magnitudes of these effects. In qualitative terms, the general consensus is shown in Table 39.6. Table 39.6 Effect of Hydrogen on Steel Properties A recent study [34] concluded that strength was largely unaffected by gaseous hydrogen. It was noted that some sources reported a drop in yield strength compared to natural gas, although this was found not to be statistically significant. The same study reported that the reduction in fracture toughness in hydrogen was 35–70% for most of the available data, while ductility decreased by 20–80% and the fatigue crack growth rate increased significantly, with 10-fold increases being reported even for 0.4 bar partial pressure of hydrogen. The recent IGEM hydrogen supplement [27] generally agrees with this estimate of magnitude for the effect on fracture toughness, stating that “in the absence of testing, the fracture toughness in hydrogen service shall be estimated using a full-size equivalent Charpy impact energy equal to the lower of 50% of the specified value and 27 J.” The variability in results reported makes it very difficult to derive hydrogen-affected mechanical properties from in-air testing. It is generally recognized that hydrogen embrittlement is a time-dependent process, as outlined in API 579 [37], which states: Hydrogen dissolved in ferritic steel can significantly reduce the apparent fracture toughness of a material. Fracture initiation is enhanced when hydrogen diffuses to the tip of a crack. If rapid unstable crack propagation begins, however, diffusing hydrogen cannot keep pace with the growing crack; thus the resistance to rapid crack propagation increases with increasing rate and the rate slows to establish equilibrium between the growth rate and the hydrogen delivery rate. Subcritical growth may then continue at the equilibrium rate. But it adds a caveat: “Flaws in hydrogen charged materials should be treated with extreme caution.” Albeit at an early stage, a number of industry research projects are looking into the use of inhibitors such as oxygen introduced into the hydrogen stream [38] or barrier coatings [39] to reduce the embrittlement effects of oxygen. Hydrogen is known to introduce integrity threats into steels, with various different mechanisms having been characterized. Mainly related to cracking, these threats include hydrogen-induced cracking (HIC), principally in the field of sour service, and “cold cracking” resulting from welding. In addition, the phenomenon of high- temperature hydrogen attack (HTHA) is well known, as is the propensity of some metals to form brittle hydrides that can act as focal points for failure. Despite these known threats, there are no known reports of noncracking threats manifesting themselves in existing hydrogen pipelines. For some of these threats, this appears to be because the mechanism is not plausible under “normal” pipeline-operating conditions. The threat of HTHA, for example, is conventionally assessed using Nelson curves as outlined in API RP 941 [40], and these imply that there is no risk below ~250 °C. Even though the lower temperature limits in the carbon steel Nelson curves have been questioned recently following the Tesoro incident [41], the most conservative interpretation from the U.S. Chemical Safety and Hazard Investigation Board (CSB) prohibited the use of carbon steels above 204 °C, which is significantly above transmission pipeline temperatures. Equally, although some metals are known to form brittle hydrides (e.g., titanium or tantalum), it is fortunate for the linepipe industry that these mechanisms are not thought to be energetically favorable in carbon steel. Hydrogen cracking is a more pernicious threat, since it is known from experience that hydrogen can cause HIC or weld cracking in steels. Nevertheless, there are no reported instances of cracking resulting from gaseous hydrogen service. The reason behind this probably lies in the truism that, for hydrogen cracking to manifest, three things are necessary: Although the exact amount of absorbed hydrogen expected from gaseous hydrogen and the relative magnitude of this compared to other potential sources (e.g., sour service or hydrogen originating from welding processes) remain a subject of much research, it appears clear that the bulk concentration of hydrogen resulting from the absorption and dissociation of gaseous hydrogen is significantly lower than that expected from other possible sources [34]. It therefore appears plausible that, unless the microstructure is very susceptible (e.g., untempered martensite), direct cracking resulting from gaseous hydrogen exposure is unlikely. A consequence of the above is that it appears unlikely that hydrogen can introduce threats to transmission pipelines that are new when compared to hydrocarbons; any change in the probability of failure must result from a change in susceptibility to existing threat mechanisms. Knowledge of the existing anomaly populations in a pipeline is therefore critical when evaluating repurposing threats. Table 39.A (Appendix 39.A) outlines the likely impact of hydrogen on existing integrity threats, driven both by the impact on mechanical properties as discussed earlier as well as by potential synergies with existing environmental cracking mechanisms (an area that requires more research to quantify). Generally, in natural gas transmission service, external metal loss and third-party damage represent the primary integrity threats, with external stress corrosion cracking (SCC) and geohazards (e.g., pipeline movement) also a concern but less common. Although these threats still remain (albeit escalated in the case of third-party damage due to the greater propensity for cracking and subsequent fatigue crack growth), it is clear that a wider set of threats require consideration when appraising the feasibility of repurposing or the subsequent integrity management of a hydrogen pipeline. Of particular note is fatigue crack growth of existing planar (crack-like) features, which could present a particular issue for older lines where seam-weld and girth-weld defects tend to be more prevalent [42]. Figure 39.12 Illustrative tolerable axial crack sizes for a large-diameter transmission pipeline. (Reference [42]/Elsevier/CC BY 4.0.) The impact of hydrogen embrittlement is illustrated in Figure 39.12 which considers a 914-mm diameter, 12.7-mm wall thickness L450 (API 5L X65) pipeline operating at 90 bar (72% SMYS)—typical of the existing European large-diameter gas transmission pipeline infrastructure. Two toughness cases are selected for a parent material representative of modern high-toughness pipeline steel (proxy for high toughness was a high upper-shelf Charpy impact energy of 150 J) and a value of 20 J representative of older, lower-toughness material. The series shows the tolerable axial cracking envelope calculated using BS 7910:2019 fracture mechanics methods for natural gas service (“original” series), and the effects of embrittlement are modeled with a reduced 50% fracture toughness in 100% hydrogen (“hydrogen” series). It can be seen that tolerable crack depths are reduced significantly in both cases due to the introduction of hydrogen; however, the impact is more pronounced for the lower starting toughness (20 J case). This is primarily due to the dominance of the fracture rather than collapse-controlled failure mode at lower toughness. Further calculations carried out for cracks at the longitudinal seam weld and circumferential girth weld showed even smaller critical crack sizes due to a lower starting toughness and the potential presence of welding residual stresses. Figure 39.13 indicates that the fatigue crack growth law presented in ASME B31.12 results in orders of magnitude higher crack growth rates than the “in-air” laws from BS7910 traditionally used for natural gas service. Table 39.7 presents the results of a BS7910 fatigue crack growth analysis for the illustrative transmission pipeline defined for Figure 39.12. A 125 N/mm2 daily hoop stress fluctuation has been applied, which is typical for a natural gas transmission pipeline for a 5% through-wall “N5” and 10% “N10” starter crack. A minimum 10-fold reduction in fatigue life can be seen in hydrogen compared to air. It should be noted that the additional pressure fluctuations caused by an increased requirement for line packing in hydrogen were not taken into account, which would further affect fatigue lives. Figure 39.13 Fatigue crack growth laws in hydrogen and air. (Reference [42]/Elsevier/CC BY 4.0.) Table 39.7 Illustrative Fatigue Lives (Years) for Large-Diameter Transmission Pipeline Source: Adapted from Ref. [42]. Reduced critical defect sizes and high fatigue crack growth rates have a compound implication for practical anomaly management, particularly for repurposed pipelines that may already have extensive existing “hydrogen-sensitive” anomaly populations. These implications are both in terms of the performance capabilities of current detection NDE technologies (including ILI) to detect anomalies at a subcritical stage and the significantly higher fatigue crack growth rates leading to shorter remaining lives for crack-like anomalies. Clearly, the criticality of the integrity threats in a repurposed pipeline is pipeline-specific and driven by material properties, existing anomaly populations and operational conditions. A robust knowledge of all three elements is essential to support not only the upfront risk-based justification that the pipeline is suitable for conversion but also the ability to manage the integrity of the pipeline postconversion. Notwithstanding the need for a pipeline-specific assessment when considering repurposing, it is possible to perform a high-level comparison of existing pipelines compared to new pipelines. By definition, existing pipelines will be older than new pipelines. The suitability of existing pipeline inspection technologies, particularly ILI, to support the overall integrity management of hydrogen threats is the subject of extensive industry research right now. Additional considerations are the likely higher flow velocities (estimates of 2–3 times those of natural gas for the equivalent energy throughput [43]) required for hydrogen, impacting tool dynamics, drive element sealing and wear, and metallic and nonmetallic component material compatibility. High-pressure hydrogen transmission pipelines may suffer from leak or rupture failure modes with large releases of product that may or may not ignite. Distribution pipelines are operated at lower pressures, so failures are typically smaller leaks that may go undetected. A loss of containment may result in product entering into buildings or structures, causing gas build-up and subsequent ignition within a confined space. As with natural gas, pipeline rupture ignition scenarios dominate the contribution to risk, with the two subsequent effects being overpressure from the initial explosion and the thermal radiation from the subsequent jet fire. For hydrogen, overpressure effects are not considered to be a significant contributor to risk when compared with thermal radiation [44]. The addition of hydrogen increases the likelihood of ignition from a release due to the lower minimum ignition energy of air mixtures when compared to natural gas. Desktop risk modeling using experimental data indicates that individual risk in close proximity to the pipeline (<20 m) will likely exceed that of an equivalent natural gas line due to the increased probability of ignition of smaller failures (e.g., punctures) [43, 44]. Interestingly, this modeling indicates that the lower density of hydrogen results in lower mass flow release rates and more rapid decompression characteristics above a concentration of around 20 mol% hydrogen in methane. It leads to a far steeper decay in lethality (probability of a fatality caused by a potential pipeline failure) and therefore overall individual risk from larger failures, as distance, increases from the pipeline when compared with natural gas, as shown in Figure 39.14, where lethality versus distance is plotted in meters. Both ASME B31.8 and ASME B31.12 (PL3-5) require assessment of the number of buildings intended for human occupancy along a ¼ mile corridor with the pipeline at its center to determine location class. Higher location classes place further local restrictions on the allowable design factor in addition to the material-based restrictions discussed in Section 39.3.2.2. Class 4 is the most restrictive, limiting the design factor of 0.4 (i.e., 40% SMYS). Locations of dense population concentrations, such as multiple-dwelling unit buildings, schools, hospitals, and recreational facilities are also required to meet Location Class 4 requirements (PL-3.3.2). The B31.12 calculation of potential impact radius (PIR) in PL 3-5 uses the approach presented in the natural gas integrity management code ASME B31.8S but with a modified formula reflecting the differences in ignition characteristics of hydrogen. In line with B31.8, infringement of normally occupied buildings on the PIR requires the use of quantitative risk assessment techniques to demonstrate acceptable individual and societal risks, as covered in the EIGA/AIGA/CGA guidelines [22–24]. Figure 39.14 Lethality versus distance in meters from pipeline, for rupture ignition from pipeline for 66 bar transmission pipeline. (Reference [44]/Elsevier/CC BY 4.0.) Clearly, the embrittlement effects of gaseous hydrogen already discussed increase the susceptibility to brittle or ductile fracture propagation and therefore increase the likelihood of these high-consequence rupture failure modes. The material characterization requirements outlined in B31.12 (see Section 39.3.4 Repurposing of Pipelines to Hydrogen) are directly intended to address fracture propagation and ductile fracture arrest, specifically the requirements for minimum Charpy impact energy for both Option A and Option B design routes. Although these requirements are undoubtedly achievable for new pipelines manufactured to the latest industry standards, this may not be the case for older pipeline steels, particularly vintages known for low-toughness welds, such as low-frequency electric resistance welded (ERW) linepipe. As discussed in Section 39.4, ASME B31.12 restricts the design factor to 0.4 (i.e., 40% SMYS) at all points in the line where materials cannot be qualified to limit the probability of rupture. ASME B31.12 currently has limited specific guidance over and above that contained in the ASME B31.8S natural case code for the integrity management of hydrogen pipelines. The impact of hydrogen on integrity management has, however, been investigated in a number of publications [29, 42]. As would be expected, due to the current limited industry experience with the design, operation, and integrity management of hydrogen pipelines, uncertainties still exist, particularly in terms of being able to accurately predict material property degradation across the wide range of pipeline steel microstructures for both pure hydrogen and blends. The pipeline industry has traditionally validated and iterated its defect assessment techniques through decades of operational and integrity management experience. Conservative assumptions surrounding key assessment parameters can be made because “we know it works” in practice. This “confidence” does not yet exist for hydrogen pipelines and is inherently more difficult to achieve due the significant shift toward microstructural sensitivity of anomalies; two identical anomalies in neighboring joints of the same nominal pipe grade, diameter, and wall thickness could differ significantly in terms of failure pressure. Extending this, the applicability of many of the semiempirical assessment models currently used for natural gas defect assessment are underpinned by the key assumption of “ductile” material, meaning their validity for use in hydrogen requires further consideration [42]. The current uncertainties surrounding material response in hydrogen effectively promote a greater need for pipeline-specific material test data in hydrogen to be able to make reliable data-driven integrity management decisions, regardless of the level of material knowledge required from a design code compliance perspective. This is the case particularly for pipelines operating at high design factors with likely reduced critical defect sizes but also potentially for pipelines repurposed under the B31.12 “Option A” design route operating at lower utilization but with significant existing defect populations. Adopting risk-based inspection best practices for integrity management planning, smaller critical crack defect sizes and higher fatigue crack growth rates will most likely drive shorter inspection intervals for cracks and geometric defects [43]. Shorter intervals will also assist in accelerated validation and, ultimately, in improved predictive desktop approaches. Similarly, surveillance for evidence of third-party activity will also likely increase in frequency. Inspection and surveillance should also be supported by higher-frequency sampling and analysis of operational pressure data—more analogous to that undertaken for the management of fatigue cracking in liquid pipelines—to reflect the increased impact of pressure fluctuations (planned or unplanned) on fatigue crack growth. Given the higher predicted flow velocities for hydrogen service, monitoring of additional threats, such as mechanical vibration and internal erosion, may also be required. Considering the integrity management of wider pipeline infrastructure, increased failure frequencies and ignition probability will most likely drive higher performance requirements in terms of let-by and closure time for safety-critical mainline valves intended to minimize the uncontrolled release of pipeline inventory. This may potentially require the replacement of existing valves during repurposing activities to ensure hydrogen compatibility, as well as more frequent in-service inspection and testing to validate that performance requirements are being met. Written schemes of examination for other pressure-containing assemblies such as pig traps and pipework will also have to be modified to be reflected in the potential material degradation effects of hydrogen on metallic and nonmetallic components [43]. As always, generalizations from an integrity management perspective must be treated with caution because threat criticality will be pipeline-specific based on operating conditions, the environment external to the pipeline, the pipeline condition (i.e., existing anomaly populations), and material properties. Table 39.A Impact on Existing Integrity Threats in Hydrogen Service
39
Hydrogen and the Energy Transition
39.1 Introduction
39.1.1 Colorful Hydrogen
39.1.1.1 Green and Yellow
Property
Hydrogen
Comparison
Density (gaseous)
0.089 kg/m3 (0 °C, 1 bar)
1/10 of natural gas
Density (liquid)
70.79 kg/m3 (−253 °C, 1 bar)
1/6 of natural gas
Boiling point
−252.76° C (1 bar)
90 °C below liquid natural gas (LNG)
Energy per unit of mass (LHVa)
120.1 MJ/kg
3× that of gasoline
Energy density (ambient cond., LHV)
0.01 MJ/L
1/3 of natural gas
Specific energy (liquefied, LHV)
8.5 MJ/L
1/3 of LNG
Flame velocity
346 cm/s
8× methane
Ignition range
4–77% in air by volume
6× wider than methane
Autoignition temperature
585 °C
220 °C for gasoline
Ignition energy
0.02 mJ
1/10 of methane
39.1.1.2 Blue and Turquoise
39.1.1.3 Pink, Purple, and Red
39.1.1.4 White
39.1.1.5 Gray, Brown, and Black
39.1.2 Current Hydrogen Demand
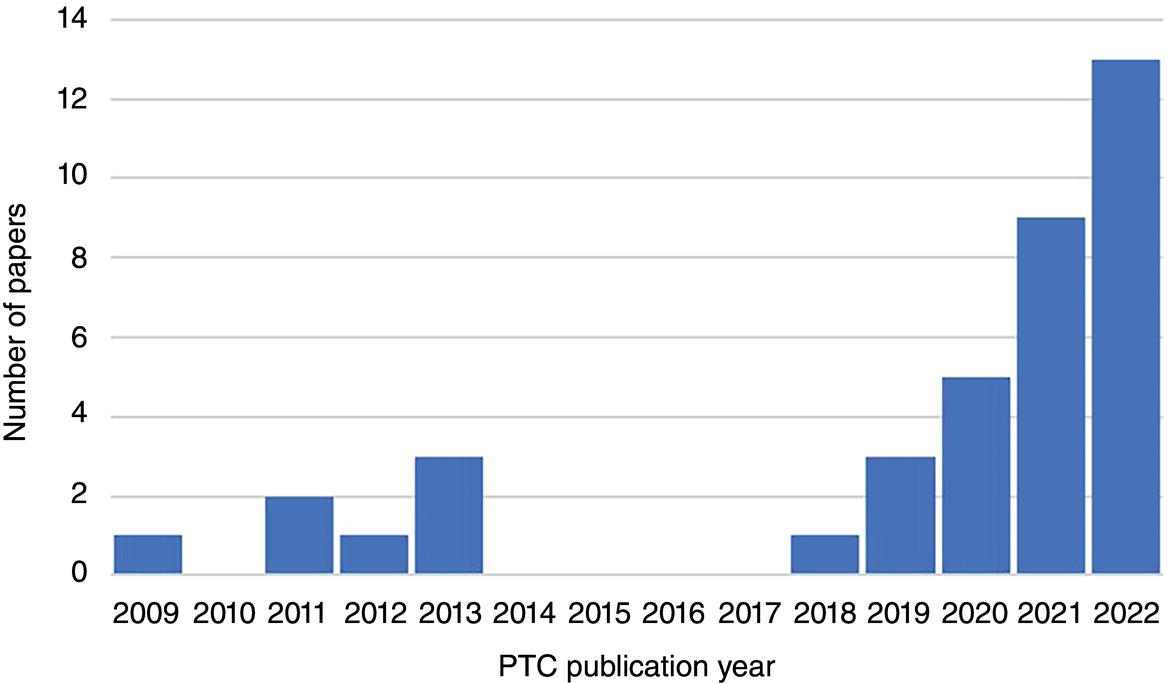
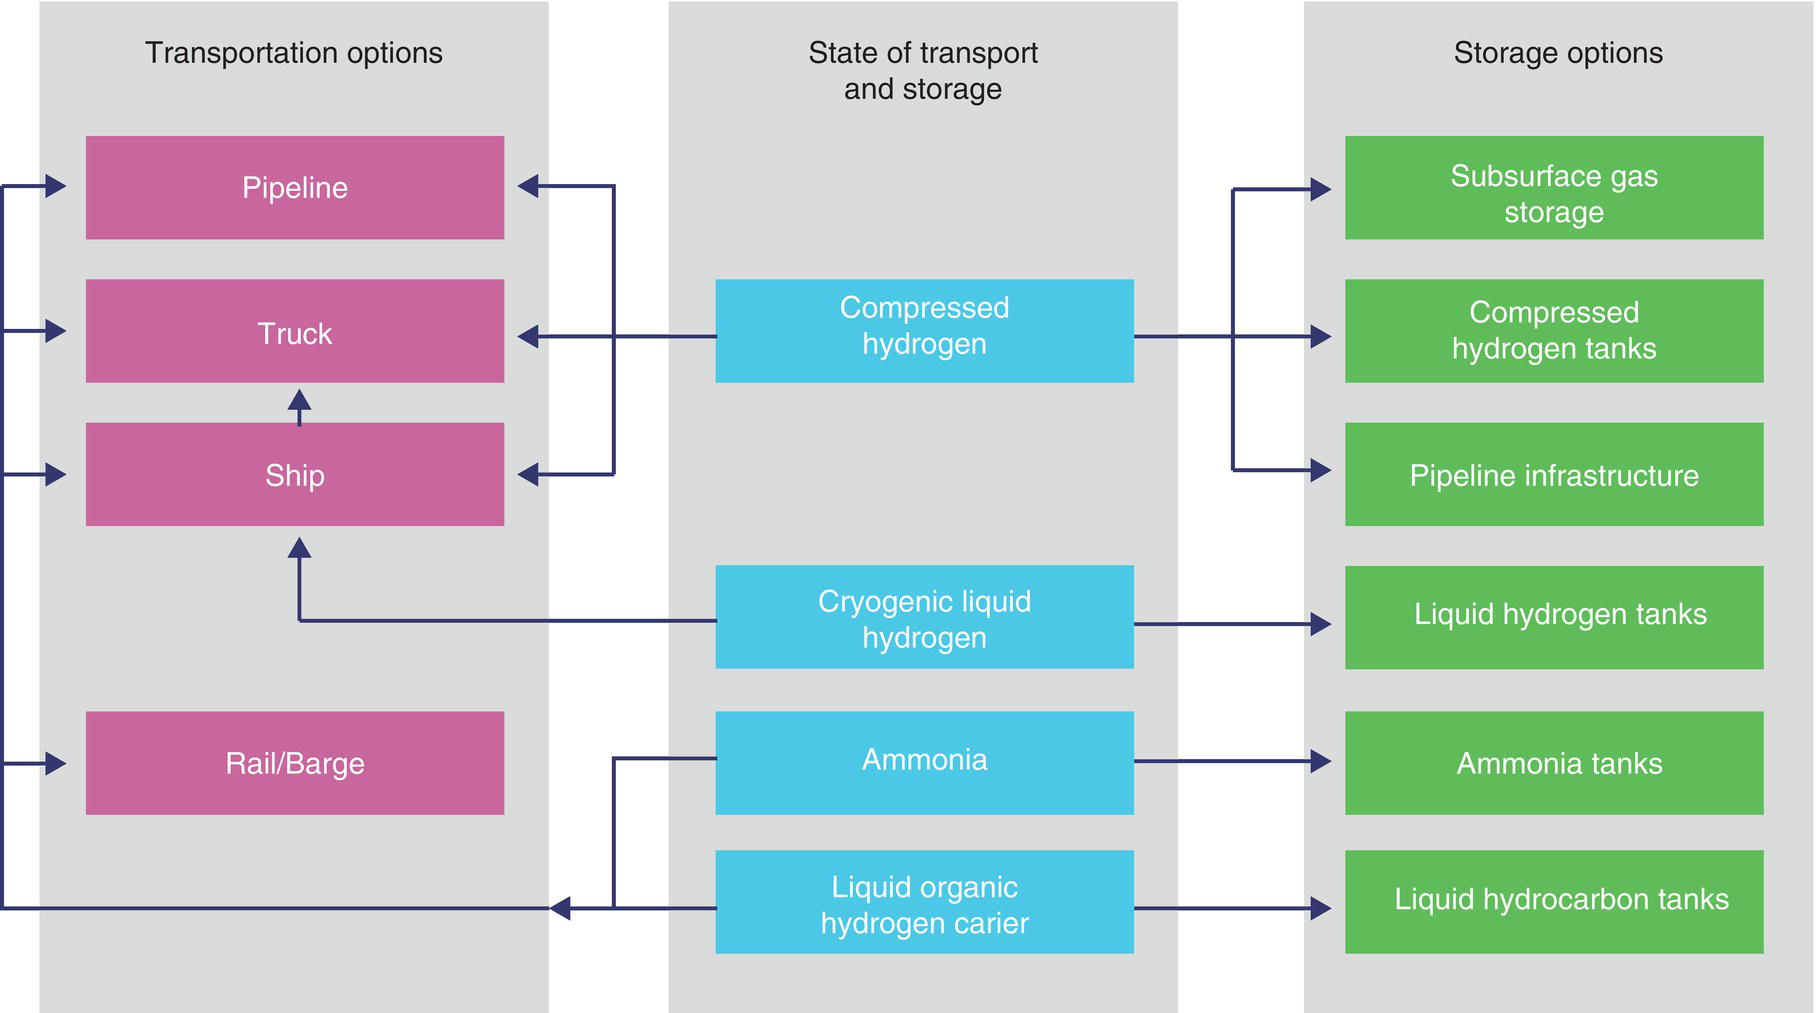
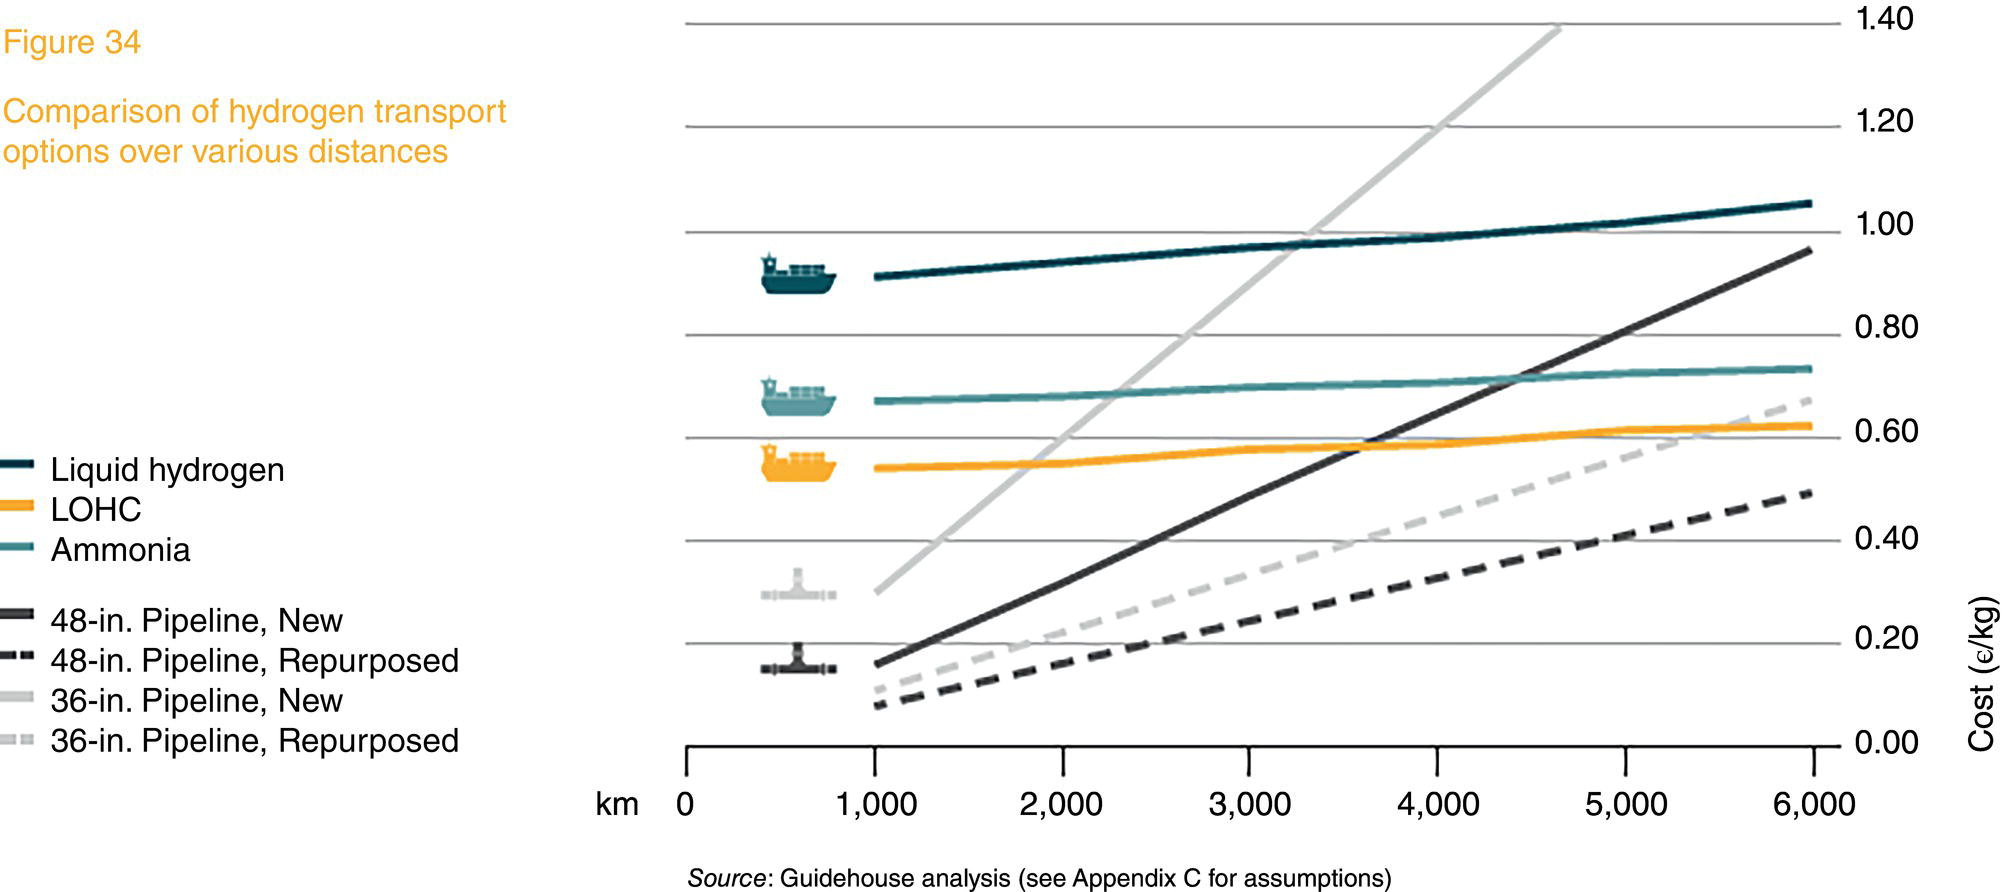
39.1.3 The Future of Hydrogen
Sector
% of Current Global Demand
Role of Hydrogen
Oil refining
33
Primarily to remove impurities from crude oil and upgrade heavier crude (the process of converting bitumen to synthetic crude that can subsequently be refined); used in smaller volumes for oil sands and biofuels
Chemical production
40
Ammonia and methanol production; also various other small-scale processes
Iron and steel production
3
7% of existing primary steel is produced via direct reduced iron, which requires hydrogen; also produced and used in conventional integrated steel mills
Industrial applications requiring high-temperature heat (excluding chemicals and iron/steel)
21
Principally cement manufacturing; mainly uses by-products or excess hydrogen from chemical or iron and steel sectors
Region
Miles
km
The United States
1621
2608
Europe
993
1598
Rest of world
209
337
Total
2823
4543 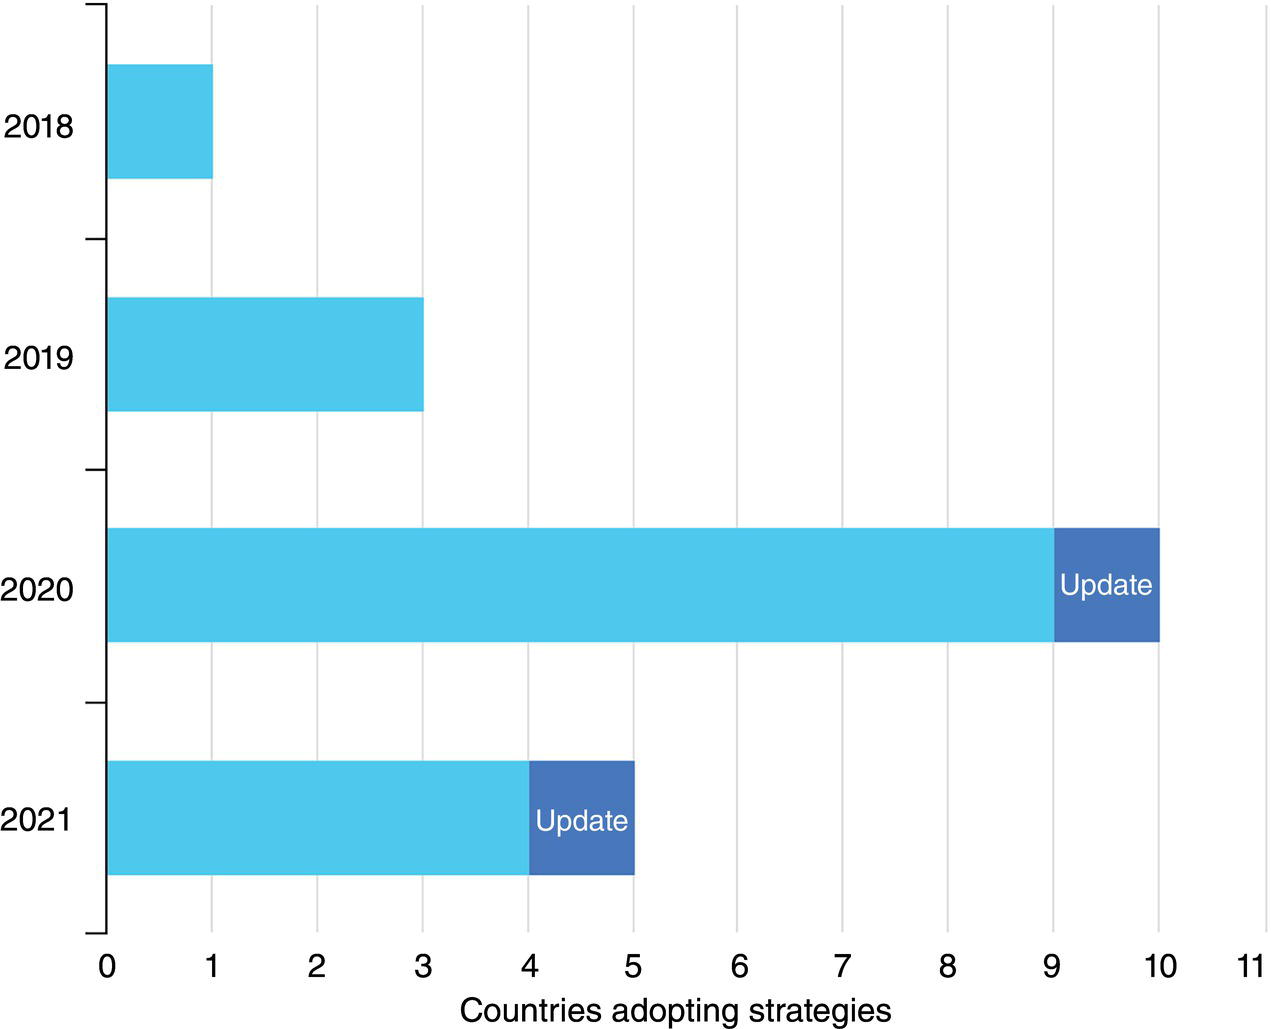
39.2 Hydrogen Storage and Transport

39.3 Designing or Repurposing a Hydrogen Pipeline
39.3.1 Materials of Construction
39.3.2 Design Pressure
39.3.2.1 Design Pressure for Hydrogen Pipelines from ASME B31.12
39.3.2.2 Design Pressure for Natural Gas Pipelines from ASME B31.8
Location Class
ASME B31.8
ASME B31.12 Option A
ASME B31.12 Option B
Cl. 1 Div. 1
0.80
–
–
Cl. 1 Div. 2
0.72
0.50
0.72
Cl. 2
0.60
0.50
0.60
Cl. 3
0.50
0.50
0.50
Cl. 4
0.40
0.40
0.40
Specified Min. Strength (ksi)
System Design Pressure (psig)
Tensile
Yield
<=1000
2000
2200
200
2600
2800
3000
66 and under
<=52
1.0
1.0
0.954
0.910
0.880
0.840
0.780
Over 66 through 75
<=60
0.874
0.874
0.834
0.796
0.770
0.734
0.682
Over 75 through 82
<=70
0.776
0.776
0.742
0.706
0.684
0.652
0.606
Over 82 through 90
<=80
0.694
0.694
0.662
0.632
0.610
0.584
0.542
39.3.3 Construction Welding
39.3.4 Repurposing of Pipelines to Hydrogen
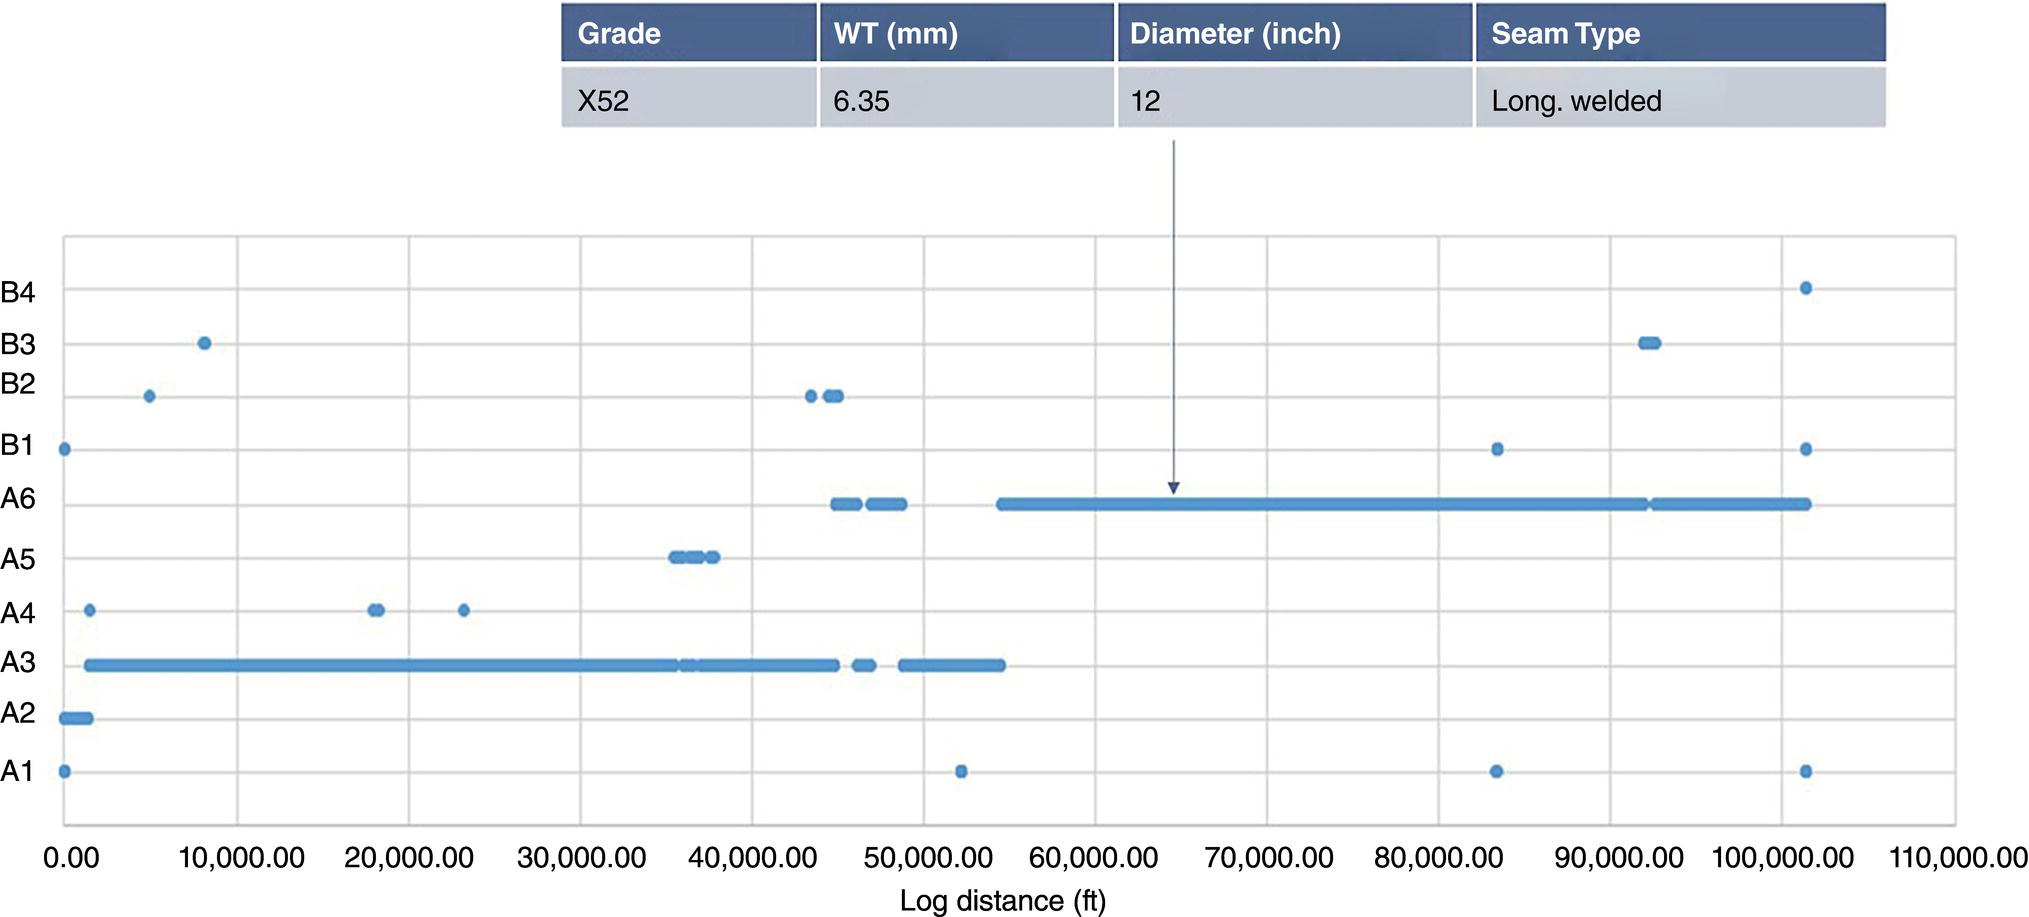
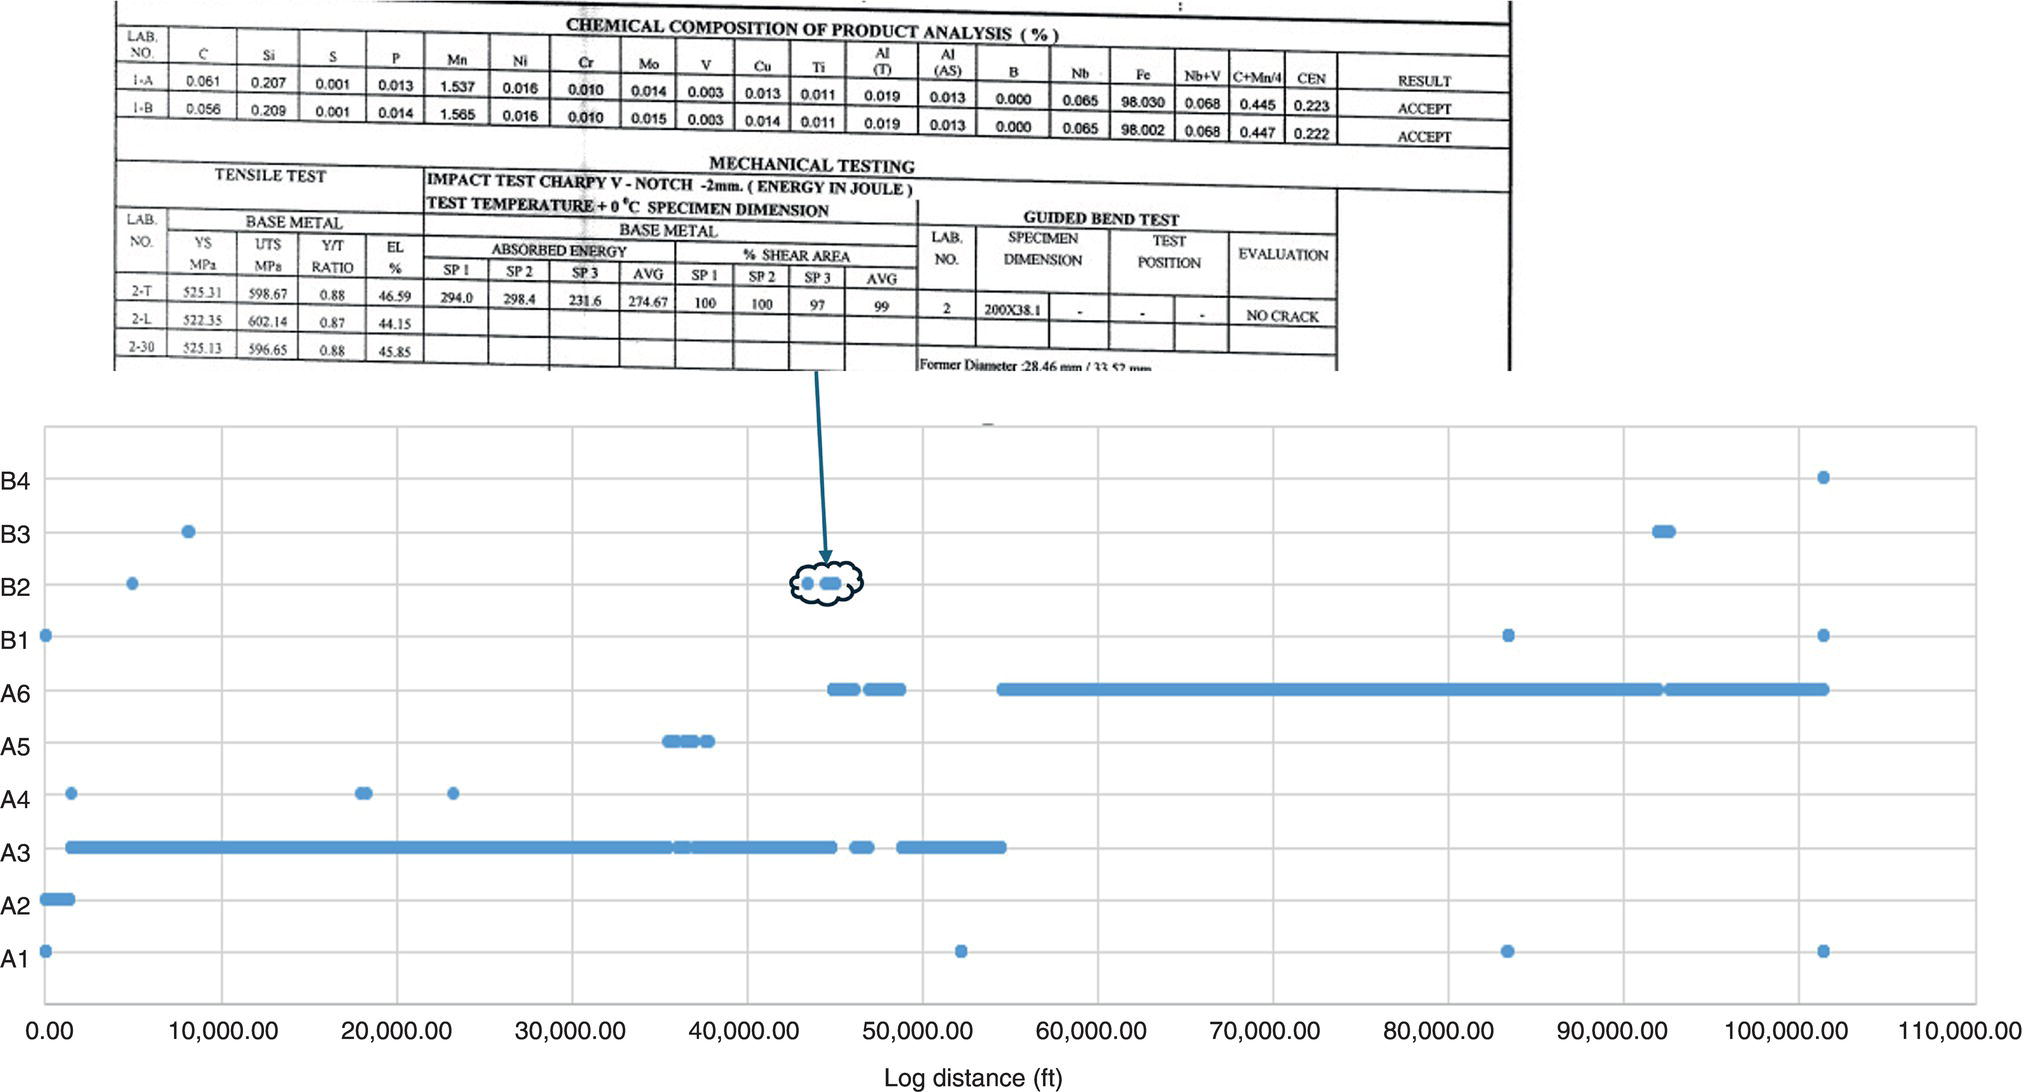
39.3.4.1 “Intelligent” Pipeline Material Characterization
39.4 Differences in the Integrity Management Approach Between Hydrogen and Natural Gas Pipelines
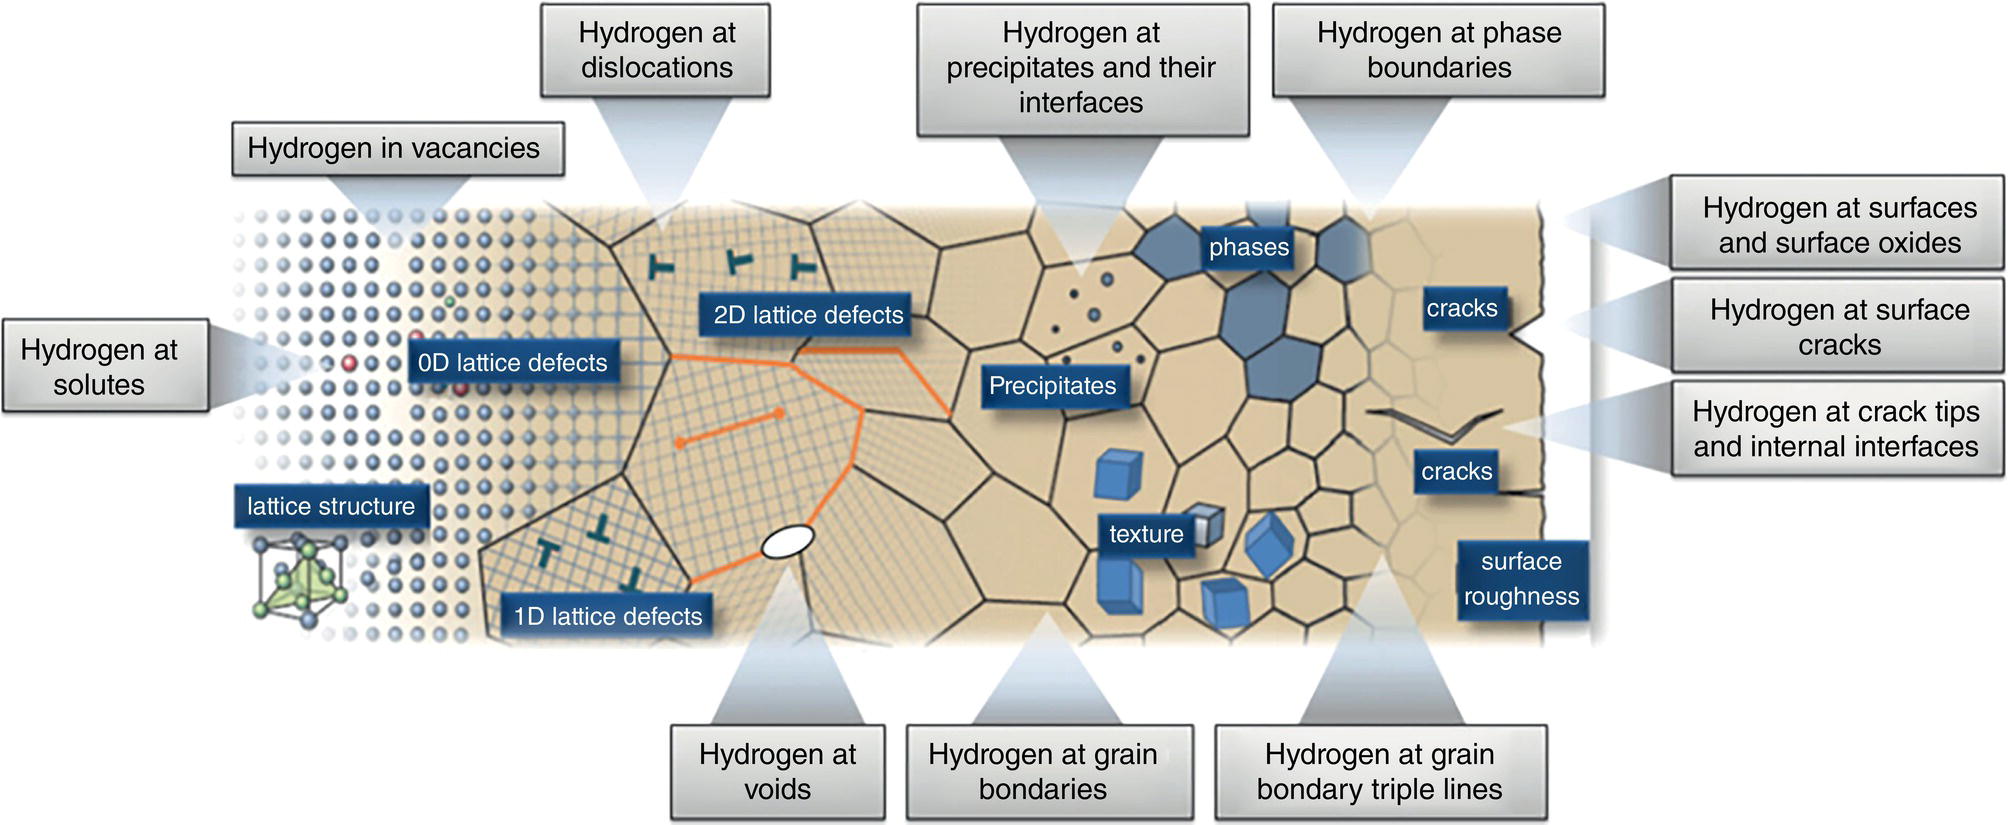
39.4.1 Probability of Failure
39.4.1.1 Effect of Gaseous Hydrogen on Mechanical Properties
Mechanical Property
Effect of Hydrogen Compared to Natural Gas
Strength
↔
Ductility
↓
Fracture toughness
↓
Fatigue crack growth rate
↑
39.4.1.2 New Threats Arising from Hydrogen Service
39.4.1.3 Impact on Existing Integrity Threats
Growth Law
Transmission N10
Transmission N5
Air, 2-stage
656
2600
Air, upper bound
388
640
ASME B31.12 hydrogen
50
149
39.4.2 Consequence
39.4.3 Implications for Integrity Management in Hydrogen
Appendix 39.A
Threat Type
Relevant Anomaly Type(s)
Likelihood of Threat Escalation in Hydrogen
Focus as Part of Current Natural Gas Pipeline Integrity Management Systems?
Impact on IM Activities for Hydrogen Repurposing and Operation?
External metal loss
Corrosion, volumetric manufacturing flaws
Unlikely
Yes
Unlikely
Internal metal loss
Corrosion, volumetric manufacturing flaws
Unlikely (assuming compositional control of hydrogen)
Yes
Unlikely
Third-party damage
Dents, gouges, ground loading
Likely (lower strain capacity and higher propensity for fatigue crack growth)
Yes
Deeper understanding of existing data required:
Detection and monitoring of smaller dents, gouges and geometric anomalies (note: gouges and dent/gouge combinations prohibited by ASME B31.12)
Geohazards
Pipeline movement, buoyancy issues
Possible (in the presence of crack-like anomalies or low-toughness materials)
Yes
Deeper understanding of existing data required:
Overlaying geohazard stresses with other anomaly types to accurately quantify their stress state and therefore criticality (crack-like, metal loss, dents)
Subcritical crack growth due to hydrogen embrittlement
Existing axial and circumferential cracks and crack-like anomalies
Crack-like manufacturing imperfections in parent, seam and girth welds
Especially in low-toughness regions or locations of high residual stress (e.g., locked-in construction stresses, welding residual stress)
Hard spots
Likely (especially where low-toughness materials are present)
Higher likelihood of ductile or brittle fracture propagation
Rarely; some examples of CP overprotection leading to embrittlement and interaction with preexisting anomalies
Additional anomaly management strategies required:
Component-level understanding of material toughness in hydrogen required to calculate critical defect sizes
Identification of local stress concentrations (roof-topping, ovalization, etc.) that will further reduce critical defect sizes
Critical defect size also sensitive to the presence of residual construction stresses (e.g., weld residual stresses) or locations with global operating stress variations (e.g., installation tie-ins)
Fatigue cracking
Existing axial and circumferential cracks and crack-like anomalies
Crack-like manufacturing imperfections in parent, seam and girth welds
Especially in low-toughness regions or locations of high residual stress (e.g., locked-in construction stresses, welding residual stress)
Hard spots
Likely (dependent on operational regime for crack growth rate and material toughness for critical defect size)
Not usually a concern due to low stress cycling magnitudes and associated low natural gas crack growth rates
Additional anomaly management strategies required:
Identification of additional anomaly types sensitive to fatigue crack growth required (crack-like and hard spots)
Identification of low-level stress concentrations required (roof-topping, ovalizations) that will further accelerate fatigue crack growth
Higher-resolution pressure cycling data potentially required to capture more frequent pressure swings in hydrogen
Environmental cracking (internal/external SCC, HIC)
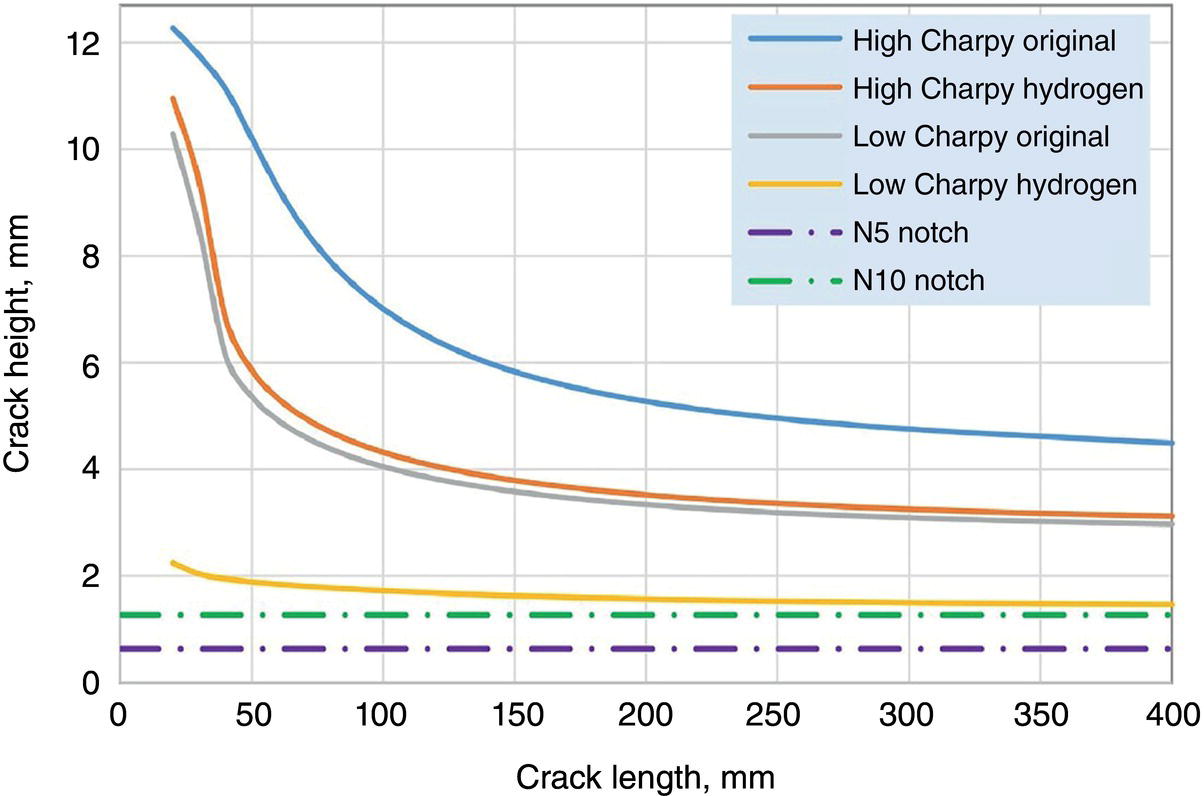
Combination of susceptible material microstructure, high stress and presence of external corrosion
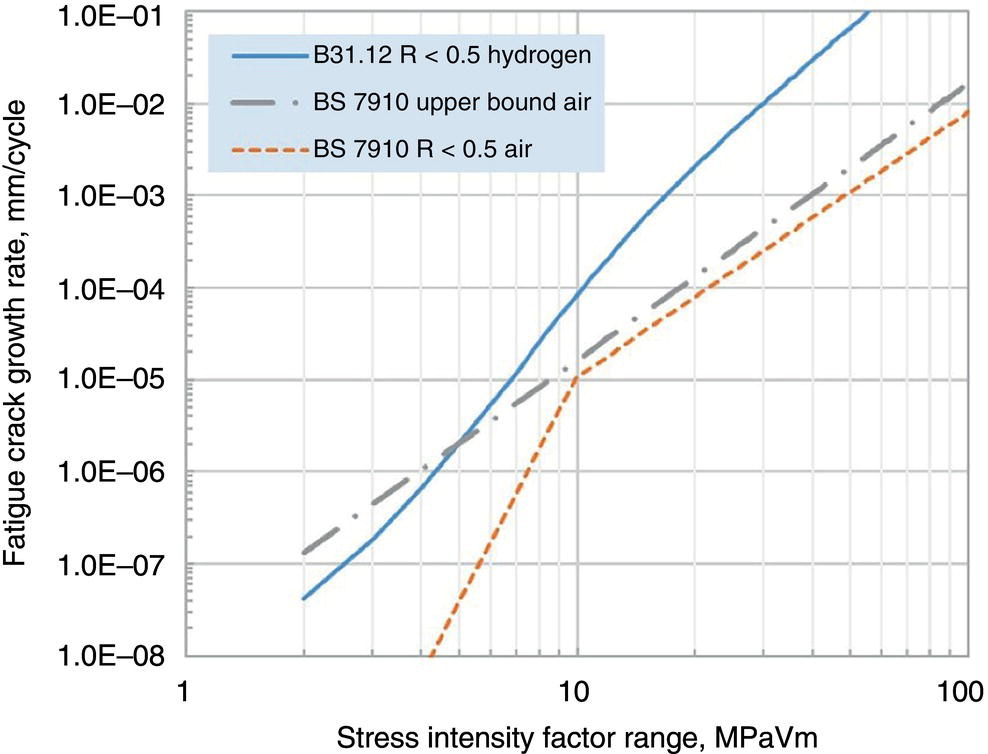
Possible (synergies with transmission of internal hydrogen not yet fully understood)
Susceptibility to external SCC escalates with higher operating stresses, which may be required in hydrogen (e.g., pressure)
Yes; significant global experience of SCC management in gas transmission systems
Identification of presence and location of low-toughness materials, crack-like anomalies and hard spots required
Detailed identification of external coating type and disbondment
Detailed assessment of SCC susceptibility under new operating conditions
References