Pablo Cazenave, Katina Jimenez, Ming Gao* and Ravi Krishnamurthy Blade Energy Partners Ltd., Houston, TX, USA In January, 2018, a 22-in. onshore natural gas transmission pipeline, operational since 1960, suffered an in-service rupture. The rupture was traced to an axial crack located 150 km (93 miles) downstream from the nearest compression station. Concurrently, while investigating the root cause of the rupture, excavations were conducted at locations approximately 42 km (26 miles) downstream of the rupture. These excavations revealed the presence of leaks originating from predominantly circumferential crack colonies, often intermixed with spiderweb-like cracks that were not associated with hard spots. This investigation identified the primary cracking mechanism responsible for both the in-service rupture and the leaks as hydrogen environment-assisted cracking (HAC). Significantly, the cathodic protection system generated hydrogen contributing to this phenomenon. The root cause for these failures was a combination of aged and defective coating and a cathodic protection (CP) system operated for decades at a pipe-to-soil potential near −1200 mV CSE. The extensive review of the literature revealed that this investigation represents the first fully documented instance of an onshore transmission pipeline failure due to HAC driven by CP. Notably, the cracks occurred in the pipe body, made of X52 steel, away from welds, and unrelated to hard spots. In addition, a European natural gas pipeline operator requested the authors to conduct a comprehensive integrity assessment concerning axial and circumferential cracking identified in two segments of an operating natural gas pipeline. These segments are integral parts of a 36″ and 38″ natural gas transmission pipeline, spanning approximately 490 km. The pipeline has operated for nearly five decades since its construction between 1972 and 1973. The pipeline is designed to operate at 55/60% of its specified minimum yield strength (SMYS). The pipe body is coated with extruded polyethylene (PE), while most girth welds are protected with polyethylene tape wrap. Additionally, the pipeline has external corrosion protection through Impressed Current Cathodic Protection (ICCP) systems installed along its length. The pipeline system was inspected between 2009 and 2013, utilizing an ultrasonic crack detection In-Line Inspection (ILI) system aimed at axial cracking. In the subsequent excavations, axial and circumferential cracks and crack fields were discovered near the girth welds. In 2017, two specific pipeline sections underwent a more rigorous ultrasonic crack detection ILI for both axial and circumferential cracks, with all inspections performed in water. Subsequent assessments revealed the presence of axial and circumferential cracks, predominantly clustered in the vicinity of girth weld locations. The pipeline operator suspected the cracking was related to Near Neutral pH Stress Corrosion Cracking (NNpHSCC) mechanism as the primary cause. Notably, these crack fields were also identified in areas with dents, further suggesting the involvement of the NNpHSCC cracking mechanism. However, the findings derived from the metallographic and fractographic analysis of the axial, circumferential, and spiderweb external cracks in the analyzed samples have led to the conclusion that the underlying crack propagation mechanism is Hydrogen-Assisted Cracking (HAC) or Hydrogen Environmentally Assisted Cracking (HEAC). The review of the historical CP readings at test stations further suggests that the source of the high amount of hydrogen (with high fugacity) is associated with the CP system, mostly compliant with international CP practices but operated at the most negative side of the range of pipe-to-soil potentials over long periods of past operation. These findings are also consistent with the evidence found in a refined-products transmission pipeline in North America. The 50+-year-old 12-in. diameter pipeline transports refined products and is coated with tape. A high number of axial crack colonies mixed with a lower number of circumferential cracks were found in investigation excavations. Axial cracks were identified as Near Neutral pH Stress Corrosion Cracking (NNPhSCC). However, the circumferential cracks had a distinctive morphology inconsistent with NNPhSCC, and further examination concluded that they were consistent with HAC. A later review of the cathodic protection potentials also indicated very negative pipe-to-soil potentials over long periods. This chapter summarizes the approach used for these root cause analyses and presents the key findings. It includes a discussion on the implications for managing the pipeline integrity within the systems and the need for further research to evaluate the effects of hydrogen on other types of cracking. On January 18, 2018, a 22-in. onshore natural gas transmission pipeline within the Buenos Aires Province of Argentina suffered an in-service rupture. This rupture occurred approximately 150 km (93 miles) downstream from the nearest compression station. The pipeline section is operated by Transportadora de Gas del Norte (TGN) and was constructed in 1960 utilizing API 5L X52 steel. This segment has a nominal diameter of 22 in. (558.8 mm) and a nominal wall thickness of 0.250 in. (6.35 mm). It is coated with asphaltic enamel. The first 118 km (74 miles) were manufactured using longitudinal Electric Flash Welded (EFW) seam welds, while the remaining 34 km (21 miles) are seamless. The joints for both sections were fabricated by A.O. Smith (USA). The design pressure and Maximum Allowable Operating Pressure (MAOP) for this section both stand at 59.8 kg/cm2 (850 psi), equivalent to a hoop stress of 72% of the Specified Minimum Yield Strength (SMYS). Following the pipeline rupture incident, TGN conducted an on-site inspection and investigation, which led to the recovery of two pipe fragments, as depicted in Figure 70.1. The rupture’s origin was identified, tied to two deep external axial cracks occurring at the 3:00 orientation. An external magnetic particle inspection (MPI) conducted on the pipe’s surface revealed the presence of colonies of axial cracks close to the fracture edges. Approximately two months after the rupture event, while the ongoing root cause analysis was underway, excavations took place 190 km (118 miles) downstream of the compression station and 42 km (26 miles) downstream of the rupture site. The excavations were initiated in response to indications reported by a Hard Spot In-Line Inspection (ILI). Several circumferential crack colonies were exposed during these excavations, often intermixed with spiderweb-like crack formations. Some of these cracks had penetrated the pipe wall, leading to leaks. Subsequent laboratory analyses confirmed the absence of hard spots in these locations. After the in-ditch and on-site investigations, the areas featuring cracks were subjected to further laboratory examination. A comprehensive process involved abrasive blasting to thoroughly clean the entire external surface of the pipes, which were subsequently surveyed using Magnetic Particle Inspection (MPI). This inspection confirmed and documented the presence of cracks and crack colonies. The original pipe (cylinder), as it existed before the rupture, was successfully reconstructed using the collected parts, as shown in Figure 70.2. This process confirmed that all the parts implicated in the rupture had been effectively recovered. The location of the rupture’s origin and the paths of crack propagation were determined by studying the chevron marks on the fracture surfaces. Additionally, the other crack colonies identified through MPI, in conjunction with the relative positions of the seam and girth welds, were mapped, as shown in Figure 70.3. The reconstruction effort unveiled numerous crack colonies, both up and downstream of the rupture origin and across various orientations, as illustrated in Figure 70.4. Fourteen (14) panels were extracted from the sections of the ruptured and undamaged replaced pipe and prepared for root cause analysis. This selection comprised five (5) panels linked directly to the rupture site, while an additional seven (7) panels contained circumferential cracks. Notably, some of these panels exhibited signs of leakage, which had become apparent during excavation. Two (2) panels were derived from sections of the pipe that remained undeformed and free from defects. These undamaged panels were utilized to evaluate the pipeline coating and conduct material testing on the steel. Figure 70.1 Aerial view of the rupture area. Figure 70.2 Reconstruction of the pipe from the ruptured parts. Figure 70.3 Feature mapping. Figure 70.4 Final reconstruction of the pipe failure events. The pipeline section’s protective measures against external corrosion consist of an asphalt enamel coating and Impressed Current Cathodic Protection (CP) systems. It is worth noting that, over time, coatings are prone to developing initial flaws upon application, with additional defects emerging during service. As these coatings gradually degrade, the activity of the cathodic protection system intensifies, aimed at safeguarding against the shortcomings in the coating’s integrity. In some instances, the asphalt coating may impede the CP current. Aging bitumen coatings tend to experience delamination between wraps, potentially allowing water to permeate through these delaminated regions, thereby introducing a shielding effect. However, in most cases, aged asphalt coatings exhibit cracks, permitting CP to reach and protect the exposed metal surface. The effectiveness of the CP current hinges on its ability to establish a pathway to the pipe metal, ultimately elevating the pH of the electrolyte at the metal-environment interface and resulting in the formation of distinctive white deposits on the pipe surface. This electrochemical process associated with the CP induces an alkaline shift in the environment encompassing the pipe, particularly on the metal surface exposed to the environment through imperfections in the coating. In soil and groundwater settings, the dissolution of CO2 leads to the generation of carbonate and bicarbonate ions. Due to the CP reactions, these bicarbonate and carbonate ions interact with minerals such as calcium or magnesium found in underground water, forming insoluble carbonate salts that precipitate onto the metal surface. Often appearing as white or whitish calcareous accumulations, these deposits indicate that CP effectively reaches and protects the steel surface. Throughout the pipeline section, soil resistivity measurements were conducted at 250-m intervals and at depths of 1.5 and 3 m, employing the Wenner 4-probe testing method. At the pipeline’s standard depth of 1.5 m, the resistivity values did not exceed 3099 Ohm-cm. Across 628 measurement points, 35.3% (220 points) exhibited resistivity values below 1000 Ohm-cm, while 64.7% (408 points) fell within the 1000 to 3099 Ohm-cm range. In the areas where the cracks were observed, soil resistivity levels were notably low, ranging between 600 and 1800 Ohm-cm. The soil resistivity values were aggregated with other data later in this section. An analysis of the soil data reveals the following characteristics: a) The soil is predominantly clayish or silty and demonstrates adequate drainage, though it can become saturated with water in clayier regions during the rainy season. b) There is a likelihood of soil contamination, likely stemming from fertilizers, organic and chemical pesticides commonly associated with agriculturally rich areas, as illustrated in Figures 70.5 and 70.6. c) Based on its resistivity profile, the soil adjacent to the verification excavation sites is classified as corrosive to moderately corrosive. In summary, although the soil is corrosive, this type of soil provides less resistance to the CP current, being able to flow and distribute easily through it to protect the pipeline. The evaluation of the coating condition followed a prescribed protocol encompassing the following steps and laboratory tests: The sample received was subjected to a thorough visual inspection of the coating surface and the steel substrate, as shown in Figure 70.8. Figure 70.5 Soils correspond to rich agricultural areas. Figure 70.6 Topography around the rupture area. Figure 70.7 Coating—water absorption test. Figure 70.8 Steel surface condition under the coating. A magnetic thickness gauge measured the Dry Film Thickness (DFT) of the entire coating (asphalt plus fiberglass reinforcement). The average thickness was 3.59 mm, which meets the minimum requirements [1] (2.4 mm ± 0.8 mm) for bituminous coatings. The evaluation of the external surface of the coating found numerous fine cracks and several large cracks in the coating (see Figure 70.9). The adhesion of the coating to the steel substrate was found to be substandard, with the coating exhibiting easy peeling without significant effort. Furthermore, the coating displayed a high degree of fragility, readily disintegrating into small fragments when removed using a spatula. The examination of the internal surface of the coating in direct contact with the steel substrate was conducted under a stereo microscope, as shown in Figure 70.10, where the main findings were: The measurement of coating porosity showed that most of the porosities are found near the internal and external surfaces of the coating, as shown in Figure 70.12. The coating evaluation yielded the following findings: The coating material was identified as asphalt enamel with fiberglass reinforcement. While the coating was found to be hygroscopic, its water absorption capacity was relatively low. The coating exhibited signs of aging, making it highly probable that cathodic current could permeate it to protect the underlying steel. The whitish deposits and crystals in the coating were positively identified as calcite (CaCO3). The coating was prone to easy peeling and fragmentation, indicating its brittleness and poor adhesion to the pipe surface, as depicted in Figure 70.13. The interface between the coating and the metallic pipe surface contained contaminants, including soil and deposits in both whitish and reddish hues. However, no significant corrosion was observed; only superficial oxidation and minor shallow pitting were evident. These findings confirm that the coating has aged and is not a barrier to the cathodic protection system. The absence of substantial corrosion and the presence of whitish deposits provide strong evidence that the pipe has been effectively shielded from corrosion through the applied cathodic protection. Figure 70.9 Optical microscopic images—cracks on the external surface of the coating. Figure 70.10 Stereomicroscopic examination—cracks and fiberglass reinforcement on the inner surface of the coating. The cathodic protection of the pipeline section is achieved through impressed direct-current (DC) systems using the 100-mV polarization NACE criterion. To assess the cathodic protection system’s performance, the following CP data were collected for analysis: Furthermore, a review of the last 10 years’ monthly records of current outputs and ON-OFF potentials measured at the rectifiers indicates continuous operation during this decade, with only occasional short periods of non-operation for some rectifiers. Figure 70.14 shows the ON, OFF (IR-free) surveys and depolarized potentials in the section around the rupture conducted in 2009 and 2015. These data are aligned and aggregated with the soil resistivity, elevation, and depth of external corrosion surveyed by the 2013 ILI (MFL). It is observed that the depolarized potentials vary between −550 and −350 mV CSE and that the 2015 depolarized potential records show a change in the most positive direction around the rupture. Figure 70.11 Porosity and deposits on the coating interface. Figure 70.12 Porosity in the coating cross-section. Figure 70.13 Coating condition and whitish deposits found in excavations. Figure 70.14 CP potentials around the rupture. Regarding the section’s cathodic pipe to soil (P/S) potential levels, they comply with current NACE [2] and ISO [3] practices and recommendations. The graphs of pipe-to-soil potentials (see Figure 70.15) show that in the last ten years, the OFF potentials have been kept very close to the recommended limit of −1200 mV CSE and that the polarization of this pipe section tends to increase over time. In the zone adjacent to the rupture, the OFF P/S potentials increased from −1057 to −1156 mV CSE between 2009 and 2017. When comparing OFF potentials to depolarized potentials, the level of polarization in the area adjacent to the rupture increased. Figure 70.15 Historic OFF and depolarized potentials near the rupture area. It is well-established that cathodic protection reactions lead to hydrogen generation on the metal surface [4]. Hydrogen generation is a natural consequence of the electrochemical processes taking place on cathodically protected pipelines, with the rate of this reaction directly influenced by the applied CP current. Within the cathodic polarization range of −850 to −1200 mV CSE, hydrogen production intensifies as the potential becomes more negative [5]. An analysis of the CP data reveals that the pipe has been cathodically polarized at the test points near the rupture site to potentials ranging from −1057 to −1156 mV CSE. These values are near the established historical and current [4–7] code and standards limit of −1200 mV CSE, without exceeding it. However, it’s worth noting that there is a recent opinion [8] suggesting that polarized potentials more negative than −1050 to −1100 mV CSE may have the potential to induce detrimental hydrogen-related damage to coatings or susceptible steels. In the areas adjoining the leaks, the OFF potentials for 2009, 2014, and 2017 were notably less negative than those observed near the rectifier. Nevertheless, the calculated IR-free potentials for 2016 indicate that the pipeline could have experienced more negative potentials than those recorded in 2014 and 2017. Pressure records were also subjected to a comprehensive review, during which the Cumulative Damage Approach was calculated using the Rainflow and Miner’s Rule methods. The equivalent number of cycles per year was also determined for the rupture location based on hourly pressure records. To facilitate comparative assessments, identical calculations were repeated for other locations within the gas pipeline system. Across all cases, it was consistently observed that the pressure cycling remained low, with a frequency of 13.3 cycles/yr at a pressure range of 300 psi. This finding is consistent with the pressure profile of gas transmission pipelines operating near total capacity. It is worth noting that the likelihood of cracking due to fatigue was deemed improbable, a conclusion that was further corroborated by the metallurgical investigation. Laboratory tests were conducted to assess the line pipe steel’s mechanical properties and chemical composition. Samples selected for mechanical and chemical composition analyses were extracted from the base metal at the rupture and leak locations, ensuring they were free from defects. The following tests were performed to measure the material’s mechanical properties: The testing was performed in triplicate, and the results are presented below. The results of tensile testing are presented in Table 70.1. The Charpy V Notch testing results using 10 mm × 5 mm sub-size specimens are presented in Table 70.2 and plotted in Figure 70.16. Table 70.1 Results of Tensile Testing Table 70.2 Results of Charpy V Notch Testing (10 mm × 5 mm Sub-Size Specimen) Figure 70.16 CVN results—transition temperature. Table 70.3 Hardness Measurements The API 5L specification corresponding with the fabrication time (1958–1960) [12] had no requirements for CVN. The minimum requirements of full-size CVN for present-day line-pipe steels of all grades [13] are 20 ft-lb (27J) for transverse specimens or 30 ft-lb (41J) for longitudinal specimens at 0 °C. The measurements were performed using the Vickers method [14] with 1 kgf and 200 gf loads. The obtained results on the external pipe (OD), mid-wall (MW), and internal pipe (ID) are summarized in Table 70.3. The elastic-plastic fracture mechanics J-R tests were not a fabrication requirement, even for today’s API 5L specifications. The test’s purpose is to provide a material database to verify the observed leak-before-rupture of the circumferential cracks in the pipeline under in-service operational conditions. The database can also be used to predict future rupture conditions (e.g., external bending stresses) for the pipeline as needed. The results are summarized in Table 70.4. The overall fracture toughness of the pipe material is high. At the leak location, it is higher than the one at the rupture location. Table 70.4 Results of J-R Testing at Room Temperature L-C: circumferential; C-L: longitudinal. The pipe material’s chemical composition was determined per ASTM E 415 [15] using a spectrometer. The results are summarized in Table 70.5. The chemical composition complies with the API pipe specifications at the time of manufacture/construction, in accordance with API 5L 1958 edition [12]. In summary, the chemical and tensile test results of the material chemical and tensile test comply with the API 5L specification edition of 1958, at the time of manufacture/construction of the pipeline section. Even though there were no CVN requirements in 1958, the CVN results are slightly low but borderline compliant with the present [13] API 5L requirements. On the other hand, the results of the J-R testing show the material has good fracture toughness. Table 70.5 Chemical Analysis of the Pipe Body Steel No hard spots were found in or around the cracked areas. The hardness measurements are consistent with X52 steels, and the measured hardness in the rupture area is far below HRC = 35 (345 HV10 or 327 HBW) [13]. Consequently, the cause of the cracking is not related to the material’s mechanical properties and is not associated with hard spots. The fractographic and metallographic evaluations included: The precise location of the rupture origin was confirmed by meticulously examining the fracture surface, guided by the chevron marks. Chevron marks were identified on both sides of the origin, consistently pointing toward the origin itself and in the opposite direction of crack propagation, as visually depicted in Figures 70.17 and 70.18. Figure 70.17 Stereo images (composite) of the fracture surface of the rupture. Figure 70.18 Initiation and propagation areas of the fracture surface. Figure 70.19 Depth profile of the initiating defect (in mm and as % of WT). The total length of the rupture origin crack is 221 mm (8.7 in.), and the peak depth is 5.78 mm (91 wt%, 0.228 in.), see Figure 70.19. The rupture origin comprised multiple cracks that ultimately coalesced during the rupture process, resulting in discrete steps between the merged cracks. In addition the cracks responsible for the rupture are situated within the pipe body and are not linked to any welds or corrosion. The samples that contained the origin of the rupture (axial cracks) were cleaned to remove the superficial corrosion deposits and scales, and the fracture surface of the origin near the crack tip was then examined. Figure 70.20 shows the fracture surface morphology of the origin near the crack tip at various magnifications. At higher magnifications, i.e., in Figure 70.20c, d, the appearance of the fracture surface is featured with cleavage facets, which is typical for the cracking of pipeline steels produced by hydrogen embrittlement with high hydrogen fugacity. This type of cleavage facet cannot be produced by corrosion and is inconsistent with those produced by high pH SCC, near-neutral pH SCC, or fatigue. It is noted that cleavage facets were observed near and along the crack-tip region where the fracture surface was most recently formed, with minor corrosion under very negative cathodic potential conditions. Figure 70.21 shows the cleavage facets observed approximately 0.5 mm from the crack tip, while Figure 70.22 shows the cleavage facets observed along the crack tip region. Further EDS analysis of the cleavage facets shows the very thin oxygen film on the facets, as demonstrated by a high peak of iron and a low oxygen peak, and with Mn and Si peaks that are part of the composition of X52. Similar EDS results are obtained from other cleavage facets, commonly showing high iron (Fe) and low oxygen (O) peaks. The findings confirm that these are newly formed cleavage facets with little corrosion, see Figure 70.23. Cracks in the colonies near the rupture initiation were also broken open and examined in SEM for fractography. Figure 70.24 shows the fracture morphology at the tip. The view at higher magnifications of the areas outlined with dotted boxes reveals the presence of microcrystals. Cracks in colonies near the rupture-initiating area were broken open and examined in SEM for fractography. The colonies highlighted in black color are a crack field with an average depth of 1.19 mm (0.046″), while the ones highlighted in white on the right image represent a fresh-open surface in liquid nitrogen (lab rupture, Figure 70.25). Figure 70.20 Fracture surface morphology near the crack tip at various magnifications. (a) 55×, (b) 100×, (c) 1000× (d) 3500×. The EDS spectrum of the microcrystals in Figure 70.26, located close to the crack-tip, shows a large iron (Fe) peak and a very small oxygen (O) peak, suggesting the microcrystals are ferrite without oxide scales. Figure 70.27 shows the fracture morphology at the tip of this crack, outlined with blue dashed lines. The view at higher magnifications of the areas outlined with blue boxes reveals the presence of microcrystals. The EDS analysis performed during the investigation of circumferential cracks in a refined products pipeline in North America showed that these micro-crystals were pure ferrite crystals (Figure 70.28), consistent with the observations in Figure 70.27. This case is presented in detail in Section 70.4.2. It is also noted that the sizes of the microcrystals are in order of magnitude of several microns, which seem to be consistent with the dimensions of sub-grains of ferrite as observed in low-carbon steel. Therefore, these microcrystals found in the present and previous studies might be formed by hydrogen cracking of the sub-grains of ferrite. However, further fundamental research is needed to confirm and understand the observed phenomenon. In addition, micro cracks associated with the inclusion/base-metal interface were also observed. It is commonly known that the interface between inclusion and steel matrix in the steel is a favorable site for cracking because of their differences in elastic modulus and mismatch in crystal structure. Moreover, this interface also acts as a trapping site for hydrogen. This phenomenon is known as Hydrogen Induced Cracking (HIC) [17, 18]. Accumulation of hydrogen molecules in those trapping sites that resulted in the interface cracking is well documented in the literature [19]. Figures 70.29 and 70.30 show the respective optical microscope examination of polished and etched cross-sections of a sample close to the ruptured area, showing microcracks associated with manganese sulfide (MnS) inclusions. Figure 70.21 Cleavage facets observed approximately 0.5 mm away for the crack tip at magnifications of 250×, 500×, 1000×, and 2500×. Figure 70.22 Cleavage facets along the crack tip region—2500× and 5000×. Figure 70.23 EDS spectra. Furthermore, Figures 70.31 and 70.32 show details of the evaluation with an optical microscope of an as-polished cross-section adjacent to the main crack, where numerous microcracks associated with the inclusions of MnS are observed. The figures show optical micrographs of the polished cross-section of axial cracks, where branching features are visible along the main crack path. Multiple crack ramifications and micro-cracks associated with the elongated MnS inclusions are observed at increasing magnification. Figure 70.24 Morphology of crack—micro-crystals on the fracture surfaces at 500×, 5000×, 10,000× and 20,000×. Figure 70.25 Crack C3 break-open at liquid nitrogen temperature, shallow cracks in the colony. Figure 70.26 SEM/EDS analyses for a location close to crack-tip. Figure 70.27 Morphology of crack C3 tip – micro-crystals on the fracture surfaces—500×, 2000×, 10,000× and 20,000×. Figure 70.28 SEM/EDS evaluation of microcrystals. (Reference [16]/with permission of Blade Energy Partners.) Figure 70.29 Microcracks associated with inclusions near the ruptured crack. Figure 70.30 Etched longitudinal cross-section of base metal. Figure 70.31 High concentration of delaminated or microcracked inclusions near the ruptured crack. Figure 70.32 Details of the cracks (etched). Figure 70.33 shows SEM images of the metallographic cross-sections indicating microcracks at the locations of MnS inclusions. A higher magnification shows two micro-cracks associated with the elongated MnS inclusions. These micro-cracks along the metal-matrix/MnS interface would be evidence of hydrogen cracking formed due to absorbed hydrogen atoms, which recombine to form hydrogen molecules at defect sites such as the interface between steel matrix and MnS inclusion. As a result, high pressures are built up at these defects, which lead to micro-cracking. It is important to note that the main cracks did not follow the path of the microcracked inclusions, typical of one type of HIC, indicating that HIC is not a major contributor to the growth of the significant cracks and not the leading cause for the rupture. In the areas of the leaks, the results indicate that none of the cracks are associated with external corrosion. The panels contain multiple circumferential and spiderweb cracks, some through-wall (leaking), as illustrated in Figures 70.34–70.40. Figure 70.33 Microcrack at inclusions. Figure 70.34 Example of circumferential cracks (a) and internal indentations near the cracking area (b). Figure 70.35 Example of circumferential and spiderweb cracks (not through-wall). Figure 70.36 Example of spiderweb cracks (through-wall). Three representative circumferential cracks were extracted from their respective panels: Figures 70.41–70.44 show the locations of the specimens extracted for fractographic and metallographic evaluation. Among them: Figure 70.37 Example of circumferential cracks (through-wall). Figure 70.38 Example of circumferential cracks (not through-wall). Figures 70.45–70.47 show the respective fracture surfaces of the opened cracks for the three representative circumferential cracks. It is seen that the fracture surfaces were covered with thick (black) layers of corrosion products. The original fracture surfaces are obscured. Figure 70.39 Example of circumferential cracks (not through-wall). Figure 70.40 Example of circumferential cracks (not through-wall). Figure 70.41 Example of specimens with circumferential cracks. Figure 70.42 Example of specimens with circumferential cracks. Figure 70.43 Example of specimens with circumferential cracks. Figure 70.44 Example of specimens with spiderweb cracks. Figure 70.45 Crack profile and surface removed from one panel. Figure 70.46 Crack profile and surface removed from the second panel. Figure 70.47 Through-wall crack (leak) removed from the second panel. The leaking crack presents heavily corroded (black) walls. The small leak observed in the excavation confirms that the crack was very tight, partly due to the thick corrosion products. The thick oxide scale and the corrosion deposits on the fracture surface made the leak passageway very tight and, consequently, may have partially blocked and reduced the level/flow of leakage. This fracture surface presents a challenge for revealing/recovering the original fracture surface. Attempts were made to clean and remove the heavy oxide scale with Alconox. However, the cracks’ fracture mode(s) could not be revealed. Therefore, the focus of the investigation was placed on the metallographic examination. The cleavage feature was revealed in a later effort on another sample. Metallographic analyses of the crack paths with respect to the material’s microstructure were conducted to help understand the nature and mechanism(s) of cracking. The cross-section was polished and etched with 2% Nital to reveal the microstructure and examined using an optical microscope (OM), shown in Figure 70.48. Figure 70.48 shows that the cracking is predominantly transgranular with multiple branching features visible. Later SEM observations showed corrosion products along the crack wall. Interface decohesion (microcracks) between inclusions (MnS) and steel matrix was observed on both sides of the main crack path, Figure 70.49. The microscopic analysis showed that cracks frequently ran following the inclusions and oxides. Many of the cracks also exhibited branching. Regions of growth and dormancy were apparent in the cross-sections at the crack tips. Narrower crack cross-sections and sharp crack tips characterize areas of active crack growth. In comparison, regions of dormancy are characterized by broader crack cross-sections and blunt crack tips where corrosion of the crack wall has occurred (Figures 70.48 and 70.49). Figure 70.48 Optical Micrographs (OM)—transversal section. Figure 70.49 Metallograph of an incipient crack emerging from an inclusion. At the high magnifications and as-polished condition, the inclusions existed all along the crack paths, starting from the pipe’s outer surface. As a result, cracks may have the potential to interact with the inclusions present and bifurcate in the lateral direction, as shown in Figure 70.49. As described previously, the leaking cracks’ fracture mode(s) could not be revealed because the corrosion products and their incrustations on the fracture surface were difficult to remove. In addition, no microcrystals like the ones displayed in the rupture were found at the tips of the cracks. Figure 70.50 shows SEM images of the metallographic cross-sections indicating microcracks at the locations of manganese sulfide (MnS) inclusions. Higher magnification of SEM and EDAX below showed two micro-cracks associated with the elongated MnS inclusions. These micro-cracks along the metal-matrix/MnS interface would be evidence of internal pressure caused by hydrogen. The observed micro-cracks imply the presence of hydrogen. Under the very negative cathodic polarization of the pipeline over many years, internal cracks are formed due to absorbed hydrogen atoms, which recombine to form hydrogen molecules at defect sites, such as the interface between the steel matrix and MnS inclusion. As a result, high pressures are built up at these defects, which lead to micro-cracking. The longest and presumably deepest circumferential cracks were opened in the lab at liquid nitrogen temperature to examine fracture surfaces. Again, the black deposits are noted on the exposed crack surfaces. The original fracture surface morphology has been masked by corrosion products, indicating that the crack was dormant and existed for a long time. Moreover, the fracture surface/crack surface was cleaned several times with Alconox, and the oxide scale could not be removed. The cross-section was prepared for metallographic examination using an optical microscope, stereoscope, and a Scanning Electron Microscope (SEM) in combination with a Dispersive X-ray (EDAX). The most significant findings of this investigation are: The external surface in Figure 70.51 presents areas where the cracks run in different directions and are grouped into colonies. It shows a region having a crack morphology similar to a spider web. The cause for these spiderweb-looking cracks is not well identified. In addition, there are no obvious signs of pitting corrosion or (very shallow) general corrosion on the steel surface. Figure 70.52 shows the layout where samples were sectioned for investigation. Two locations were selected as being representative of the various crack features observed. Specimens are shown in: Figure 70.50 EDS analysis of cracks in 6544-D-P2. Figure 70.51 Detail of the spider-web surface crack colonies. Figure 70.52 Extraction of specimens for evaluation of spiderweb cracks. An area with spiderweb-like cracks was opened in the lab at liquid nitrogen temperature. Figure 70.54 shows that the depths of the cracks are superficial with a thick and dark oxide. This suggests that the “spiderweb” crack morphology may be associated with mill-scale defects from manufacturing. The evaluated spiderweb cracks in this area are inactive; all have a thick layer of corrosion at the tip and along the walls. After cleaning with Alconox and Citranox, the oxide was not removed, which masked the fracture surface or surface morphology, indicating that the defect was there for a long time and was not active. The cross-section examination by SEM in Figure 70.55 reveals the crack initiates and propagates from a surface defect. The outer/external surface (OD) was highly disturbed, and the cracks were clogged with oxides, consistent with the OD surface spiderweb crack colony being associated with a mill scale defect. Notably, most defects/cracks of the selected spiderweb sample “B1” were short and did not exceed 0.50 mm in depth, see Figure 70.56. The microscopic examination of another cross-section adjacent to the spiderweb crack colony revealed a longer crack. The crack depth was measured at 1.98 mm (Figure 70.57), with numerous delaminated MnS inclusions (micro-cracks) on both sides of this main crack, consistent with hydrogen-assisted cracking (HAC). The figure also shows the impact marks where the micro-hardness was tested. Figure 70.58 shows multiple crack branches on either side of the main cracks and inclusions along the crack path at different locations, while Figure 70.59 illustrates the crack tip of a dormant spiderweb crack. Another area with spiderweb cracks was evaluated. Figure 70.60a shows the selected spiderweb crack area to be opened at liquid nitrogen temperature, and Figure 70.60b is a stereoscope image of the opened crack fracture surface, showing the spiderweb cracks extended through the wall thickness from OD to ID, with dark color and thick corrosion products. The evidence showed that the crack tip was intimately adhered, which most likely prevented the through-wall spiderweb cracks from leaking. However, some tip areas were relatively fresh, and some corrosion deposits were cleaned and removed, revealing the original fracture surface at and near the tip region. Figure 70.61 shows SEM images showing the fracture surface near the crack tip, consisting of cleavage facets, which are brittle. Still, some of them were attacked by the environment trapped inside of the crack after cracking during service. It is noted that the cleaning agent did not attack the fracture surface because the cleavage facets freshly produced by breaking at liquid nitrogen (LN) temperature were well preserved. Therefore, it was confirmed that the cleaning agent did not attack the fracture surface during the cleaning process. Figure 70.61 shows fracture surface morphologies showing brittle facets produced by the leaking crack. The insert on the top of the picture is the stereoscopic image showing the locations where the SEM images were taken. The fracture facets in the upper right corner (indicated by the arrows) are identified as {100} planes due to the square-shaped etching pits. Figure 70.53 Specimens B1 and B2. Figure 70.54 Cross-section of spiderweb-type cracks. Figure 70.55 (a) Indication of the cross-section location through surface crack colonies for examination. (b) SEM microscopic cross-sectional examination at 700×. Figure 70.56 SEM micrograph shows corrosion products: (a) measured depth 0.258 mm and (b) measured depth 0.460 mm. Figure 70.57 Image in the SEM showing the deepest crack of the cross-sectional of the sample and depth measurement ~2 mm. Mag. 40×. Small square etching pits can also be seen in Figure 70.62, a high magnification of the fracture surface showing the detailed morphology of the brittle facets. The fracture facets on the upper right corner (indicated with the arrows) are identified as {100} plane by the square-shaped etching pits [20]. Small square-shaped pits can also be seen in the other areas of the fracture surfaces. On the other hand, it is noted that the cleavage plane produced by hydrogen embrittlement of carbon steels is {100} plane of ferrite (α-Fe) dominated by the decohesive mechanism [21]. Therefore, it is confirmed that the observed growth of the spiderweb cracking is assisted by hydrogen, i.e., hydrogen-assisted subcritical crack growth. This observation is confirmed by extensive examinations of the fracture surface along the entire crack tip of the spiderweb crack. One of the images is shown in Figure 70.63, which also shows brittle facets and square-shaped etching pits. In summary, the metallographic evaluation of spiderweb cracks of sample B1 showed multiple surface cracks on the OD surface. The cracks are more or less open but are generally developed and propagated in the transverse direction of the pipe axis. The external surface (OD) was highly disturbed, and the cracks were clogged with oxides, consistent with the OD surface spiderweb crack colony being associated with mill scale defects. Optical microscopic and SEM examinations of the cross-sections show numerous delaminated MnS inclusions on both sides of the main cracks, consistent with hydrogen-assisted cracking. In addition, the presence of square-shaped etching pits on the fracture facets of {001}plane of α-Fe at the crack tip confirmed that the observed facets are consistent with the cleavage facets produced by hydrogen. Consequently, the spiderweb cracking is assisted by hydrogen, i.e., hydrogen-assisted subcritical crack growth. The microstructure of the pipe body metal was also analyzed. Metallographic analyses were performed in transverse and longitudinal cross-sections at locations close and far from the crack colonies. Figure 70.64 shows the microstructure of the etched surface of a longitudinal cross-section of base metal in one of the investigated panels, (a) microstructure near OD, (c) microstructure near ID, and (b) microstructure in the mid-wall showing the presence of larger amount of pearlite. Figure 70.58 High magnification image from Figure 57 (500×–5000×). Figure 70.59 The walls and tips of the spiderwebs are corroded, and the cracks are dormant. Figure 70.60 Spider-web crack extracted for evaluation and fracture surface showing that the crack is through wall. Figure 70.61 Fracture surface morphologies showing brittle facets produced by the leaking crack. Figure 70.62 A high-magnification SEM image of the fracture surface at the crack tip. Figure 70.63 Another high-magnification SEM image of the fracture surface at the crack tip. This Widmanstädter microstructure (acicular ferrite with pearlite or pearlite colonies distributed in acicular ferrite matrix, shown in Figure 70.64) differs significantly from the expected microstructure of a typical line-pipe X52 steel, and it was found in all the locations investigated. On the other hand, with the same level of metallographic analysis performed on the liquid pipeline evaluated in a previous investigation [16] (see Figure 70.82 in Section 70.4.2), the observed hydrogen-assisted cracking (HAC) was associated with a non-acicular ferrite and pearlite microstructure. Consequently, more work is needed to understand the relative susceptibility of the microstructure of pipeline steels to hydrogen-induced cracking due to very negative cathodic protection potentials. The same specimens were tested for hardness. Hardness near cracked areas is similar to hardness away from cracked areas and well below the hard spot threshold. Consequently, the hydrogen cracking found in this study is not associated with hard spots. In general, cracks and crack fields observed in the base-metal (pipe body) of transmission pipelines may be classified into two types based on their direction and appearance on a macroscopic scale [22, 23]: Figure 70.64 Metallographic cross-section of base metal in Panel B3. Besides these two categories, two additional morphologies were observed in this investigation: This classification of the crack types does not address the mechanism for cracking because there is no unique correlation between the crack morphology (macro) and the cracking mechanism (micro). For example, crack fields formed by fatigue in dents in liquid transmission pipelines were historically identified as SCC [24]. Since it is essential to understand the cracking mechanism for developing an integrity plan for crack management, the overall goal of the metallurgical investigation is to identify the mechanism for the occurring cracks. Micro-fractographic analyses using Scanning Electron Microscopic (SEM) and Energy Dispersive Spectroscopic (EDS) techniques were applied to evaluate the failure origin and identify the mechanism for crack propagation. In gas pipelines, the possible cracking mechanism for time-dependent failure is one of the following [22–25]: near-neutral pH SCC, high pH SCC, environmentally assisted hydrogen cracking, environmentally assisted fatigue crack growth, or others such as mechanical delayed rupture by plasticity-induced cracking [26–28]. In this investigation, two types of processes of cracking associated with hydrogen were evaluated in accordance with NACE/ASTM G193-20a [29] and other commonly accepted definitions [25,30–32]: Hydrogen Assisted Cracking (HAC)/Hydrogen Environmentally Assisted Cracking (HEAC) is a process in which the growth of a subcritical crack is assisted/enhanced by hydrogen under the conjoint actions of external mechanical loading, chemical/electrochemical reaction, and embrittlement of the material in the fracture zone adjacent to, but ahead of the crack tip [25]. In the process, the hydrogen atoms are adsorbed and absorbed in the crack tip region and diffuse to the fracture zone adjacent-to, the crack tip but ahead-of it, where the triaxiality of the stress is the highest under local loads. The crack propagation is assisted by {001} cleavage plane cracking of metal (atomic) bond at stress levels below or far below the yield strength typically expected for the material [33, 34]. The cracking is characterized by transgranular cleavage or cleavage mixed with quasi-cleavage in low-strength carbon steels, and, in some cases, produces iron (from ferrite) cubic microcrystals [16]. The most common external source of hydrogen in an onshore transmission pipeline transporting treated (clean) hydrocarbons is the electrochemical evolution of hydrogen as part of the outer diameter (OD) surface cathodic reactions. Atomic hydrogen is adsorbed/absorbed at the crack tip, enters the metal, and diffuses to the fracture zone, resulting in hydrogen-assisted subcritical crack growth (HAC/HEAC). On the other hand, atomic hydrogen from surrounding regions also diffuses to the fracture zone through the crystal lattice [35], enhancing the crack growth. Figure 70.65 illustrates the processes involved in the hydrogen-assisted subcritical crack growth observed. As for the Hydrogen Induced Cracking (HIC), it occurs because of atomic hydrogen diffusing through the metal and accumulating at the interfaces between inclusions and steel matrix. This is because micro-voids or defects at the interfaces provide sinks for atomic hydrogen accumulation, and hydrogen recombination from atoms to molecules builds up internal pressure. Being highly reactive, the hydrogen atoms combine in the micro-voids at the interfaces to form hydrogen gas (H2). The buildup of hydrogen gas then increases the pressure inside the microvoids. Eventually, the accumulation of hydrogen pressure at such locations leads to disbonding/delamination of the interfaces between inclusions and steel matrix and forming microcracks at one or both sides of the inclusion tips. Figure 70.65 A sketch of hydrogen assisted crack growth mechanism driven by CP. Figure 70.66 shows schematically the processes of disbonding/delaminating of the inclusion/steel matrix interfaces and forming micro-cracks by the accumulated internal hydrogen pressure [22]. HAC and NNpHSCC are both Environmentally Assisted Cracking (EAC) mechanisms that share similarities (e.g., transgranular crack path associated with hydrogen) and have significant differences. The main differences between these two EAC mechanisms are the fracture modes, and the source and amount of the hydrogen. Figure 70.66 Hydrogen Induced Cracking (HIC) Mechanism driven by CP. Figure 70.67 Near Neutral pH Stress Corrosion Cracking (NNpHSCC) mechanism. Moreover, NNpHSCC generates crack fields with mostly axially oriented cracks, since the crack orientation is related to the hoop stress of the pipeline in service (unless the pipeline experienced a significant axial loading, which does not seem to be the case for most of the cracks in this pipeline system). On the other hand, cracks generated by HAC and HIC can have different orientations and a combination of axial, circumferential, and in-between oriented cracks, as the ones observed in these cracks. In summary, the conditions for NNpHSCC are: In contrast, the conditions for HAC driven by CP are as follows: Generally, the amount of hydrogen evolution on the steel surface due to cathodic protection (CP) polarization generated by an Impressed Current Cathodic Protection (ICCP) system is much greater than the produced by the free corrosion potential. Figure 70.68 Polarization diagram illustrating the Mears & Brown cathodic protection mechanism. This is because: The conventional understanding of the cathodic protection mechanism is founded on the results of experiments conducted by Mears and Brown in 1938. They stated, “For CP to be entirely effective, the local cathodes on the corroding specimen must be polarized to the potential of the unpolarized local anodes.” At that point, as illustrated in Figure 70.68, the corrosion current density (CD) is reduced to the exchange CD (I0) at which point the corrosion CD is zero [38]. This theory was supported by Dexter et al. [39], who conducted polarization tests on steel in seawater and concluded that “cathodic protection was achieved by polarizing to, or at least toward, the potential of the local action anodes in agreement with the Mears and Brown and Hoar theories” [38]. Extending this electrical analogy to a structure having many corrosion cells means that, for complete cathodic protection, all cathode sites need to be polarized electronegatively to the most electronegative anode site on the structure (or open circuit anode potential, Ea,oc). This basic theory also indicates that the magnitude of the Cathodic Protection Current (Icp) required to polarize the structure to the protection criterion (Ea,oc) is much higher than the Corrosion Current (Icorr) of the metal at its native potential, as shown in Figure 70.68. When cathodic protection current is applied to a structure, the current is transferred across the structure/electrolyte boundary by one or more of the following reduction reactions, depending on the environment and the magnitude of the current density. The common reduction reactions are: All the preceding reduction reactions increase the concentration of OH− ions at the structure/electrolyte interface and a proportionate increase in pH. Büchler [40], in 2013, illustrated this increase in pH on a Pourbaix diagram, shown in Figure 70.69. Cathodic protection current polarizes steel in the negative direction only where water electrolysis occurs, and hydrogen gas is produced. Increasing the cathodic protection current density results in an increase in pH [41]. Figure 70.69 Pourbaix diagram In summary, over time, the polarization alters the electrolyte pH. These changes promote corrosion mitigation by raising the pH and the conductivity. The CP polarization and the consequent increase in pH correlate with the amount of hydrogen generated on the area of the steel exposed to the electrolyte under the disbonded coating. When a coating disbonds from its substrate but remains intact (no holiday) and bonded between layers, a gap or crevice exists between the disbonded coating and the underlying steel substrate. If the disbonded coating breaks, small amounts of soil and water can migrate into the crevice. Specific coating systems such as polyethylene (PE) tape wrap, with its associated disbondment defects, limit or prevent the CP polarization of the underlying steel, which creates a risk of corrosion (CP shielding) and NNpHSCC. However, not all disbondment events are corrosion risks. The possibility of a coating to shield CP is a function of the coating system and the nature of the coating disbondment [42–44]. Any type of Environmentally Assisted Cracking (EAC), including High pH SCC (HpHSCC), NNpHSCC, corrosion fatigue, and hydrogen embrittlement (HIC, HAC), can be intermittently active or dormant/blunting. Crack tip corrosion and crack tip propagation are competing processes over time. In other words, when the combination of environmental, microstructural, and mechanical variables is not conducive to the crack growth (whatever the environmentally assisted cracking mechanism) while the crack surface and the crack tip are still exposed to the environment, corrosion can happen, and the crack tips become blunt. The crack tip blunting by corrosion should not be confused with the blunting related to plastic deformation around the crack tip when the crack tip is over-stressed (during hydrostatic tests, for instance). In the PRCI Report [45] with guidelines to identify SCC, it is noted that dormancy is not unique and exclusively attributed to NNpHSCC. In Table 4 of the same PRCI report, the author talks about the dormancy of HpHSCC, indicating “The majority of cracks will become dormant at some stage in their growth.” Also, cracks may become dormant for many reasons, including stress shielding by neighboring cracks, the film formation rate exceeding the film rupture rate, or the strain rate decreasing as the crack encounters stiffer material beneath the outer surface layer. Regardless, crack dormancy is a normal part of the growth of the crack. Sample storage time may also contribute to the crack dormancy. Cracks can become dormant during storage because the corrosive environment and moisture trapped inside the cracks could corrode the crack tip without stresses and without the CP-driven hydrogen input, after the pipe samples were removed from the pipeline service. Crack dormancy/blunting can be found in all types of EAC. Dormant cracks have always been observed in the same colony with active cracks, even with a crack that caused a pipeline failure. For example, the crack that produced the rupture was active; however, most of the cracks and crack fields surrounding the failed one were dormant/inactive. In other words, any crack’s active/dormant condition highly depends on the localized conditions (load/stress, material, environment, coating) around the cracked area. A European natural gas pipeline operator requested that the present authors perform integrity studies related to axial and circumferential cracking found in two natural gas pipeline sections. These two sections are part of a 36″ and 38″ natural gas pipeline approximately 490 km long, operating at 55/60% SMYS and constructed between 1972 and 1973 (50+ years old). The pipe body is coated with extruded polyethylene (PE) coating, and most of the girth welds are coated with polyethylene tape wrap. The pipeline is also protected against external corrosion by Impressed Current Cathodic Protection (ICCP) systems installed along the line. The pipeline system was inspected between 2009 and 2013 using an ultrasonic (UT) crack detection (CD) ILI system. In 2017, two pipeline sections in the system were reinspected with an ultrasonic crack detection ILI for axial cracks and an ultrasonic crack detection ILI for circumferential cracks. All UT ILI runs were done in water. Axial and circumferential cracks were found, most of them near girth weld locations, and the operator suspected Near-Neutral pH Stress Corrosion Cracking (NNpHSCC) was the cracking mechanism. Crack fields in dents were also found and were understood to be the same cracking mechanism (NNpHSCC). During the second half of 2017, consultancy and a crack growth study based on comparing the UTCD ILI runs (axial cracks) was performed, and cracking mechanisms other than NNpHSCC were suspected. After the 2017 ILI, 72 locations were excavated for investigation and Non-Destructive Evaluation (NDE), giving a significant number of potential comparisons to evaluate the ILI performance and its integrity implications. In 2018 and 2019, the authors provided consultancy in the evaluation of the performance of the 2017 ILI based on the excavation data. During this stage of the study, the excavation and laboratory reports were reviewed to characterize the investigated cracks’ potentially different cracking mechanisms. Seven (7) different superficial crack morphologies were found while reviewing the 72 excavation reports and 15 laboratory reports, also suggesting that other cracking mechanisms could be involved. The study also showed gaps between the conclusion of the cracking mechanism (NNpHSCC) and the evidence obtained from recent excavations and the metallurgical evaluations performed before 2018; it concluded that other cracking mechanisms such as hydrogen cracking or high-pH SCC, in addition to NNPhSCC and construction welding problems, could not be excluded. The operator then engaged the authors to perform the laboratory characterization of the cracking in three girth welds (GW) removed from operations, intending to determine the cracking mechanism(s). The pipe samples had in-field MPI, and the excavation documentation was reviewed to confirm the suitability for the crack characterization. The areas identified as the best candidates for this investigation were selected; no other regions of the three pipes contained larger cracks. Localized MPI was repeated in the lab to further reveal a single crack in one of the areas, while the other crack locations were revealed by the existing in-field MPI. Further NDE was performed with 3D x-ray computed tomography (XCT) for mapping and profiling cracks. 3D XCT scanning was the best method to capture the complex crack profiles. The technique is non-destructive, capturing the complete three-dimensional profile of any material discontinuity (the cracks, in this case). However, the scanner chamber’s size limits the sample’s size to be scanned; therefore, small panels containing cracks need to be extracted from the pipe samples. The identified panels were cut and ultrasonically cleaned before the XCT imaging. The 3D XCT mapping was the basis for selecting cracks to be broken open at liquid nitrogen temperatures and for metallographic sectioning. In addition, it provided information related to crack dimensions and profiles. The depths and lengths of the cracks were measured from the XCT-rendered images using XCT’s software. Crack lengths were verified using the stereo microscope. The detailed crack depth and length sizing results are illustrated in Figures 70.70 to 70.72. All samples were sized, five of which were opened and investigated to determine the nature of the fracture surface in the Scanning Electronic Microscope (SEM). Seven samples were cross-sectioned, with hardness measurements taken in base metal and weld samples. The cracks in sample 2 were too short and shallow for opening, and the cracks in samples 3a and 3b were blunted (inactive/dormant); therefore, they were not evaluated in the SEM. Table 70.6 summarizes the work performed on the samples, and Table 70.7 summarizes the findings. The entire fracture surfaces were examined, with a focus on the areas closer to the crack tip regions with the least corrosion, to characterize the nature of fracture mode and confirmed by mating surface examinations. As a result, the extensive fractography analysis showed no intergranular cracking or mixed mode but showed cleavage transgranular cracking with evidence of orientation etching pits. The orientation etching pits are commonly used for identifying crystallographic planes. The fractography work and analysis confirm the following: In addition, microhardness testing results on all the cross-sectioned samples confirm the absence of hard spots. Hard spots have high hardness and a characteristic microstructure that’s different from hot-rolled or normalized microstructure, and they were not observed in these samples. Hydrogen embrittlement is one of the mechanisms that produces cleavage planes cracking. In the absence of other mechanisms that produce cleavage fracture surfaces (like low-temperature fracture, for instance), hydrogen-assisted cracking (HAC) remains the plausible cause. Figure 70.70 Example of OD surface before and after cleaning—3D XCT rendering. Figure 70.71 Example of 3D XCT rendering. Figure 70.72 Crack depths measured by 3D XCT. Table 70.6 Summary of Laboratory Work Completed Table 70.7 Summary of Findings a Flat facets with {001} orientation pits. b Undefined facets can be cleavage or quasi-cleavage; however, there is not enough evidence in those areas to fully characterize them. Figure 70.73 Metallographs showing a transgranular crack, from weld toe transitioning to HAZ—few small branches observed, with the blunted crack tip. Figure 70.74 Metallographs showing the transgranularity of the crack path. Figure 70.75 Example of {001} etching pits—Sample 10. Figure 70.76 Example of {001} etching pits—Sample 1A. It is well known that high-strength steels (Grade X70 and higher) are more susceptible to hydrogen cracking produced by CP [51] than low-strength steels [52]. However, there is little information in the published literature on the amount of hydrogen necessary to generate cleavage cracking in steels with grades below X70. The presence of {001} etching pits was observed in the recent onshore gas pipeline rupture [53–55] described in Section 70.2 of this chapter (Figures 70.62 and 70.63 in Section 70.2.4), where the failure was related to Hydrogen Assisted Cracking (HAC) with hydrogen generated by the cathodic protection. The journal article about the rupture in Ref. [55] is perhaps the first published complete investigation that shows that lower-strength steels (X52) are also susceptible to hydrogen cracking produced by CP, and that transmission pipeline operation and maintenance conditions can generate rupture-size HAC cracks in susceptible low-strength carbon steels. In addition, the investigation of the failure also shows the detailed forensic analysis of coating material and coating condition, contaminants in the interface of coating and steel surface, soil composition and resistivity, historical CP potential data, and deposits found around the coating failures (calcium carbonate and siderite). The extensive analysis helped to understand the cracking mechanism and fully support the conclusions. This type of forensic analysis was not possible for the three samples received from Europe. As explained in Section 70.3.2, HAC and NNpHSCC are both cases of Environmentally Assisted Cracking (EAC) associated with hydrogen. They share similar transgranular crack paths as observed in the metallographic cross sections, but the fracture modes and the sources of hydrogen are different: In summary, the type of cleavage facets observed cannot be produced by NNpHSCC. The crack fracture surfaces from the three evaluated pipe samples do not show any quasi-cleavage features related to NNpHSCC. However, it is essential to note that the exclusion of NNpHSCC as a cracking mechanism is limited to the samples examined. The three (3) pipe samples were received without coating and surface deposits (both removed in ditch for NDE). The evidence of the coating, soil, and pipe surface conditions at the locations where the crack samples were found, as well as the local CP readings, were not available for this evaluation. The information from the excavation reports was also limited. Therefore, the current study is restricted to metallographic and fractographic evaluations of the best representative cracks in the pipe samples. Forensic documentation of the original conditions of the interesting cracks removed from the pipeline would add certainty to the characterization of the observed cracking mechanism. All the available excavation reports provided to the authors are from different excavations. Therefore, the information like pH measurements, nature of deposits, photographs showing coating condition, and soil and groundwater analysis do not correspond to the pipe samples analyzed in our laboratory, and they may not reflect the local conditions where the analyzed cracks were generated. The authors measured a single high pH (9–10) from another excavation on the wet interface between a disbonded tape coating and the pipe surface, following the recommended best industry practices protocol to measure pH in excavations while investigating for SCC. It is important to note that this single pH measurement could prove that the CP is reaching the pipe surface at a certain level under the damaged/disbonded PE tape coating. Changes in the pH with time are possible and expected in a pipeline protected with ICCP systems operating for 50+ years. Over time, polarization alters the pH of the electrolyte. The increase in pH due to CP polarization is limited to the areas where the steel is exposed to the electrolyte at coating defects and is directly related to the amount of current drained by the CP system at each location. Therefore, to fully understand the cracking mechanism, laboratory analysis of cracks requires a forensic approach and well-documented information on pipe samples with detailed in situ conditions (pH, coating, deposits, CP, soil, etc.). A typical forensic approach includes the complete documentation of terrain and soil conditions, groundwater, P/S potentials, coating, and steel surface conditions, and the timely collection of freshly removed samples for laboratory analysis. Documentation and sample collections must cover all areas around the pipe to maximize the evidence that will allow the understanding of the environmental conditions in the exact place where the crack is located. The forensic process begins before excavation and must cover the conditions before and after the coating removal and non-destructive tests (MPI, UT, etc.). As mentioned in Section 70.3.3, the amount of hydrogen generated on the steel surface by cathodic protection is greater than that produced by corrosion. No external source of hydrogen other than the cathodic protection (like microbiologically induced corrosion MIC such as sulfate-reducing bacteria SRB) was observed in the investigated samples. On the one hand, the amount of hydrogen generated on the steel surface that ICCP can produce highly depends on the nature of the coating defect and the amount of cathodic protection current. Conversely, the amount of hydrogen needed to initiate and grow cracks differs for each steel type. In general terms, steels with high contents of impurities such as S and P non-metallic inclusions, steels with microstructures like the Widmanstädter observed in the published case [53–55] or tempered martensite, and steels with high hardness are more susceptible to hydrogen assisted crack growth and require less amount of hydrogen. The data aggregation shown in Figures 70.79 and 70.80 shows that the corrosion features follow a distribution pattern with some similarities to the cracking (primarily associated with the areas surrounding the girth welds and their defective coatings) and that they are shallow. Quantitatively, the MFL ILI listings from 2007 show that: The fact that most of the external corrosion is shallower than 20%t in a more than 50 years old pipeline with a history of defective polyethylene tape coating on girth welds suggests that the CP has provided a certain level of polarization (with associated CP hydrogen generation) for corrosion control. Moreover, the three pipe samples received show very superficial corrosion and an absence of general and extended corrosion. As mentioned in Section 70.3.5, CP shielding is a common condition associated with polyethylene (PE) coatings and NNpHSCC. However, the low-level corrosion observed suggests that it may not be the case for the pipeline sections reviewed. The historical data of CP potentials reviewed mostly complies with international CP practices. However, it is on the most negative side of the range (i.e., closer to −1200 mV than to −850 mV CSE). This suggests that a CP system compliant with international guidelines may still develop HIC/HAC, as shown in the lessons learned in recent failures [53–55]. Conversely, a different management strategy to reduce the HAC threat should be considered. This may include CP management [2, 3], recoating, and in-line inspection. Sample 10 has the most significant crack associated with the weld. Based on the cross-section, the crack along the girth weld initiates at the weld toe region and propagates to the HAZ. Flat facets with {001} etching pits were observed at the crack tips; therefore, the crack growth mechanism is HAC. In other words, this crack may have been initiated as a weld toe defect and then grew as HAC. As the crack walls are corroded, the mechanism for crack initiation and corresponding size cannot be established from the fracture surface analysis. The possible reasons for crack dormancy and blunting are mentioned in Section 70.3.6. The contribution of storage time in the crack dormancy of the specimens studied cannot be dismissed. Cracks can become dormant during the storage of the three pipe samples because the corrosive environment and moisture trapped inside the cracks could corrode the crack tip without stresses and without the CP-driven hydrogen input, after the pipe samples were removed from the pipeline service. It should be mentioned that the Stage 1 Study (Crack Growth Assessment) concluded that crack growth is slow but not negligible. Therefore, there is factual evidence that some of the cracks in the pipeline section are active and growing. However, the cracks evaluated in the lab are only in three GWs along the pipeline, not all the cracks along the pipeline. All of the cracks opened for fractography were dormant. Also, some very short branches along the main cracks with sharp tips that were not blunted were observed, but there was no way to open them for fracture surface investigation due to their location and dimensions. Further work is needed to evaluate the applicability of the present findings from three pipe samples to the rest of the pipeline system and to assist in fully understanding the reasons that may explain the cracking distribution along the pipeline system. In other words, to understand why some areas along the pipeline system have extensive cracking while others show no cracking at all. Are they dominated by material-susceptibility, coating condition, CP condition, or a combination? This study was on cracks in three pipe samples without coating and surface deposits (both removed in-ditch for NDE), and with limited in-ditch documentation. A complete root cause analysis on GWs with interesting cracks removed from the pipeline in their well-preserved original conditions would add certainty to identifying the observed cracking mechanism. In summary, the findings during this laboratory work are as follows: Figure 70.77 summarizes the observations and findings, illustrating the orientation around the pipeline circumference of each sample reviewed and identifying the location along the two pipeline sections where the samples were taken. In addition, Figures 70.78 and 70.79 illustrate the locations where the samples were taken along the pipeline sections, with their relative position on the aggregation of data collected during the Stage 2 Study. The factual evidence from the metallographic and fractographic analysis of the axial, circumferential, and spiderweb external cracking in the three samples received concluded that the crack growth mechanism is consistent with Hydrogen-Assisted-Cracking (HAC) or Hydrogen Environmentally Assisted Cracking (HEAC). The evidence indicates that the cracks evaluated are not related to any of the following mechanisms: The review of the historical CP readings at test stations further suggests that the source of the high amount of hydrogen is associated with the ICCP systems, operated near the most negative range of pipe-to-soil potentials over long periods of past operation. In addition, Figure 70.77 Summary of observations and findings. Figure 70.78 Pipeline data aggregation for Section S06. Therefore, the plausible root cause for the observed hydrogen cracking appears to be the combination of a defective coating, the ICCP system operated for extended periods (decades) at a pipe-to-soil potential close to −1200 mV CSE, and the presence of a susceptible material. Figure 70.79 Pipeline data aggregation for Section S02. A different management strategy to reduce the HAC threat should be considered. This may include CP management, recoating, and in-line inspection. Finally, the evidence of the coating, soil, and pipe surface conditions at the locations where the evaluated crack samples were found, as well as the local CP readings, were not available for this Study. To fully understand a cracking mechanism, it is recommended to adopt a forensic approach on freshly removed pipe samples with a detailed evaluation of the in-situ conditions. A typical forensic approach includes complete documentation of terrain and soil conditions, groundwater, CP potentials, coating, and steel surface conditions, and collection of samples for laboratory analysis. Documentation and sample collections must cover all areas around the pipe to obtain the maximum amount of evidence that will later allow us to understand the environmental conditions in the exact place where the crack is located. The authors observed cleavage facets similar to those shown in Figure 70.23 in a pipeline segment studied [16] in 2012 in North America. This 12-in. diameter pipeline transports refined petroleum products in Northeastern USA. The pipeline segment consists of 0.219-in. nominal thickness pipe manufactured by American Steel Pipe using the Electric Resistance Weld (ERW) process with pipe grade API 5L X60. This segment was constructed and placed in service in 1979. The external coating is primarily Polyethylene Tape (PET), with intermittent presence of Hot Wax or two-part epoxy. The PET coating was applied in the field during the pipeline construction. Through its integrity management plan (IMP), the pipeline operator identified external SCC as an integrity threat for the segment. Crack colonies were later found in investigation excavations, confirming the presence of the cracking threat. Features observed through direct inspection in the field included isolated single long cracks, spider web-type cracks, and crack colonies that were oriented in longitudinal, circumferential, and oblique directions, as shown in Figure 70.80. One of the pipe samples recovered from the excavations, which included axial crack anomalies identified in the IMP, was subjected to a burst test in the laboratory. The pressure test showed a failure pressure two times higher than the Maximum Allowable Operating Pressure (MAOP) for the pipeline segment. The tested pipe section included an axial crack with a depth of 60% (wall thickness), with multiple other cracks in two crack fields. The factors initially identified to contribute to the crack growth included the aggressive pressure cycling/loading, and the pipe-to-soil CP potentials steadily close to −1200 mV along this segment. Figure 70.80 Example of circumferential, oblique and spiderweb crack fields. The varying nature and orientation of cracks and crack fields suggested that there were different mechanisms promoting the crack growth. A detailed metallographic investigation with appropriate material testing was then performed to characterize the cracking mechanism(s). The metallographic study revealed that the axial cracking was NNpHSCC, consistent with the operator’s threat assessment. However, the circumferential, oblique, and spiderweb cracking had a morphology inconsistent with SCC. Figure 70.81 shows the mirrored cleavage facets on the mated fracture surfaces of circumferential cracks in the referred pipeline. By definition, any (every) crack formation produces mated (mirrored) fracture surfaces. If those fracture surfaces are exposed to corrosion, the mating is lost as the corrosion of each side of fracture surfaces occurs independently of the other side. These cleavage facets can only be produced by hydrogen cracking [56–58], as corrosion cannot make mirrored cleavage facets, because corrosion is an independent event on each side of the fracture surface. Figure 70.28, showing the SEM/EDS evaluation of microcrystals at the crack tip, along with Figure 70.82, are also taken from this study. It shows the similitude of these microcrystals with those found in the TGN case, shown in Figure 70.27. Their morphologies are also inconsistent with those produced by high pH or near-neutral pH SCC or fatigue. The morphologies observed in the TGN’s samples are consistent with the ones observed in this refined products pipeline, which are also related to very negative CP potentials that produce high fugacity hydrogen at the crack tip. The origin of the Hydrogen-induced cleavage cracking found in this X60 refined products pipeline was deemed hydrogen cracking due to very negative CP potentials (Figure 70.82) that produced high fugacity hydrogen at the crack tip. There are published cases where the fracture surface morphology shows similarities with the cases presented here. Figure 70.81 Hydrogen-assisted cleavage cracking—mirrored cleavage facets of the mated surfaces. (Reference [16]/with permission of Blade Energy Partners.) One case is shown in Figure 70.83, which compares the fracture surfaces between a Ph.D. thesis in the public domain [56] and the one observed in the in-service failure described in Section 70.2.4. The cleavage fracture produced by SSRT (Slow Strain Rate Test) of the same steel with hydrogen charging in acidified 0.1 M Na2SO4 pH = 2 at −1700 mVAg/AgCl at an applied stress rate of 0.02 MPas−1 is shown on the left, while the image corresponding to the failure is shown on the right. The comparison again demonstrates the similarity in fracture surface morphology and, consequently, in the cracking mechanism. In addition, the Ph.D. thesis showed that SSRT can produce both planar and 3D cleavage facets with hydrogen charging, similar to those observed in this failure. It is noted that the morphology produced by hydrogen in steels can be complicated and often shows a mixed mode. The fractographic evidence obtained from this case is consistent with the work done as reported in the literature. The cleavage morphology is also observed in the published literature [56–59]. Figure 70.84 compares the fracture surfaces between the reported literature and those observed in the in-service rupture case. As a common observation, Hydrogen Assisted Cracking (HAC) is initiated at micro defects, including micro-cracks, cross slip bands, and inclusions. In this investigation, little evidence showed that inclusions played an important role in initiating Hydrogen Assisted Cracking (HIC). Finally, the SSRT test created surface cracks under combined hydrogen charging and slow loading (strain). Once the crack nucleates, there is a time-dependent cracking, similar to the crack growth seen in this case. However, CP-driven hydrogen cracking in onshore pipelines is a novel issue. As mentioned above, and to our knowledge, there is only one fully documented case [54, 55] in the literature, presented by the authors. Therefore, understanding the combination of variables that drive crack initiation and growth in pipeline operating conditions is a new challenge. Argentina has a 39,000 km long high-pressure pipeline system transporting natural gas from production fields to local and exporting markets. The primary natural gas pipelines of this system are 24, 30, and 36 in. in diameter, more than 60 years old, and coated with asphalt enamels that have severely degraded over time. The pipelines were constructed in the late 50s and 60s and maintained by the state-owned Gas del Estado company until 1992, when the system was privatized. Since 1992, two private companies have operated the high-pressure pipeline system, TGS (Transportadora de Gas del Sur) and TGN (Transportadora de Gas del Norte). Figure 70.82 Hydrogen assisted cracking and CP potentials in a USA pipeline. (Reference [16]/with permission of Blade Energy Partners.) Figure 70.83 Image from present research in-service failure (a), (Reference [57]/with permission of Elsevier) (b). (Reference [57]/with permission of Elsevier) (a)—Image from present research in-service failure (b). The natural gas pipeline system had several in-service and during-hydrotest failures at crack colonies [60] and has a long history of operating the CP systems near the most negative side of the potentials. Most of these failures were attributed to High pH SCC (HpHSCC), and TGN and TGS worked to develop a susceptibility model [61] for High pH SCC. At a time when crack detection ILI systems capable of running in gas were in early development, the model was applied with success to manage the SCC threat. Within other soil and terrain considerations, the model showed that most failures occurred close to compression stations and in areas where the asphalt coating was in poor condition with no external corrosion, conditions consistent with HpHSCC. It also showed that most failures occurred close to cathodic protection rectifiers (less than 3 km) in areas with high CP current output, more consistent with high hydrogen generation than with HpHSCC. In late 2010 and early 2011, there were two ruptures in areas where the SCC model deemed them unlikely. A review of the root cause analyses of these two failures performed by the present authors in late 2012 showed that the crack colonies were inconsistent with HpHSCC. One of the failures was caused by a manufacturing defect, a hard spot with cracks on a low toughness Electric Resistance Welding (ERW) seam weld. The other one was related to transgranular cracking found in a hard spot, and probably related to hydrogen cracking. The hydrogen-induced cracking could have been most likely associated with extended cathodic over-potential on a susceptible microstructure. However, during this investigation, the CP data and coating condition were not available for review. A more detailed review of the failure analysis reports showed incomplete characterization of the fracture surfaces [62]. In addition, further revision of the older failure analysis reports (all deemed to be HpHSCC) found the fracture surfaces looked intergranular, with α-ferrite + pearlite microstructures consistent with High pH SCC; however, it also found that the review of the fracture surfaces was neither complete to establish a high pH SCC characterization nor sufficient to evaluate the effects of hydrogen in the fracture surfaces. In light of the recent HAC/HIC findings in these pipelines, this old evidence can be viewed from a different angle: The lessons learned from these studies are that more detailed fracture surface analyses in combination with the review of the historic pressure and CP data, and the local soil and coating conditions, are needed to discern the specific influence of hydrogen in the interaction with other forms of environmentally assisted pipeline cracking. In terms of mitigation actions, the case of pipelines with CP-compatible coatings (Argentina) called for a reduction in the CP currents and CP potentials to decrease the amount of hydrogen generation to reduce the HAC/HIC growth. For example, based on the results of this study, TGN reformulated its Integrity Management Program to include preventive and corrective tasks associated with this new threat, including: Moreover, the Failure Analysis concluded that the asphalt coating at the rupture site was highly deteriorated, exposing the metal surface to the electrolyte (soil). In this condition, the hydrogen-generating cathodic reaction took place. Due to this, a combination of coating evaluation via ILI and the recoating of parts of this pipeline section was scheduled. In addition, regarding cathodic protection, the adjustment of the CP current distribution was implemented to reduce the polarization levels. The mitigation actions in the case of the pipelines with less CP-compatible coatings (Europe and the USA) are less straightforward, as a reduction in the CP potentials would decrease the amount of hydrogen generated and will reduce the opportunities for HAC/HIC; however, it may take the areas under disbonded coating into the CP shielding mode that increases the chances of an environment conducing to NNpHSCC [40–42]. In both cases, the definitive (and more costly) solution is either recoating or replacement of the areas with cracking. As mentioned in Section 70.5, CP-driven hydrogen cracking in onshore pipelines is a novel issue, and its mitigation strategies also need further research and investigation. This chapter summarizes the approach used for these root cause analyses and presents the key findings. It includes a discussion on the implications for managing the pipeline integrity within the systems and the need for further research to evaluate the effects of hydrogen on other types of cracking. This investigation identified the primary cracking mechanism responsible for both the in-service rupture and the leaks as hydrogen environment-assisted cracking (HAC). Significantly, the cathodic protection system generated the hydrogen contributing to this phenomenon. The root cause for these failures was a combination of aged and defective coating and a cathodic protection (CP) system operated for decades at a pipe-to-soil potential near −1200 mV CSE. The extensive review of the literature revealed that this investigation represents the first fully documented instance of an onshore transmission pipeline failure due to HAC driven by CP. Notably, the cracks occurred in the pipe body, made of X52 steel, away from welds, and unrelated to hard spots. In addition, a European natural gas pipeline operator suspected Near Neutral pH Stress Corrosion Cracking (NNpHSCC) mechanism as the primary cause of the subcritical axial, circumferential, and spiderweb external cracks near girth welds. The findings derived from the metallographic and fractographic analysis have concluded that the underlying crack propagation mechanism is Hydrogen-Assisted Cracking (HAC) or Hydrogen Environmentally Assisted Cracking (HEAC). The review of the historical CP readings at test stations further suggests that the source of the high amount of hydrogen (with high fugacity) is associated with the CP system, mostly compliant with international CP practices but operated at the most negative side of the range of pipe-to-soil potentials over long periods of past operation. These findings are also consistent with the evidence found in a refined products transmission pipeline in North America with axial and circumferential cracks. The axial cracks were identified as Near Neutral pH SCC. However, the circumferential cracks had a distinctive morphology inconsistent with NNPHSCC, and further examination concluded that they were consistent with HAC. A later review of the cathodic protection potentials also indicated very negative pipe-to-soil potentials over long periods. The evidence from past failures in Argentina’s high-pressure natural gas pipelines necessitates reconsidering the prevailing assumptions about HpHSCC. The evidence reviewed from the refined products pipeline in the USA and the gas pipeline in Europe makes for reconsidering the prevailing assumptions about NNpHSCC. Such insights are crucial for enhancing predictive models and maintenance strategies to safeguard the integrity of high-pressure pipeline systems.
70
Hydrogen-Assisted Cracking on Onshore Pipelines Driven by Cathodic Protection: Case Studies
70.1 Background
70.2 Investigation of a Gas Transmission Pipeline Failure in Argentina
70.2.1 Reconstruction of the Failed Pipes and Data Gathering
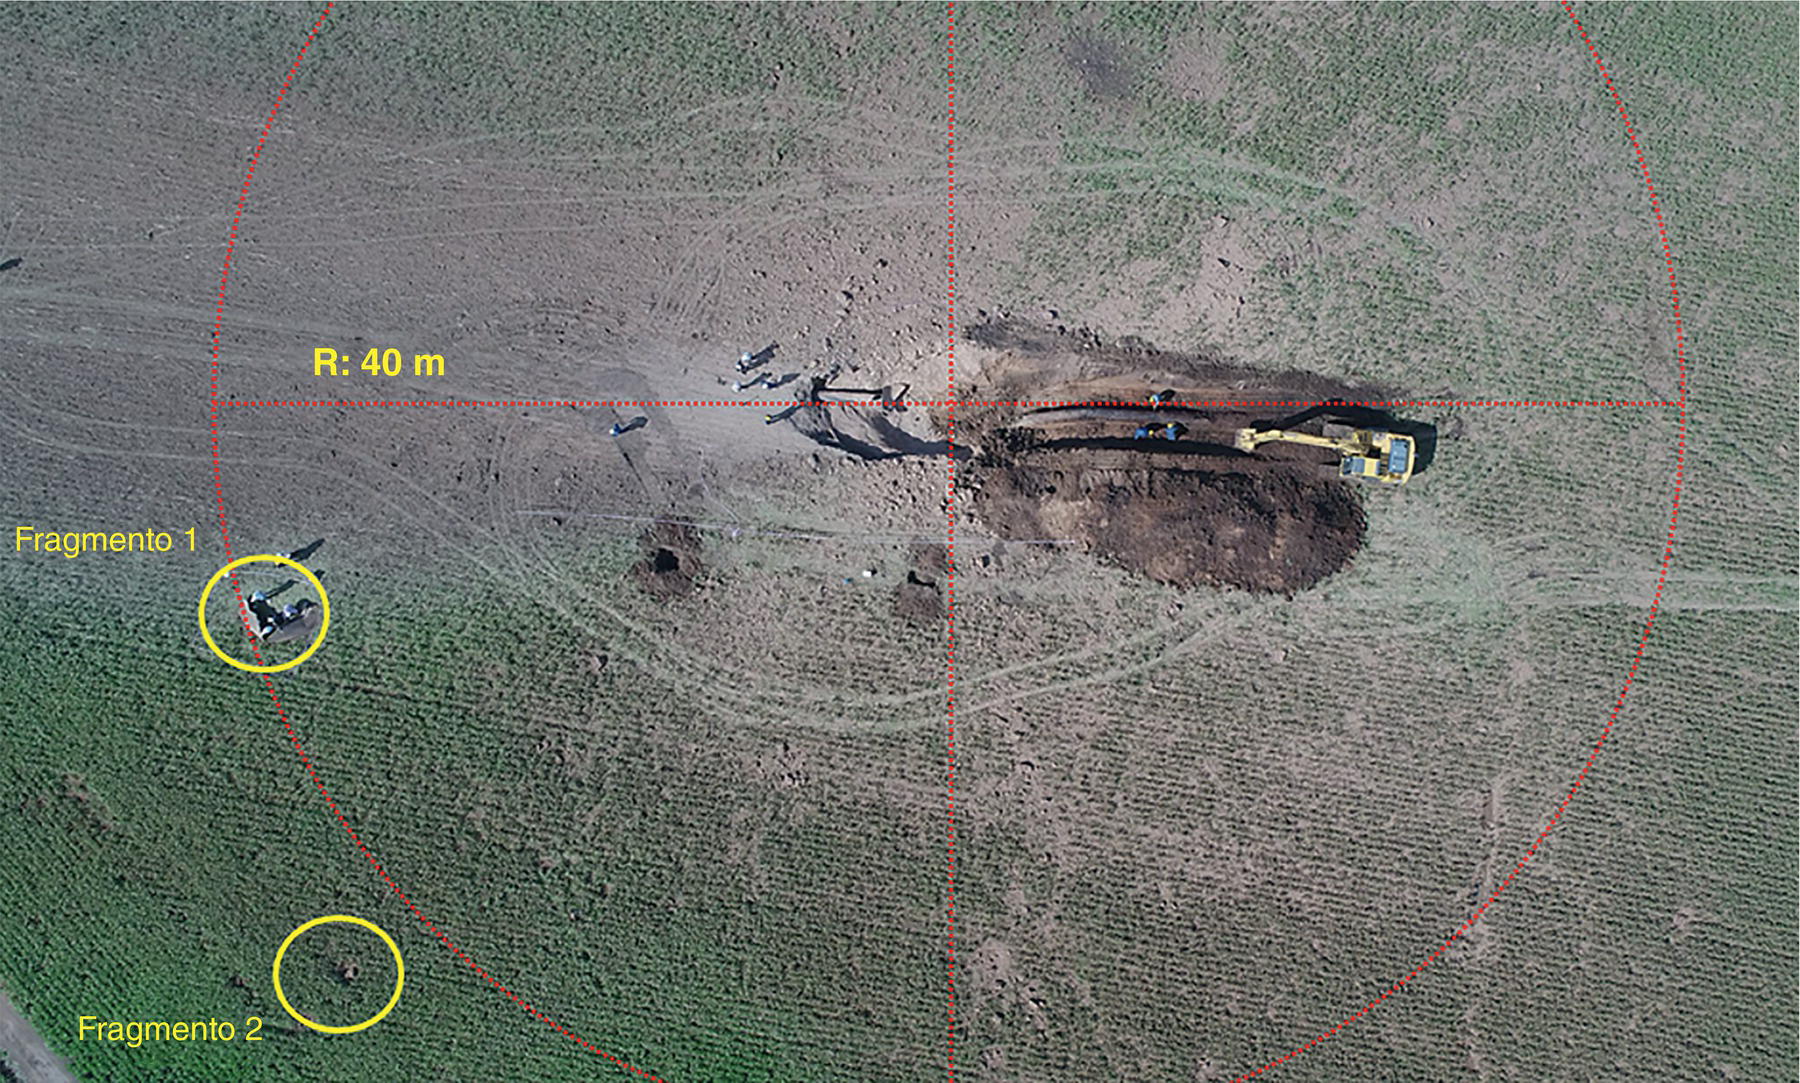
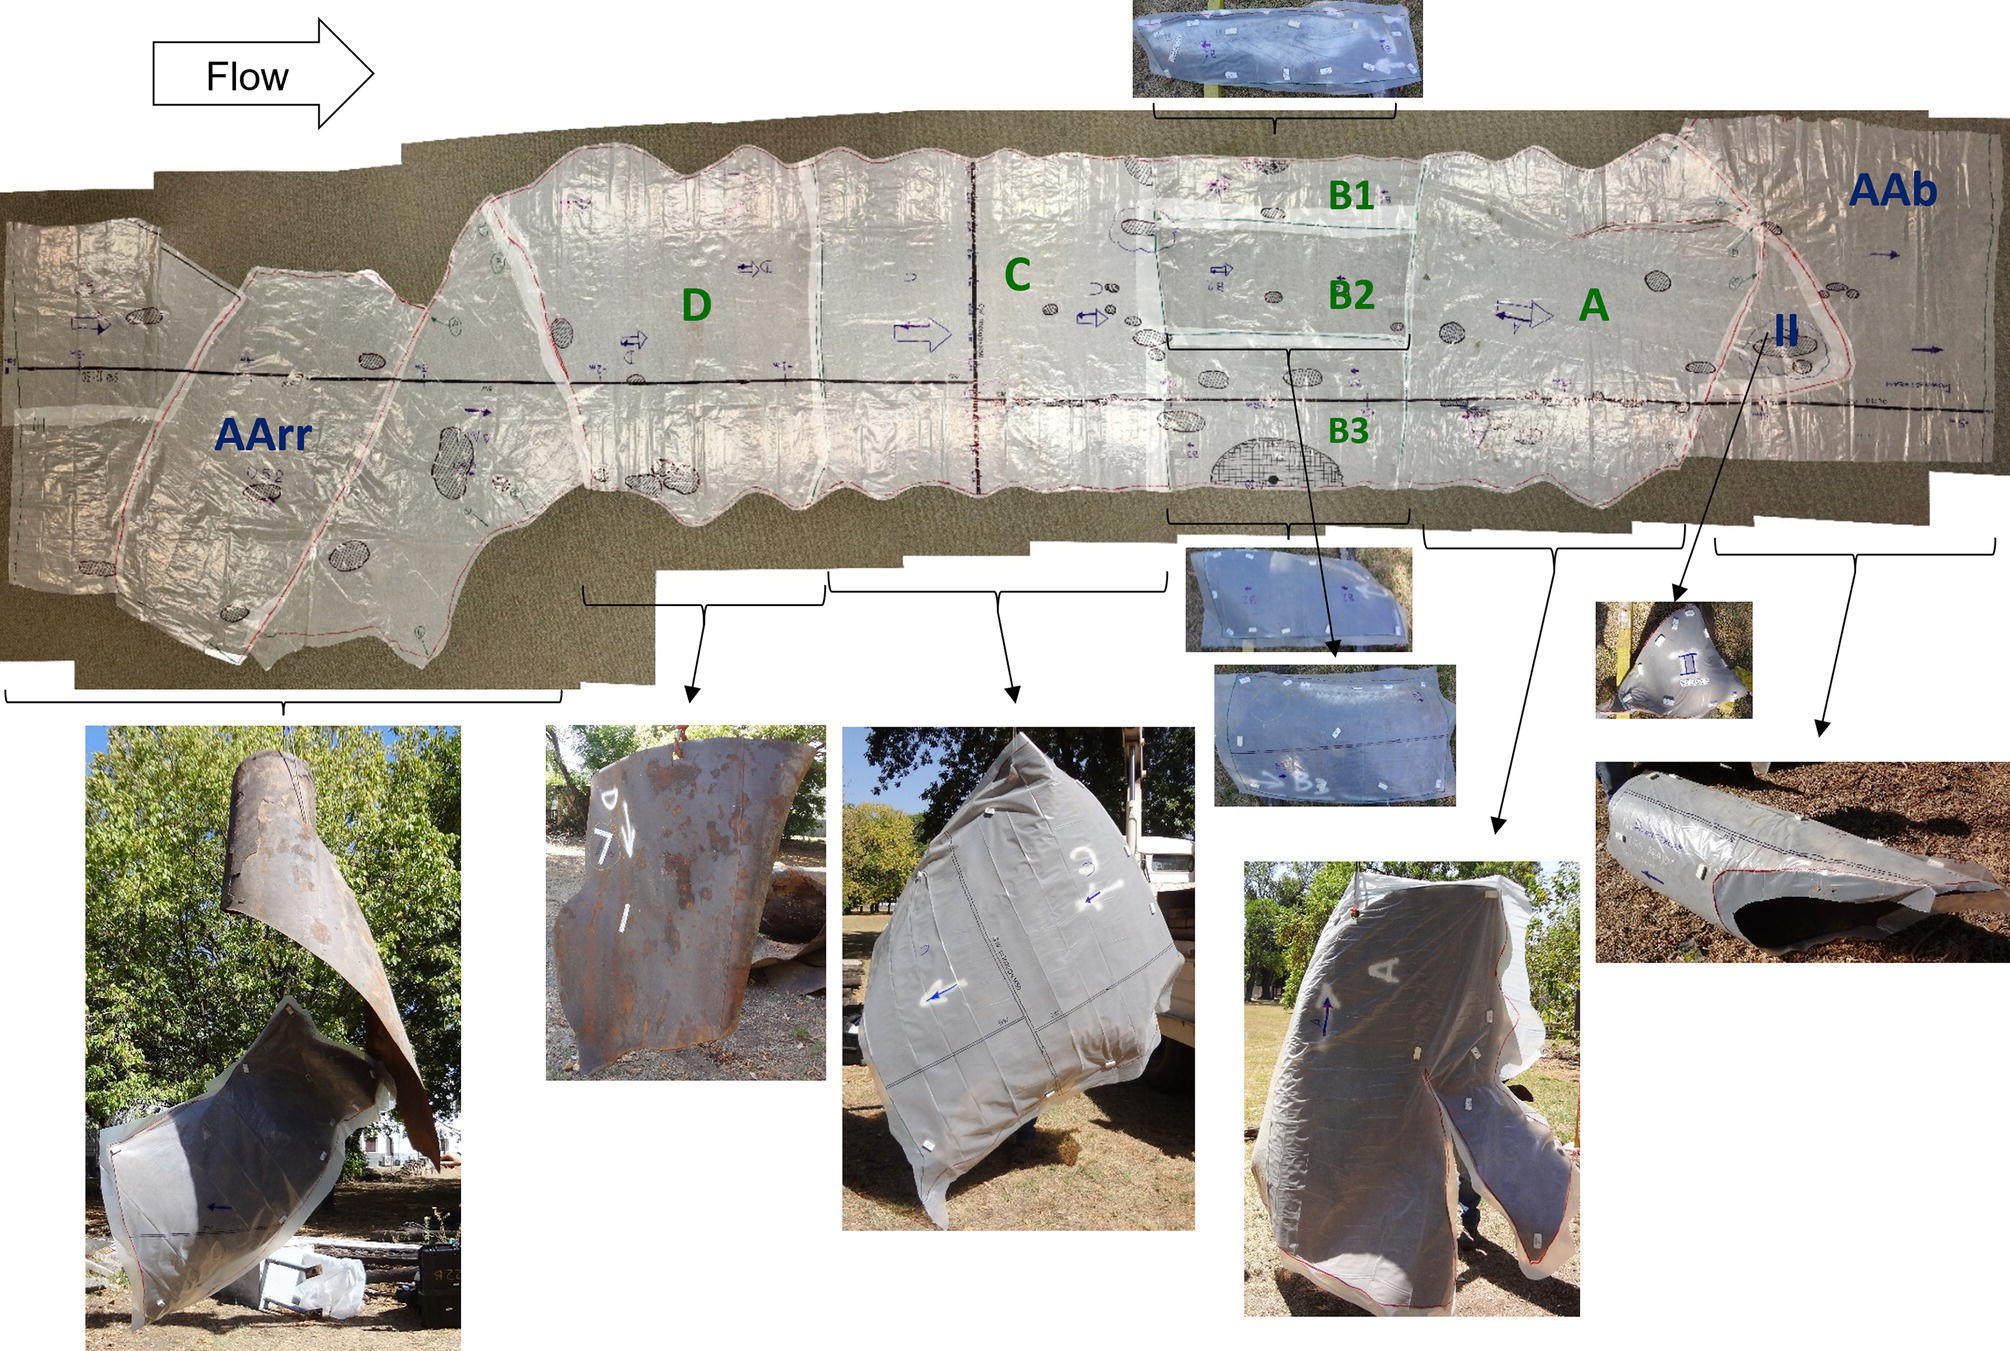
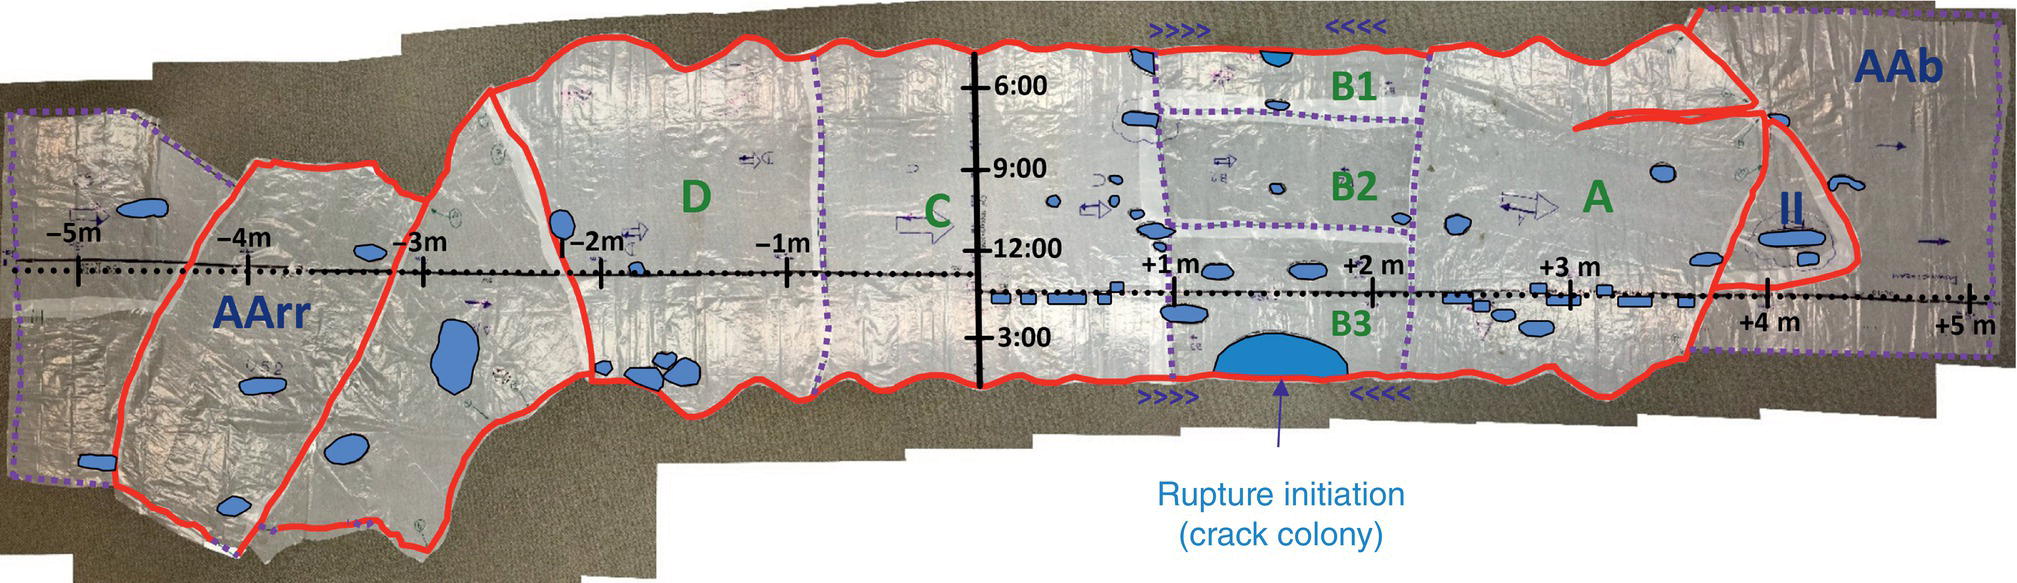
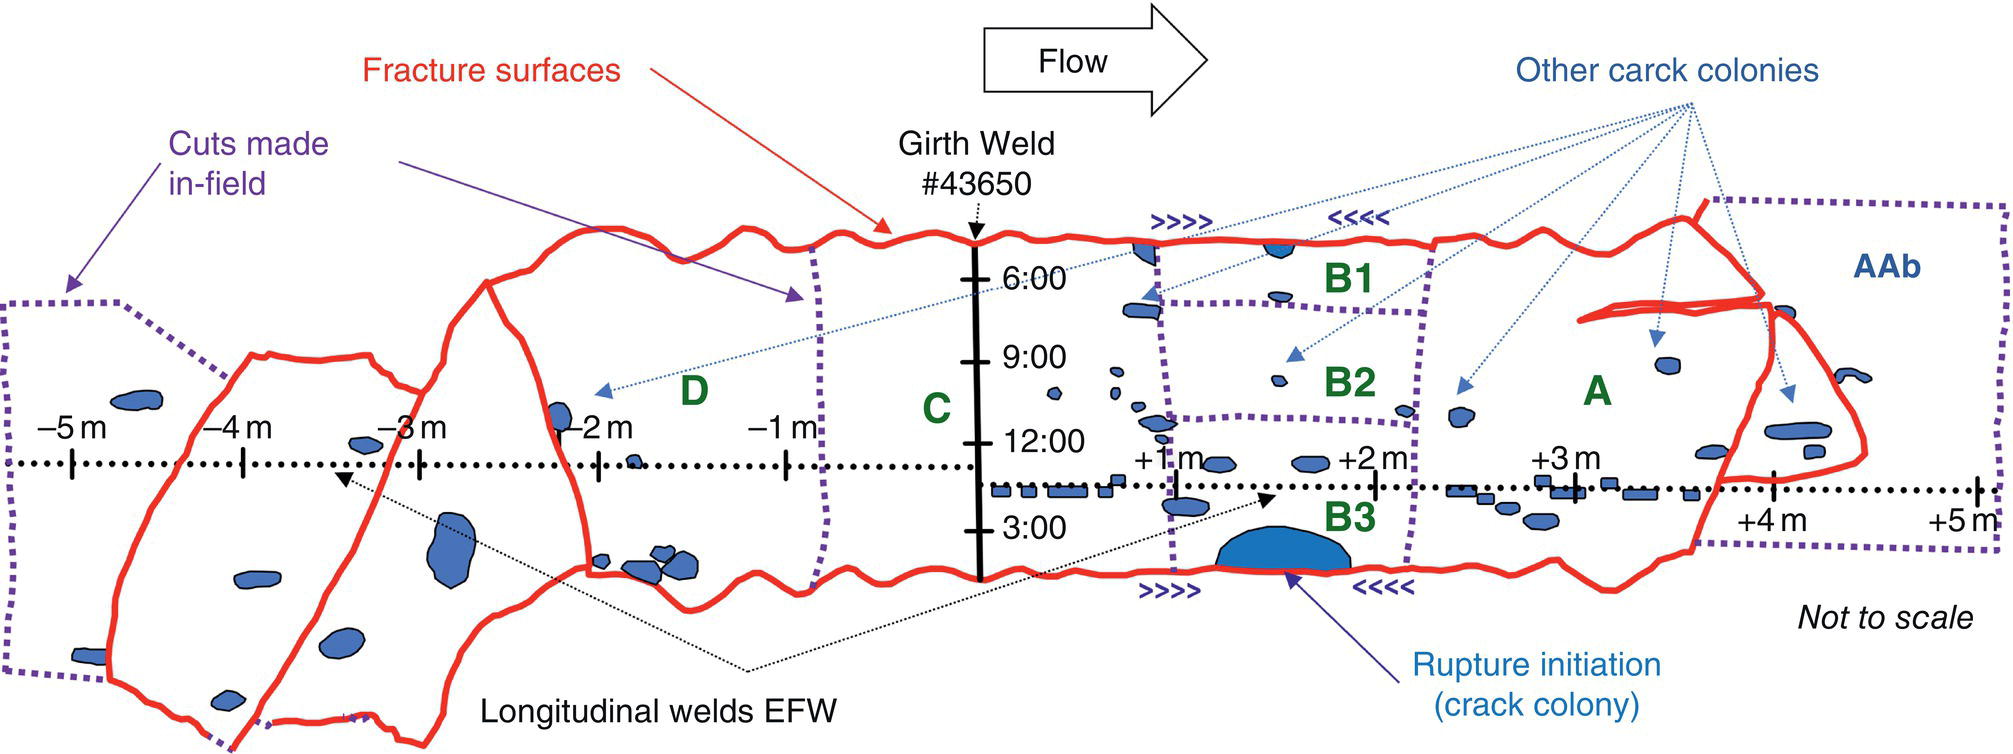
70.2.2 Environmental and Operational Assessment
70.2.2.1 External Corrosion Prevention – Background
70.2.2.2 Soil Review
70.2.2.3 Coating Investigation

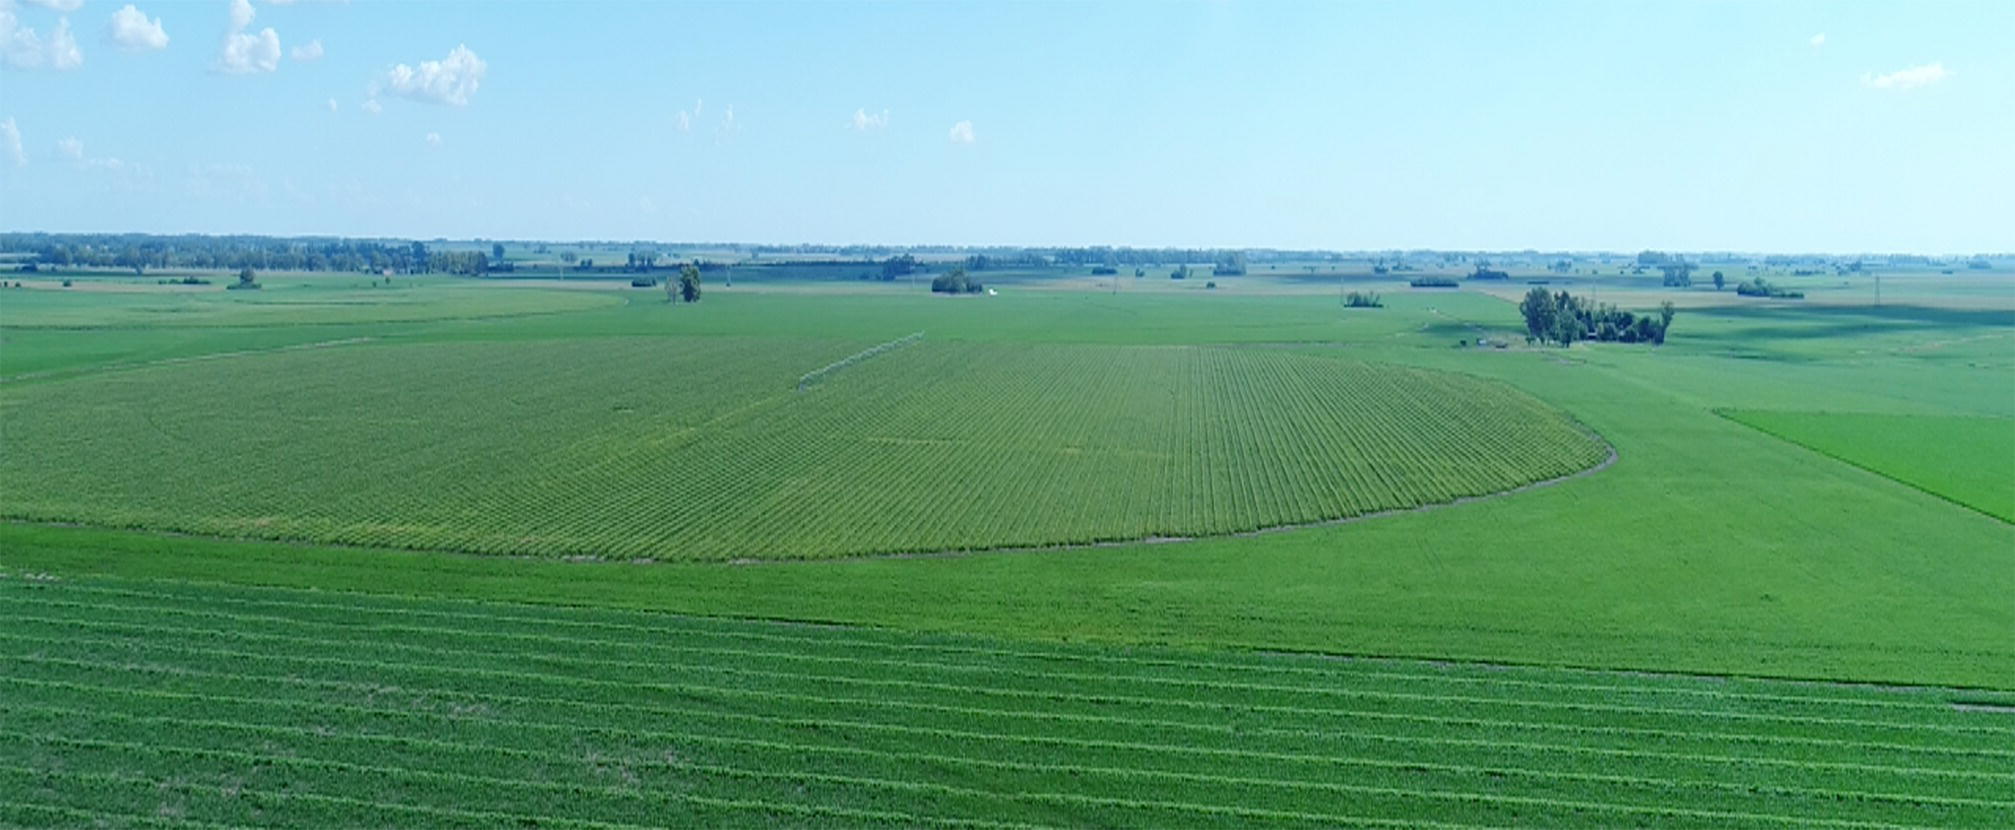
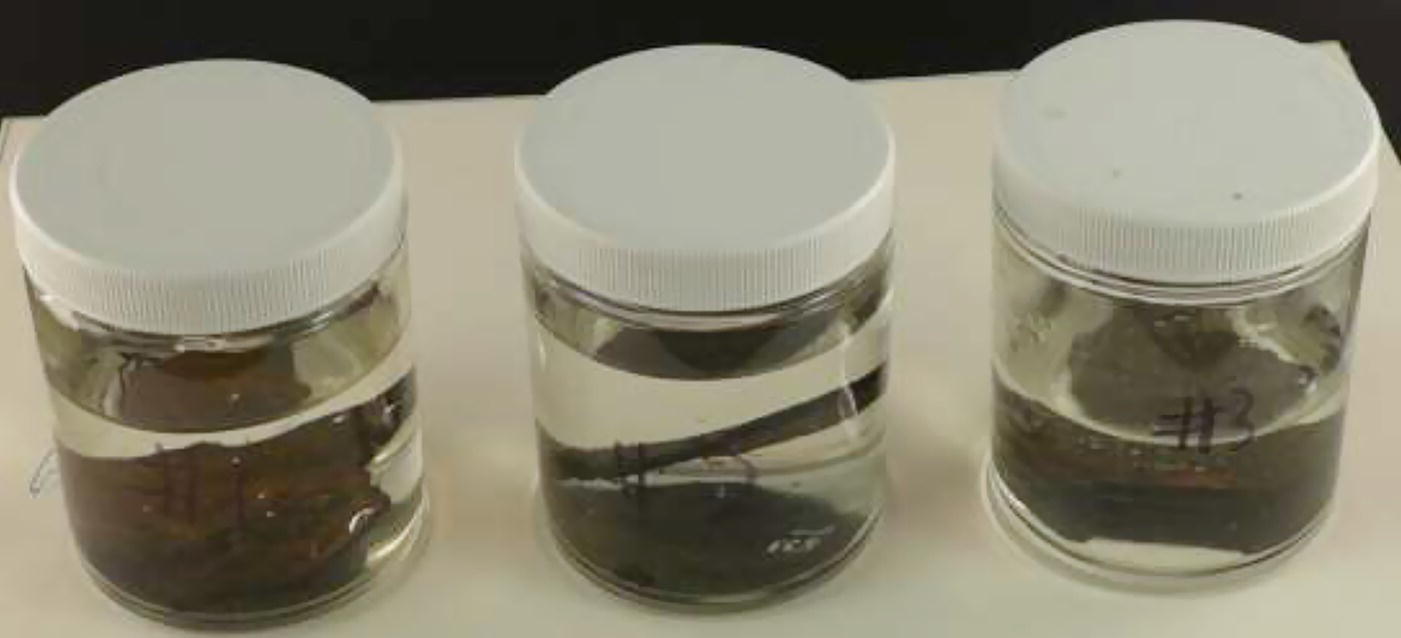
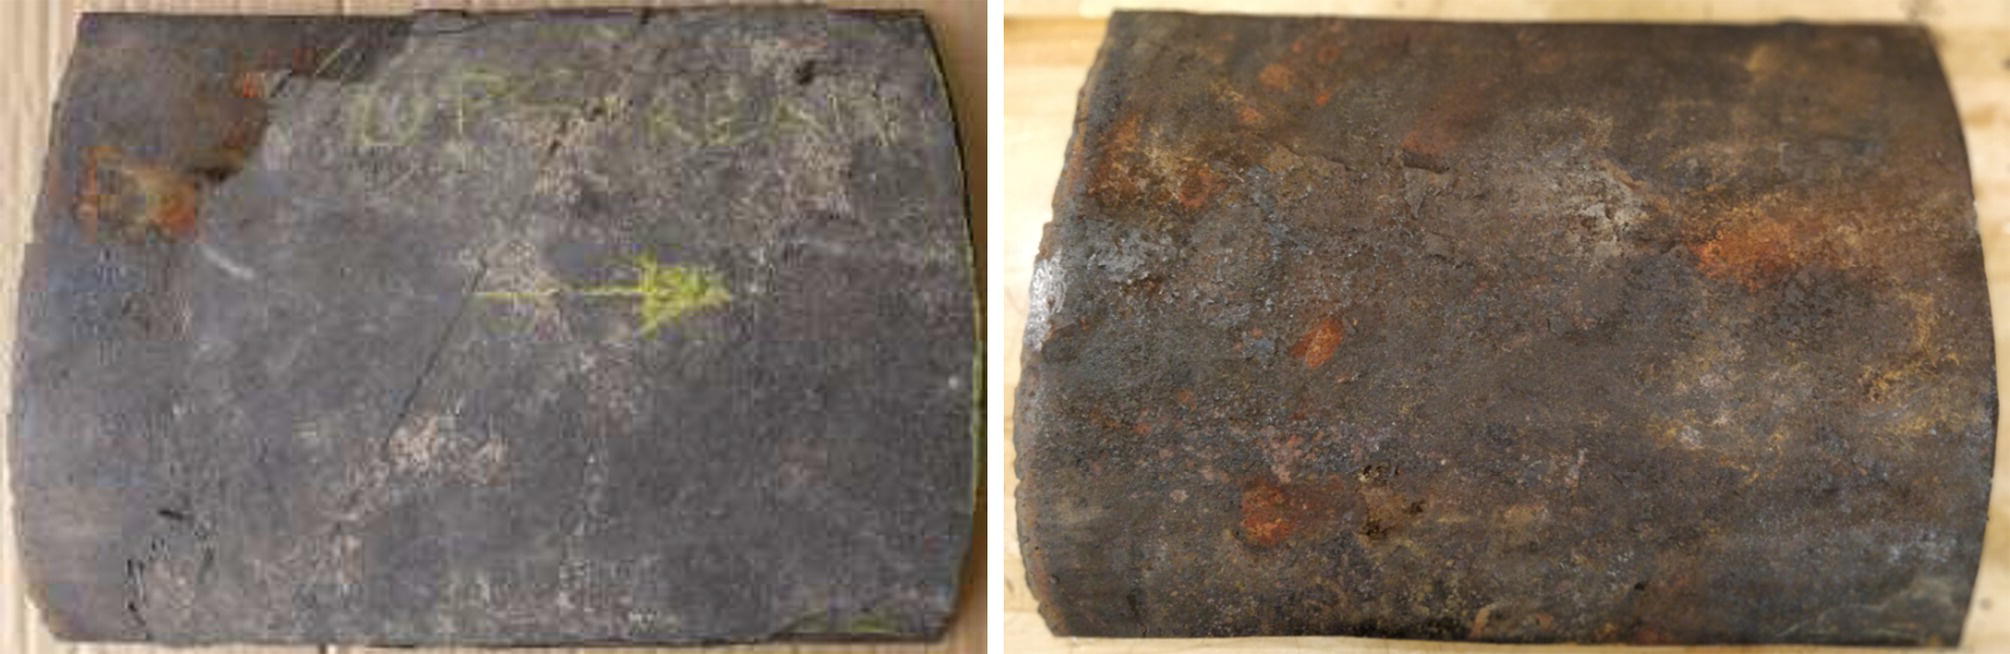
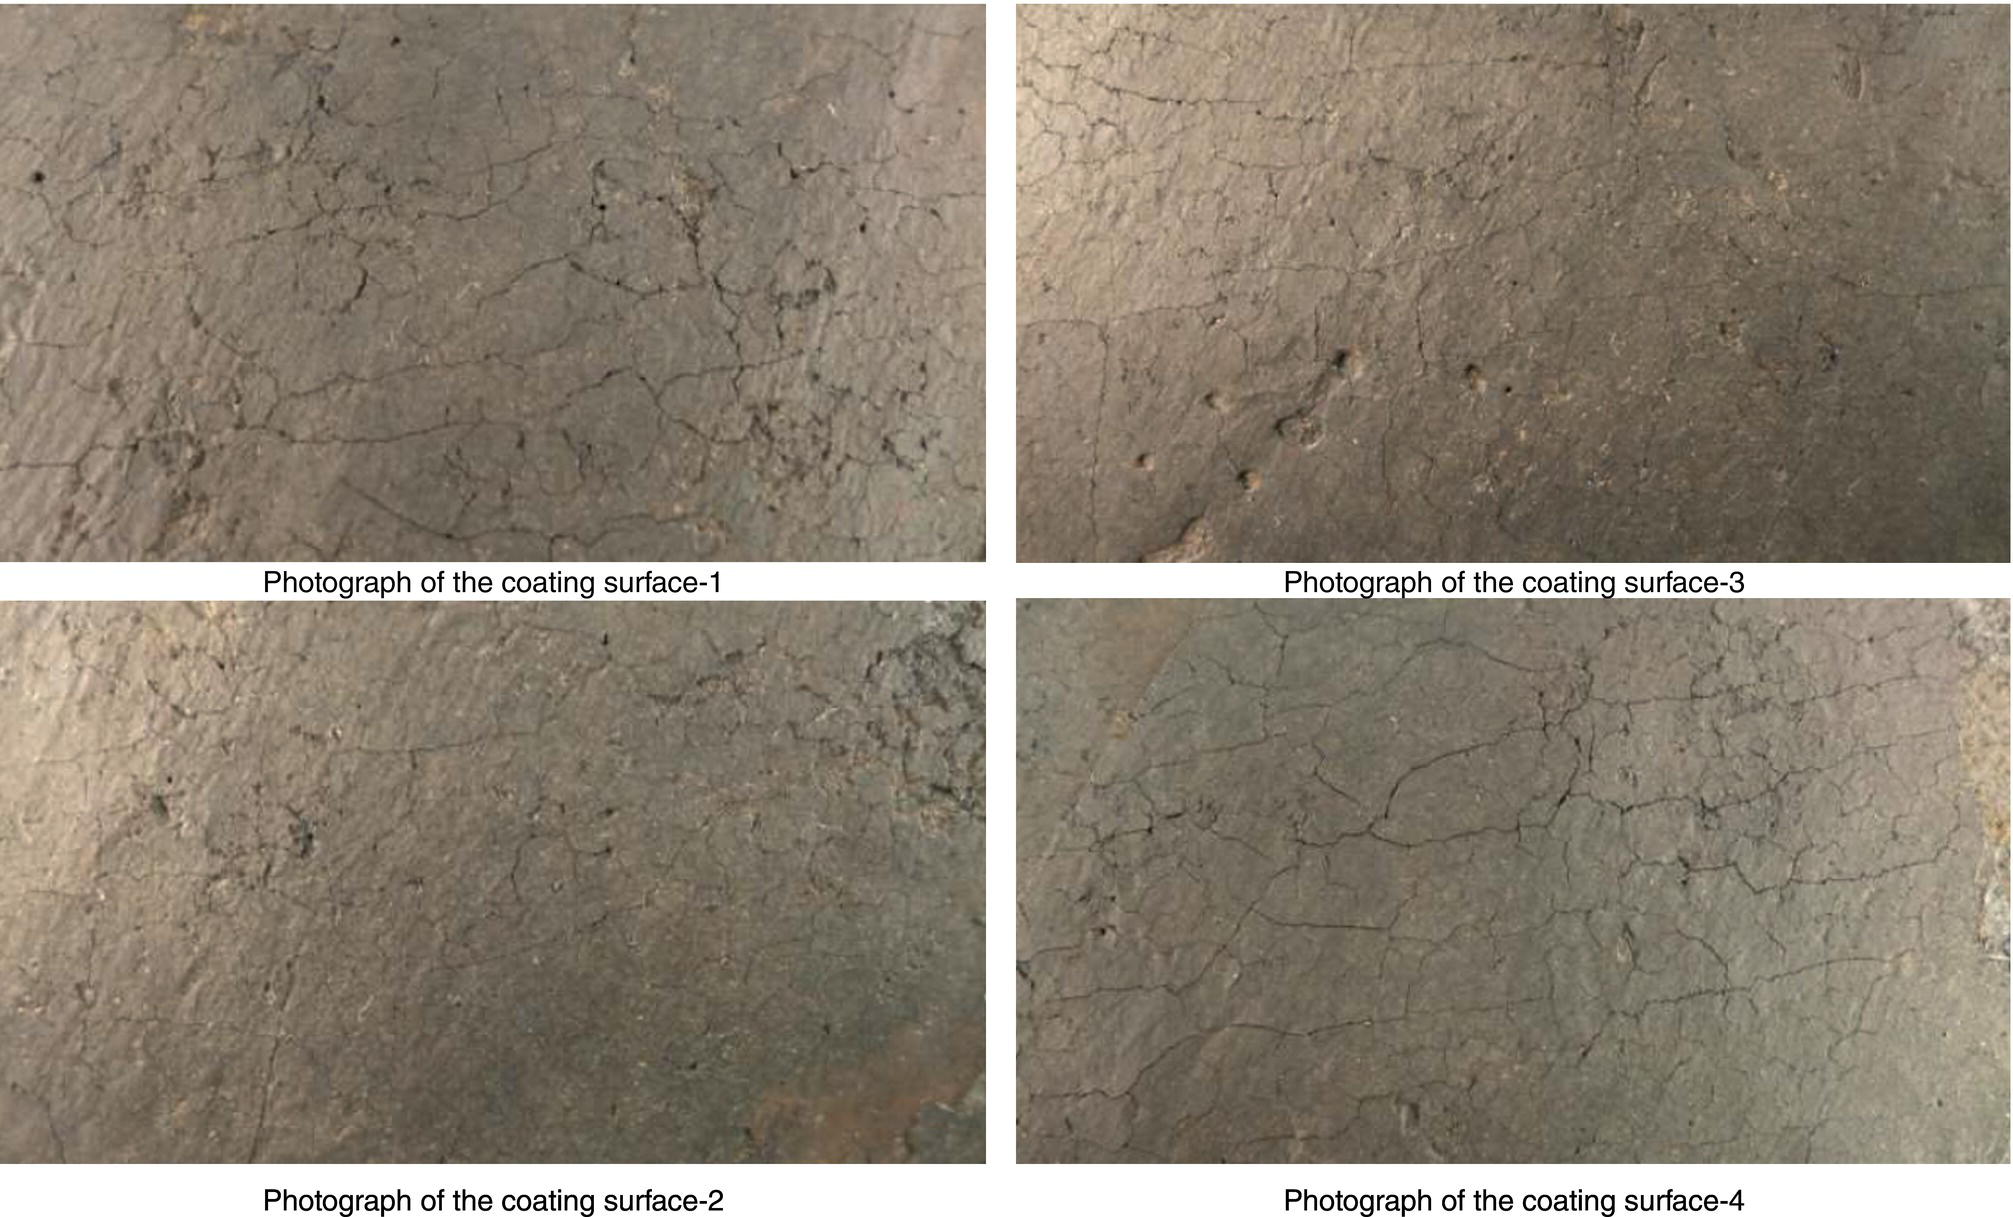
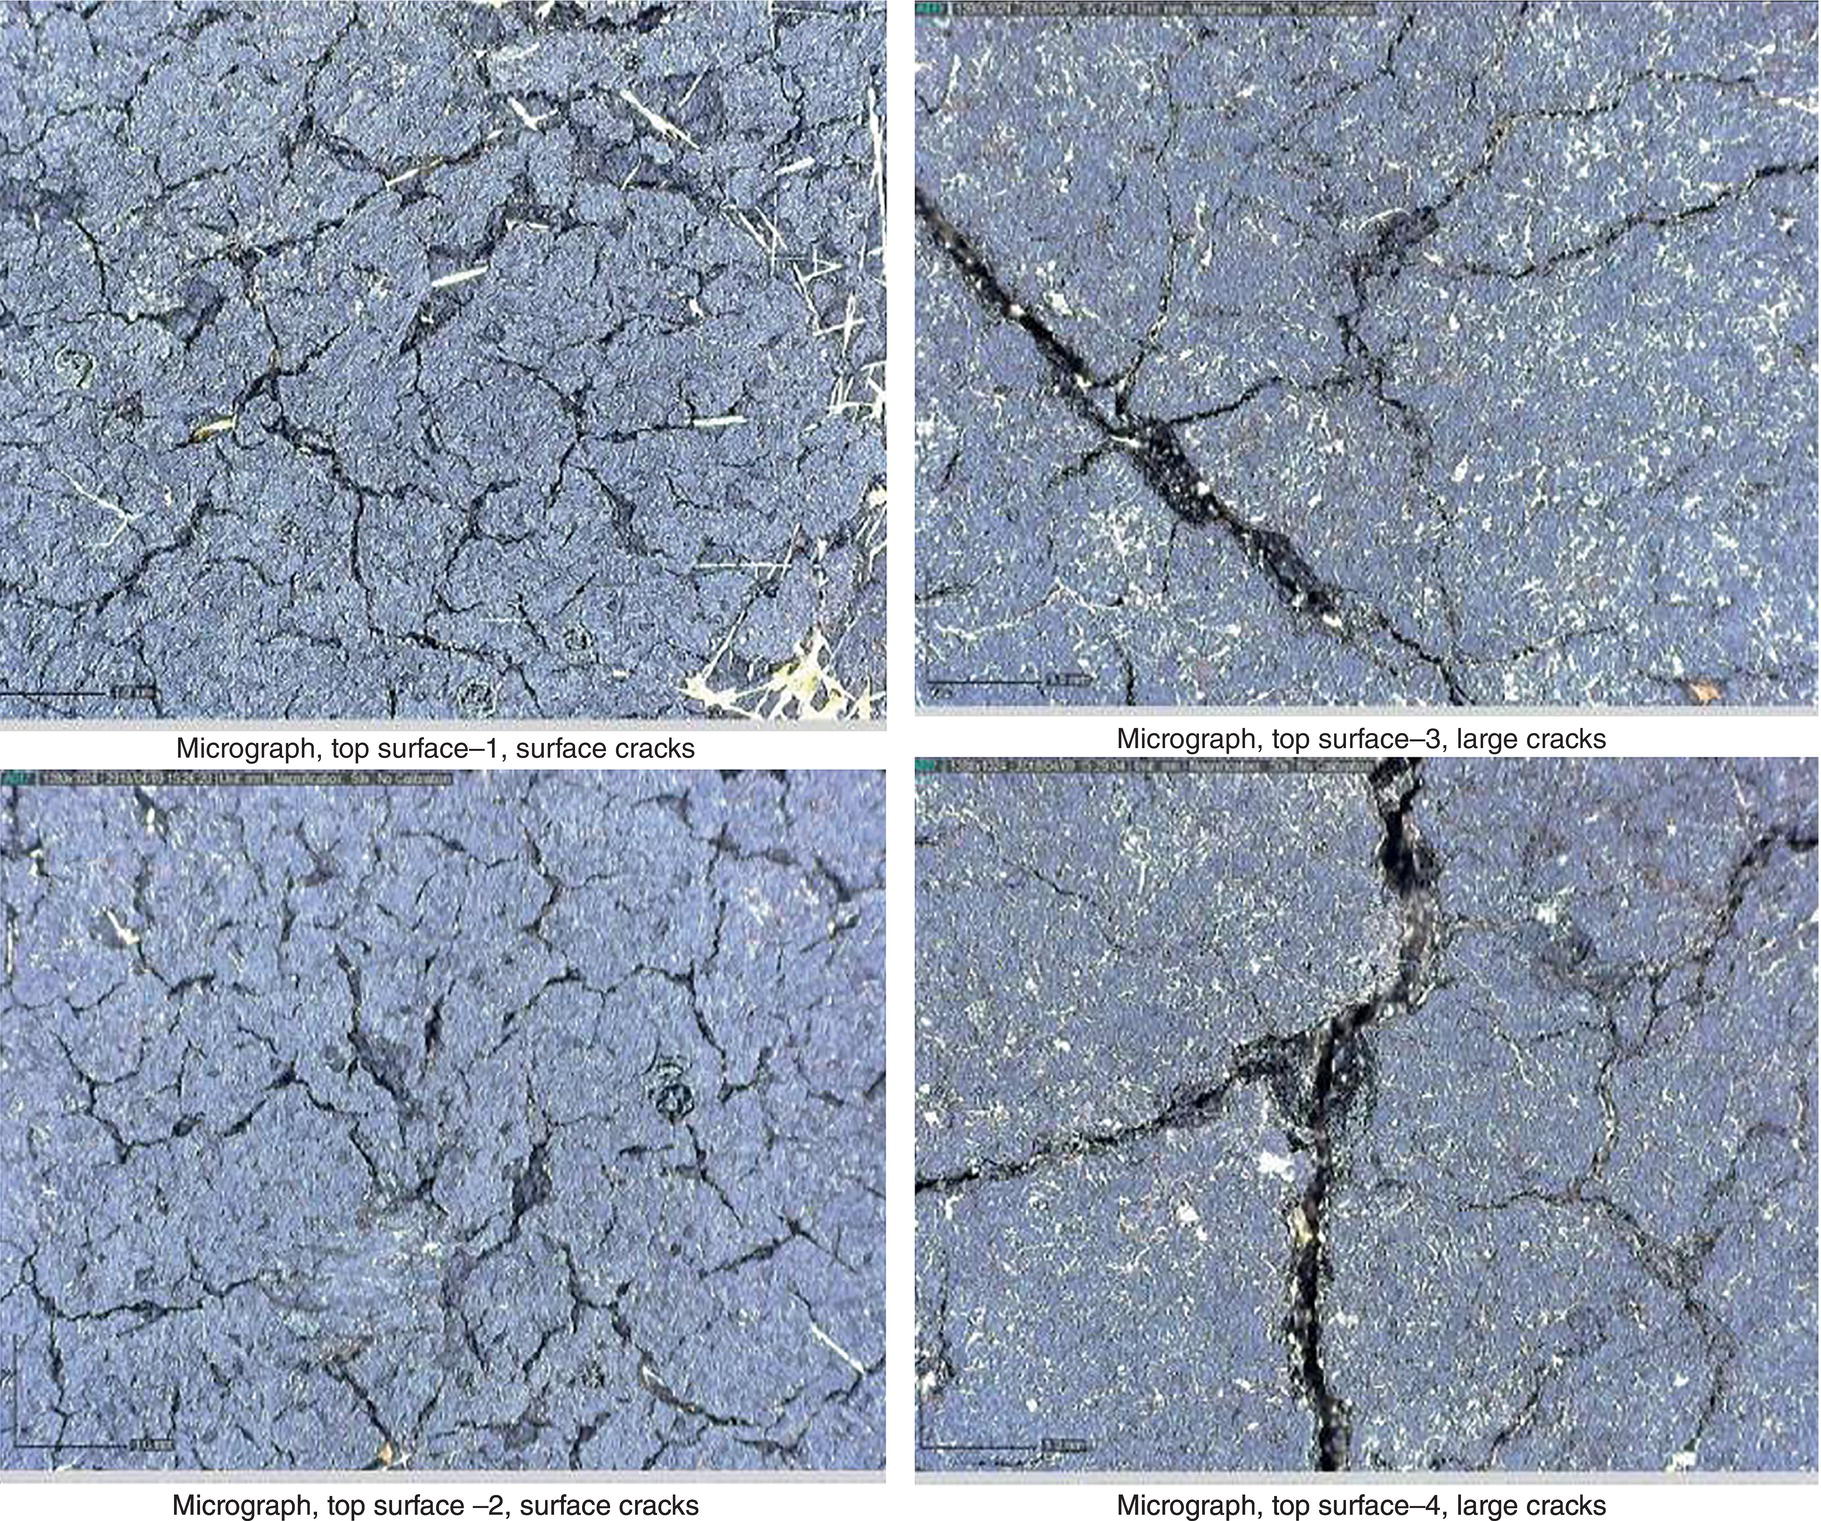
70.2.2.4 Review of the Cathodic Protection
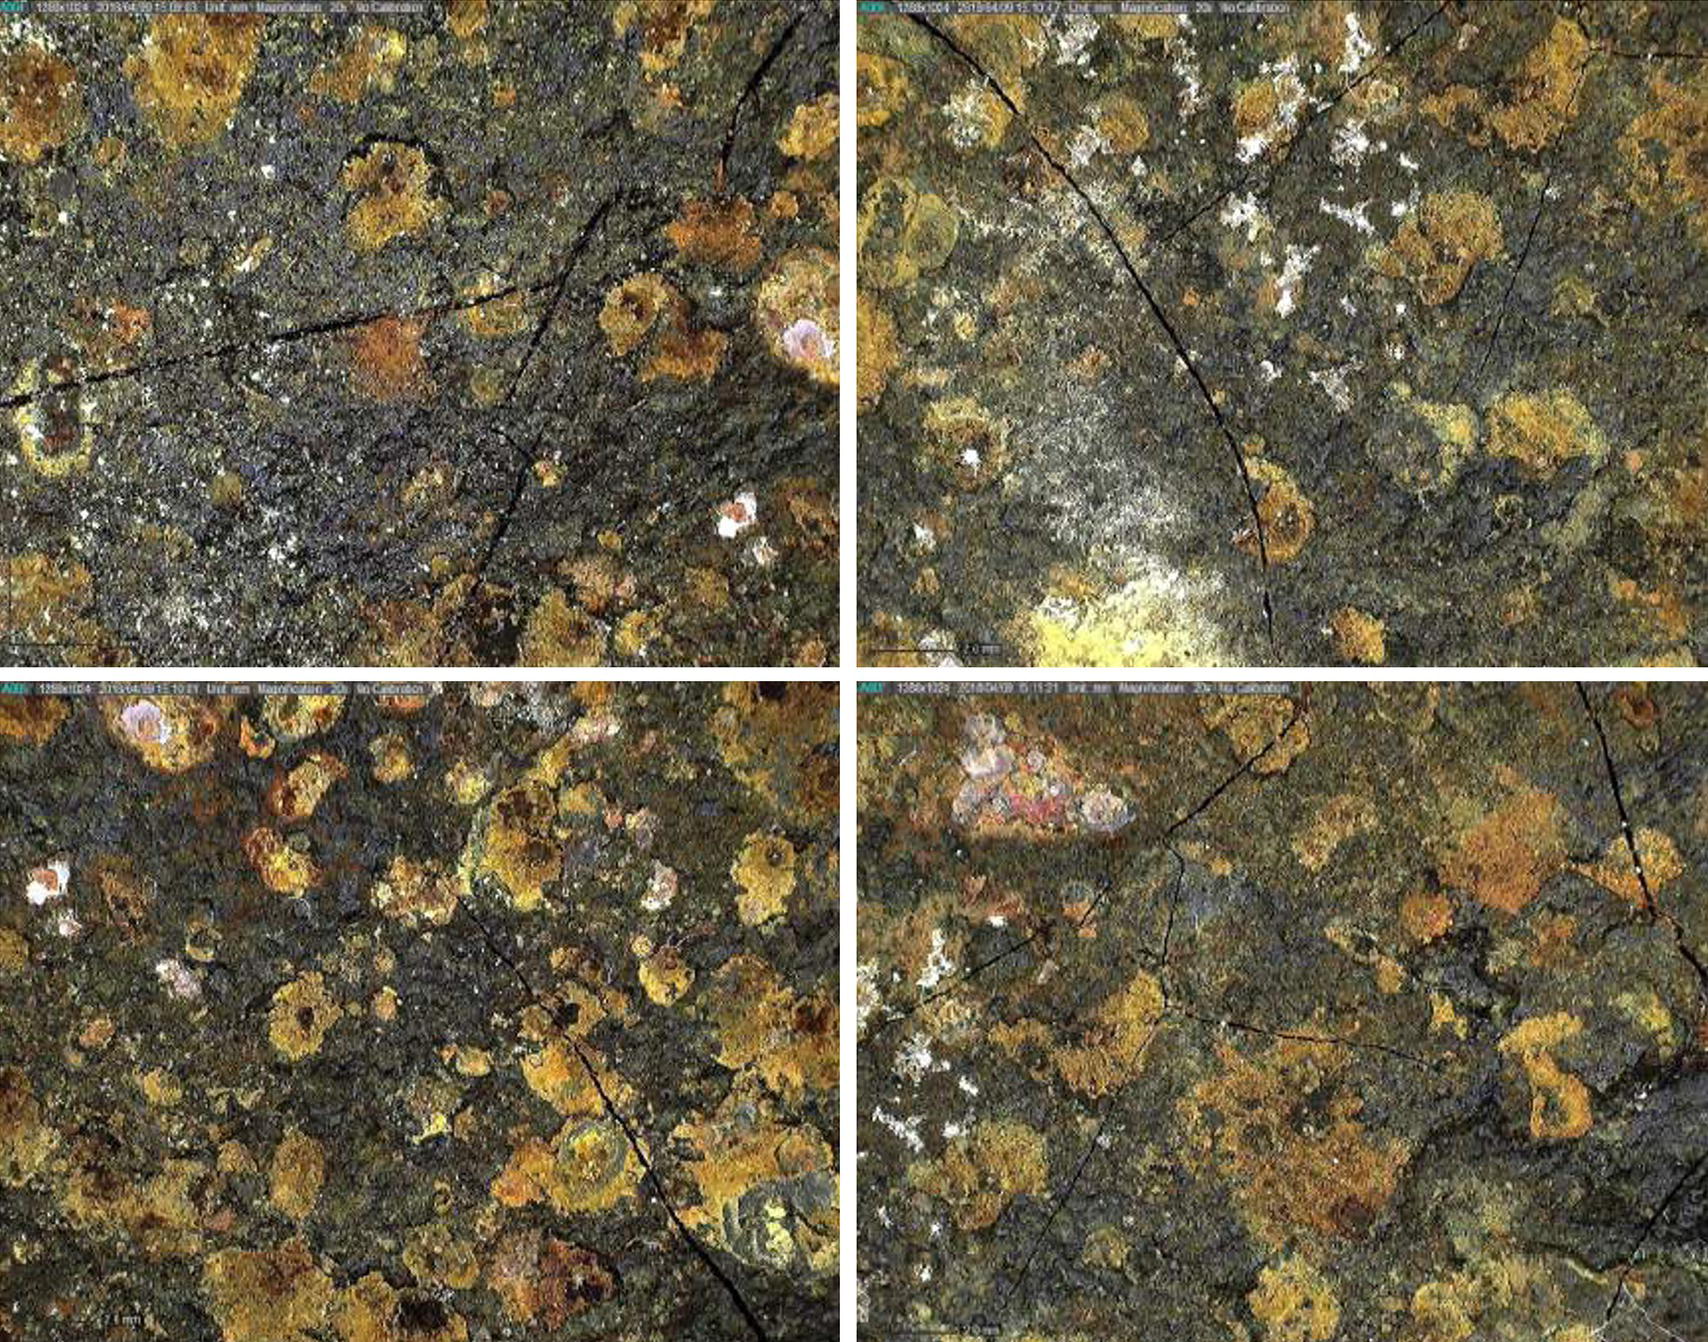
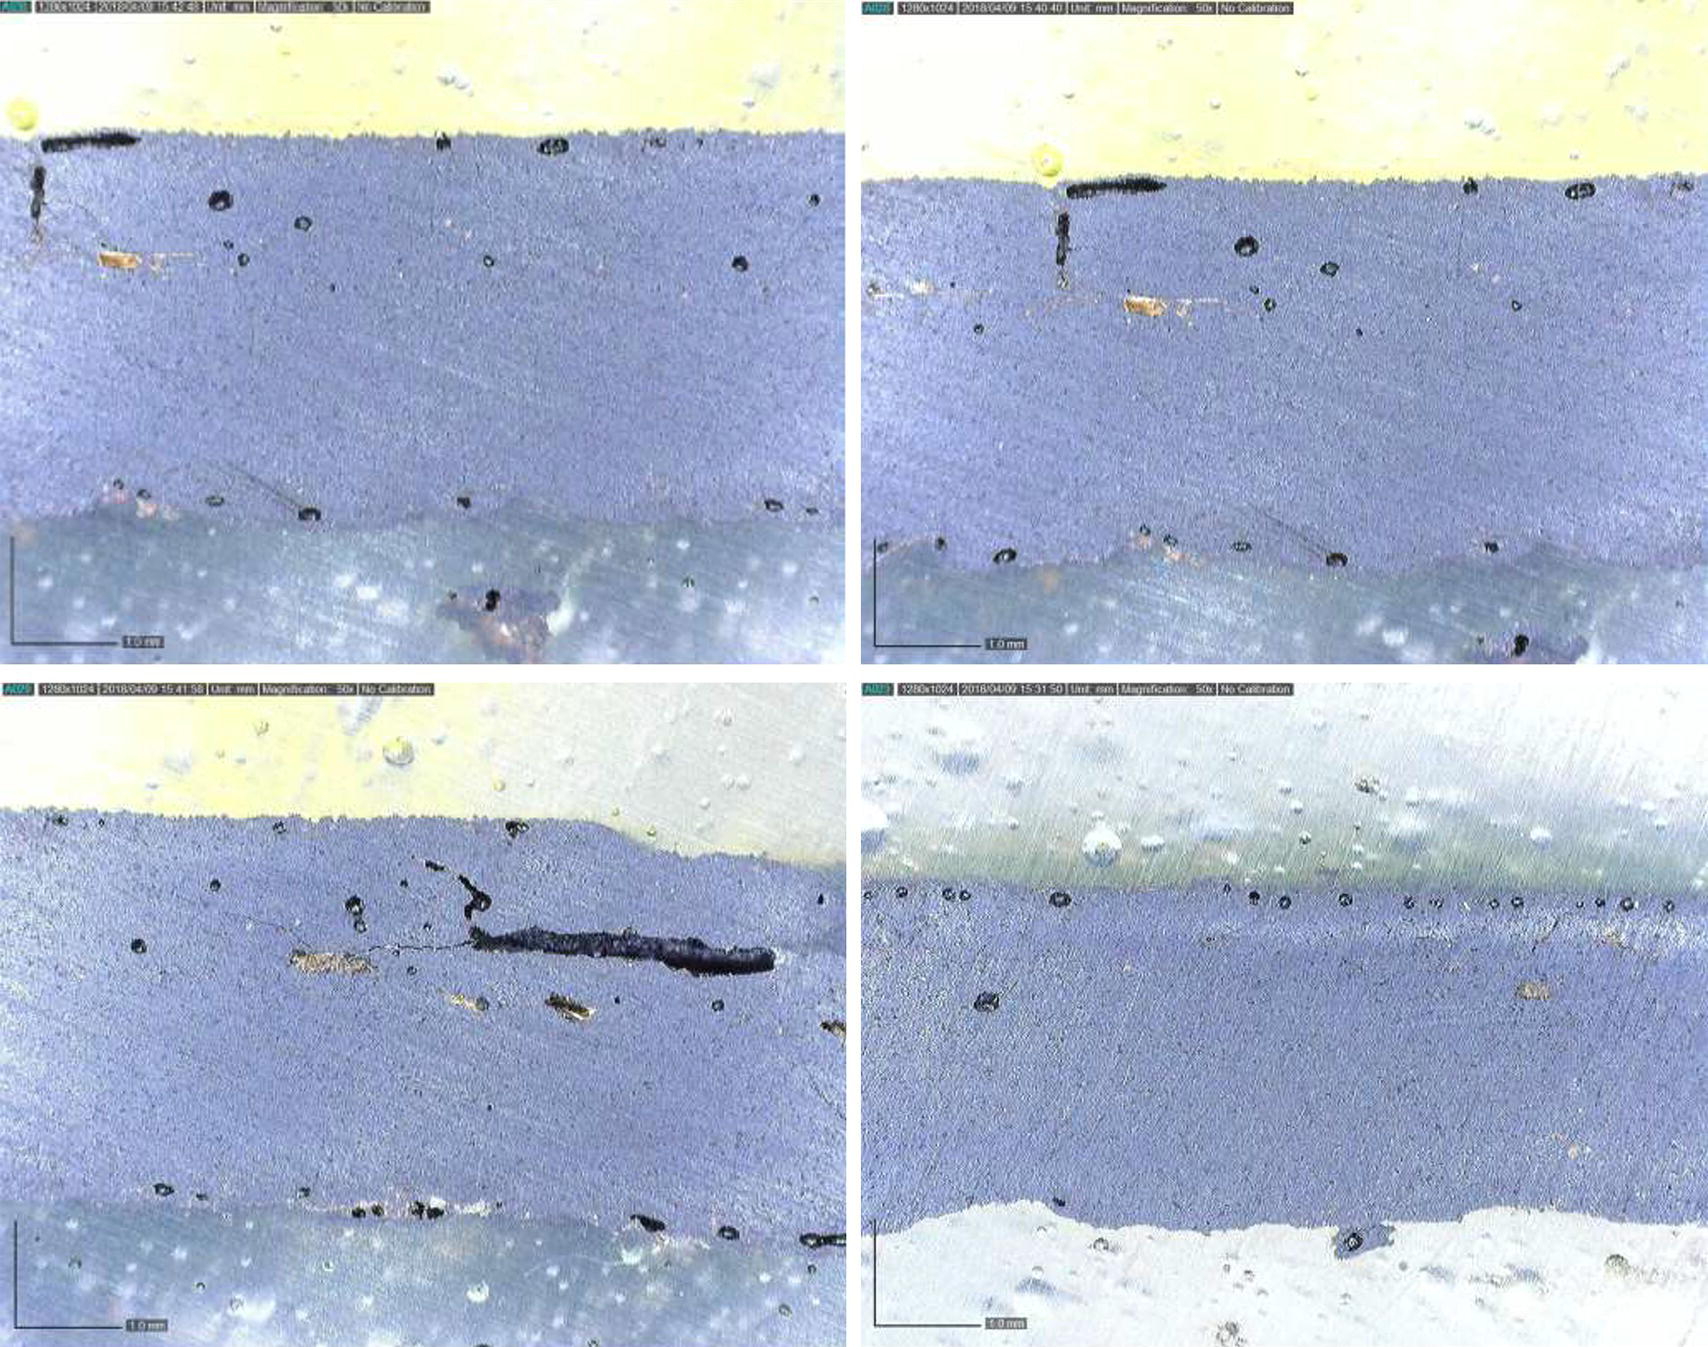
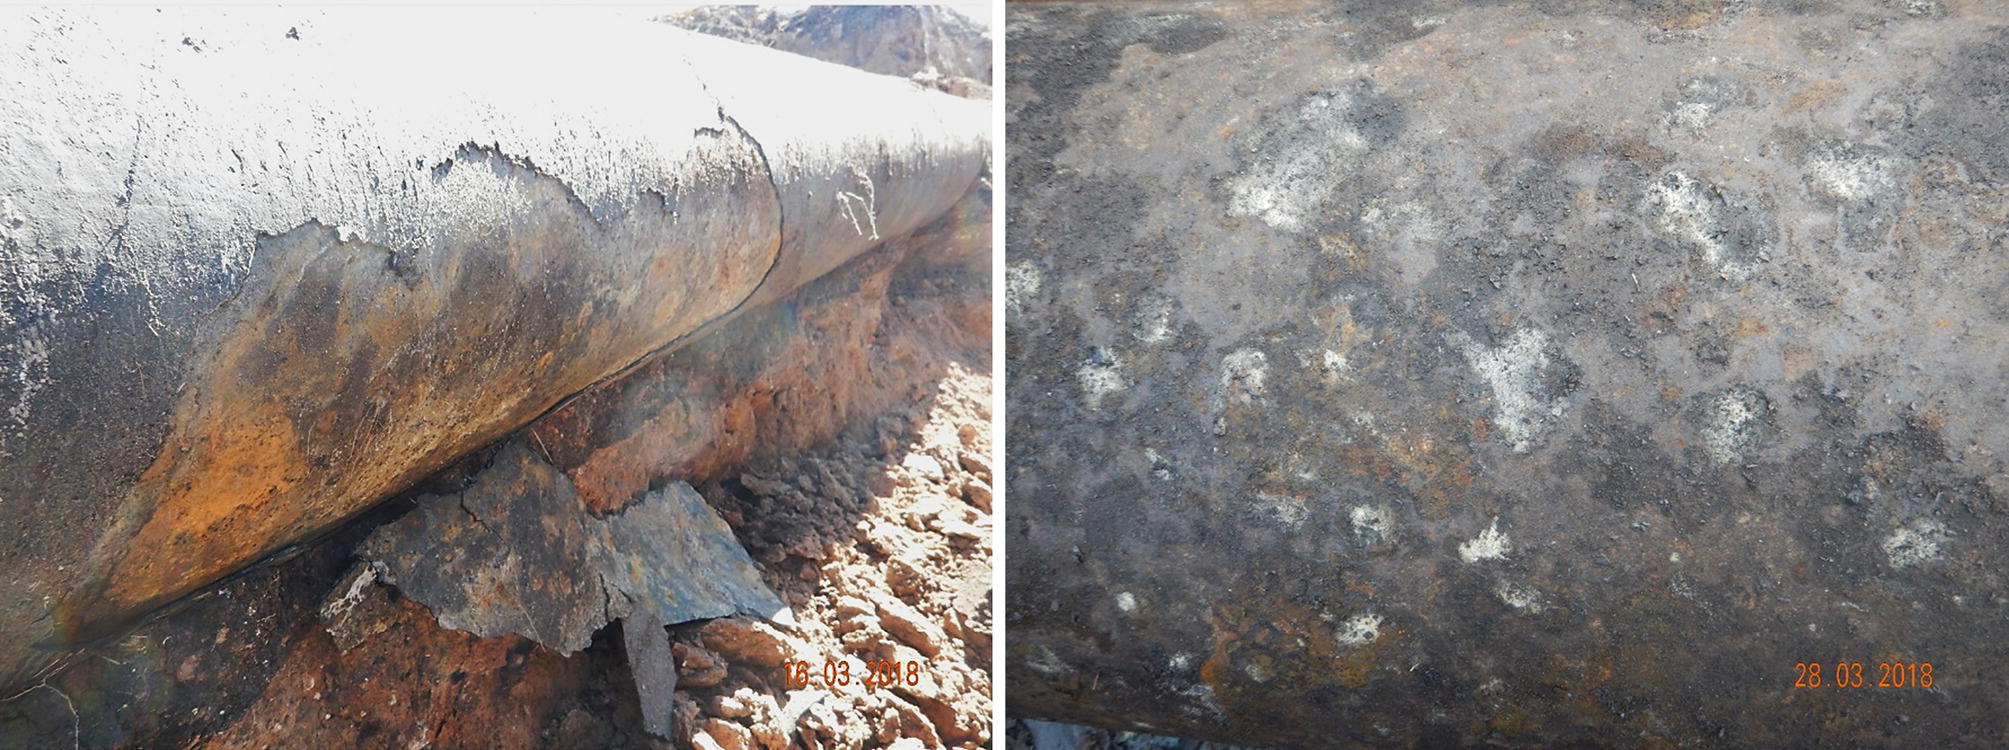
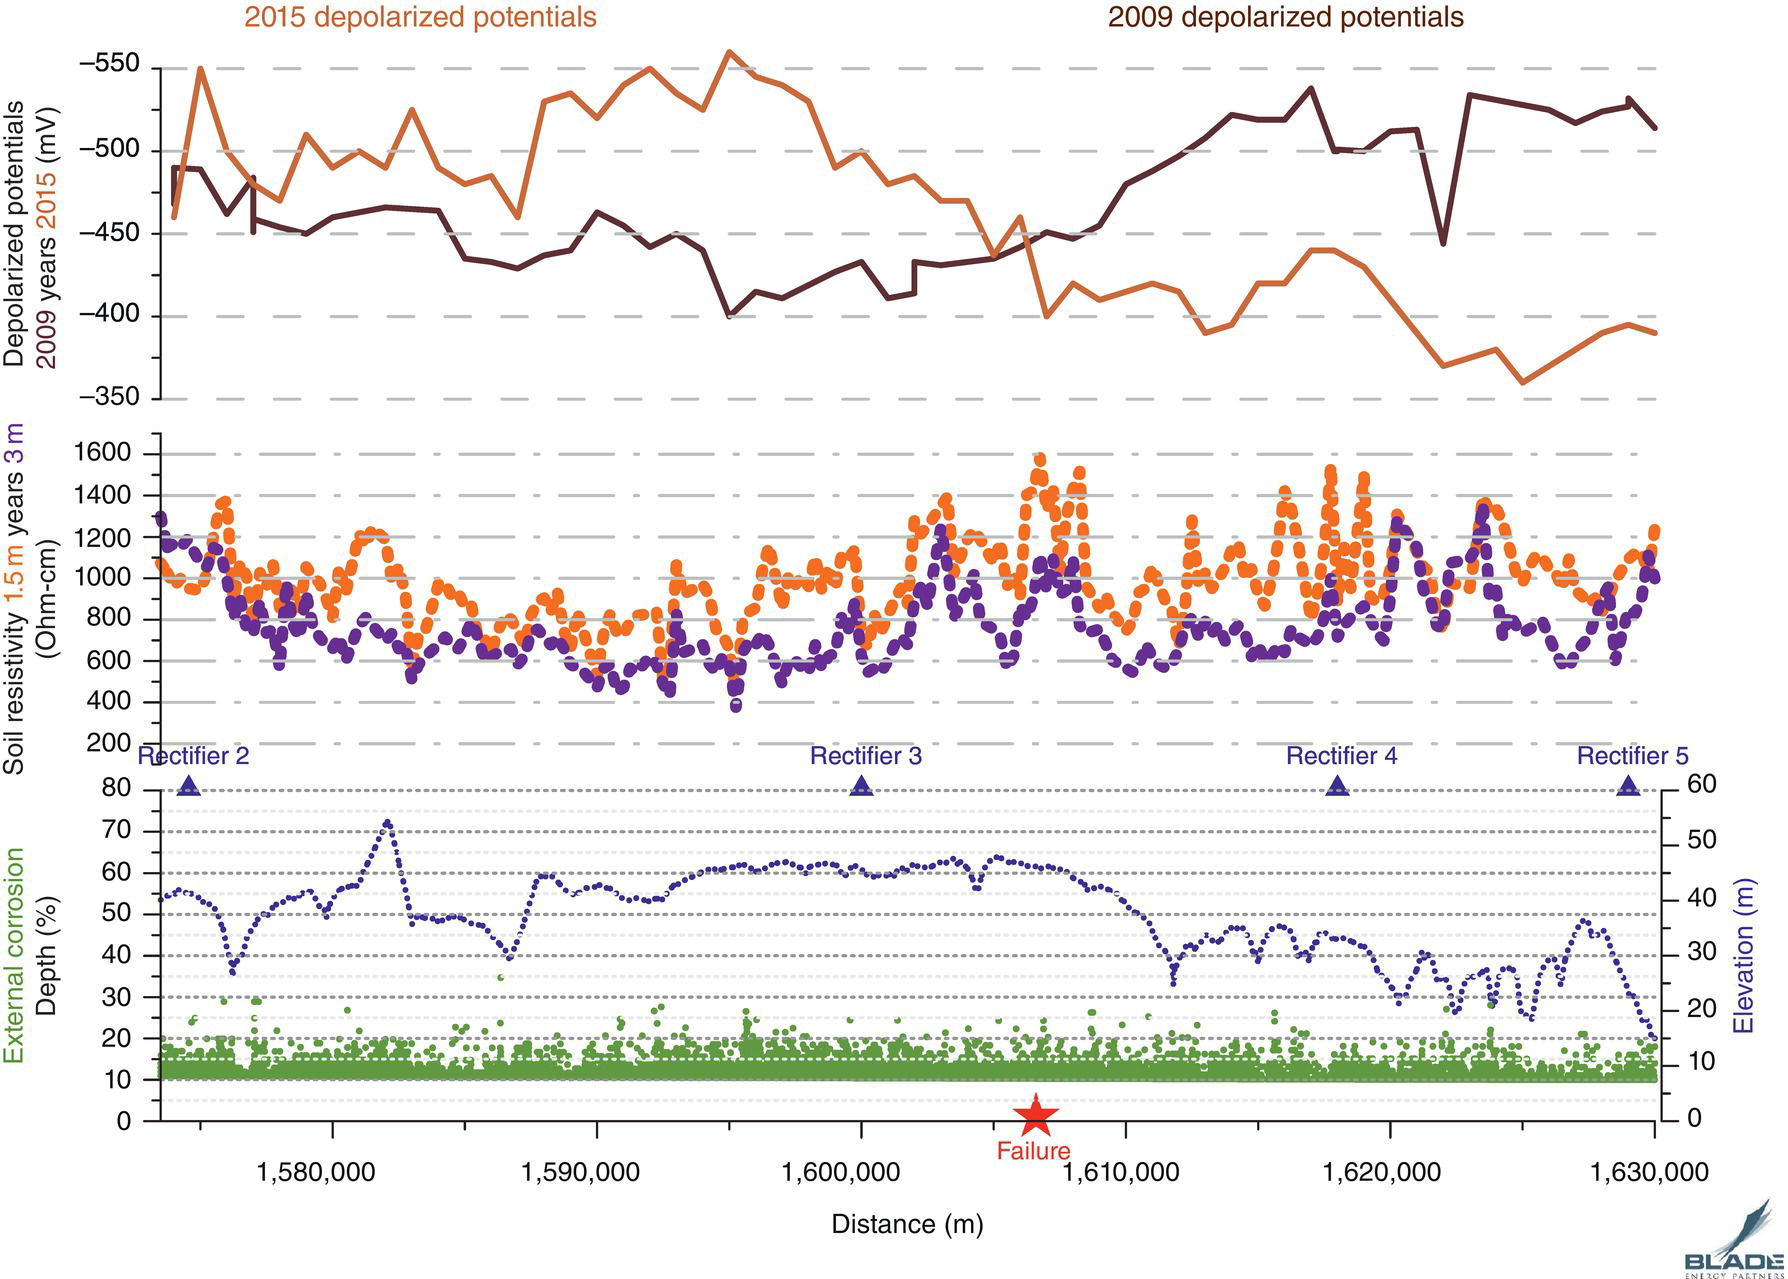
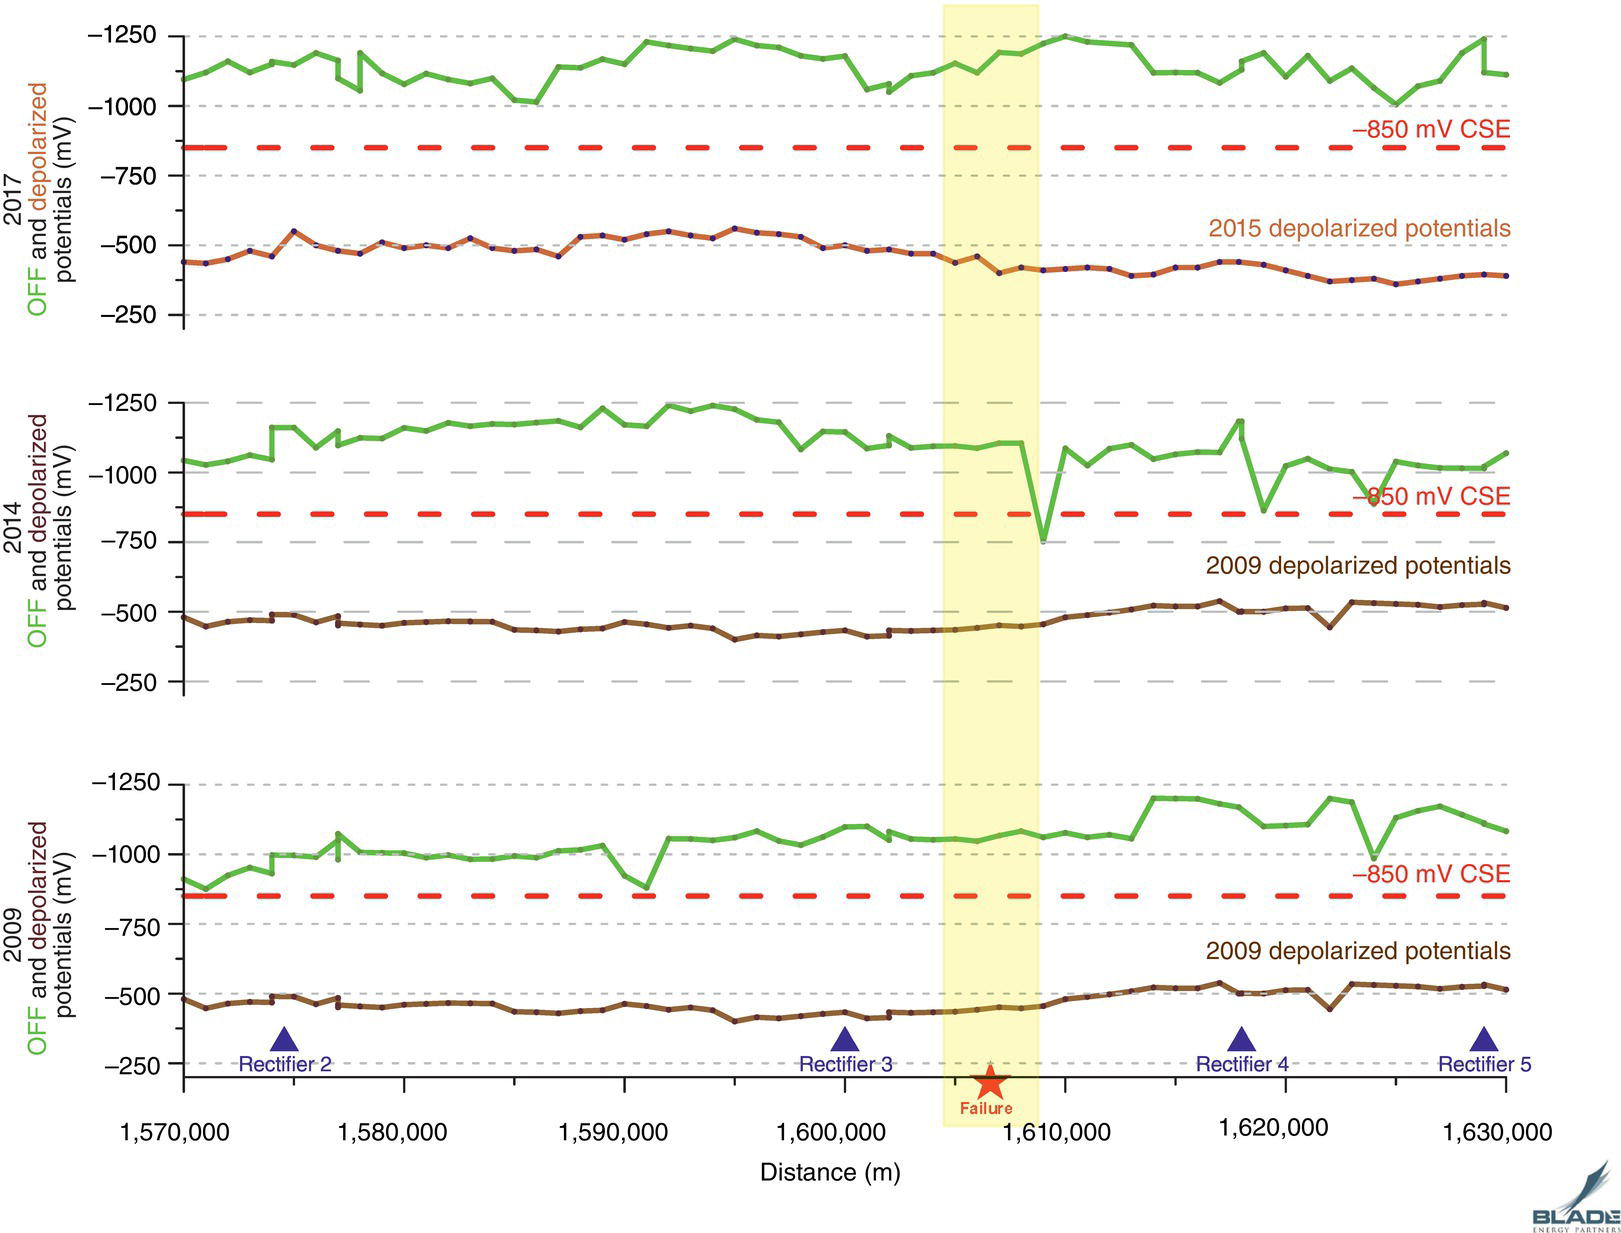
70.2.2.5 Review of the Pressure Cycling
70.2.3 Chemical and Mechanical Testing
70.2.3.1 Tensile
70.2.3.2 CVN
Tensile
Rupture Location
Leak Location
Longitudinal (MPa)
Transverse (MPa)
Longitudinal (MPa)
Transverse (MPa)
Sample
1
2
3
1
2
3
1
2
3
1
2
3
Ultimate tensile strength
597
589
580
577
580
585
589
589
586
587
591
593
Yield strength
389
387
392
458
463
465
412
405
403
402
409
408
Elongation %
27.7
29.1
30
24
27.8
28.5
30.3
30
29.6
28.6
27.2
26.6
Temperature °C
Longitudinal (10 × 5 mm, J.)
Avg
Transverse (10 × 5 mm, J.)
Avg
Rupture Location
−50
16
18
16
16.7
7
6
6
6.3
−25
24
22
24
23.3
8
8
10
8.7
0
24
28
26
26.0
10
10
10
10.0
25
42
40
46
42.7
22
18
22
20.7
50
50
50
52
50.7
24
24
23
23.7
Leak Location
−50
10
8
10
9.3
8
6
6
6.7
−25
14
14
12
13.3
10
10
8
9.3
0
28
22
26
25.3
18
22
22
20.7
25
30
32
30
30.7
24
24
24
24.0
50
30
31
32
31.0
24
26
24
24.7 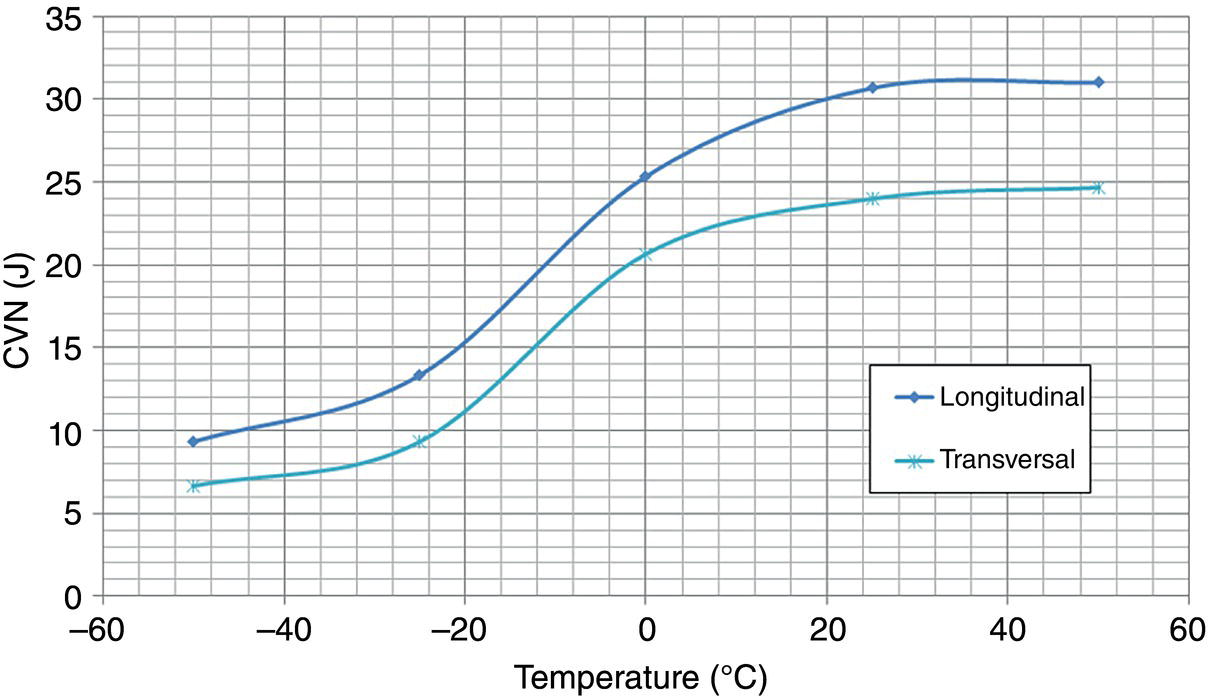
Zone
Vicker Hardness (HV200g)
OD
226.1 ± 14.1
MW
210.7 ± 8.6
ID
195.3 ± 6.9
70.2.3.3 Hardness
70.2.3.4 Fracture Toughness
Orientation
J (lb/in)
KJ (Ksi√in.)
Avg
Rupture Location
L-C1
316
102
106.3
L-C2
359
109
L-C3
353
108
C-L1
353
108
113.3
C-L2
332
105
C-L3
453
127
Leak Location
L-C1
459
122
127.7
L-C2
565
135
L-C3
494
126
C-L1
379
111
111.0
C-L2
414
116
C-L3
353
107
C-L4
378
110
70.2.3.5 Chemical Composition
70.2.3.6 Chemical and Mechanical Testing Summary
Elements %
Rupture Location
Leak Location
Sample 1
Sample 2
Sample 3
Sample 1
C
0.280
0.280
0.280
0.250
Mn
1.240
1.360
1.250
1.000
Si
0.140
0.160
0.140
0.040
P
0.016
0.016
0.016
0.010
S
0.020
0.021
0.018
0.013
Cr
0.020
0.020
0.020
0.030
Ni
0.030
0.010
0.030
0.010
Mo
0.020
0.020
0.010
0.010
Cu
0.058
0.058
0.056
0.022
V
0.001
0.001
0.001
0.001
70.2.4 Fractographic and Metallographic Evaluations
70.2.4.1 Rupture Failure (Axial Cracking)
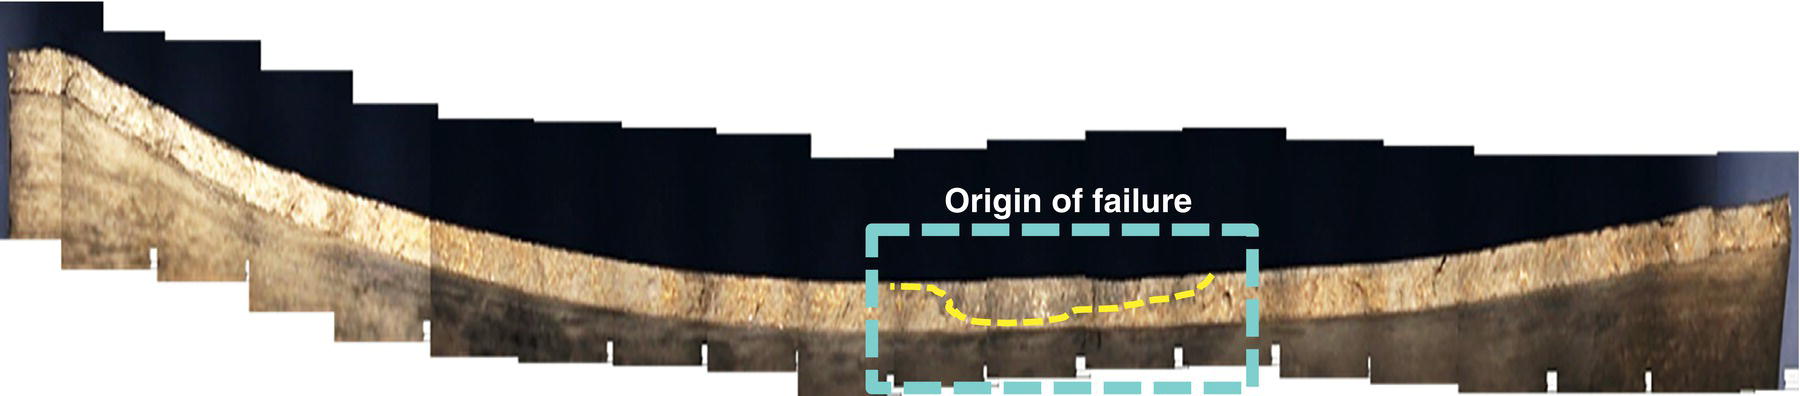
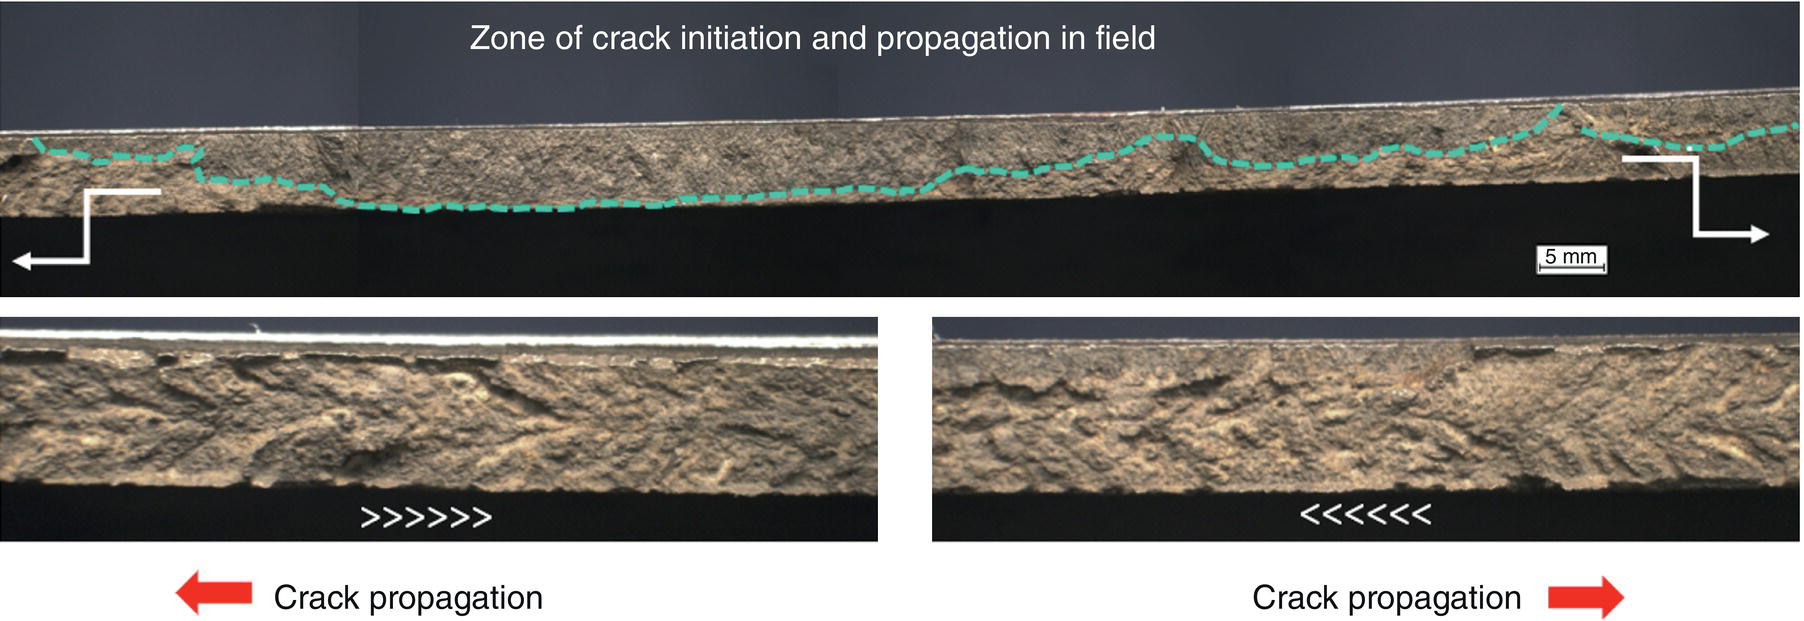
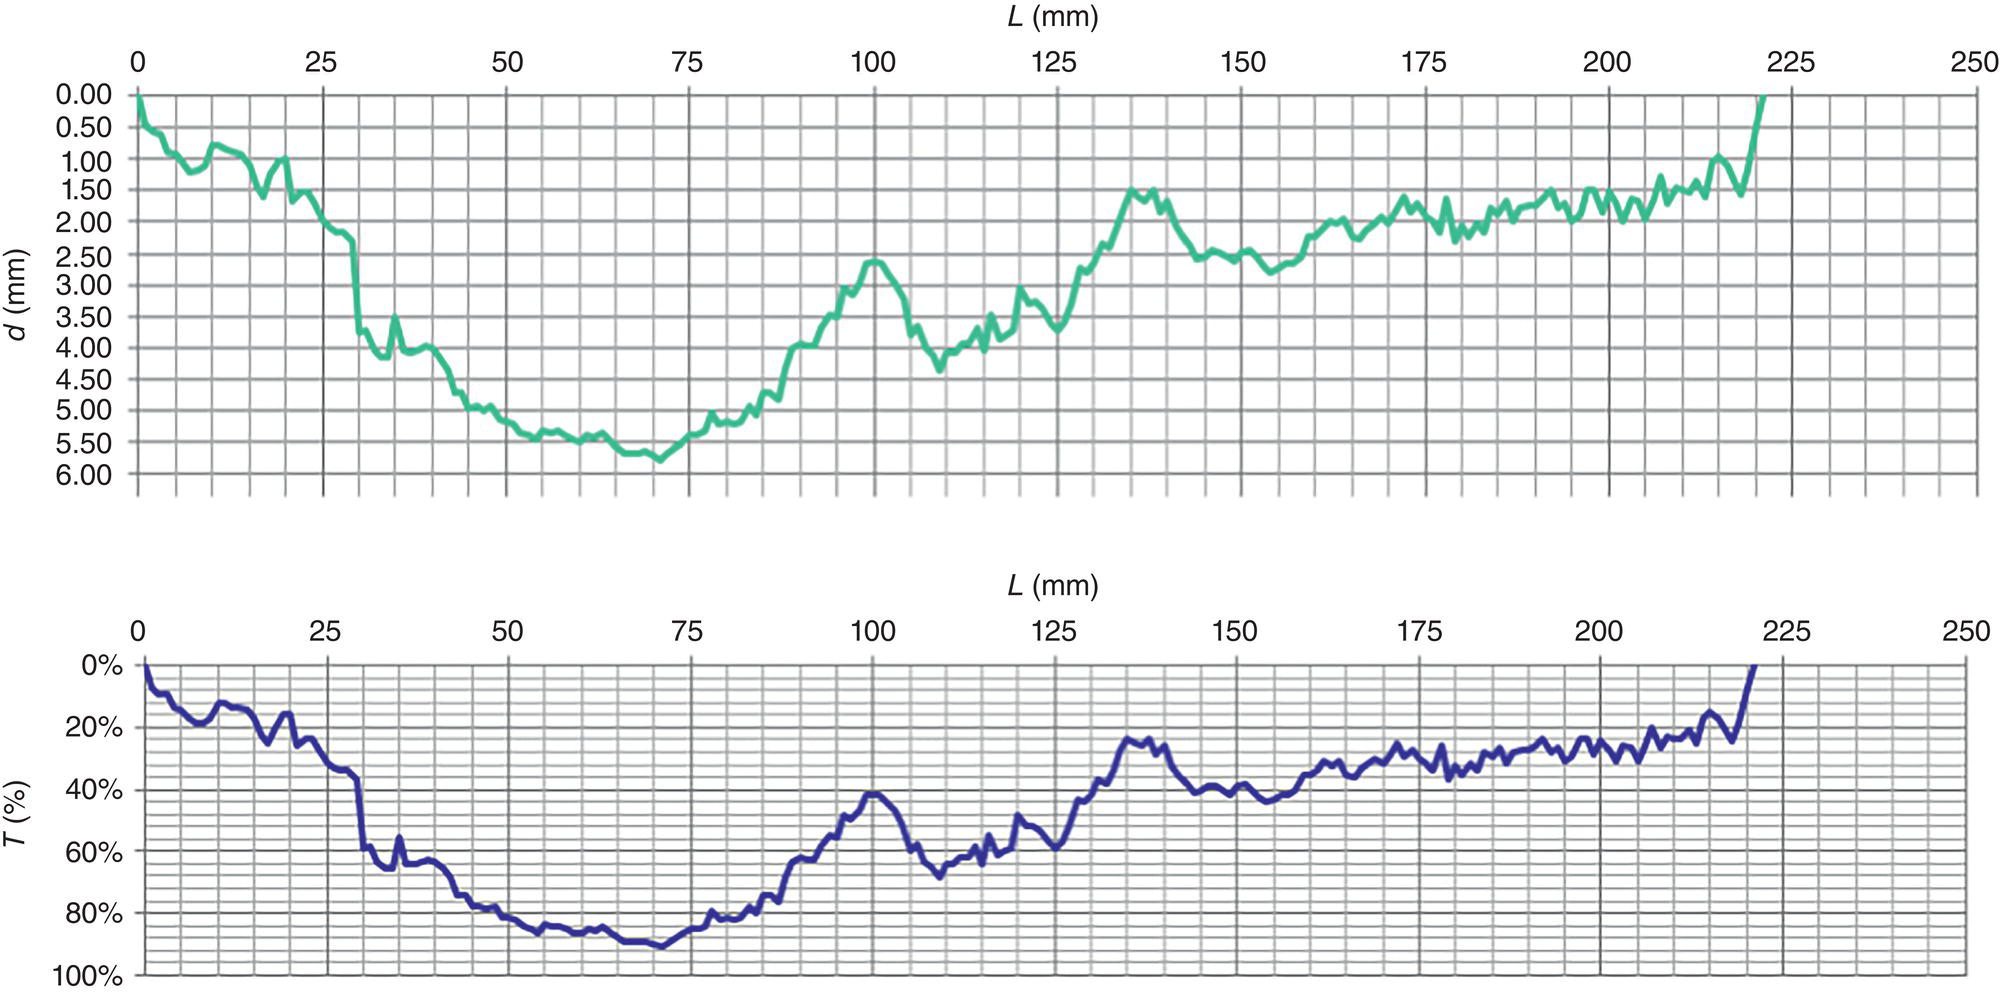
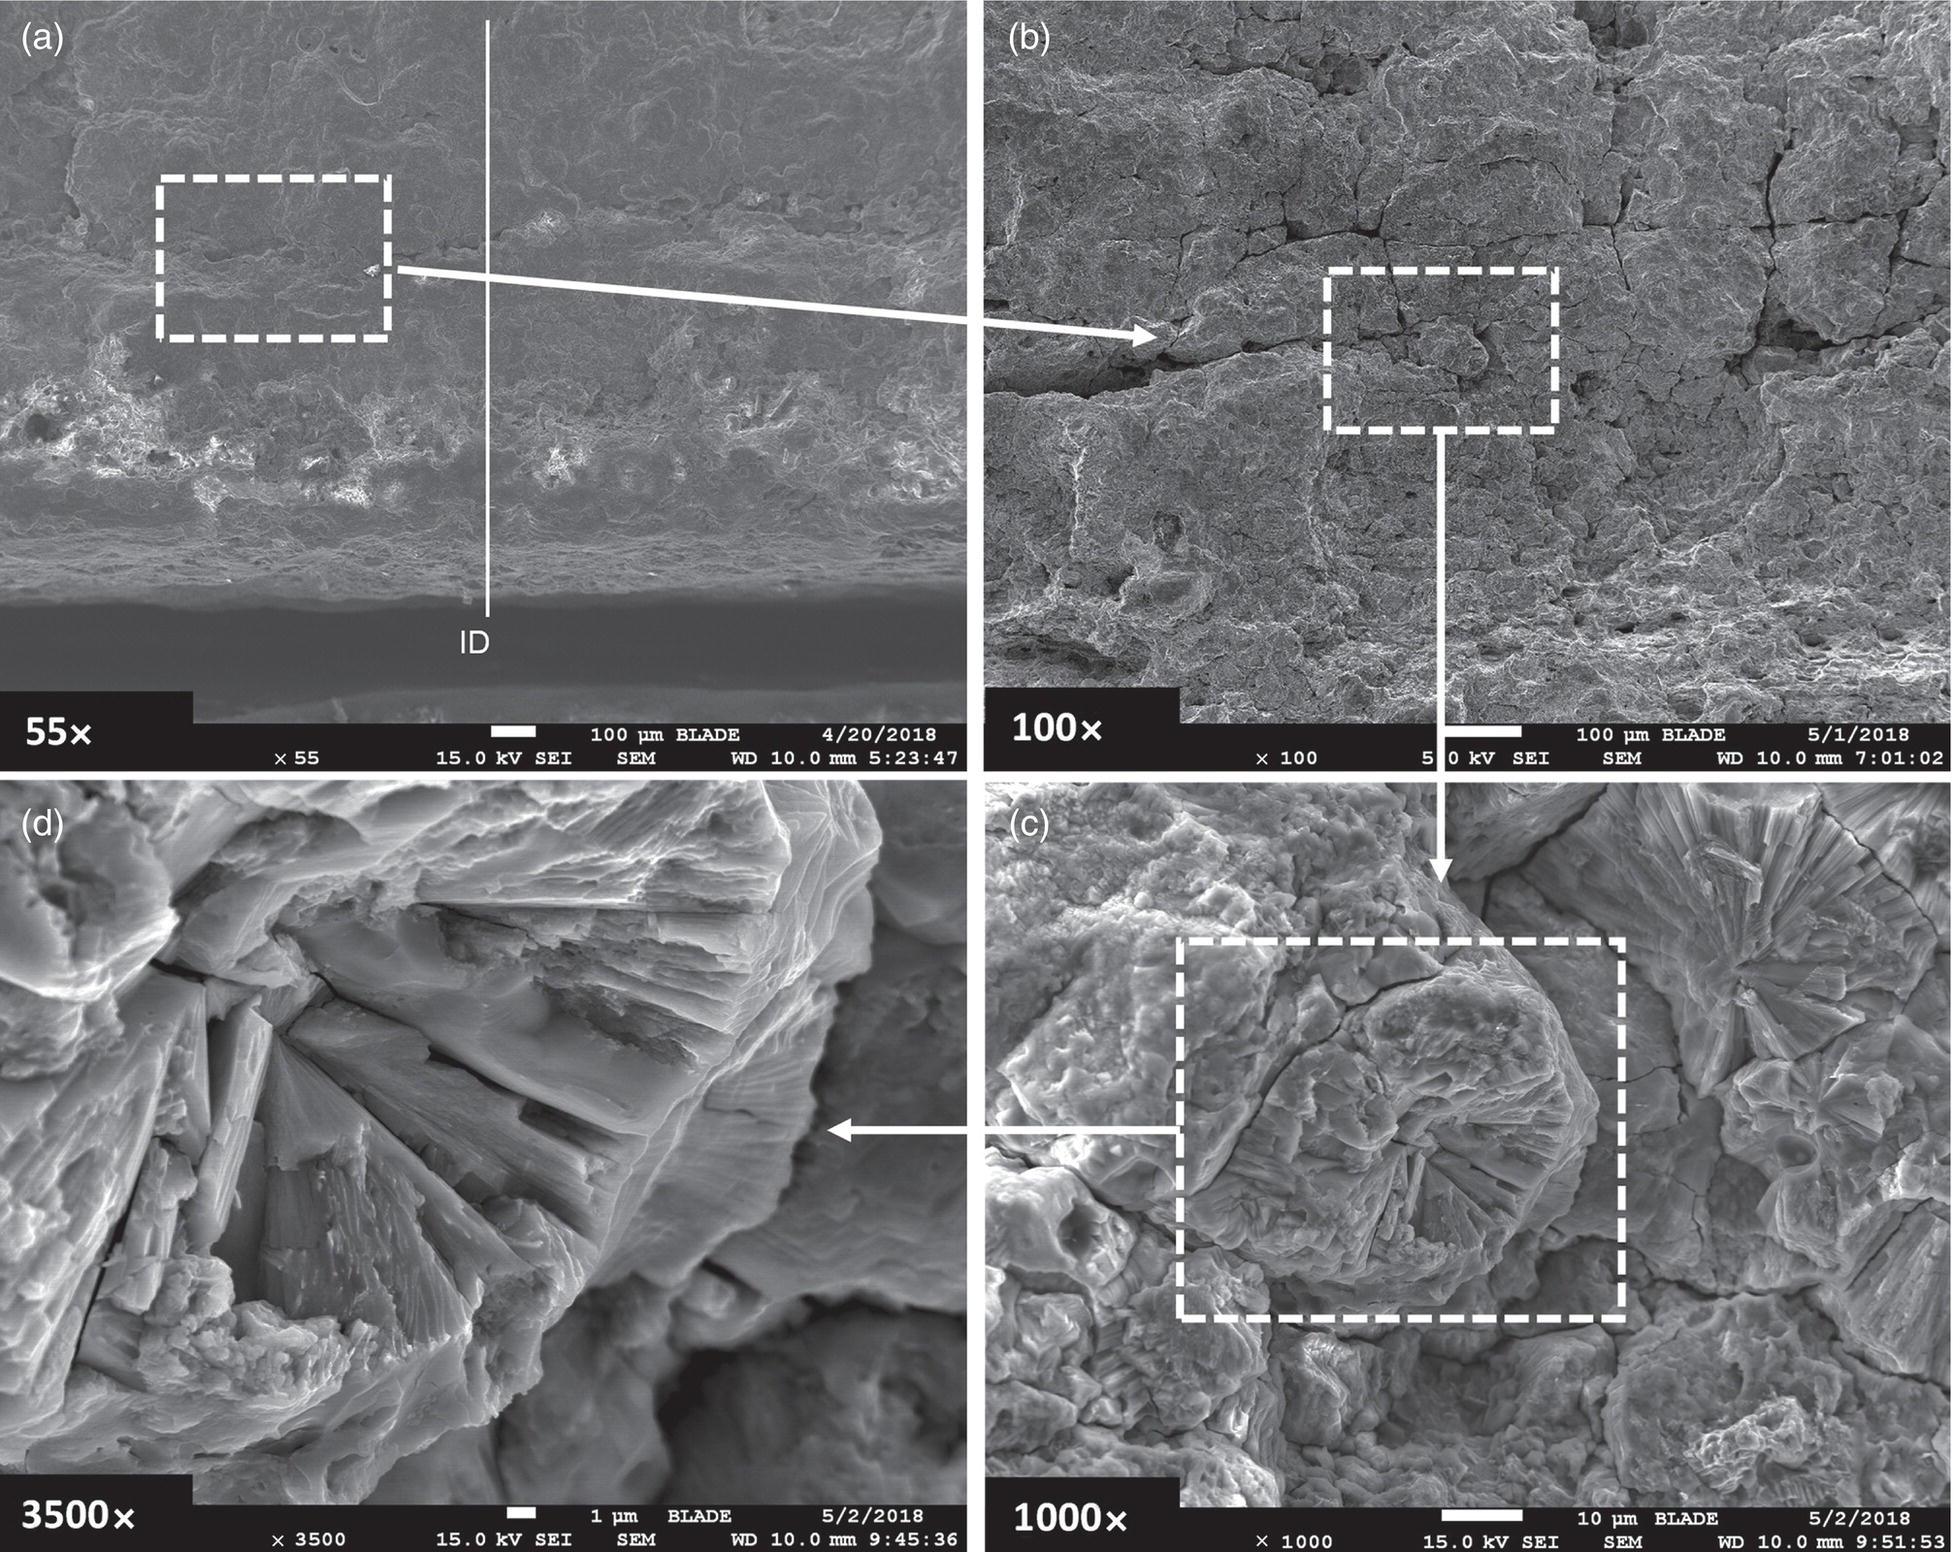

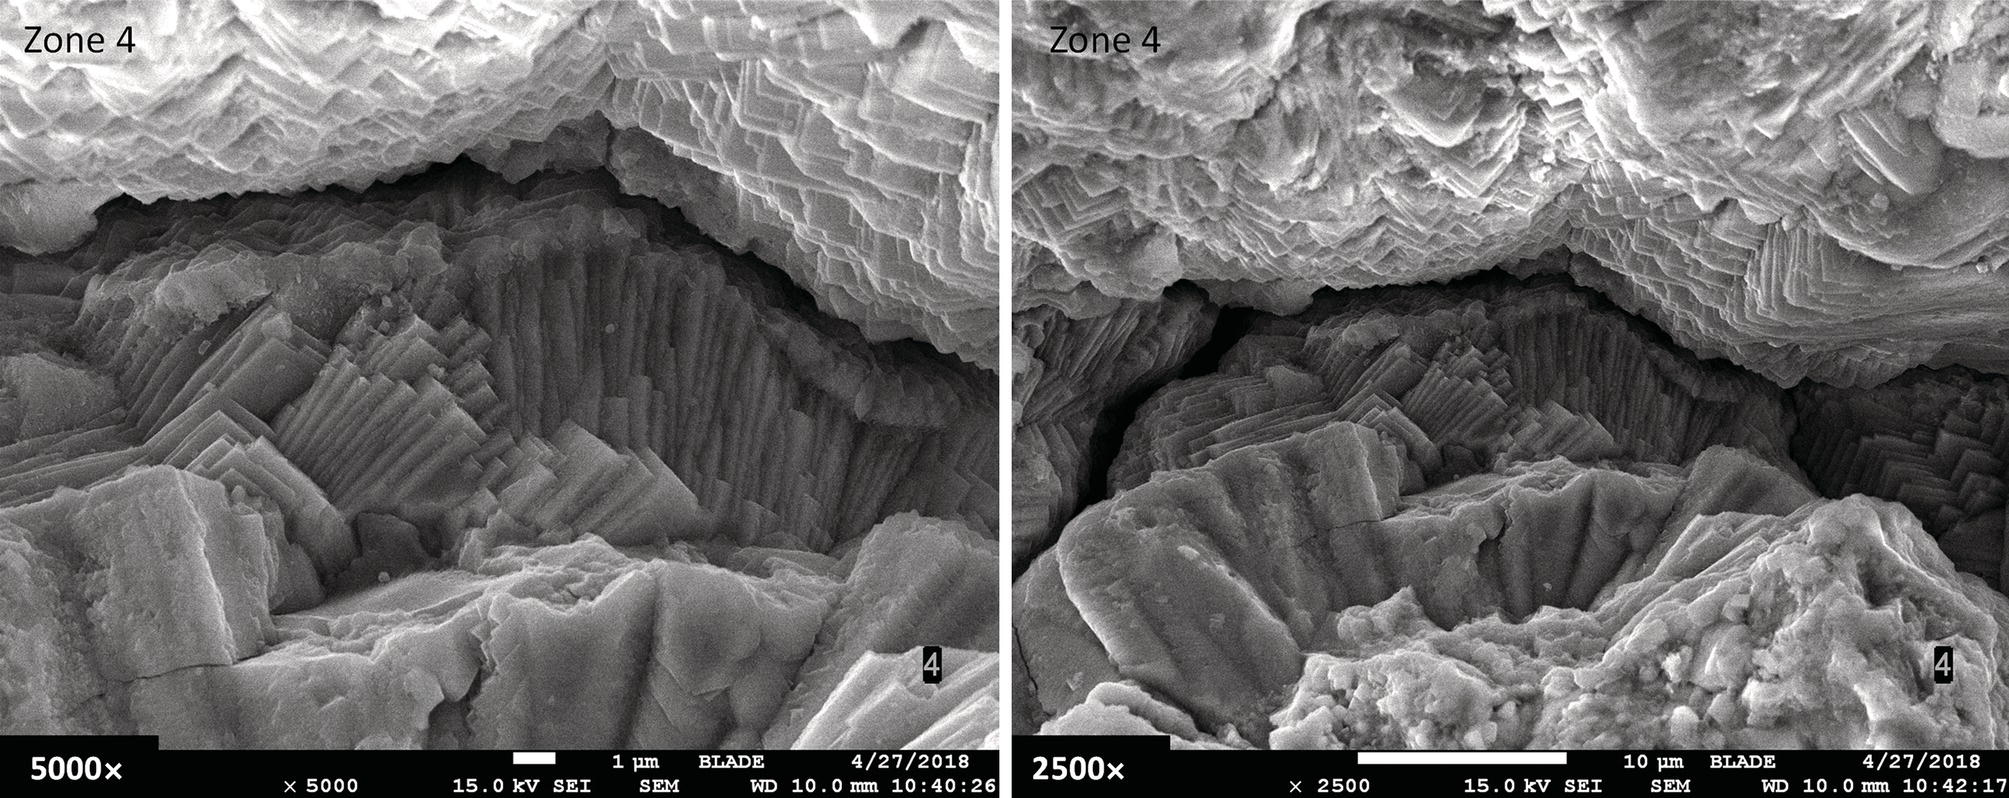
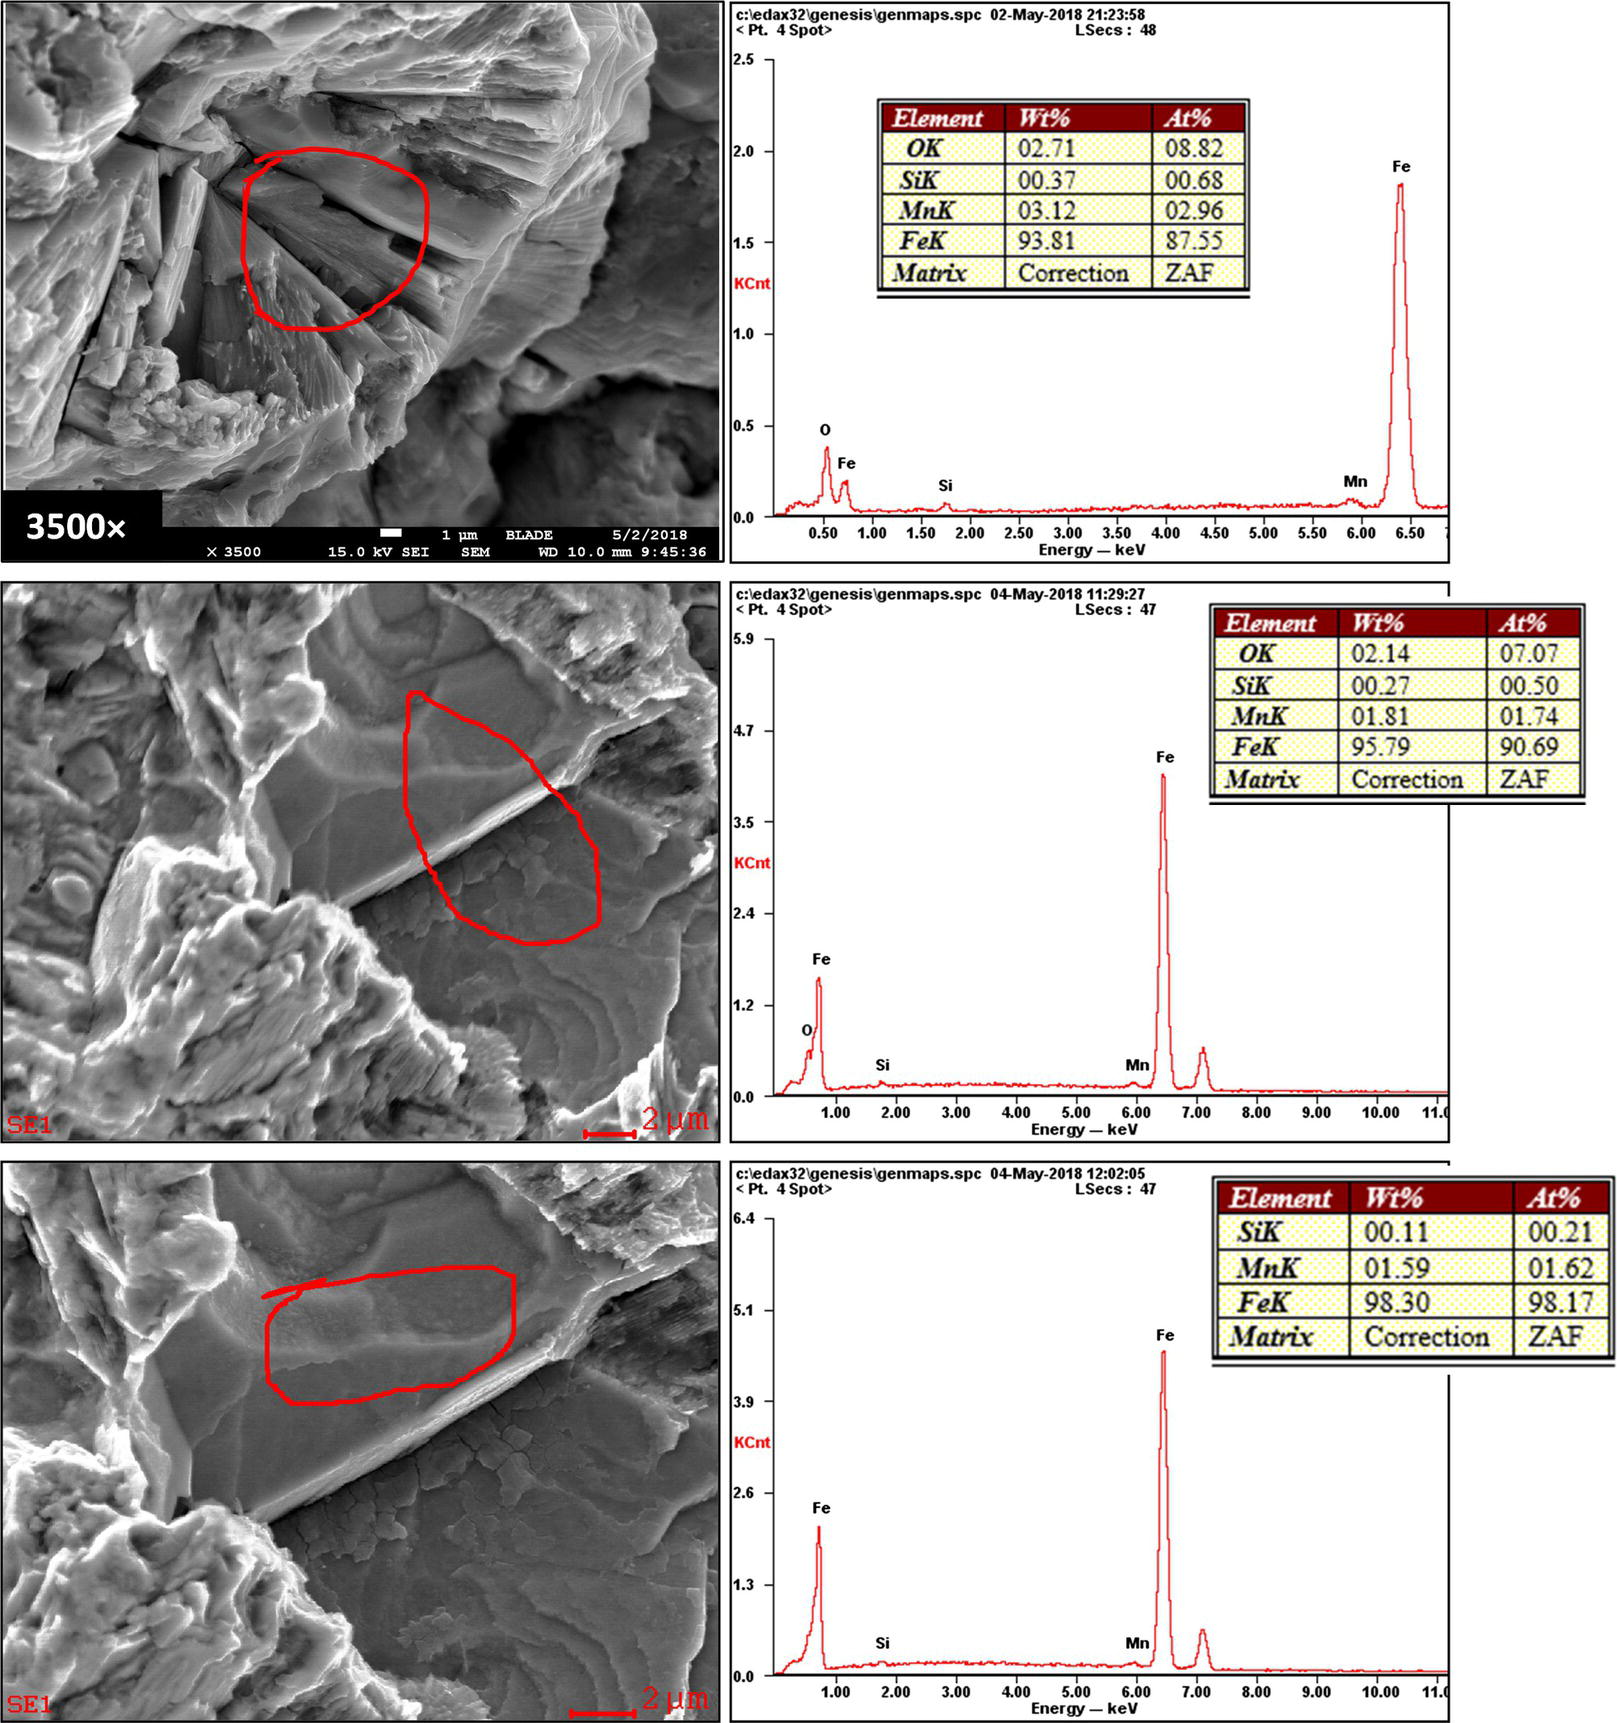
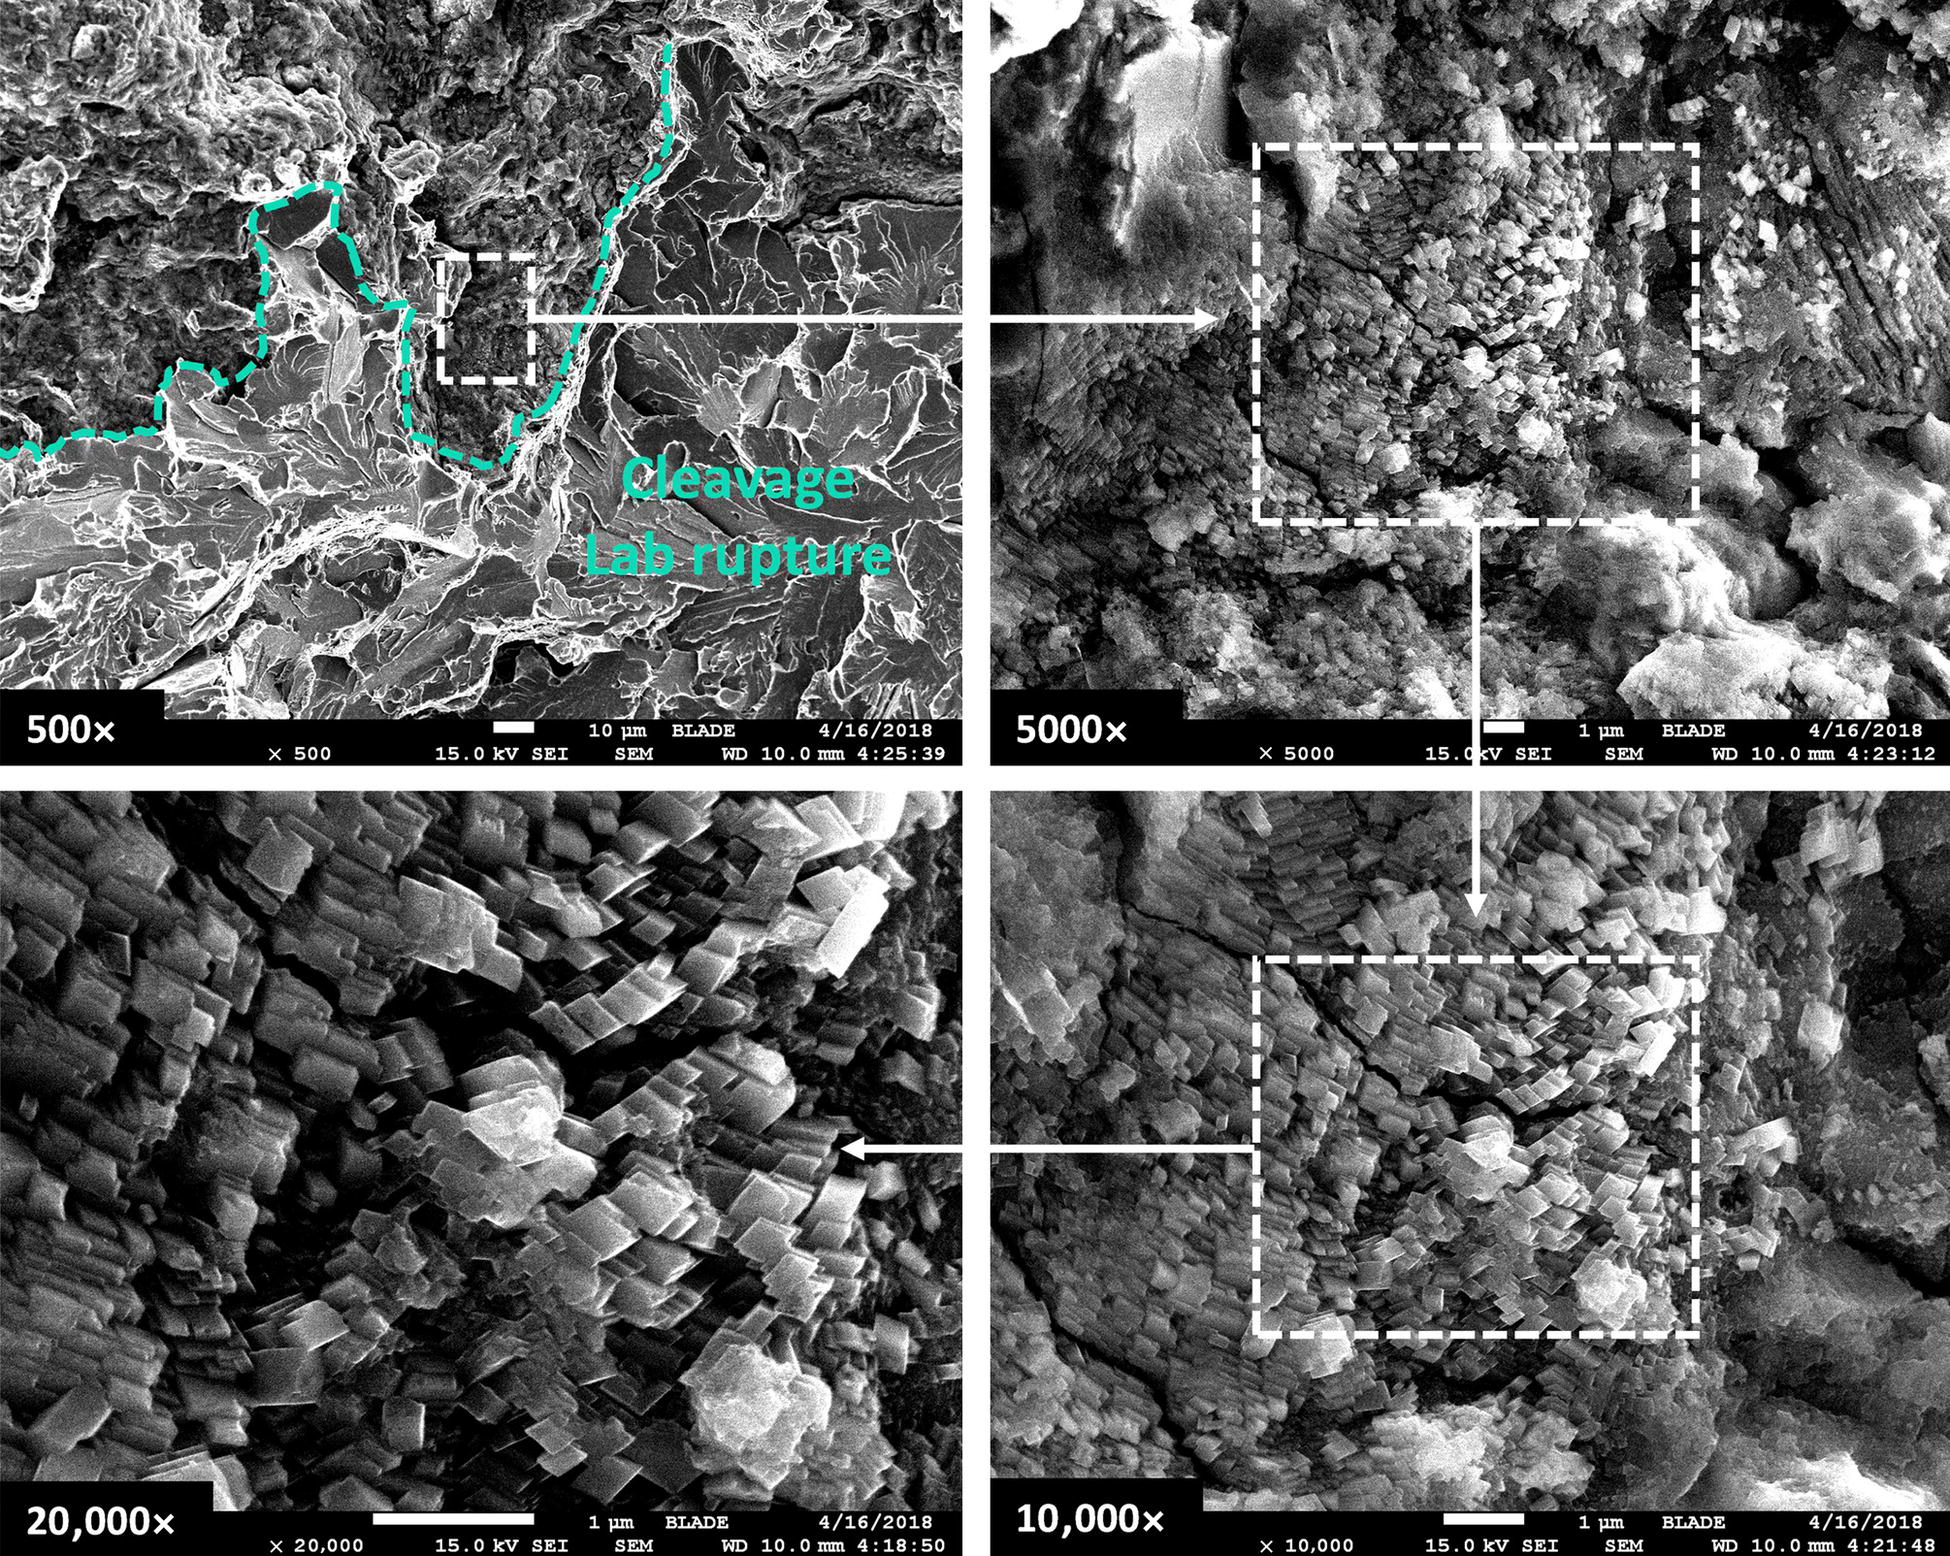
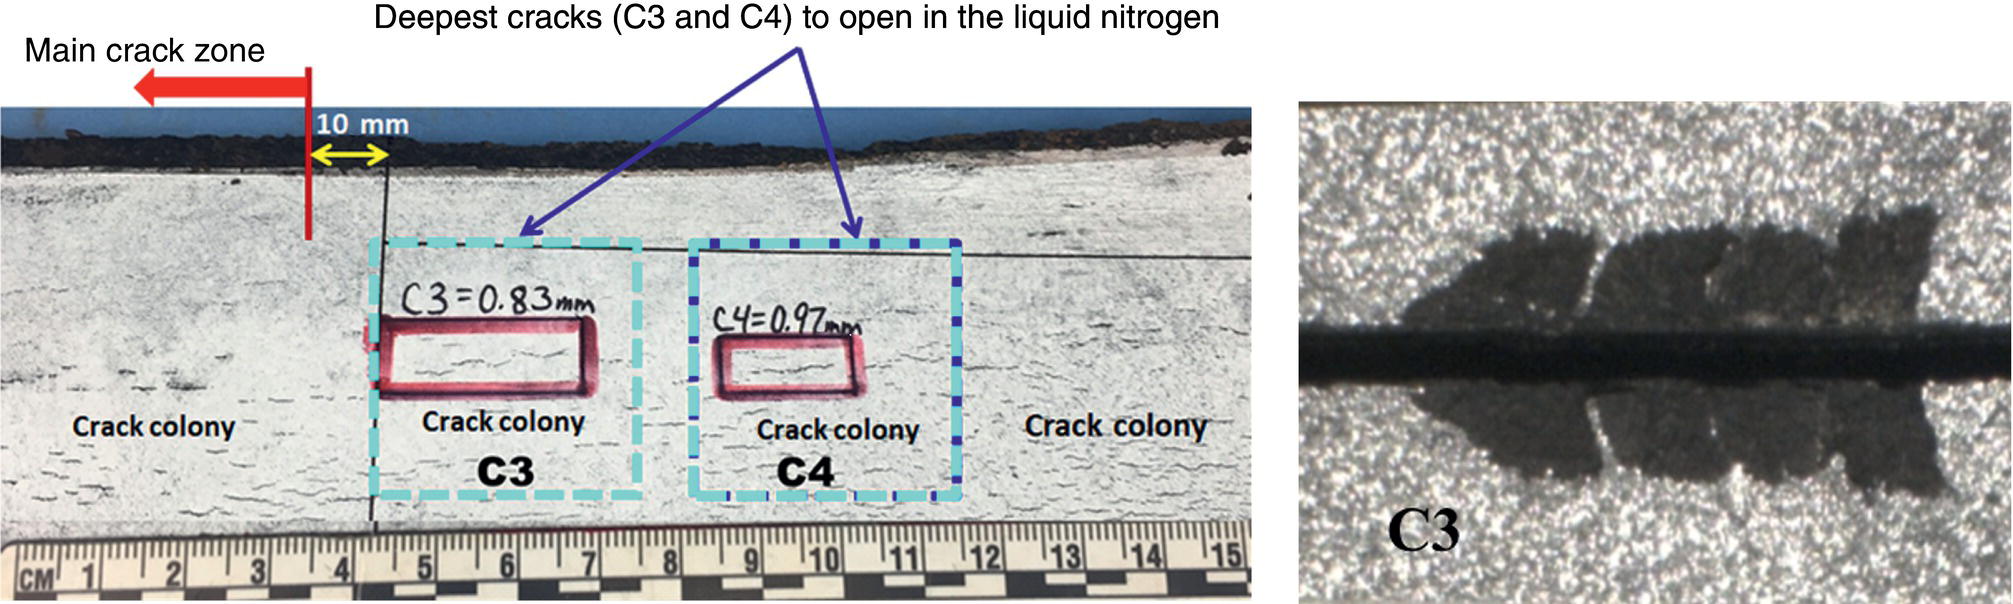
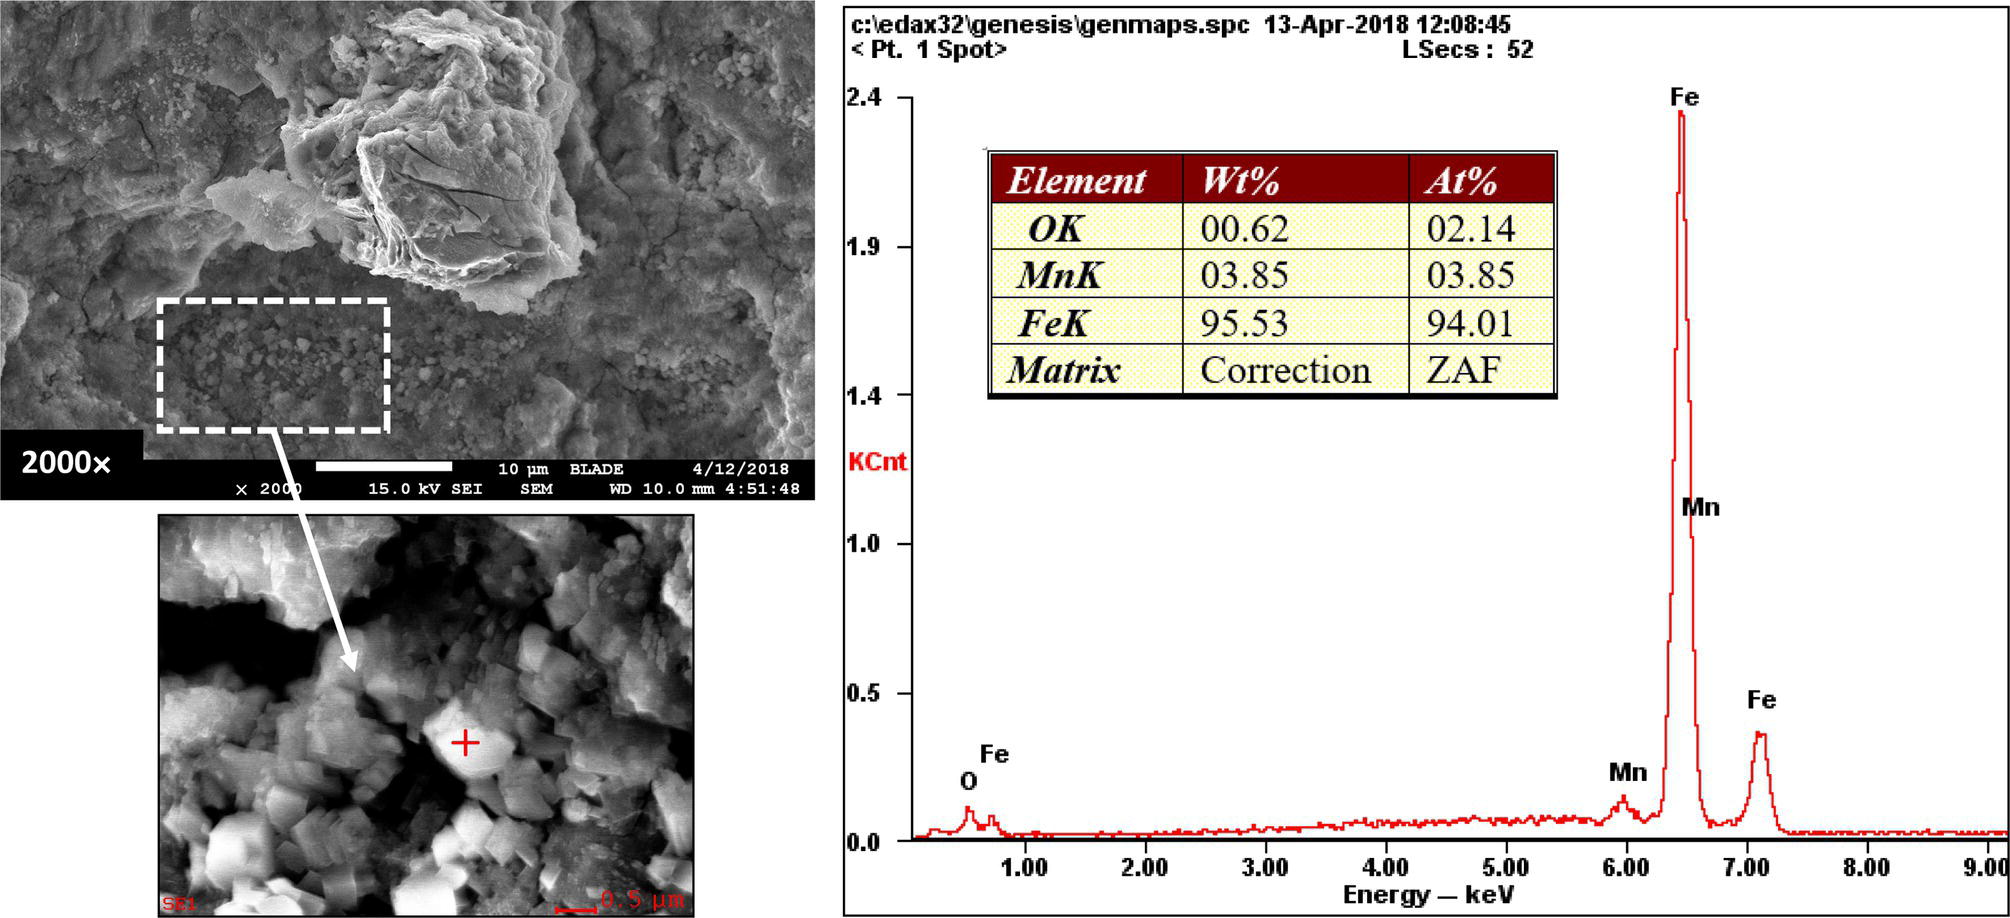
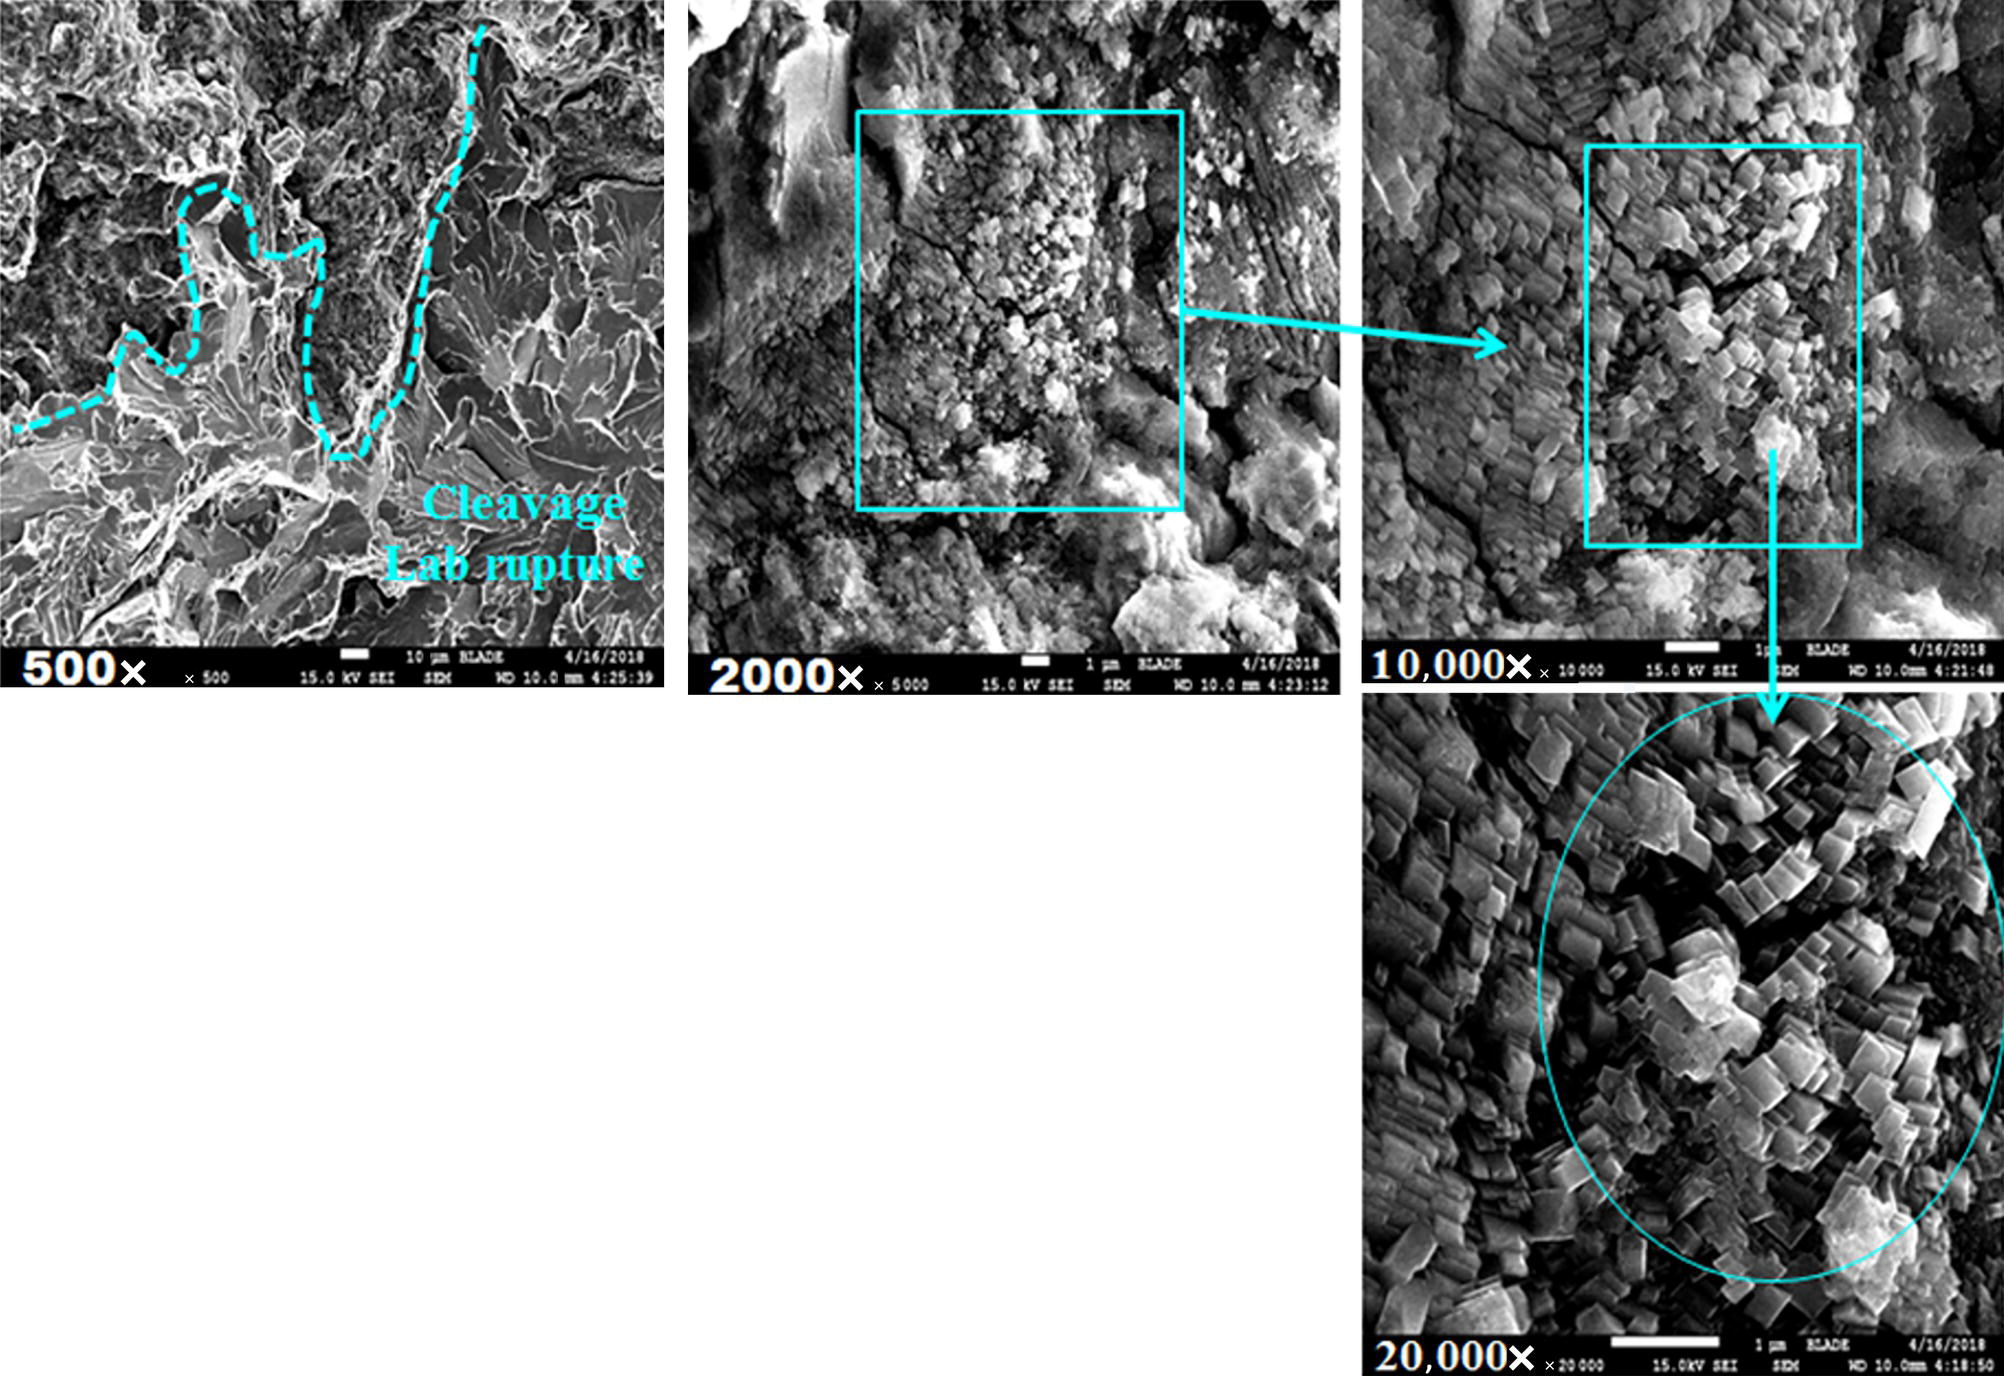
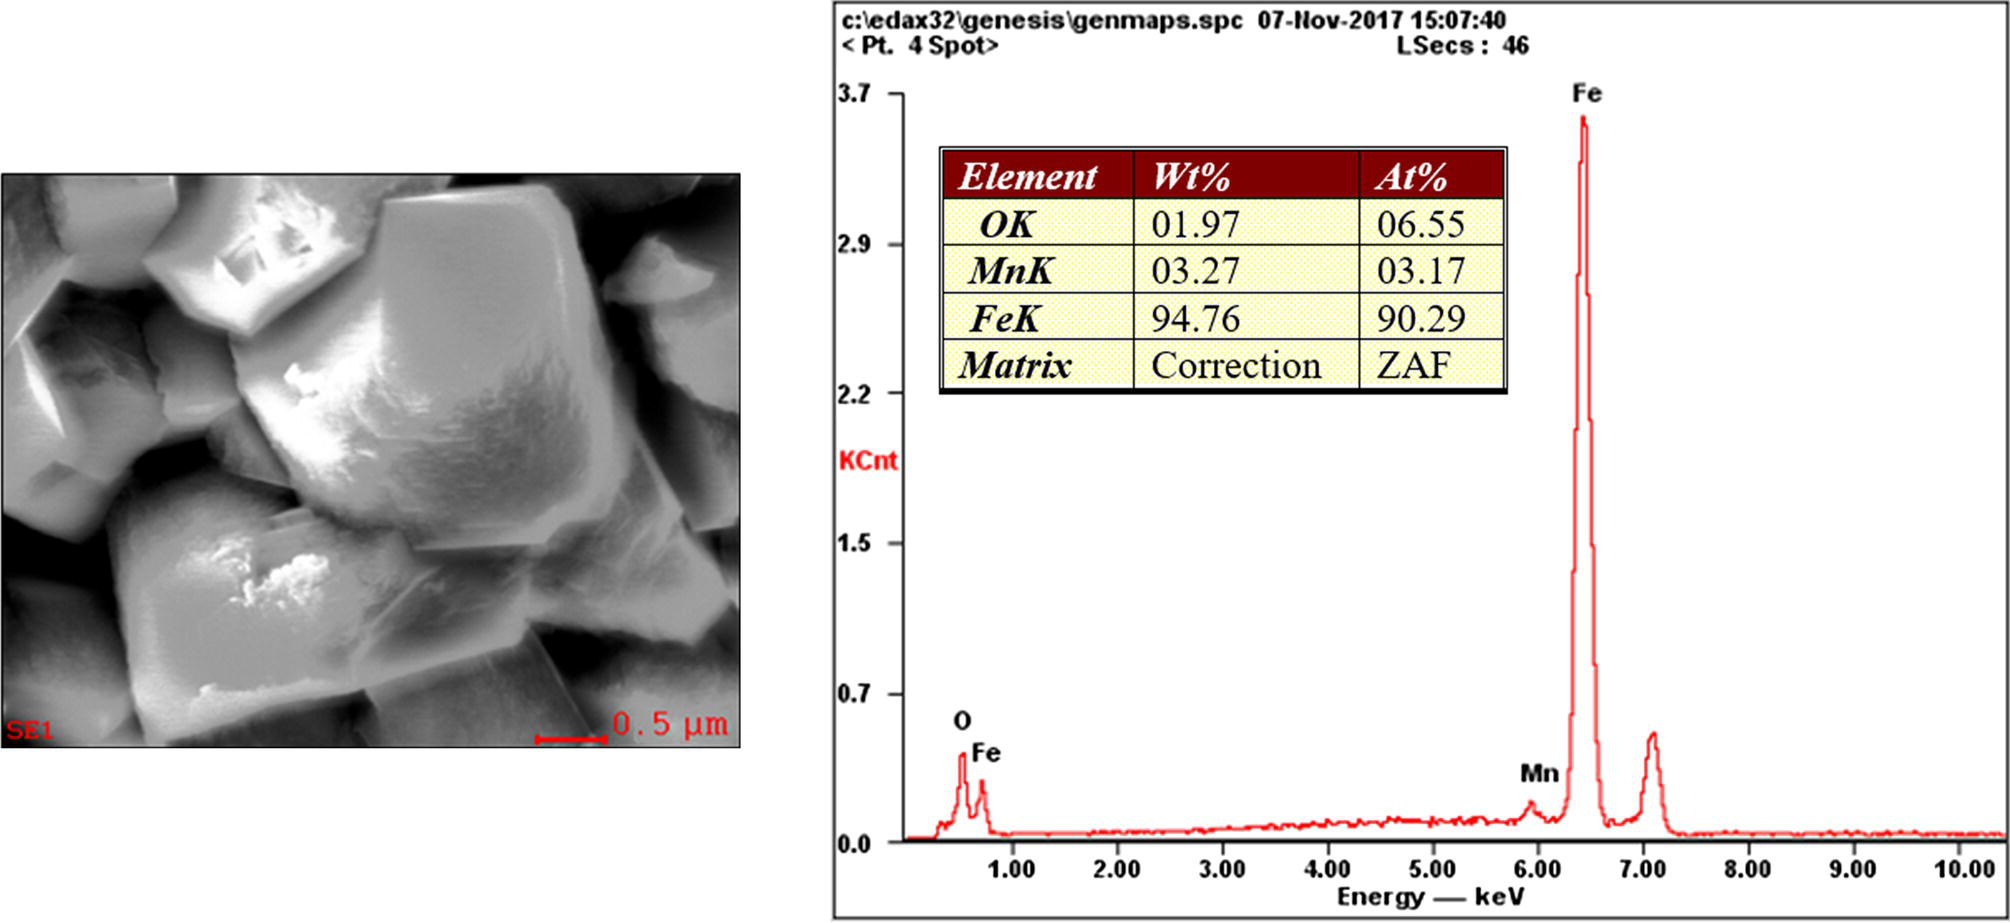


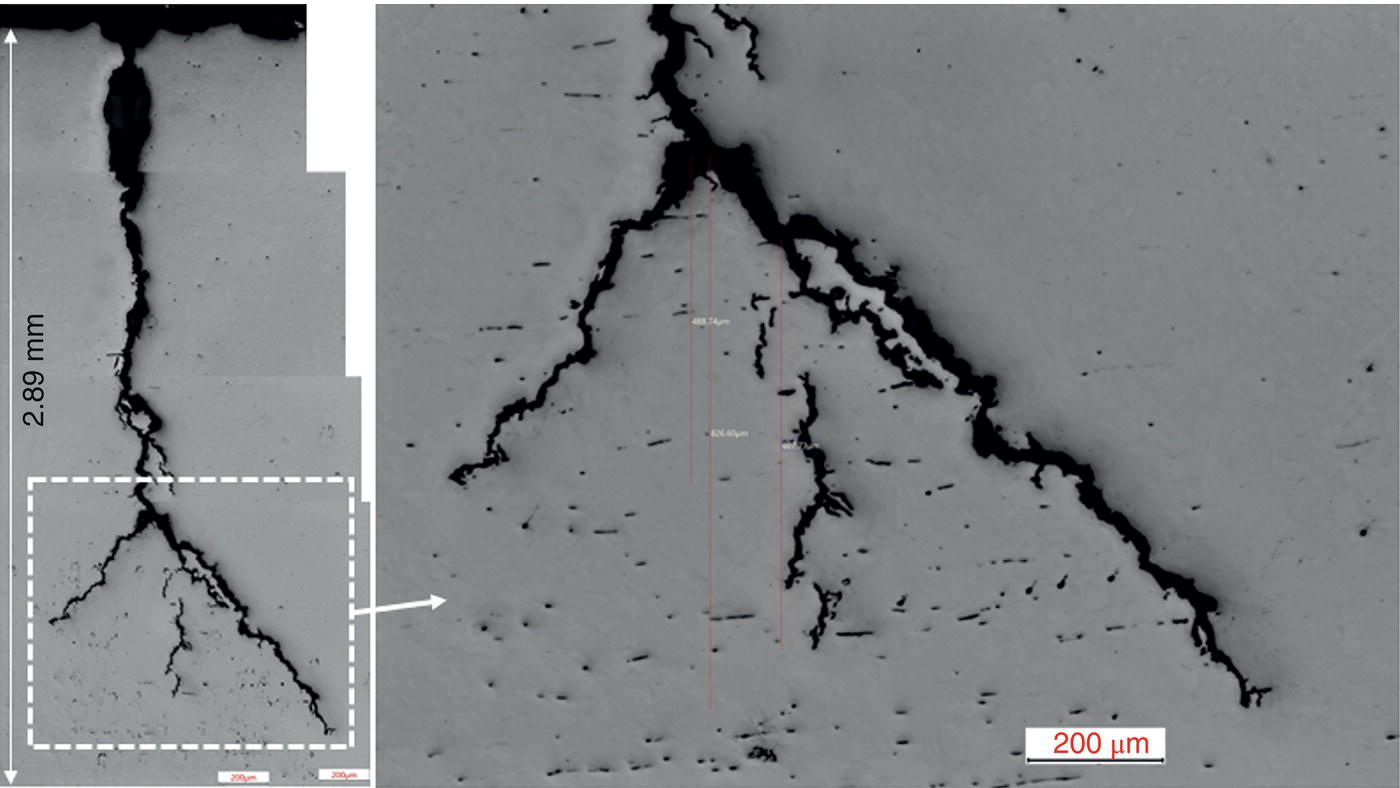
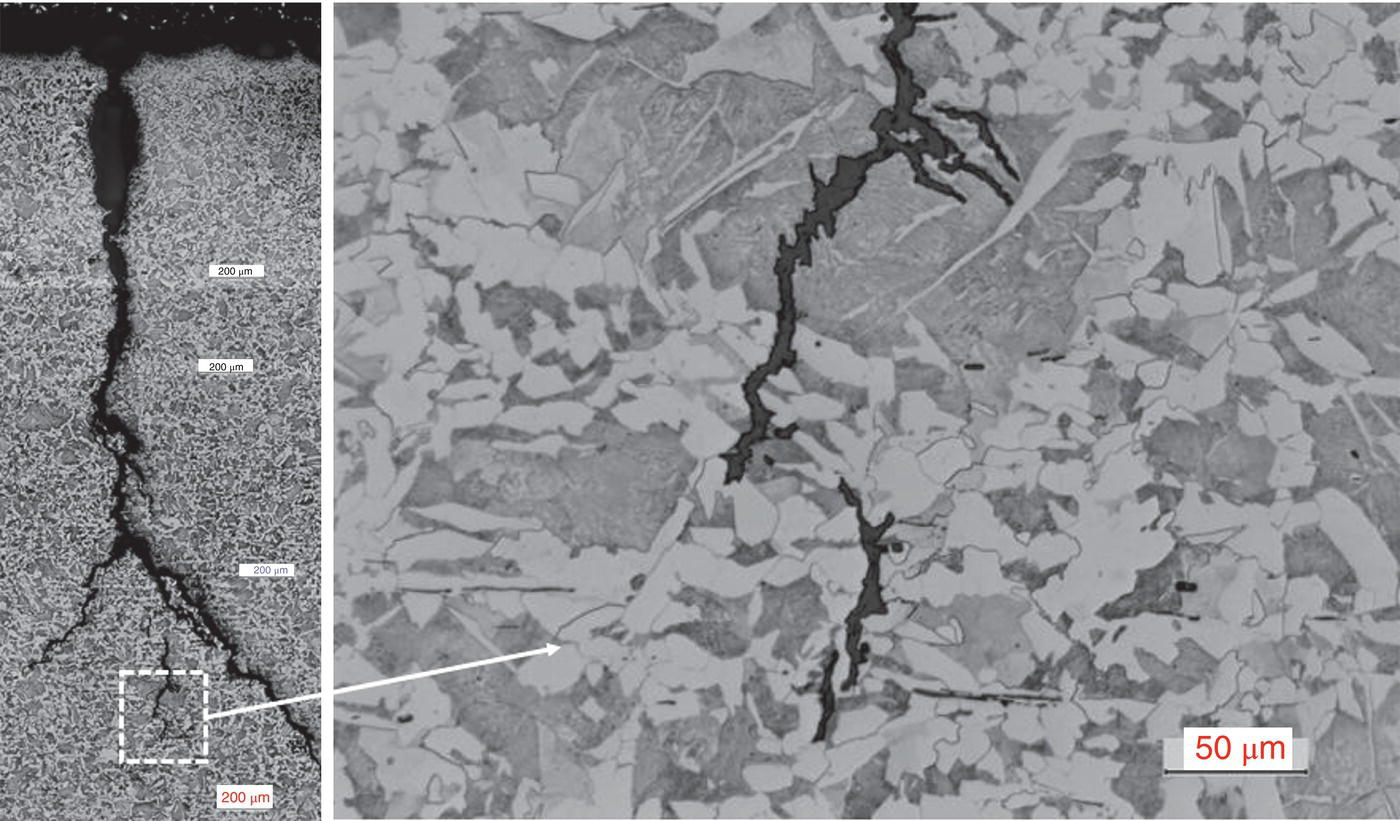
70.2.4.2 Leaking Cracks
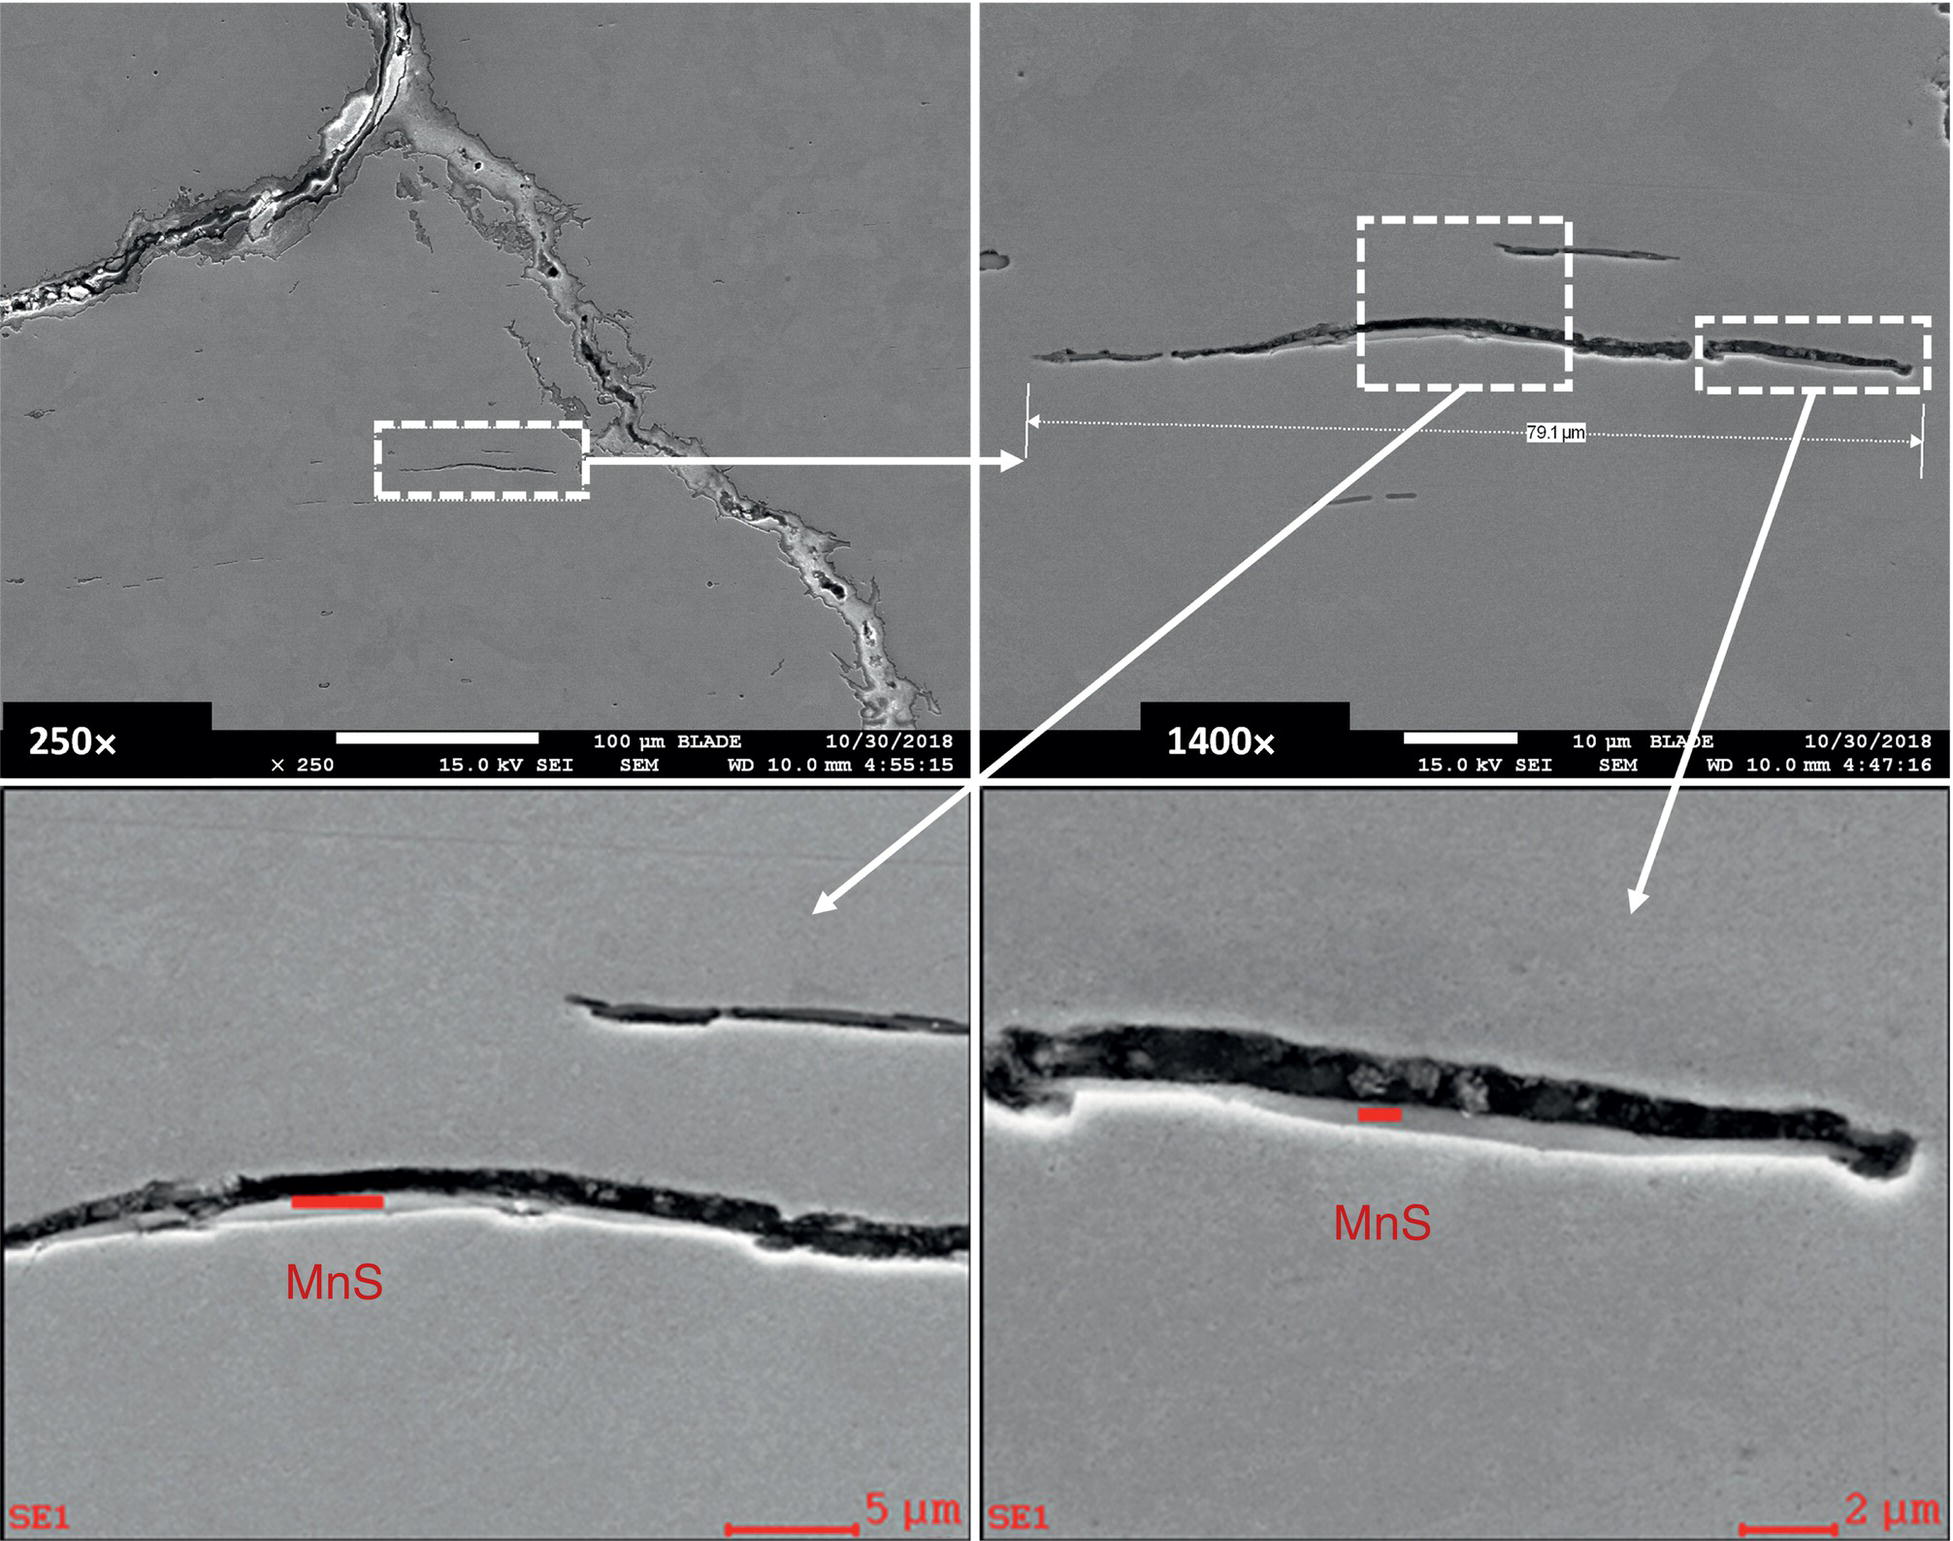
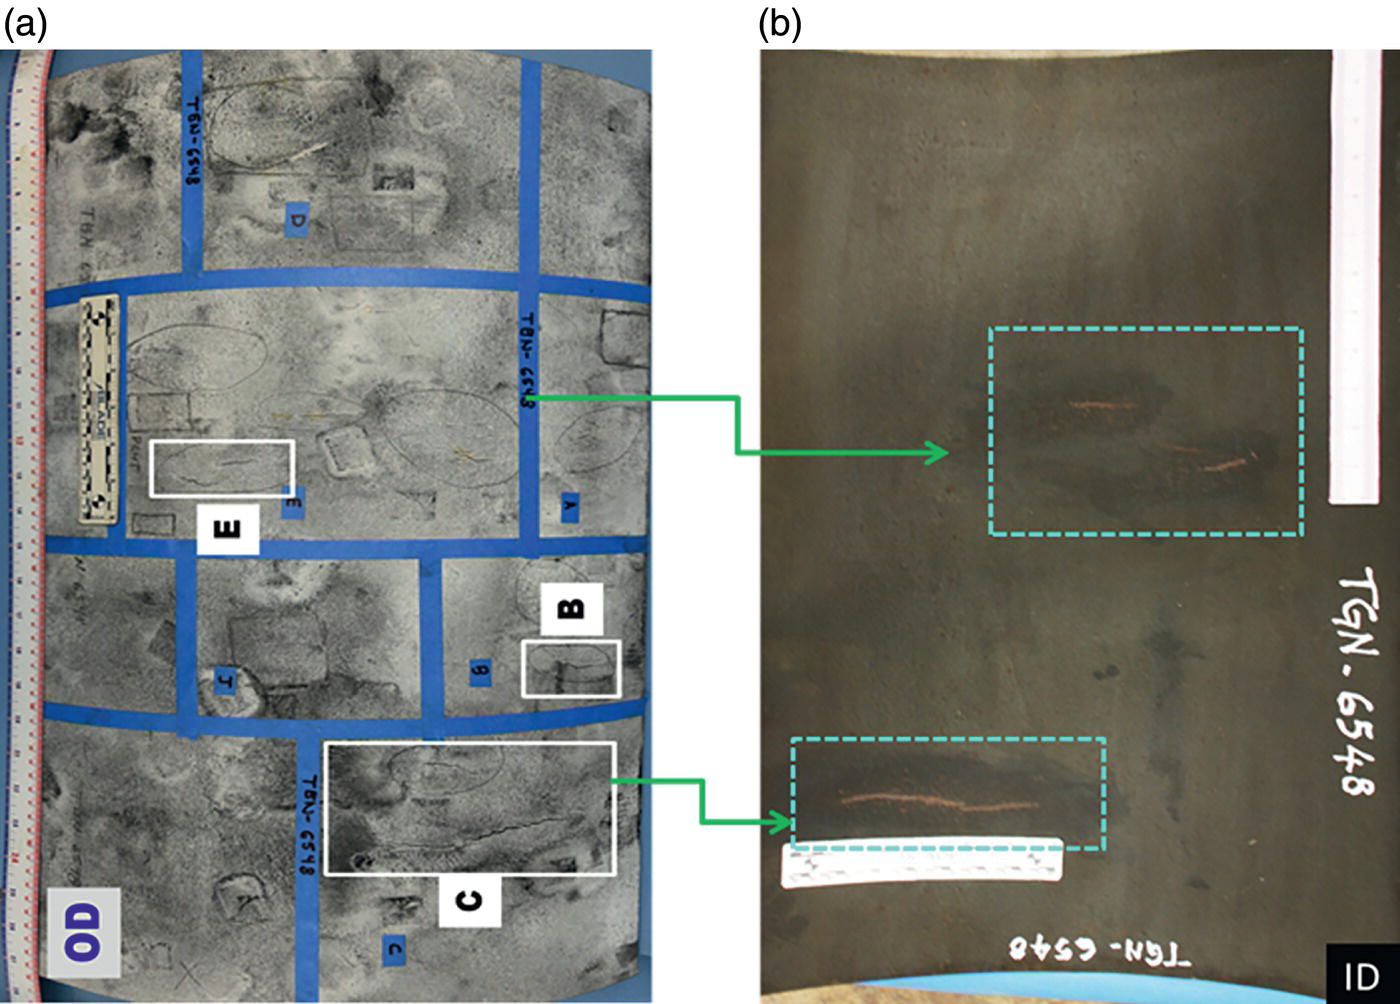
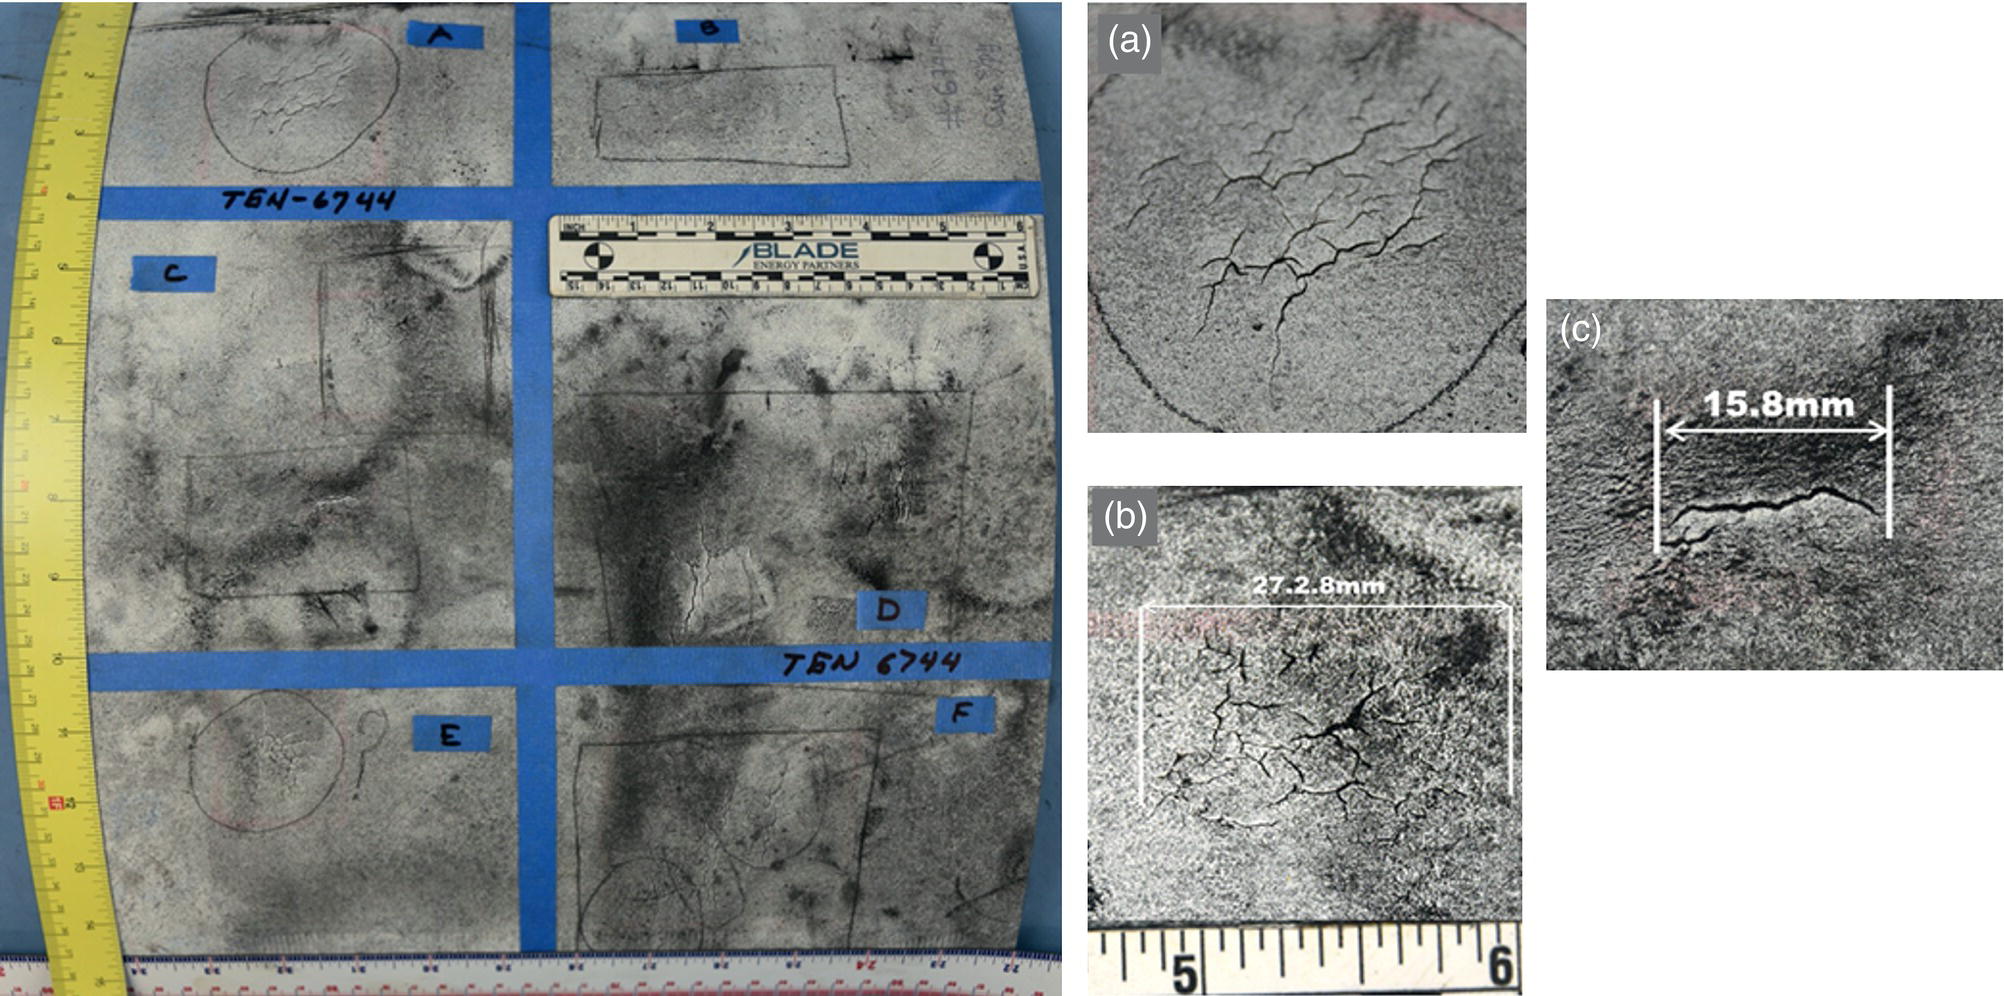
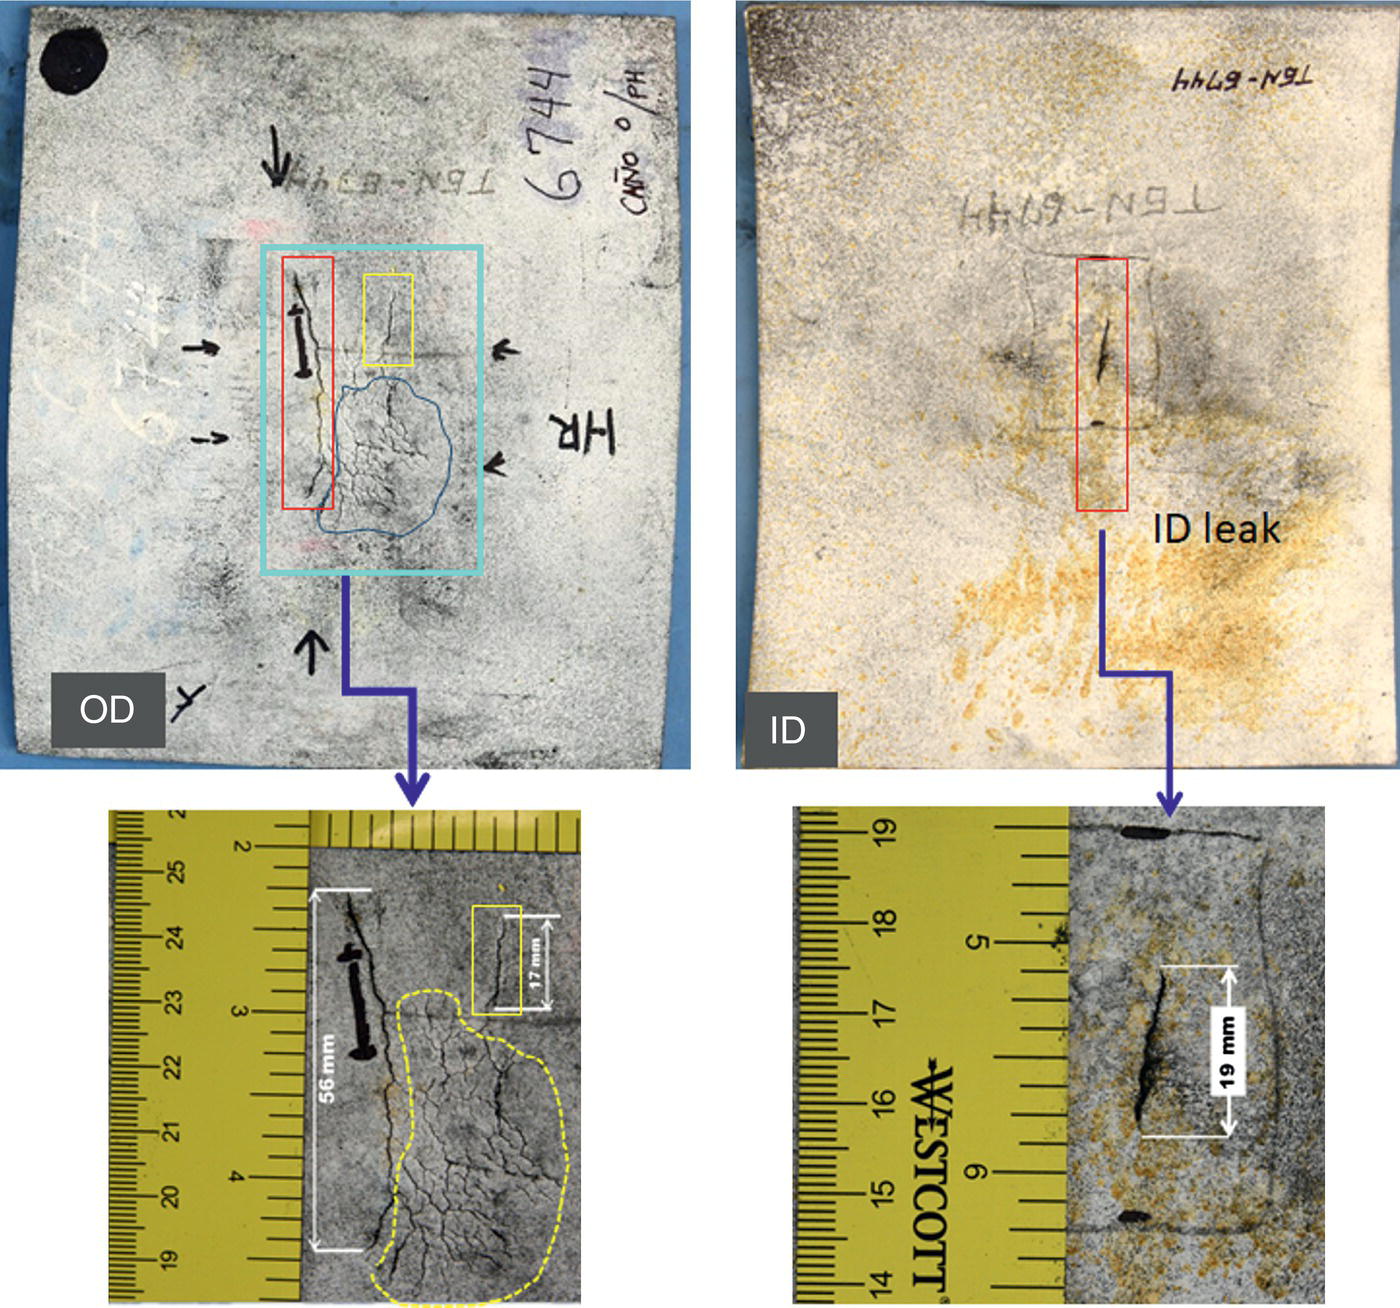
Evaluation of Circumferential Cracks
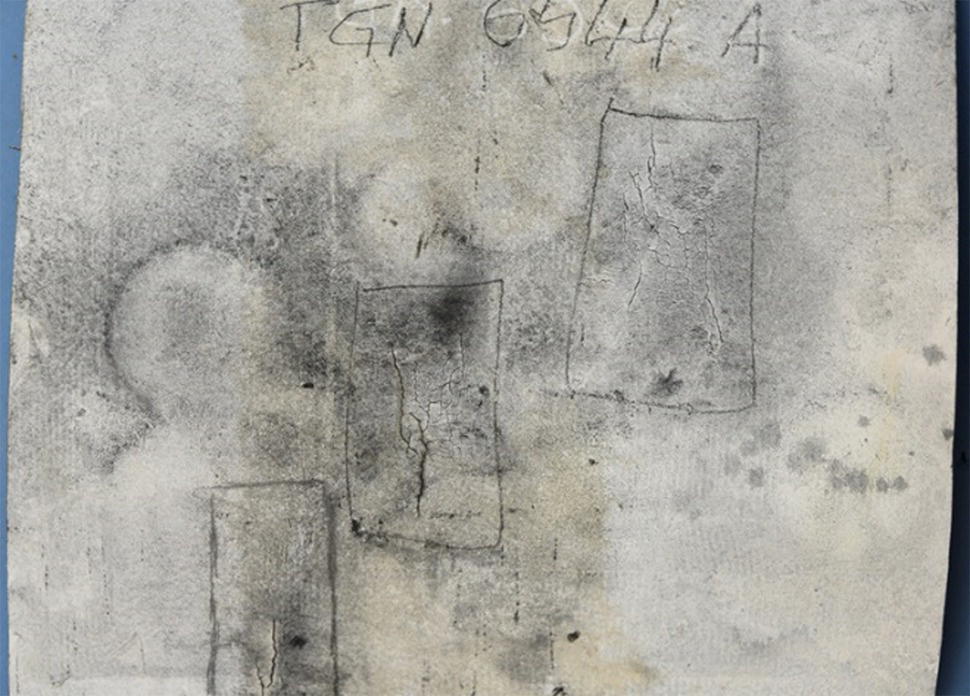
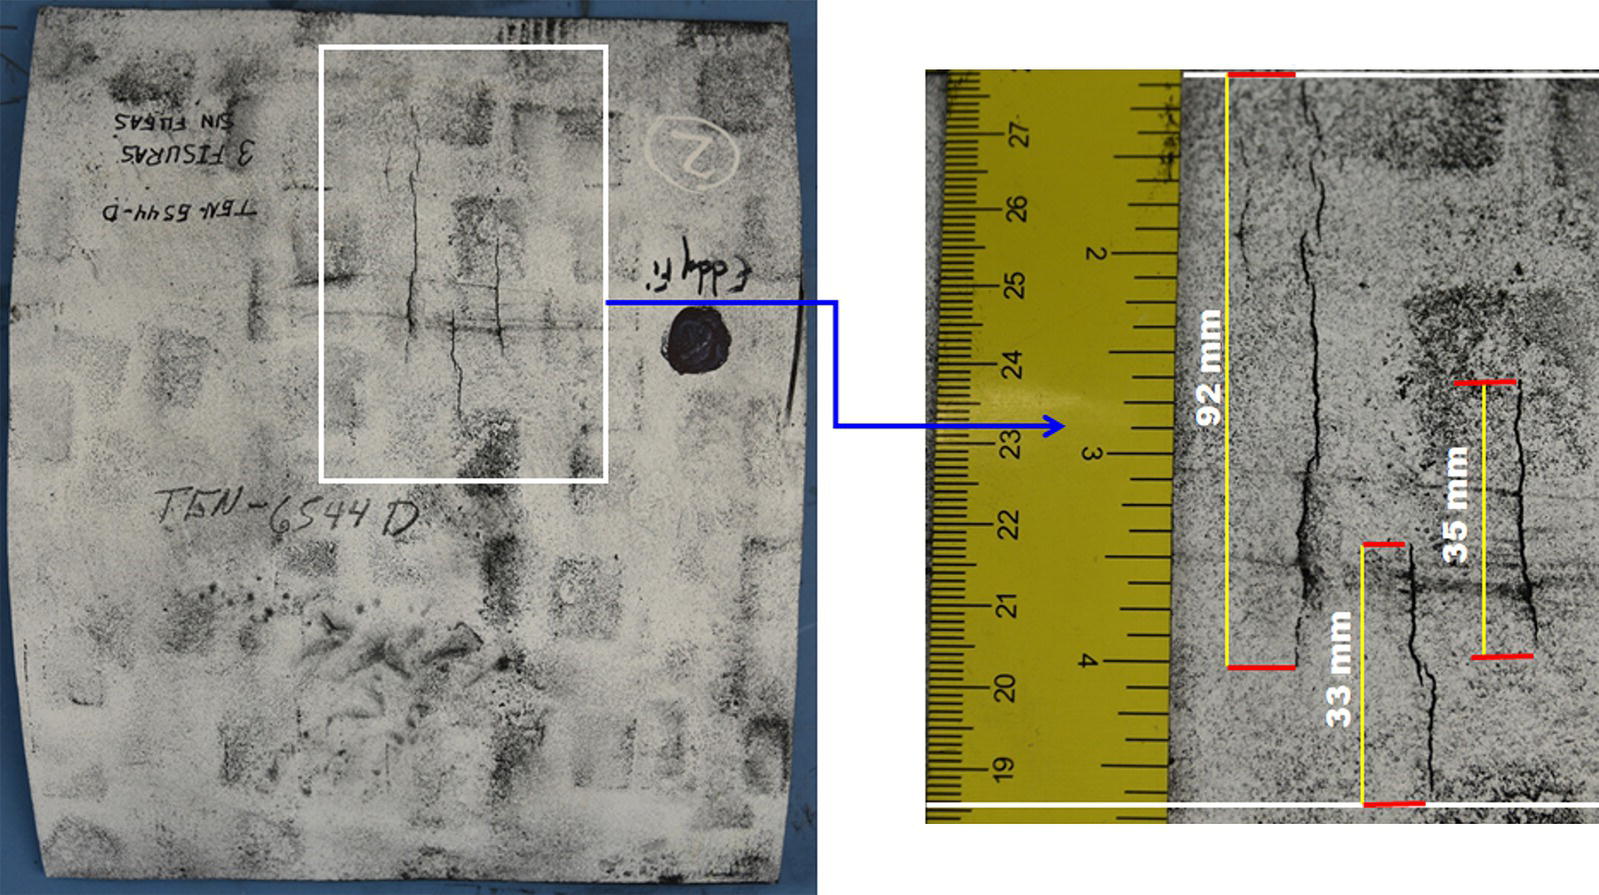
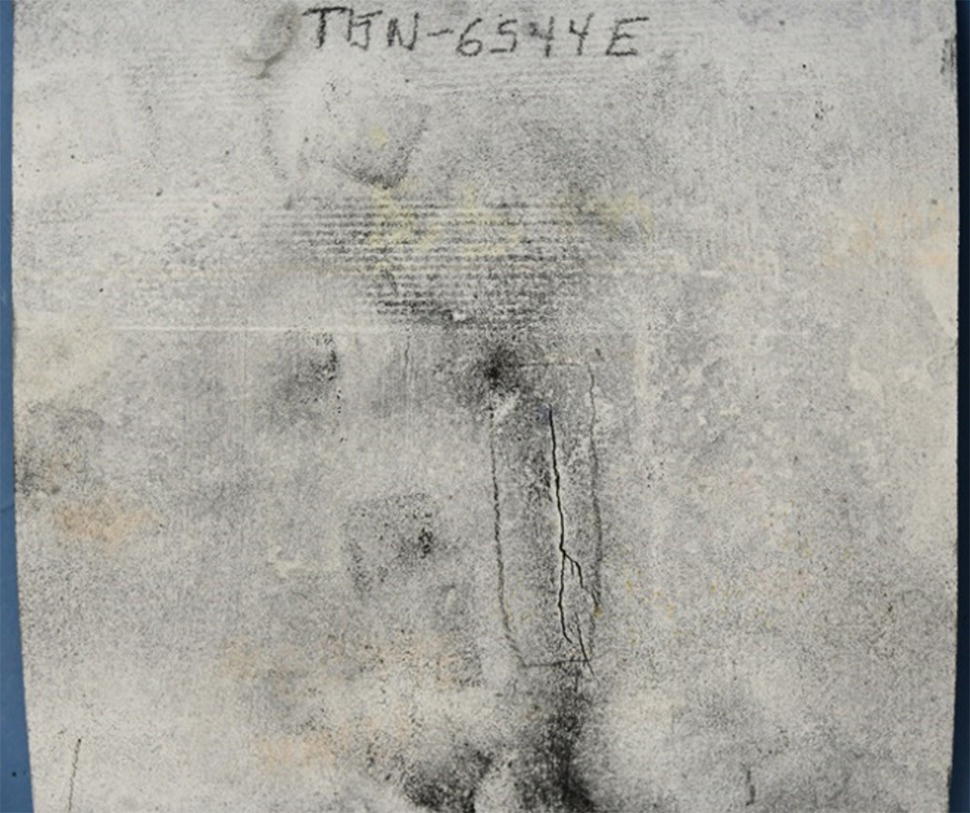
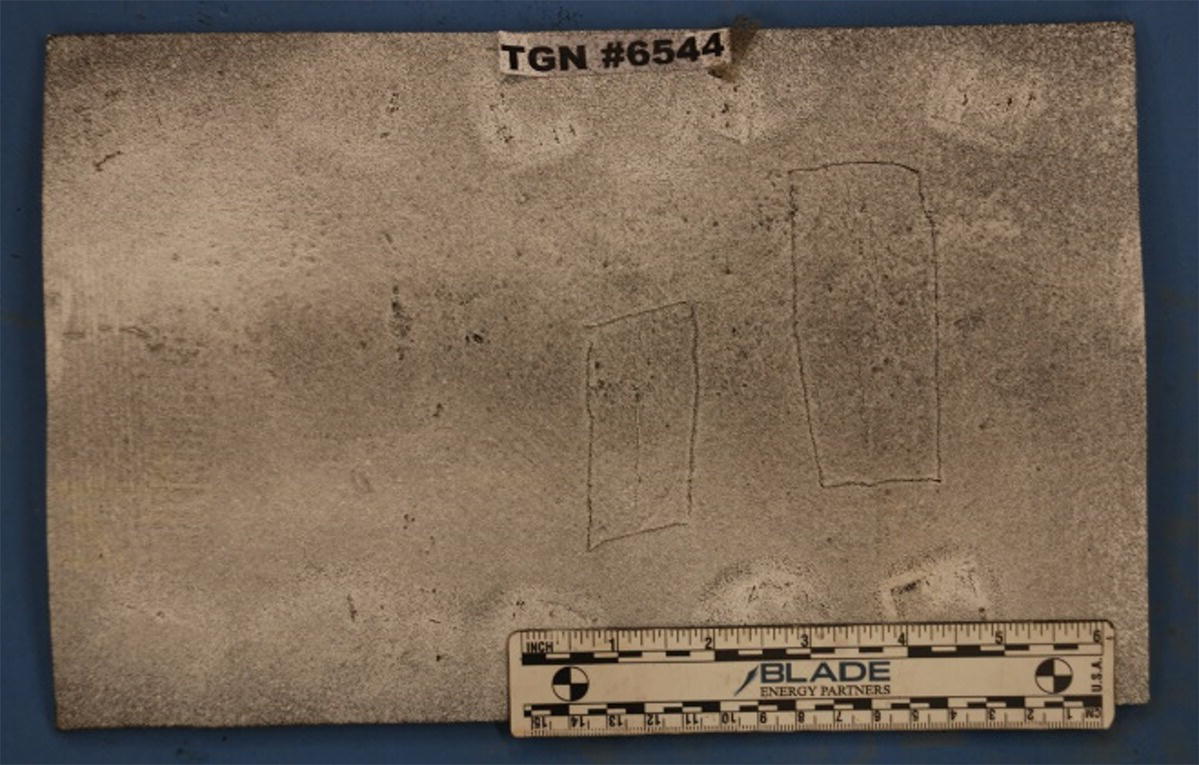
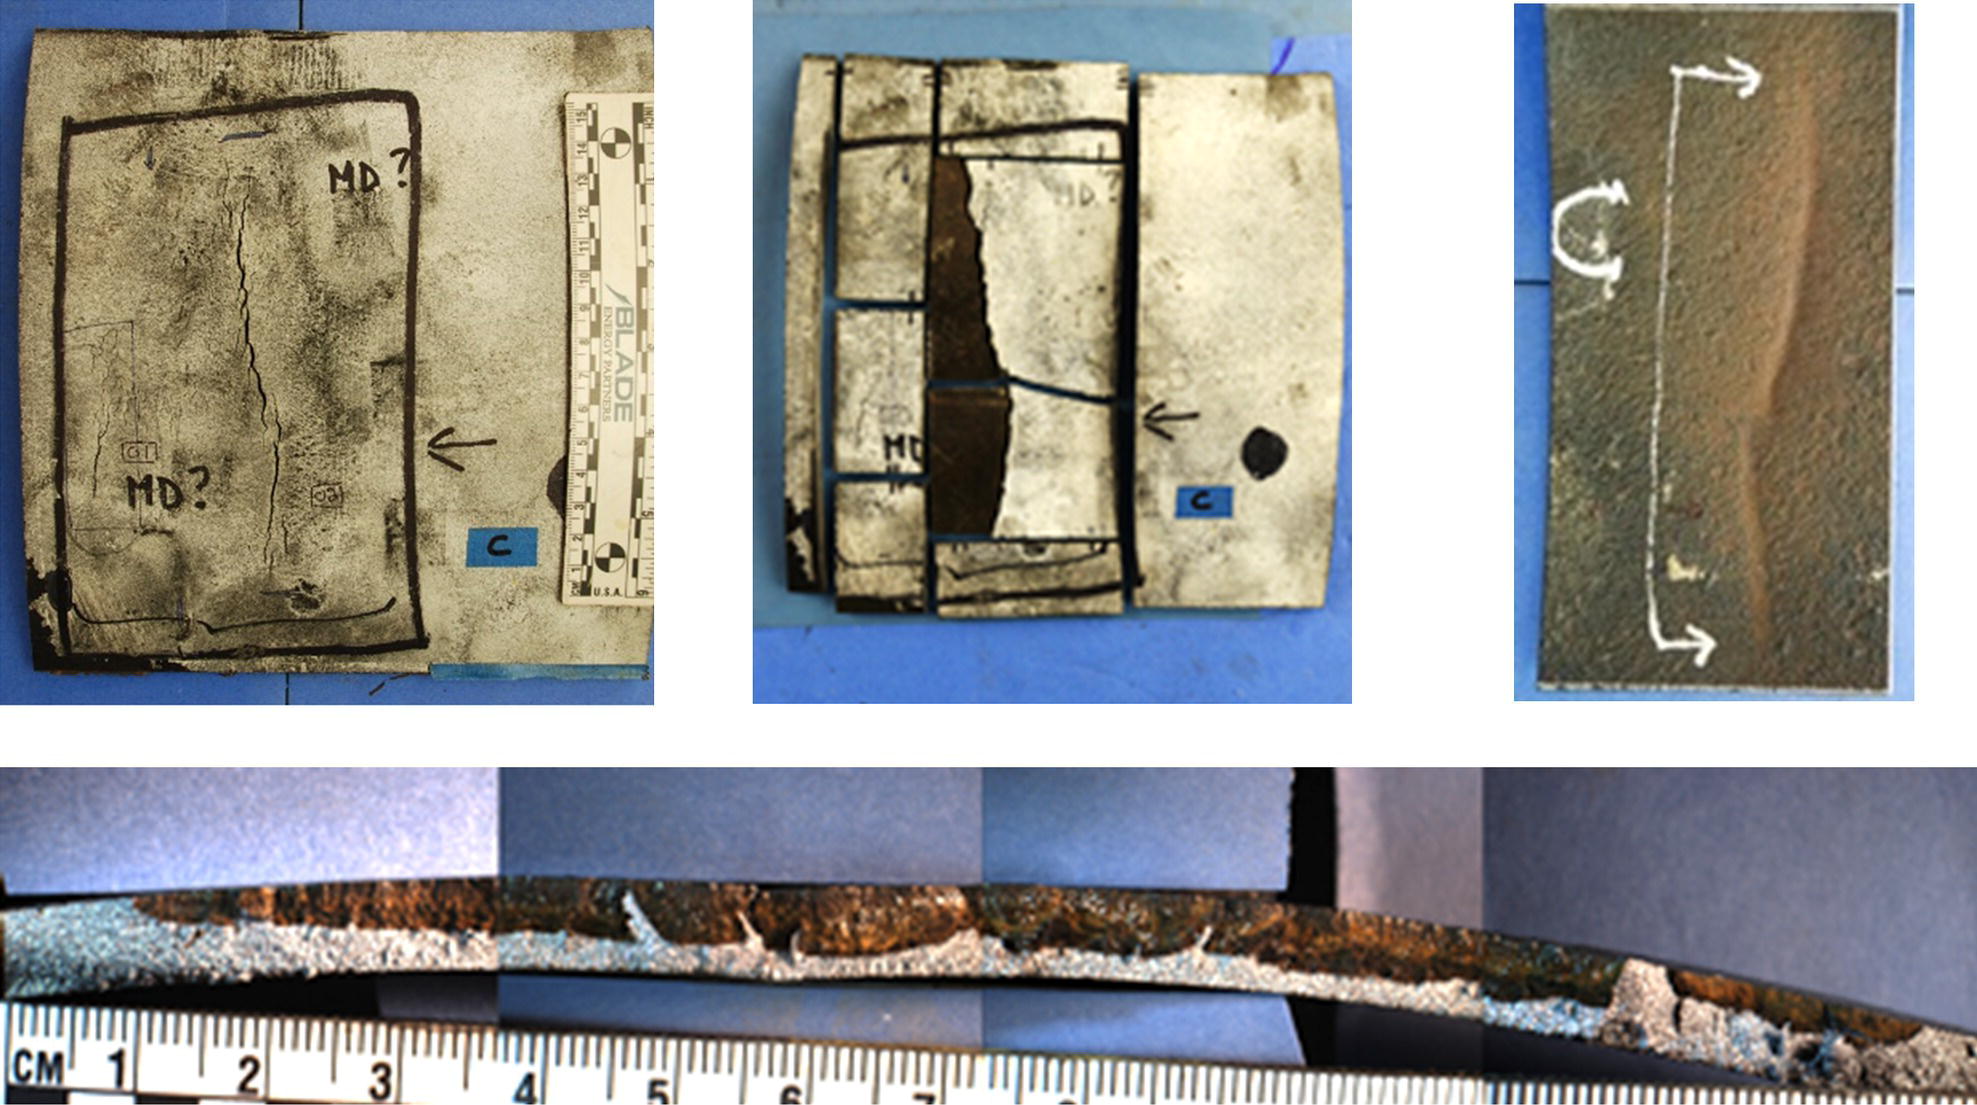
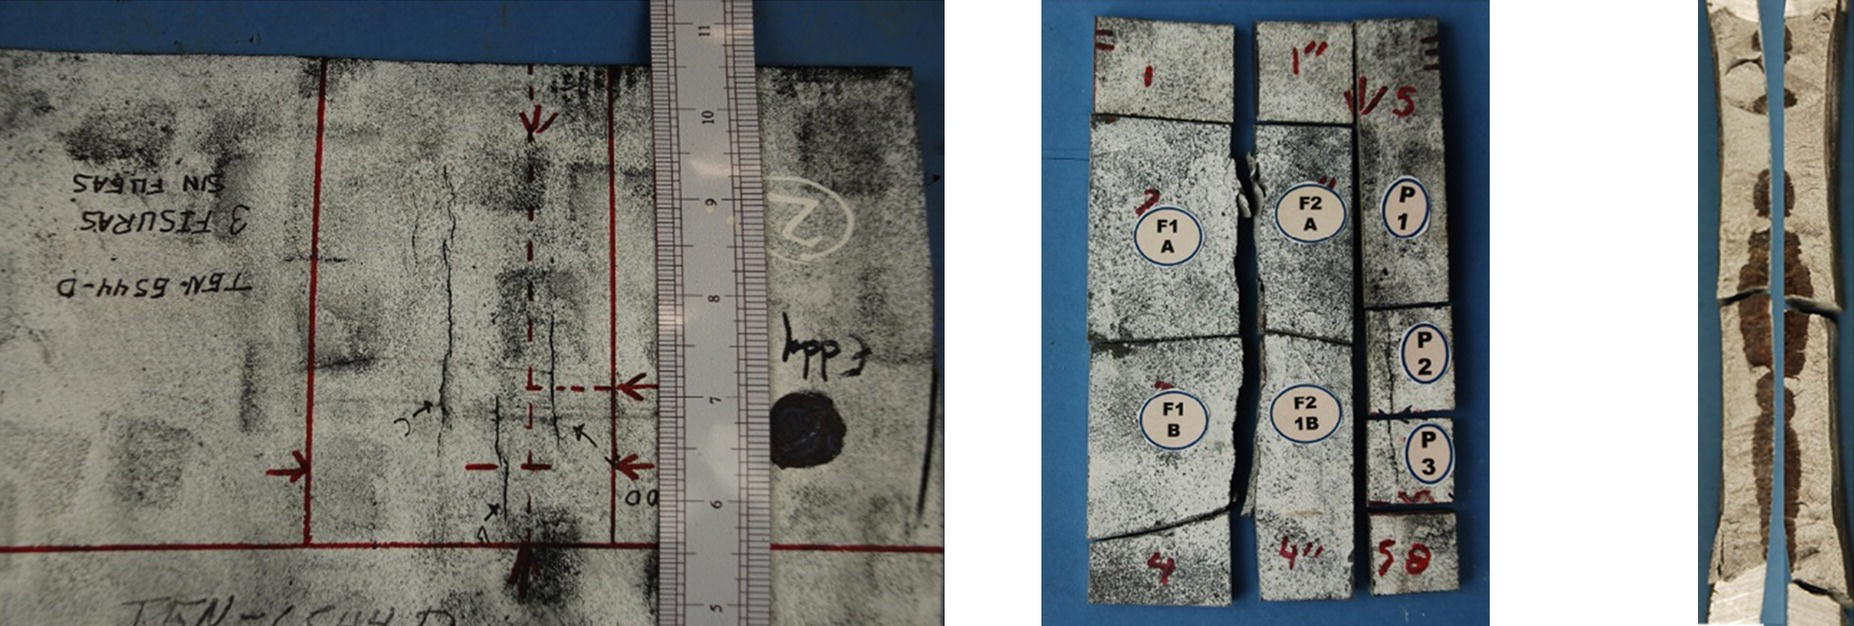
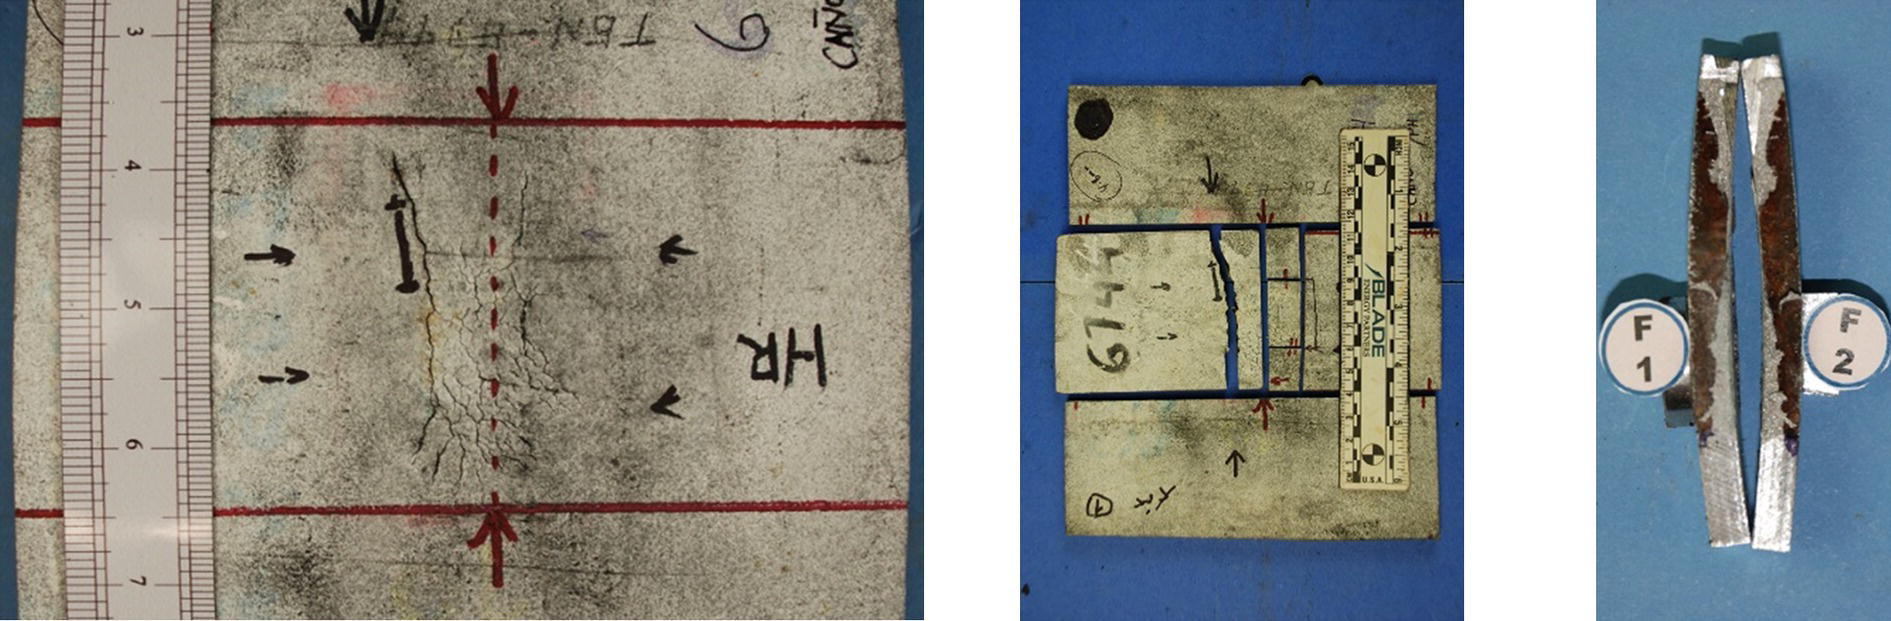
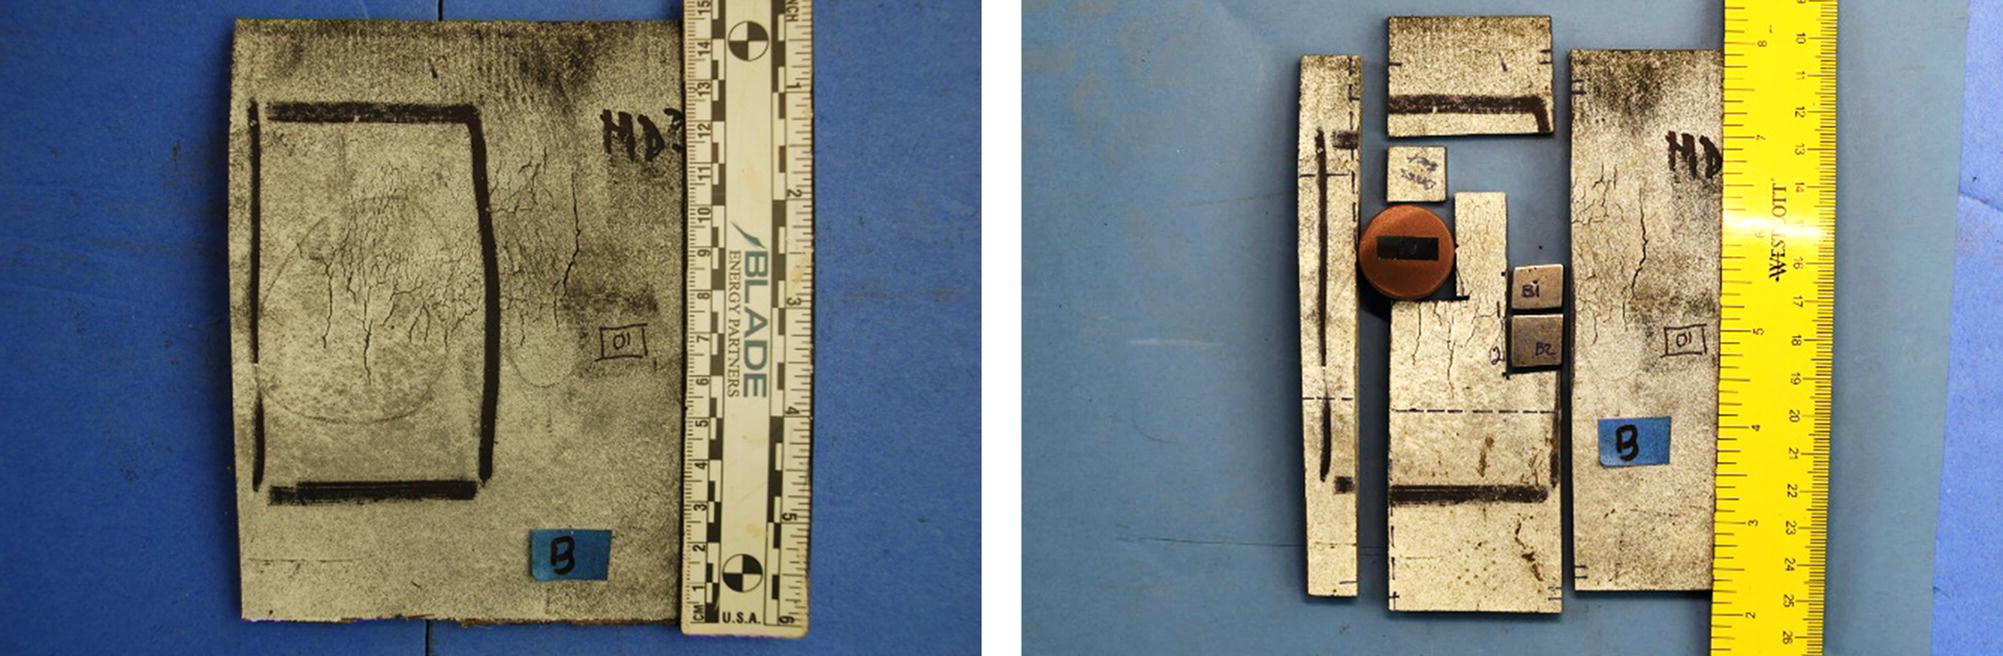
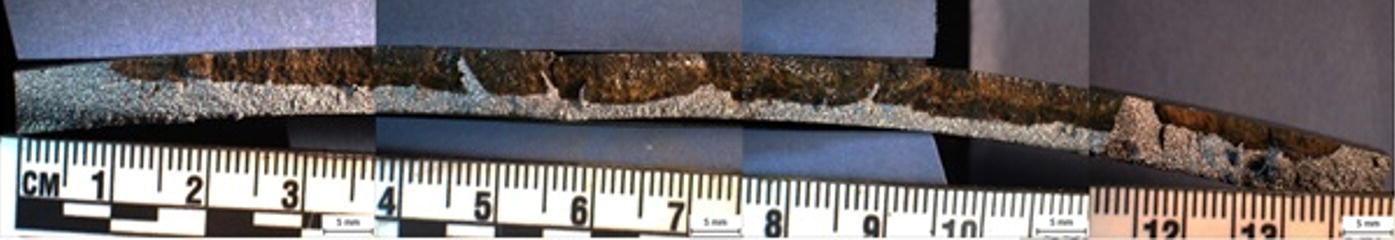
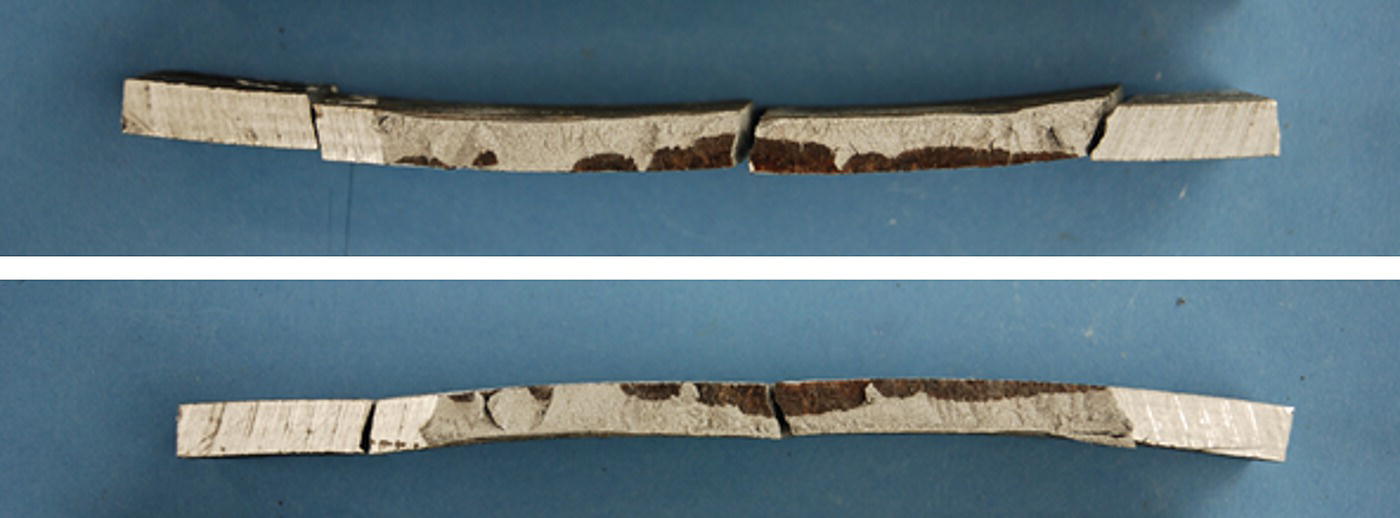
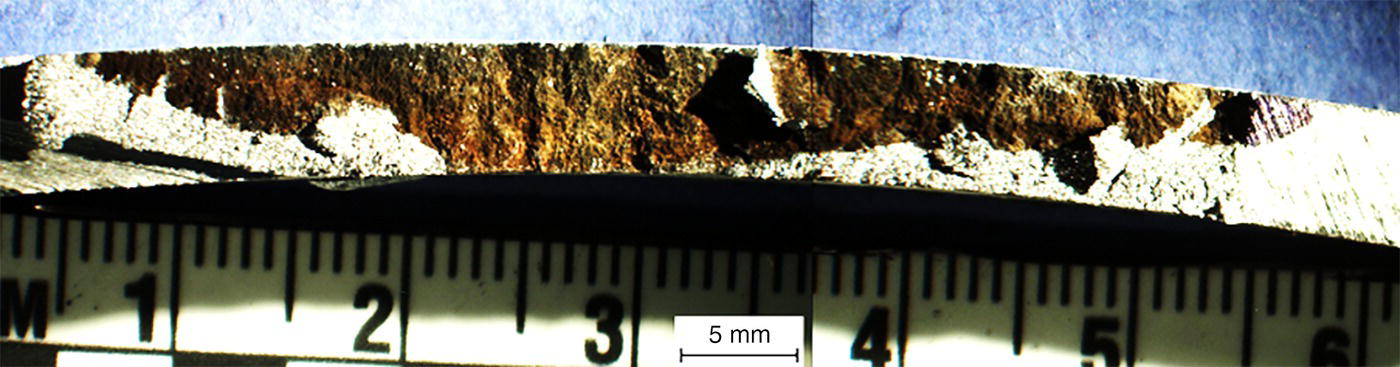
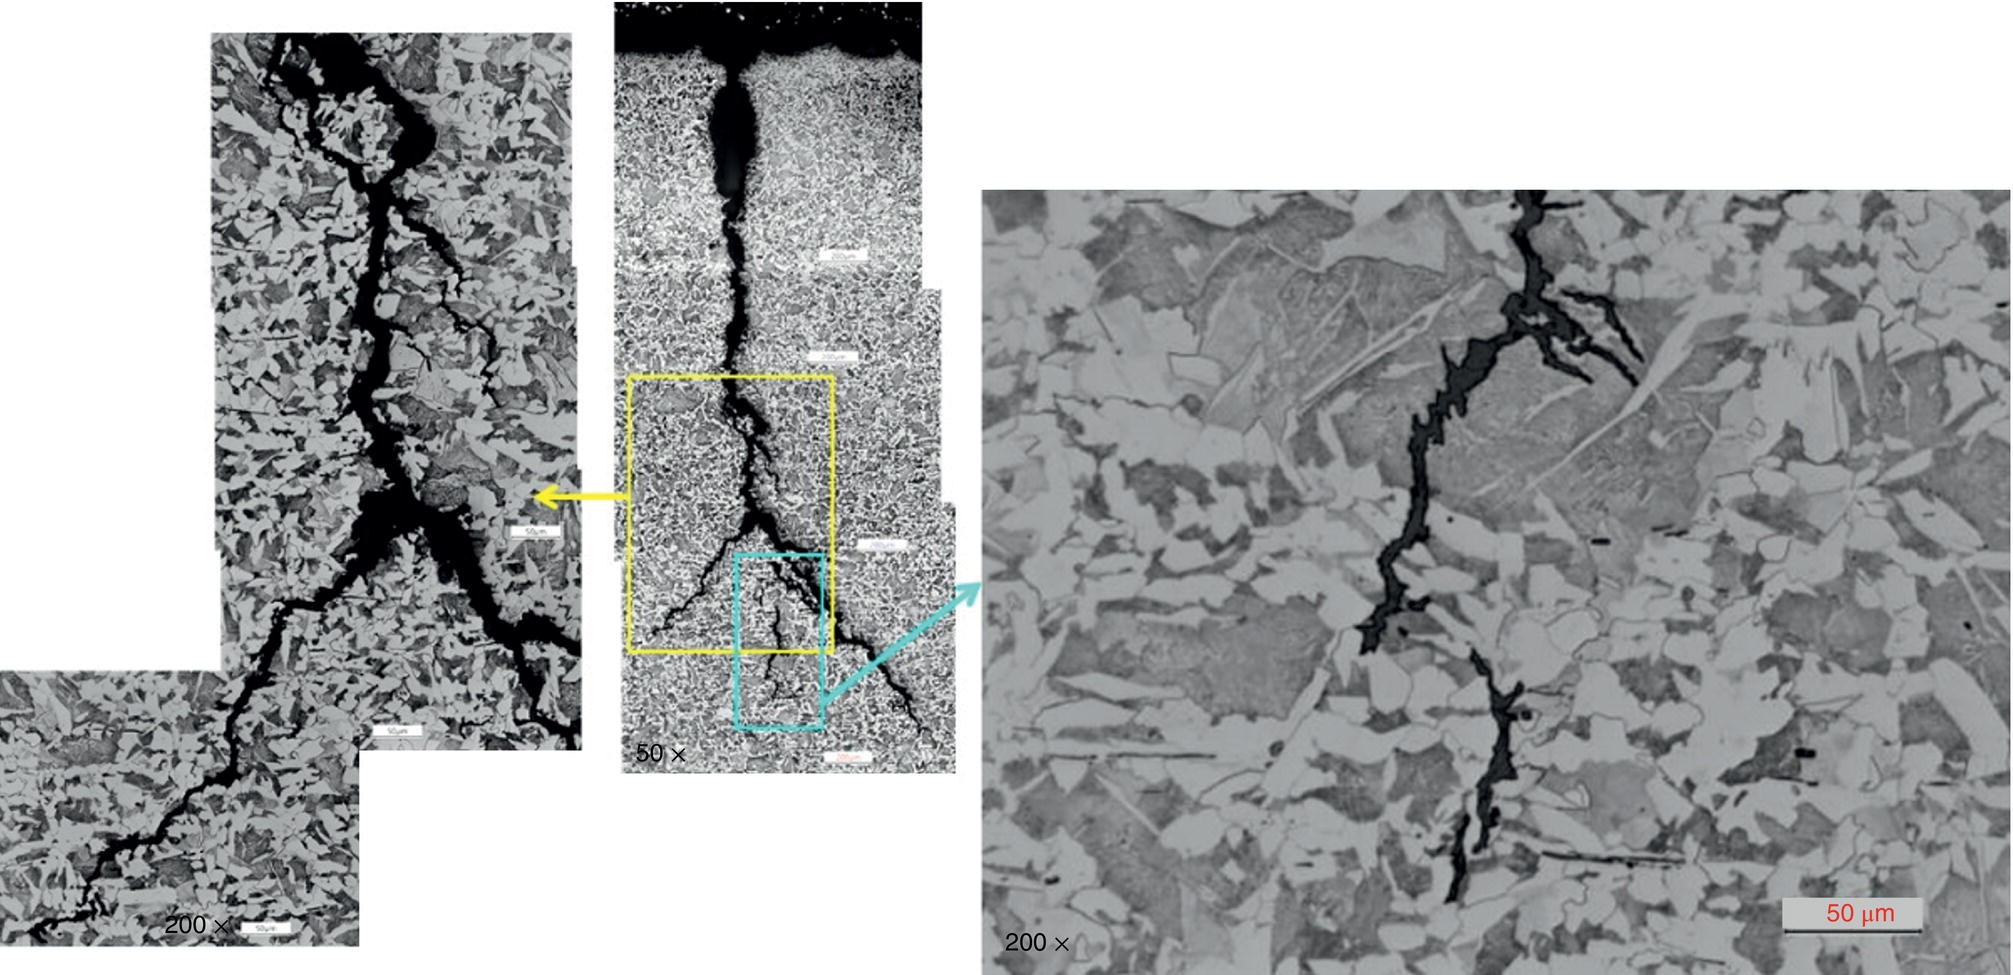
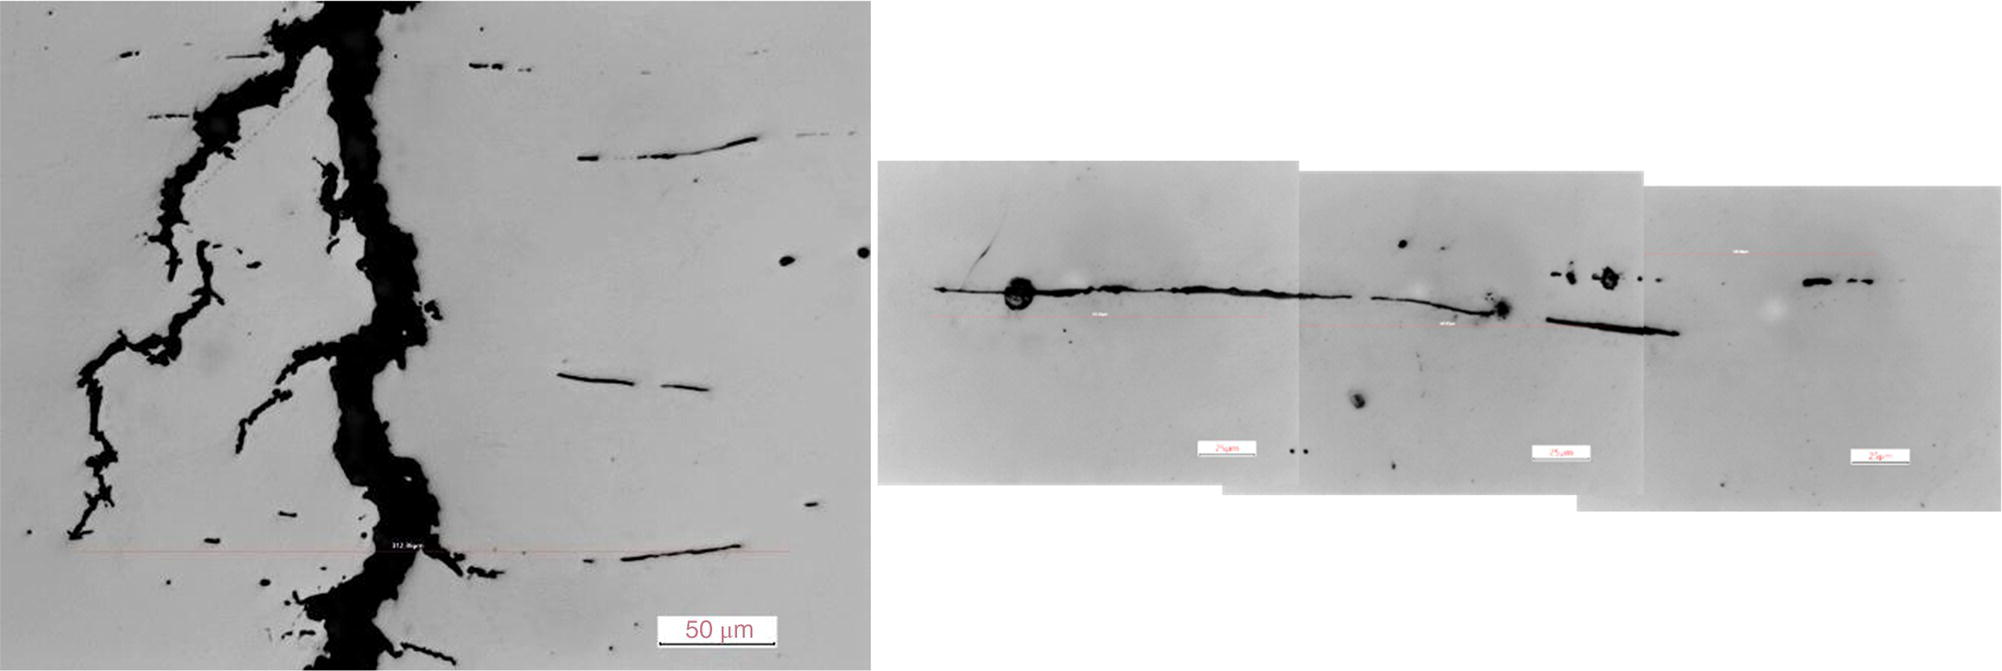
Evaluation of Spiderweb Cracks
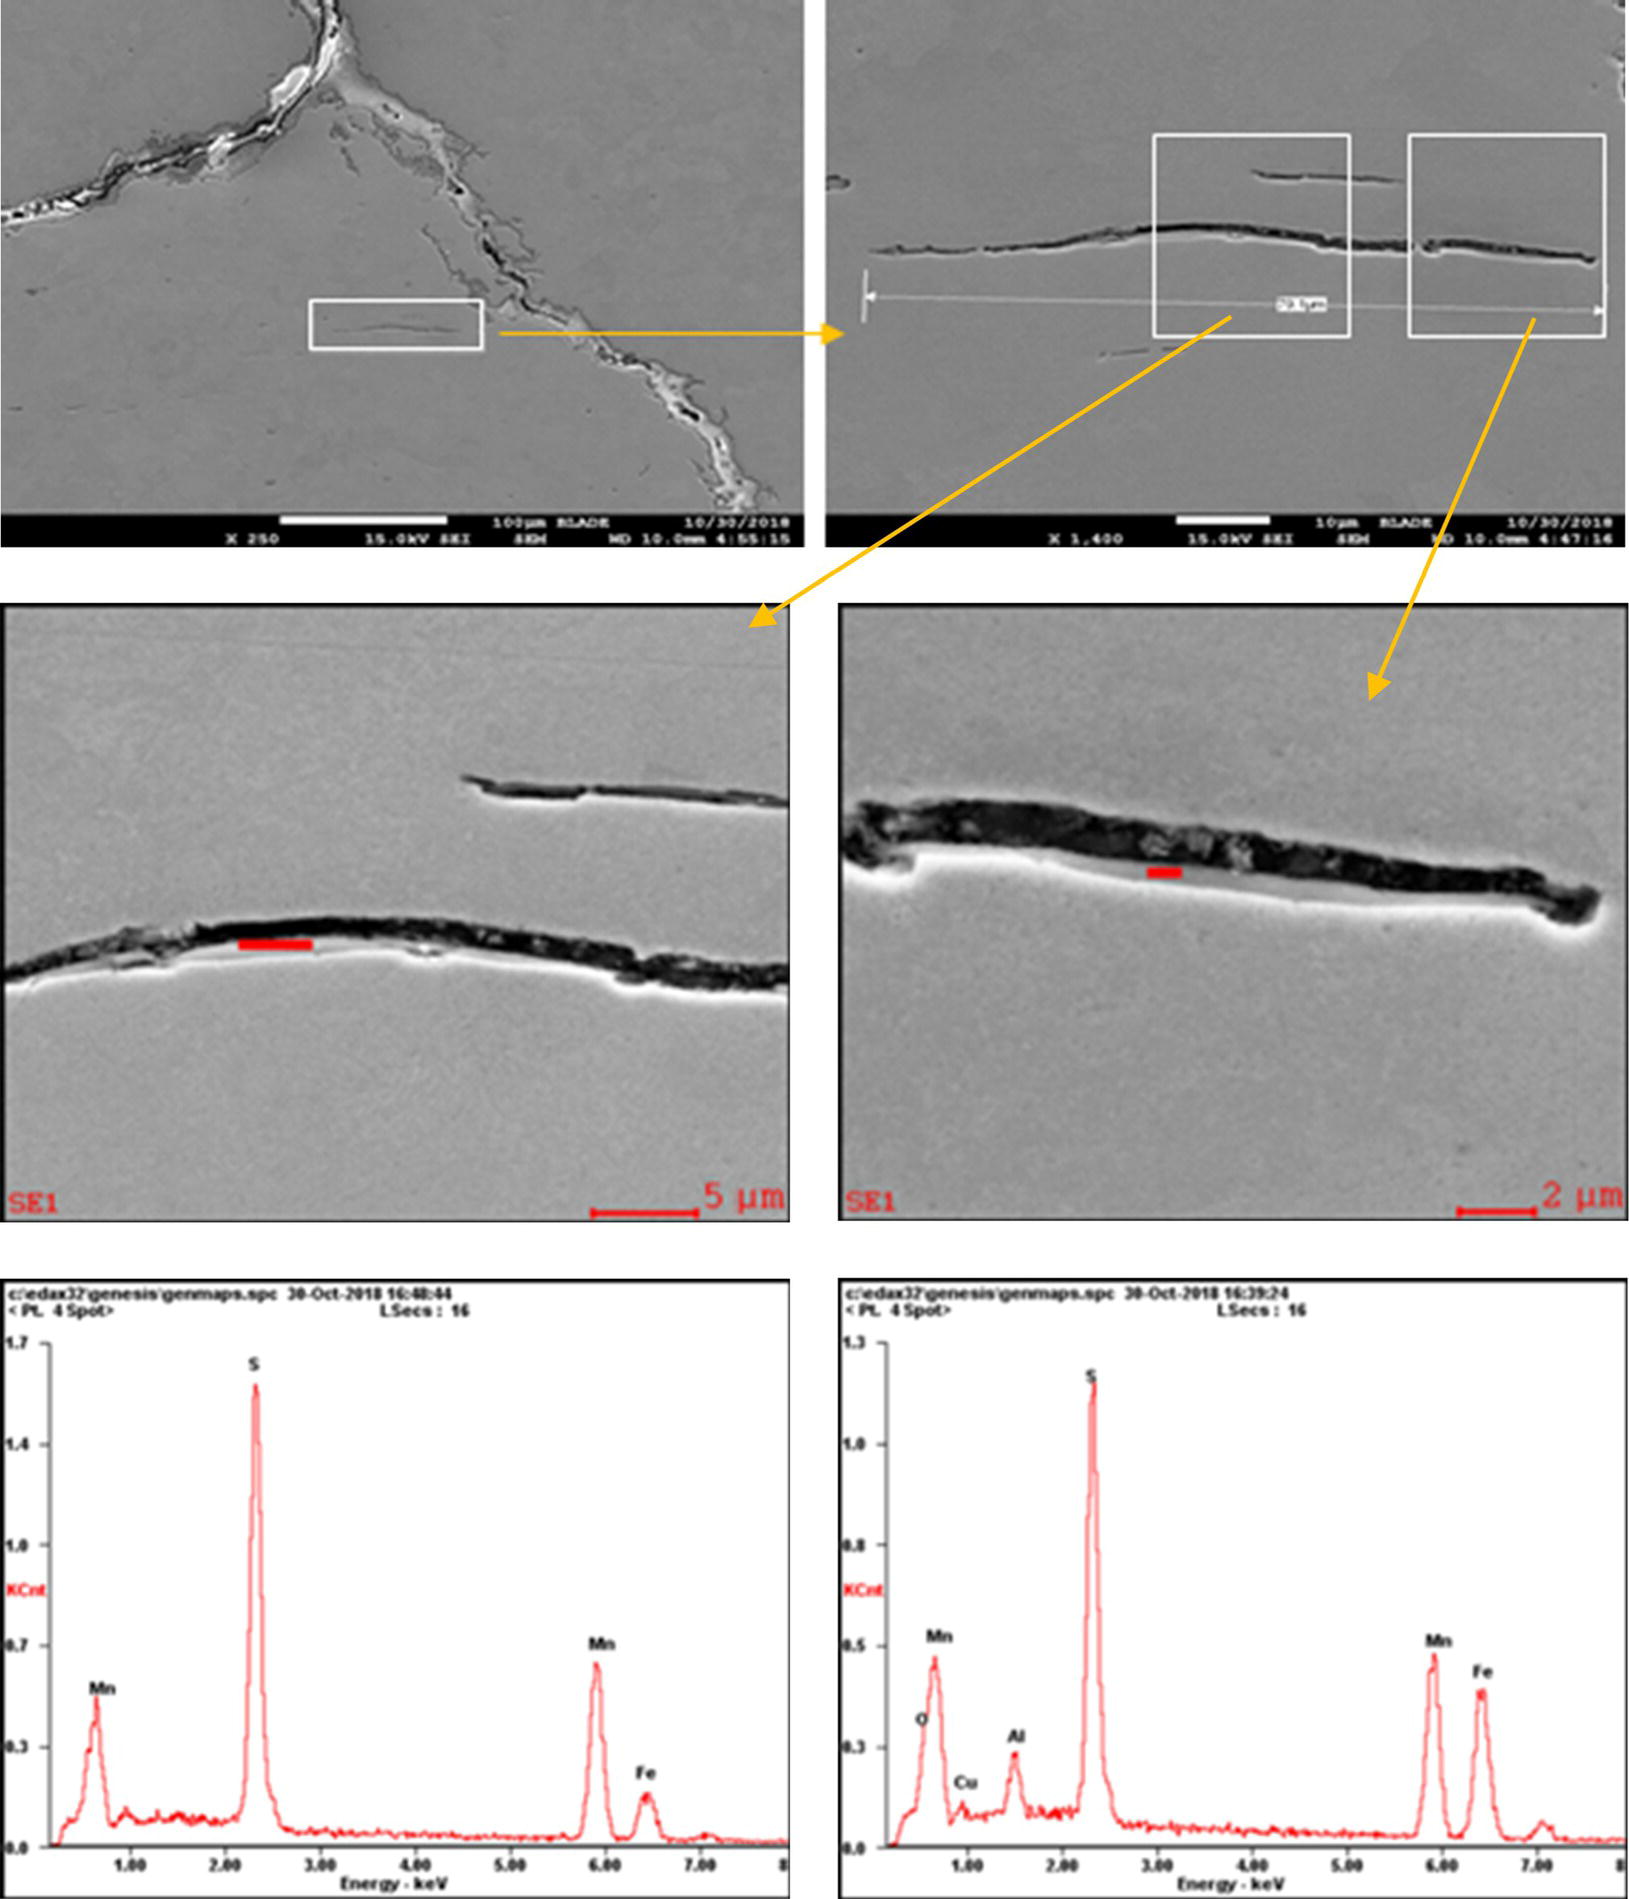
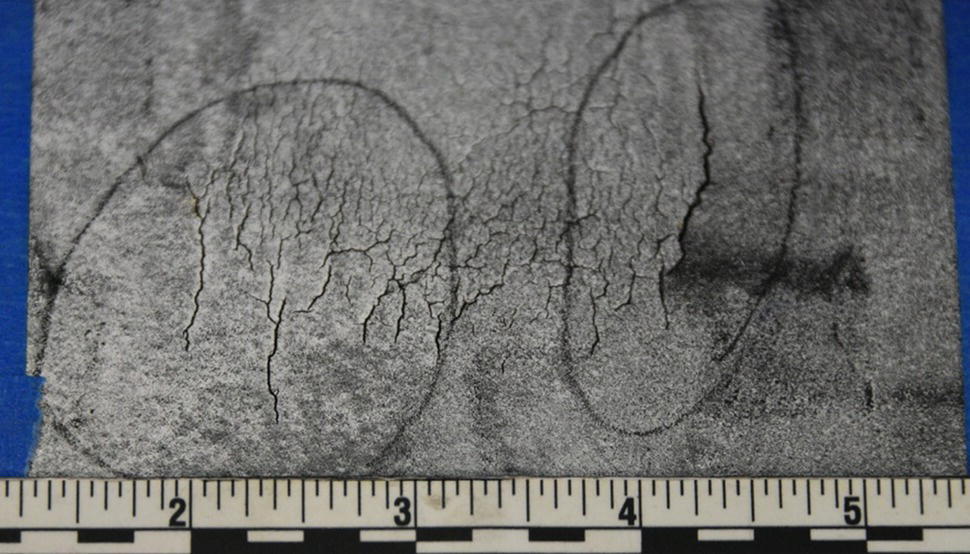
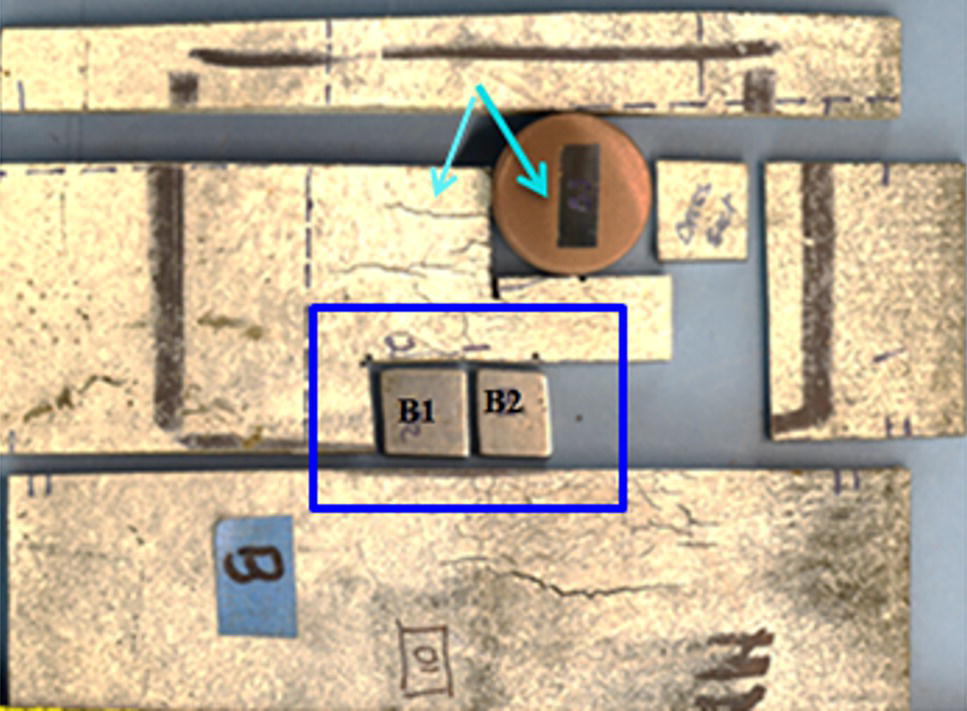
Crack Adjacent to the Spiderweb Crack Colony
Evaluation of Other Spiderweb-Type Cracks
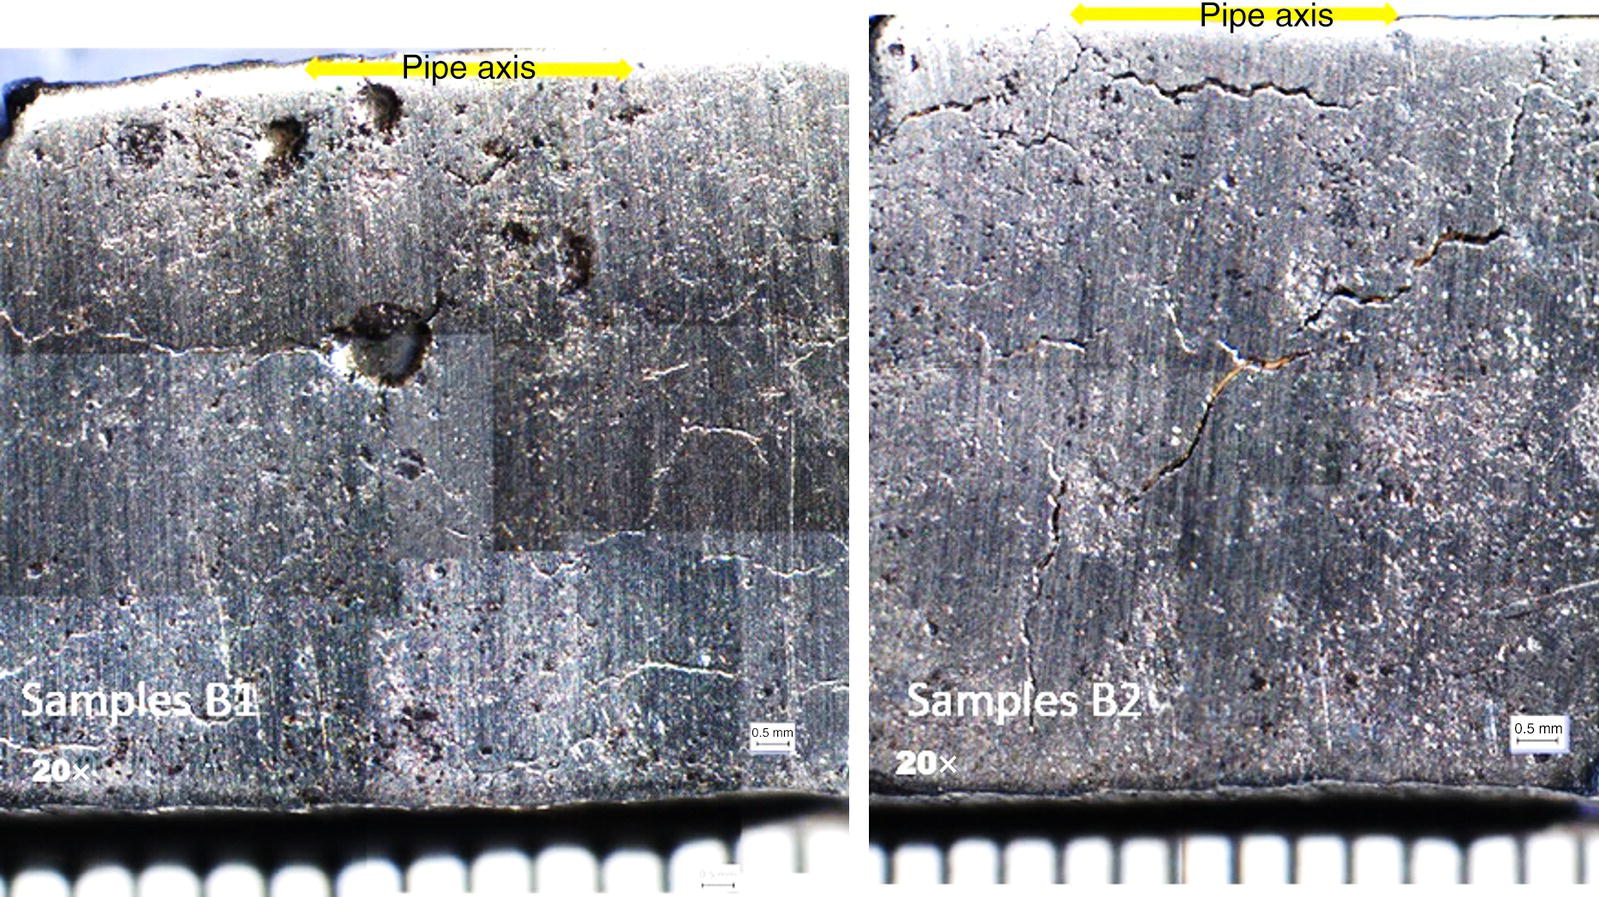
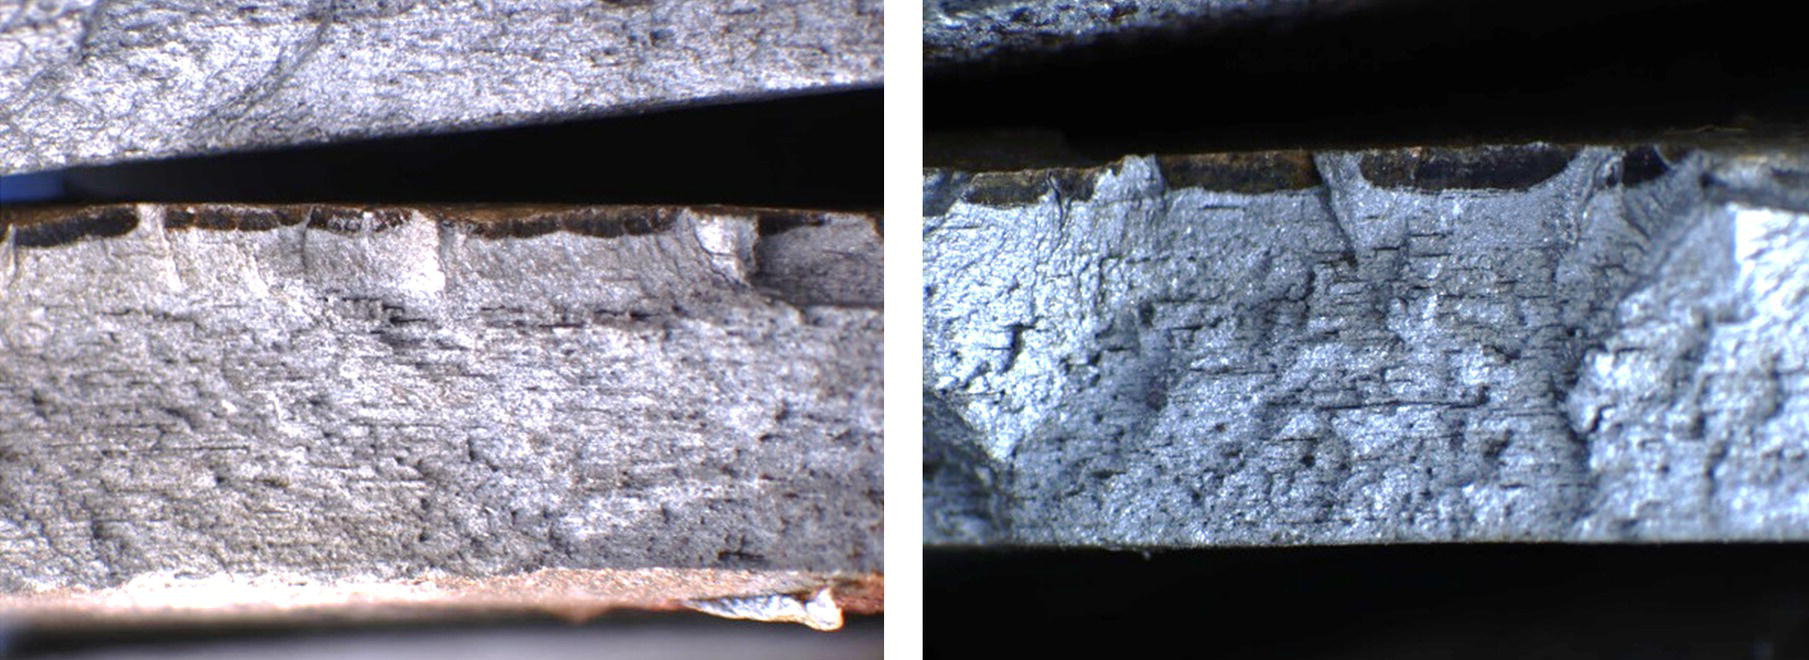
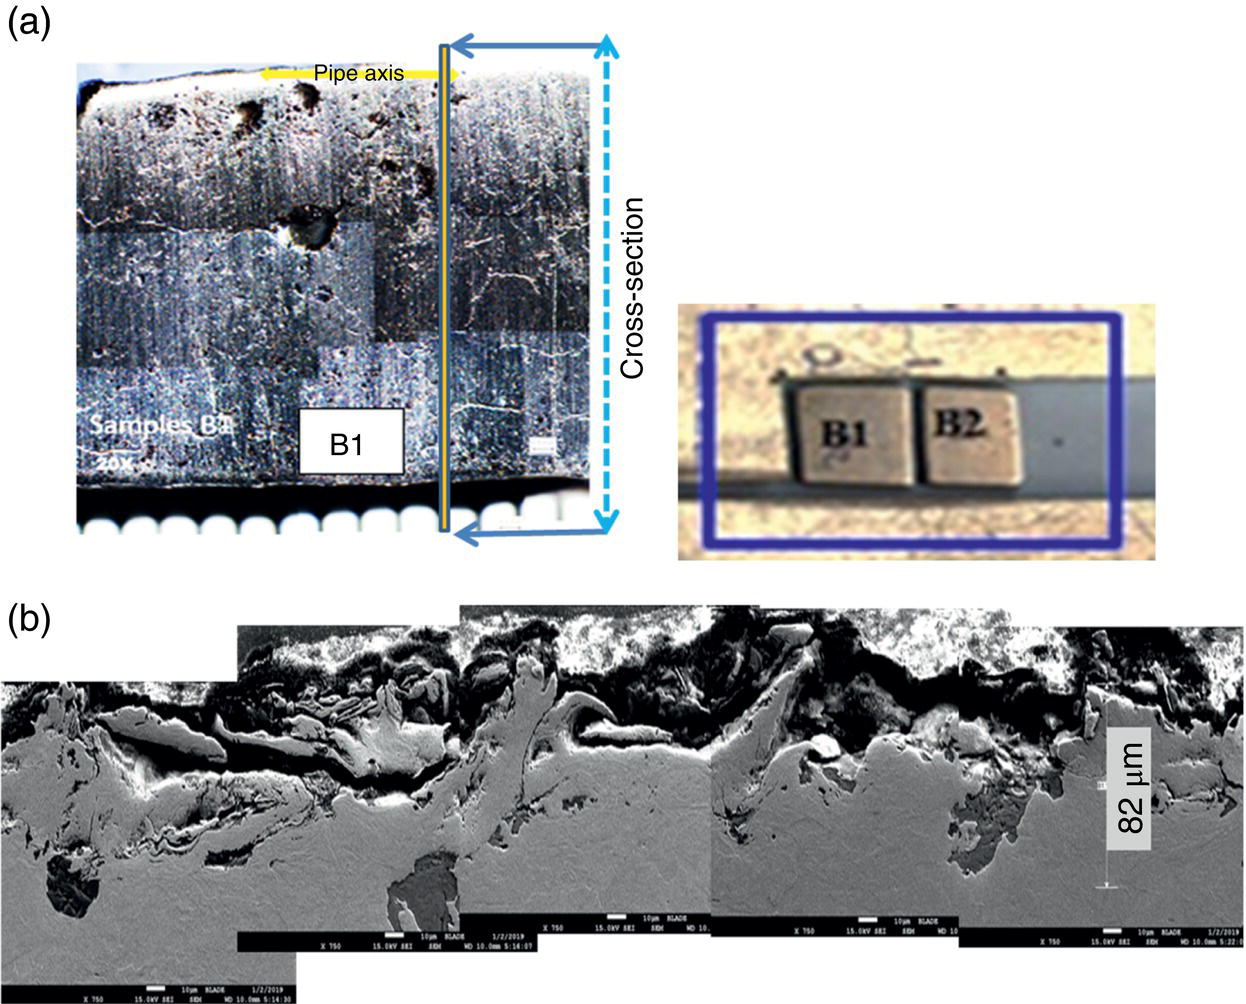
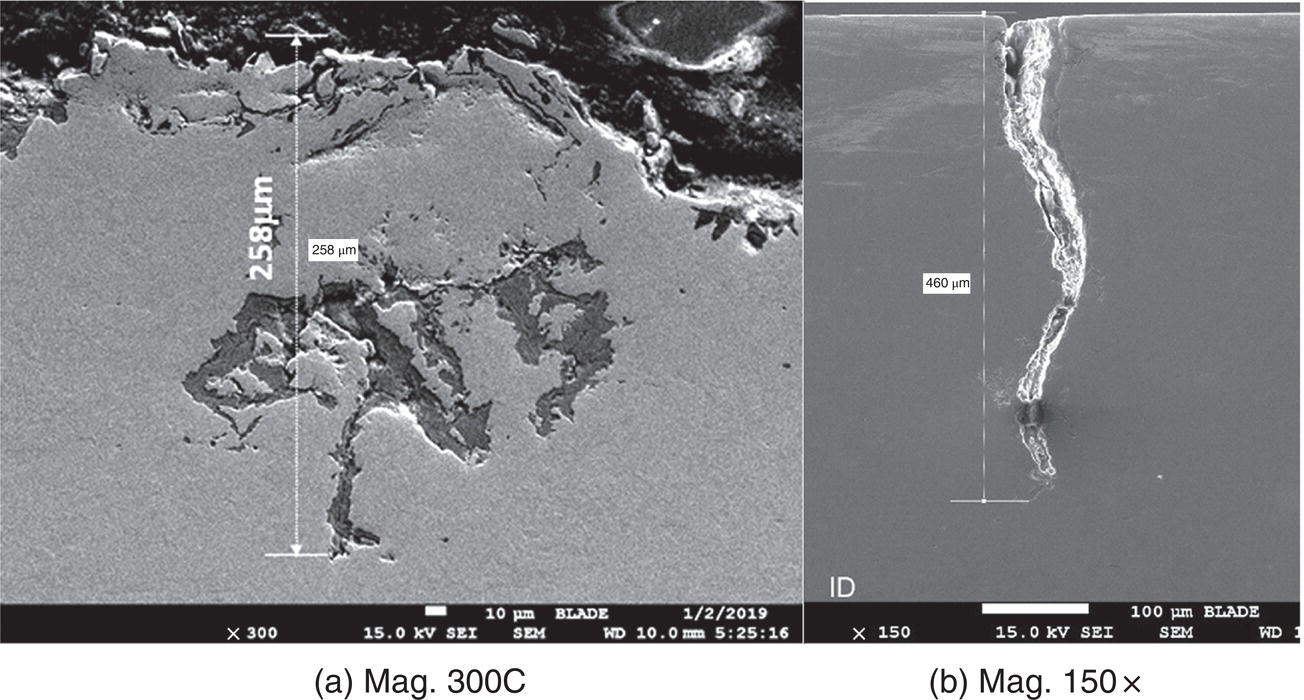

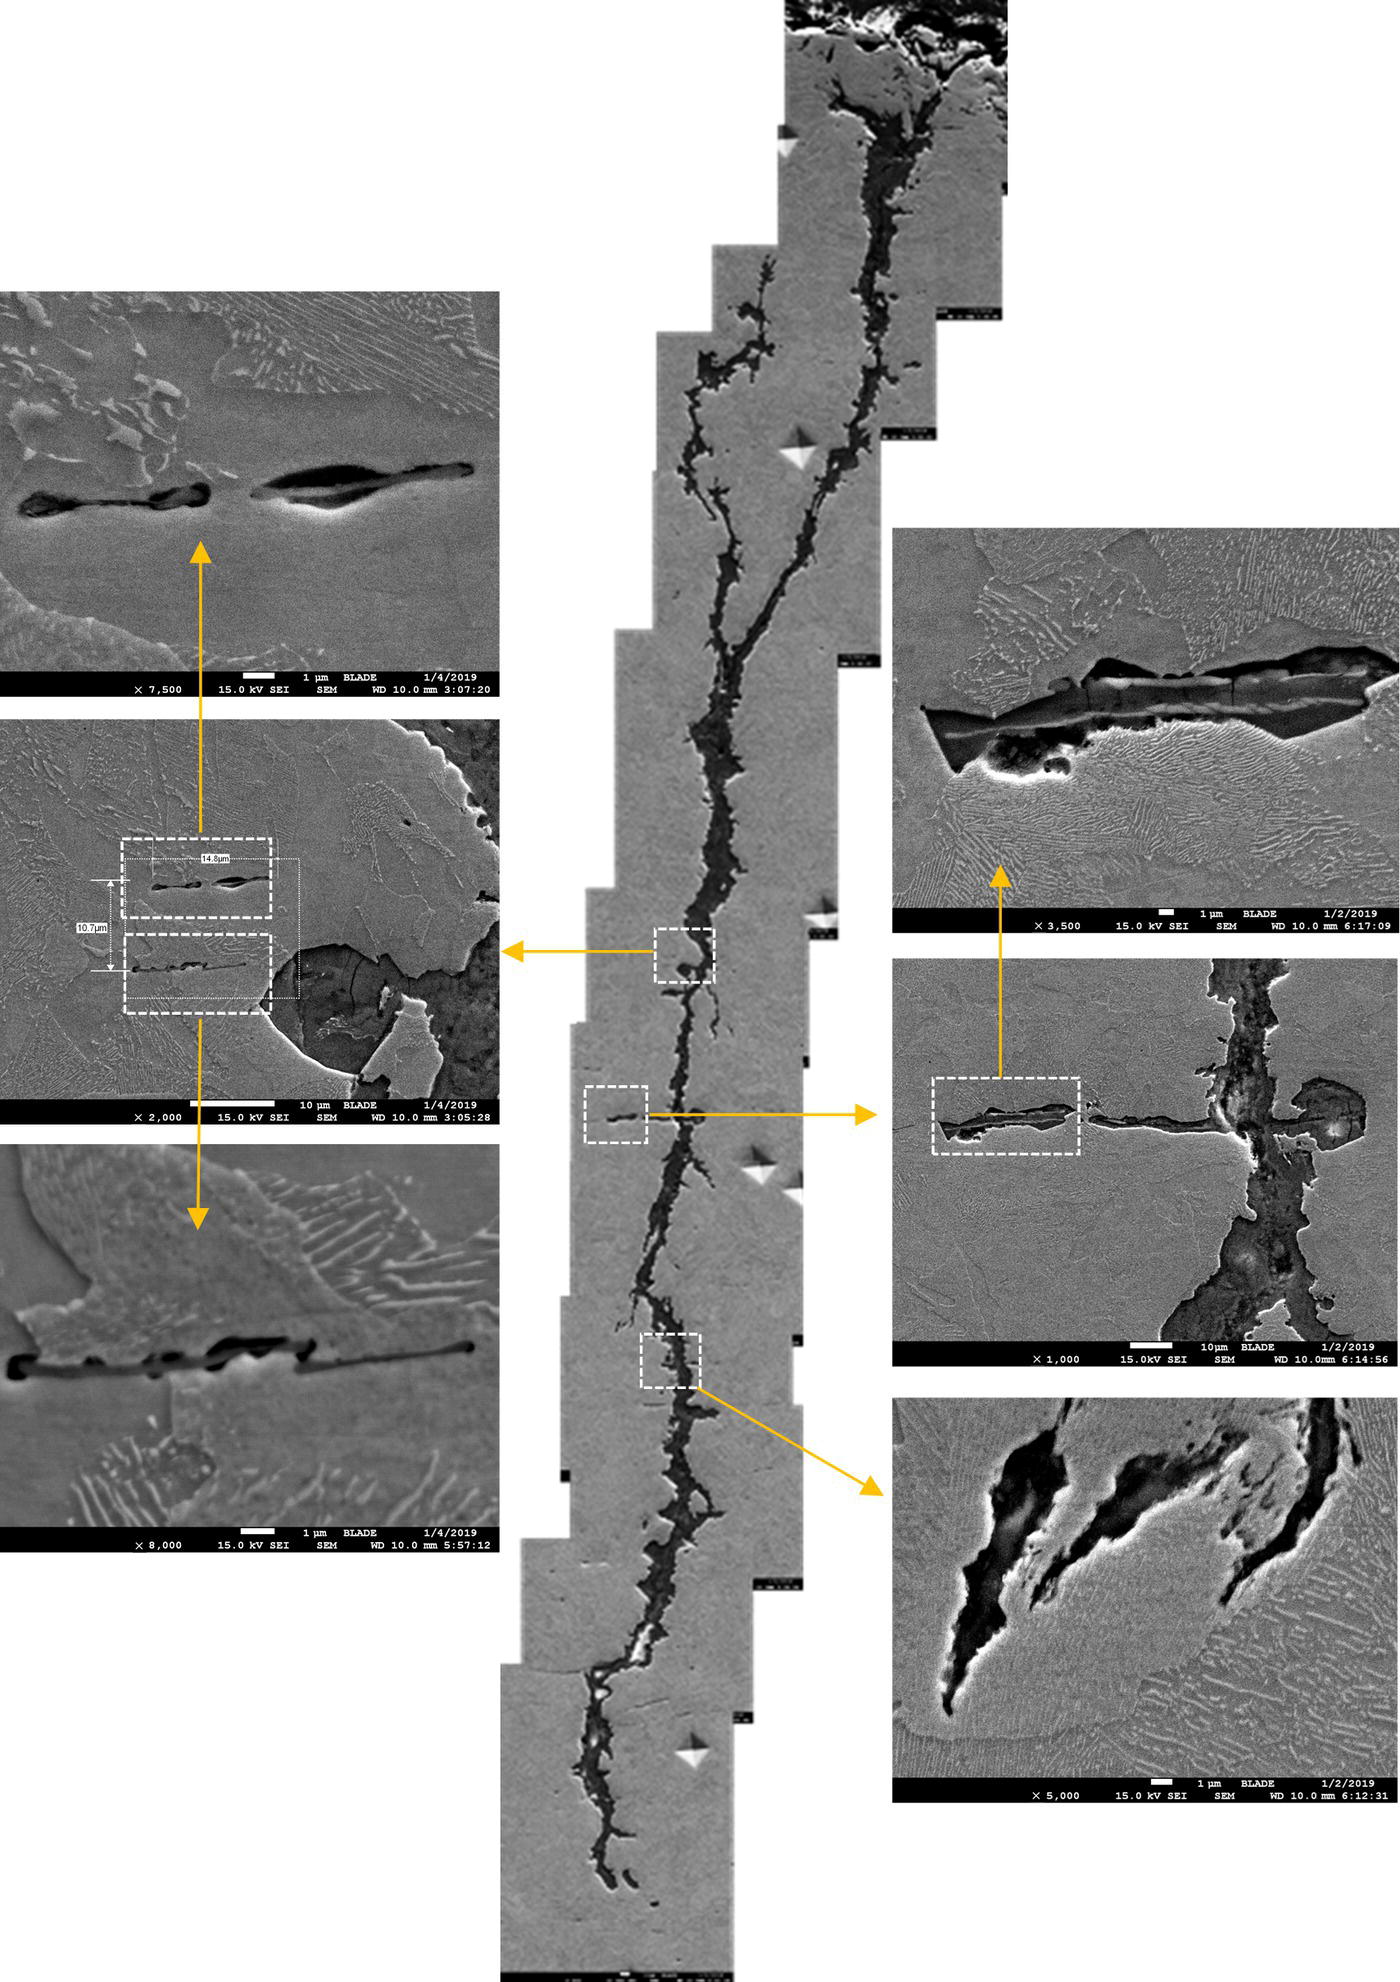
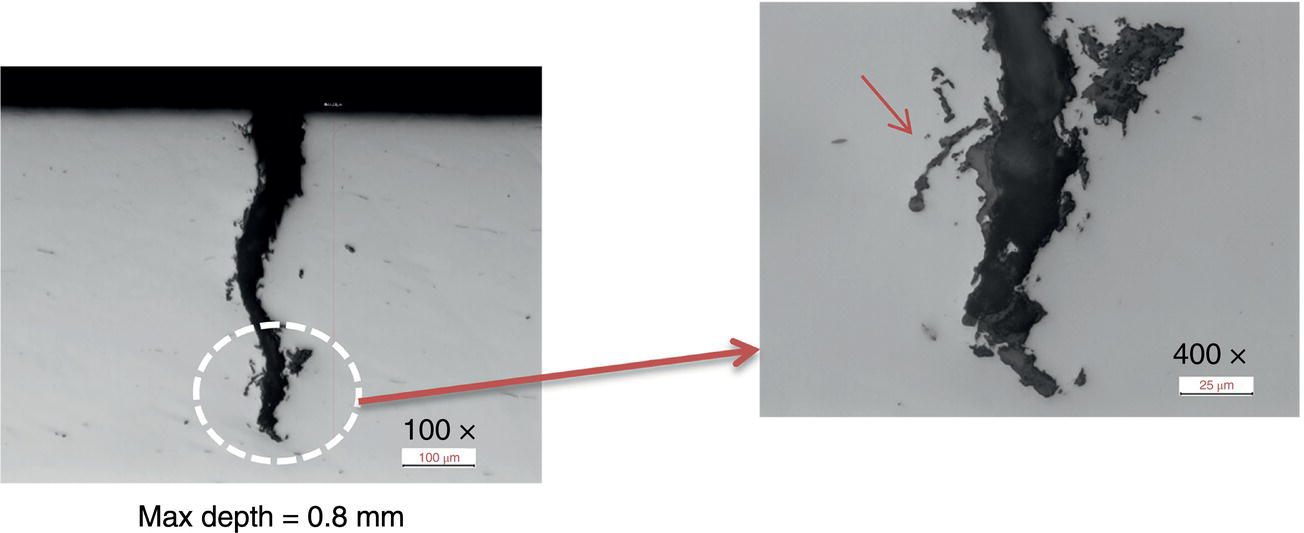
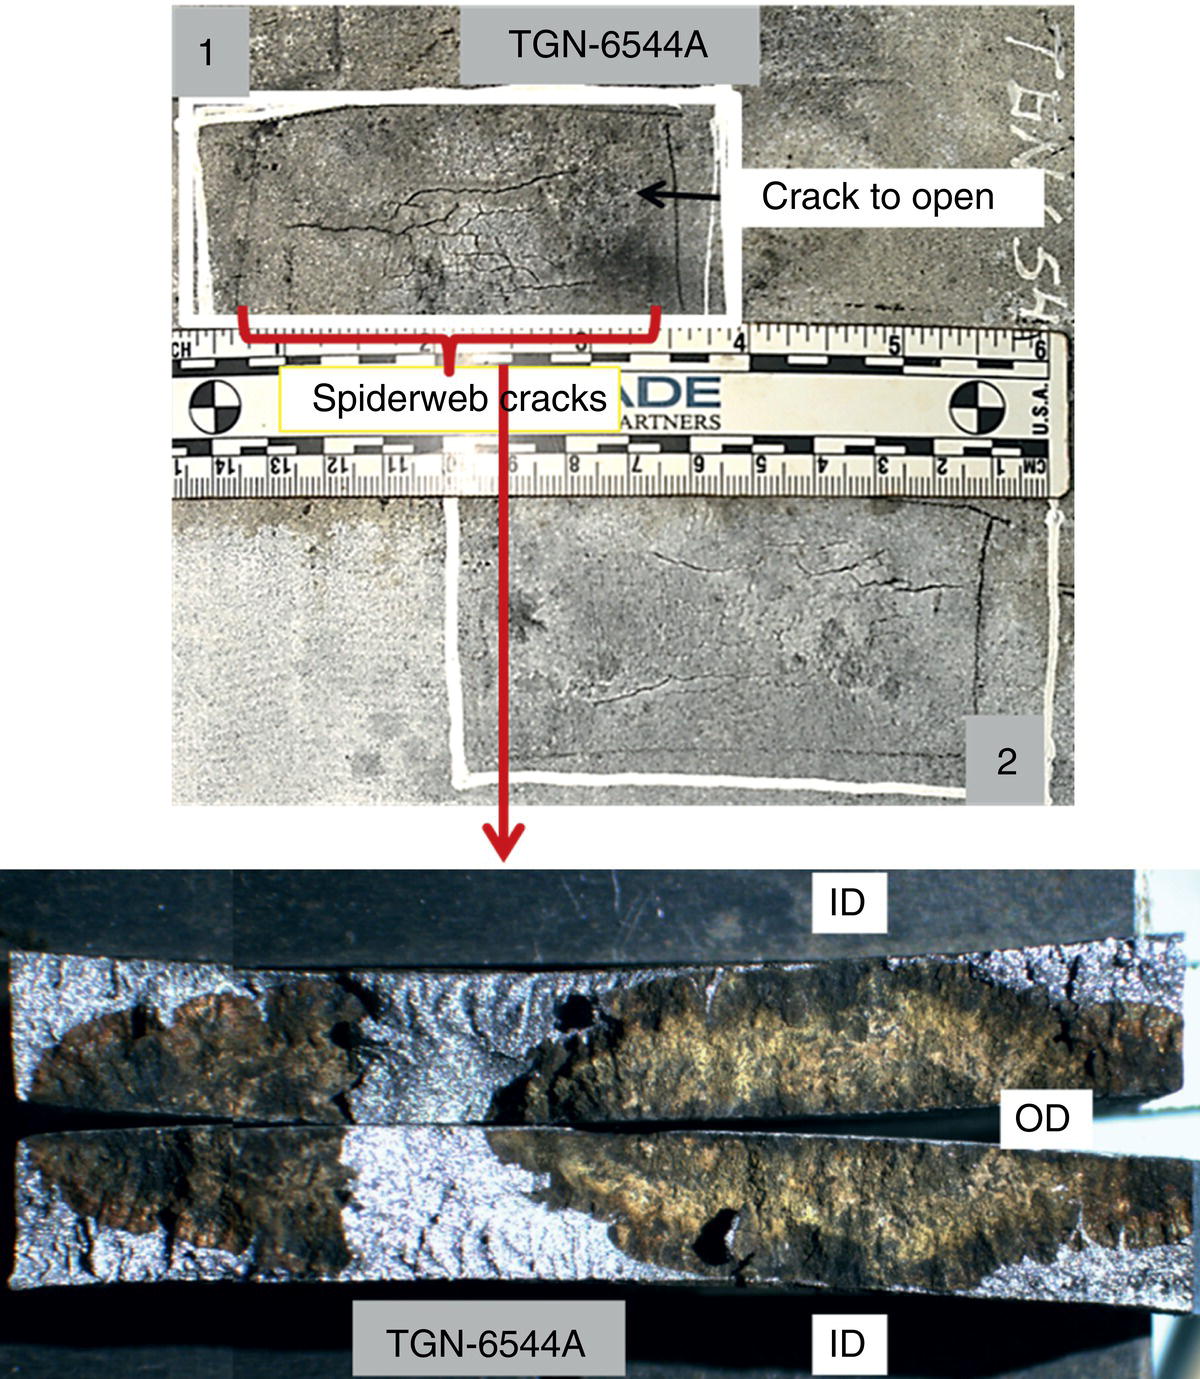

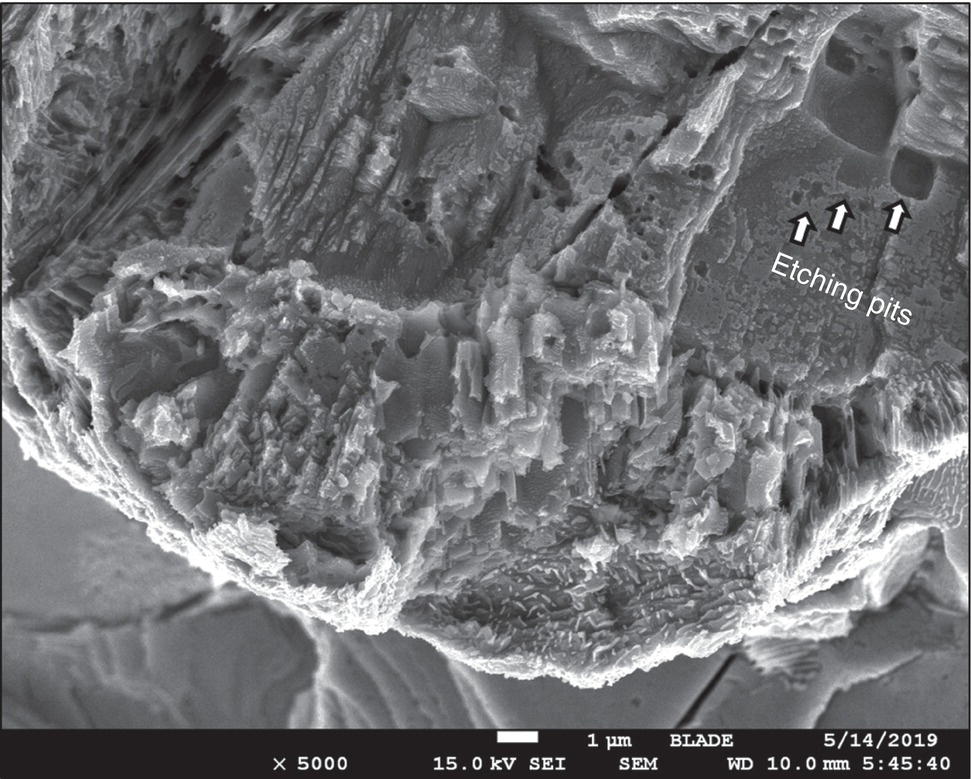
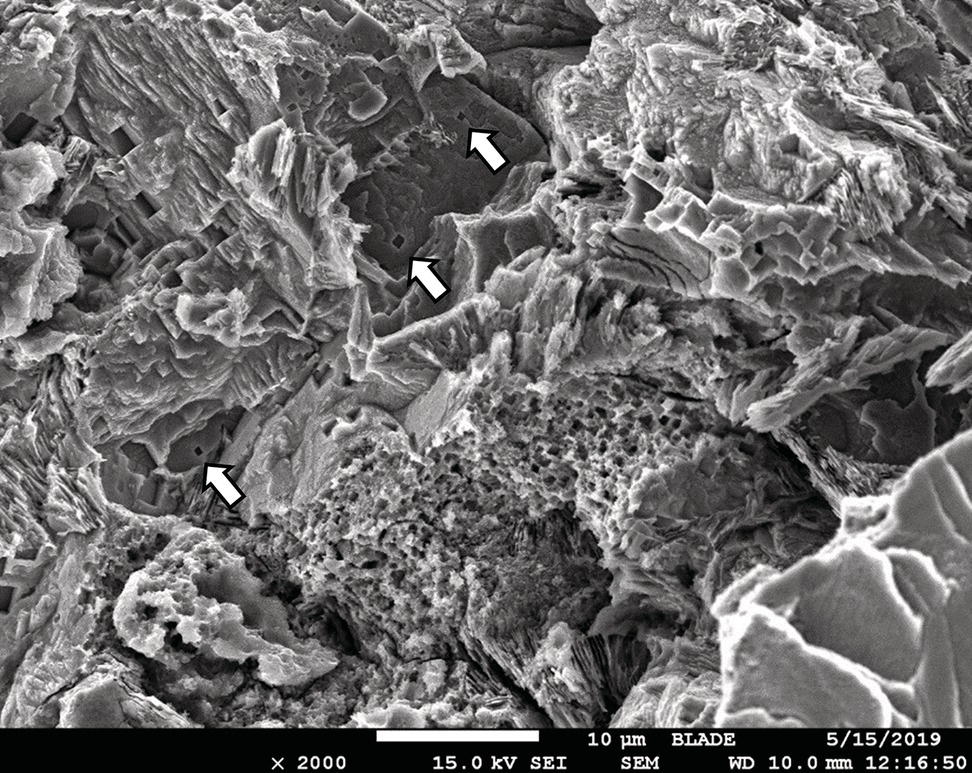
70.3 Mechanisms of Cracking
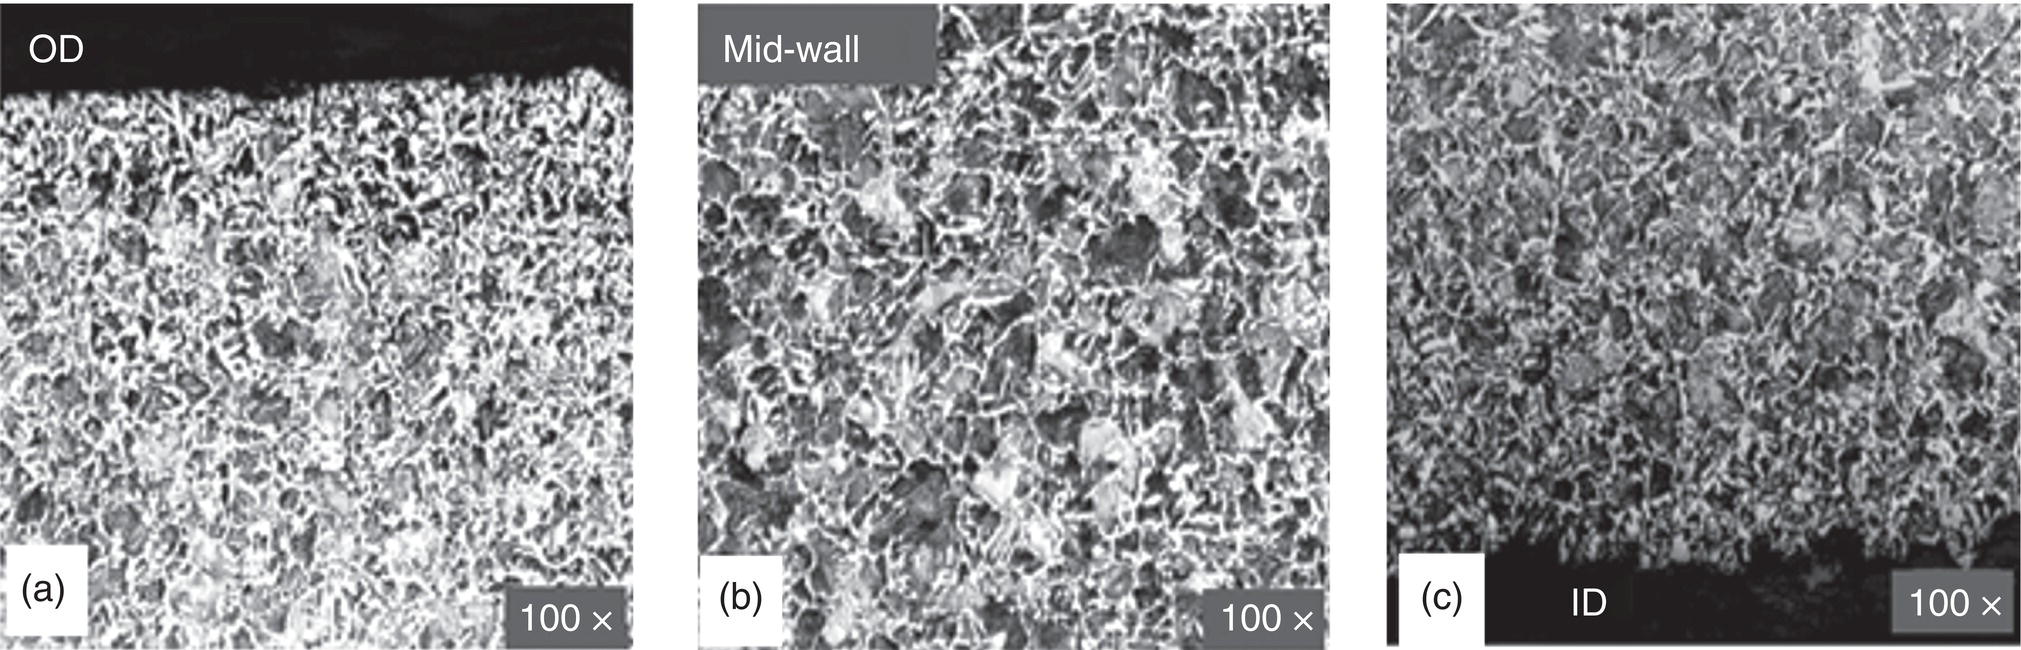
70.3.1 HAC and HIC
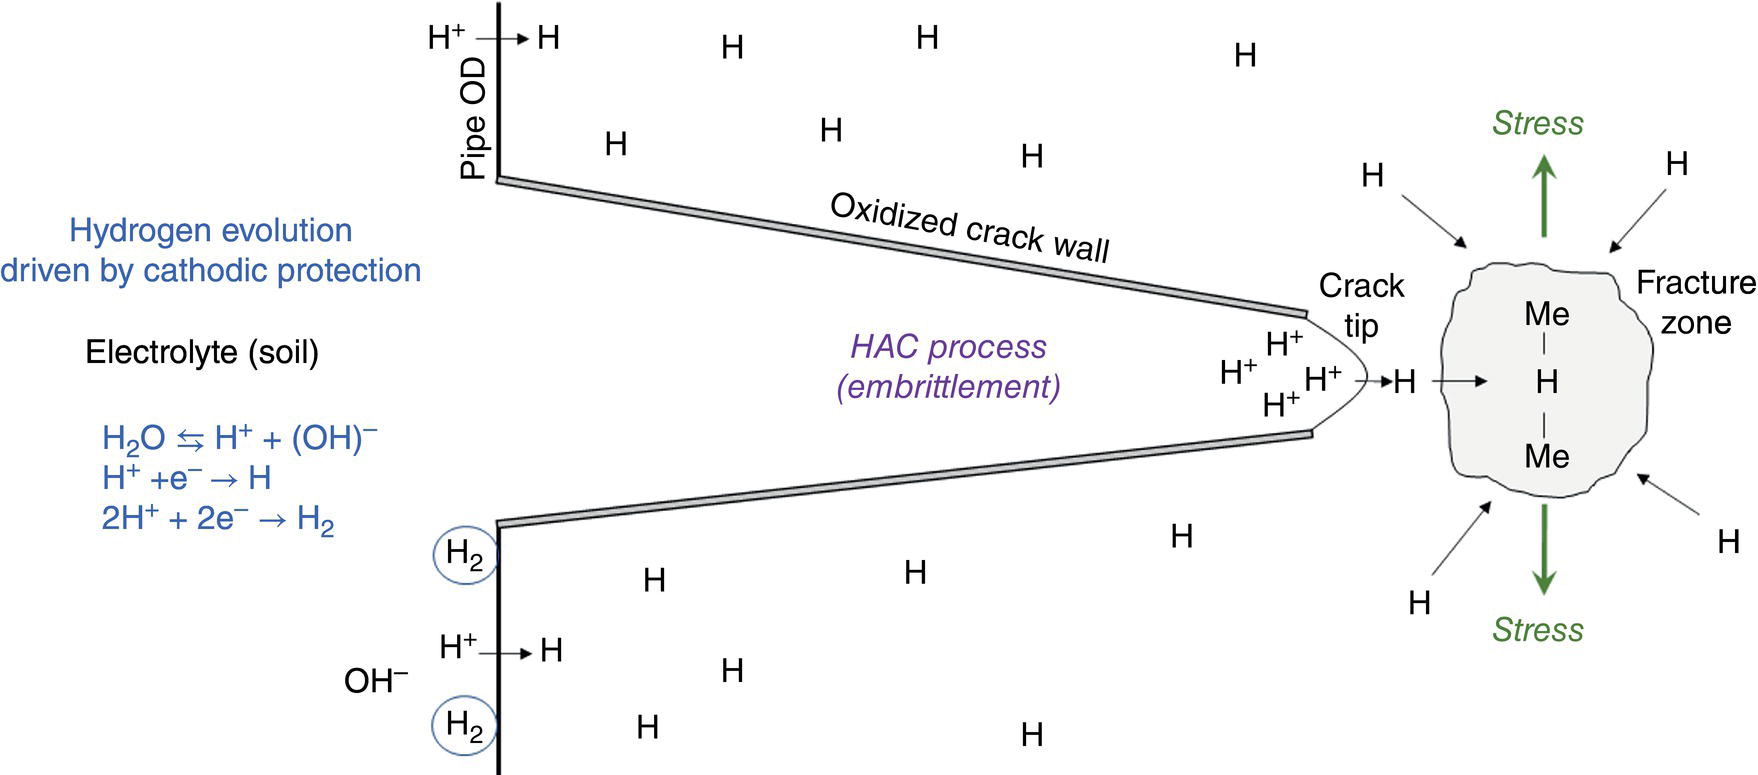
70.3.2 Comparison Between HAC and NNpHSCC Mechanisms
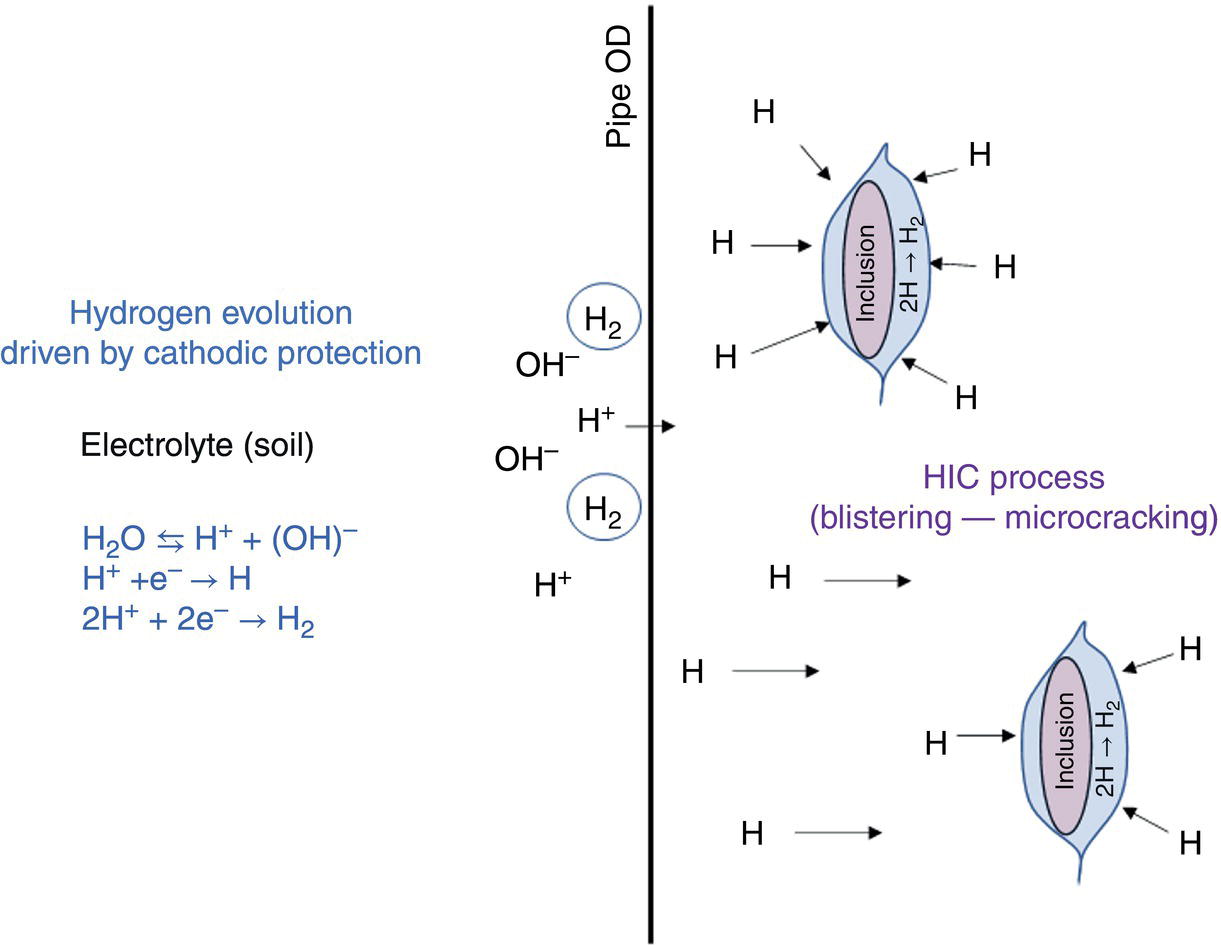
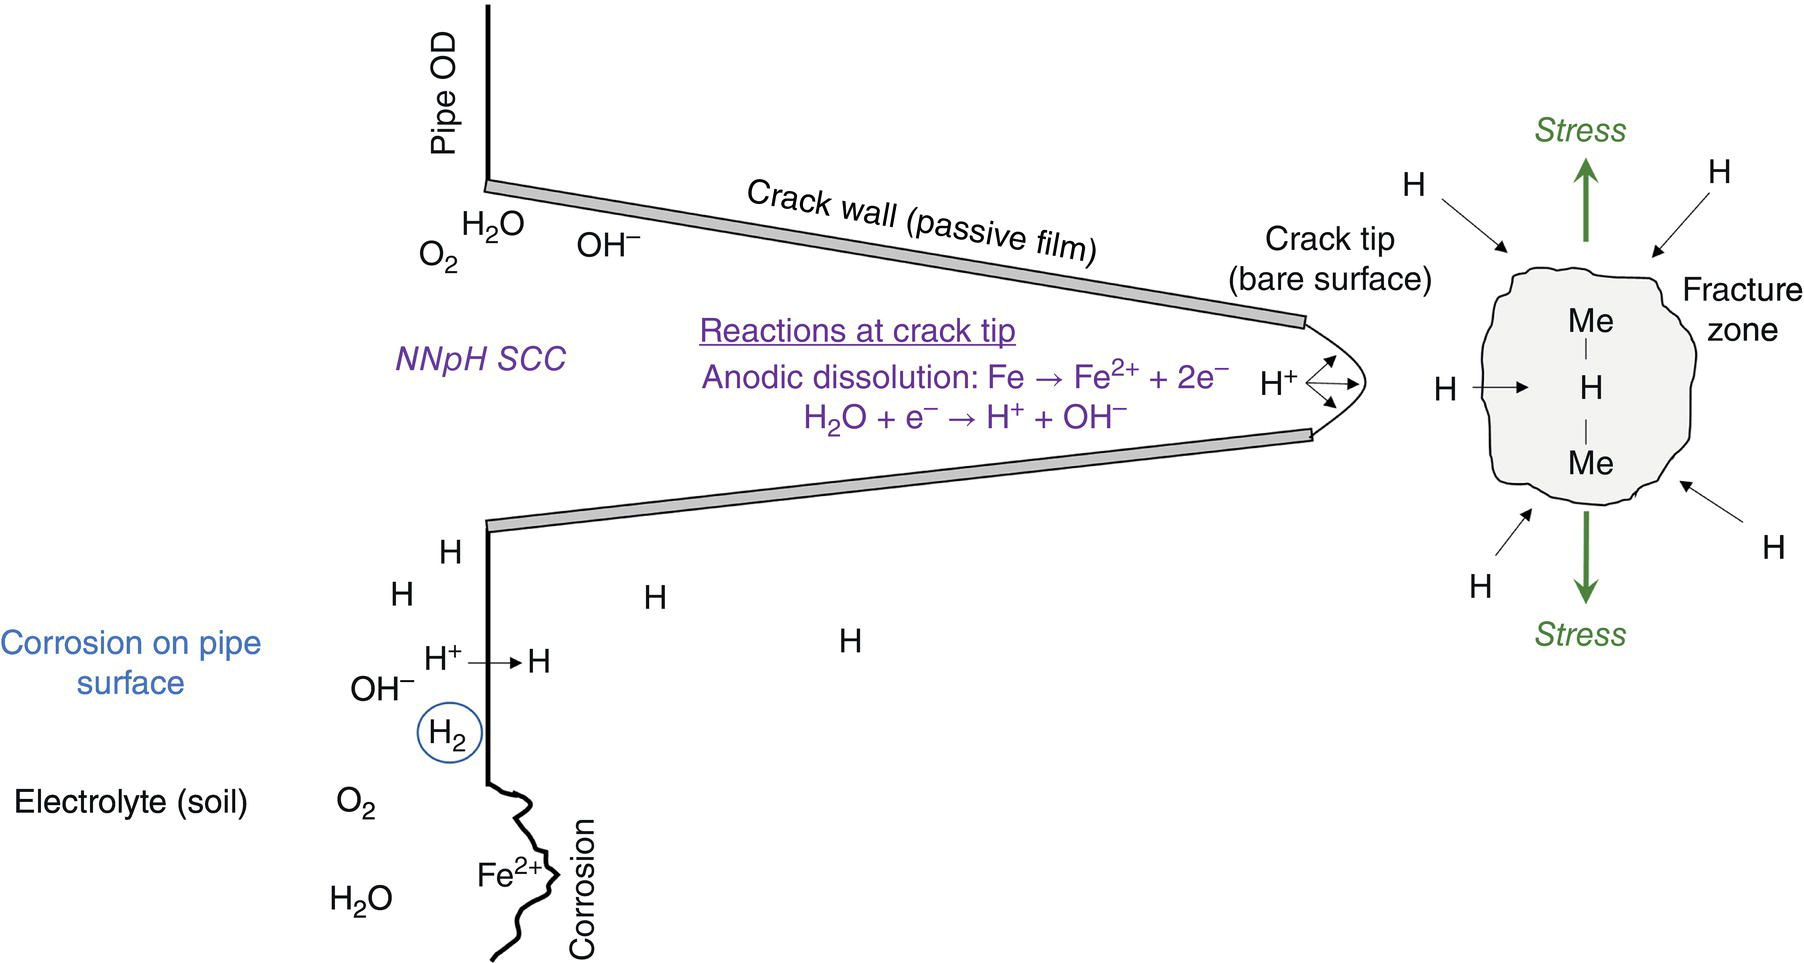
70.3.3 Hydrogen Evolution: Cathodic Protection vs Free Corrosion
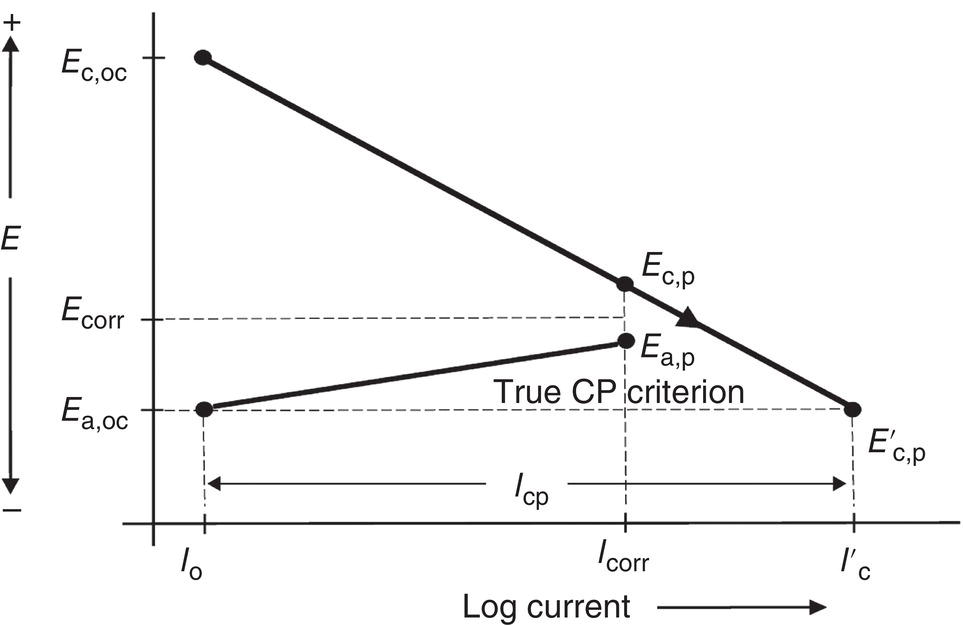
70.3.4 Cathodic Protection and pH of the Electrolyte
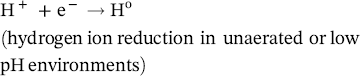
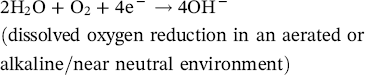

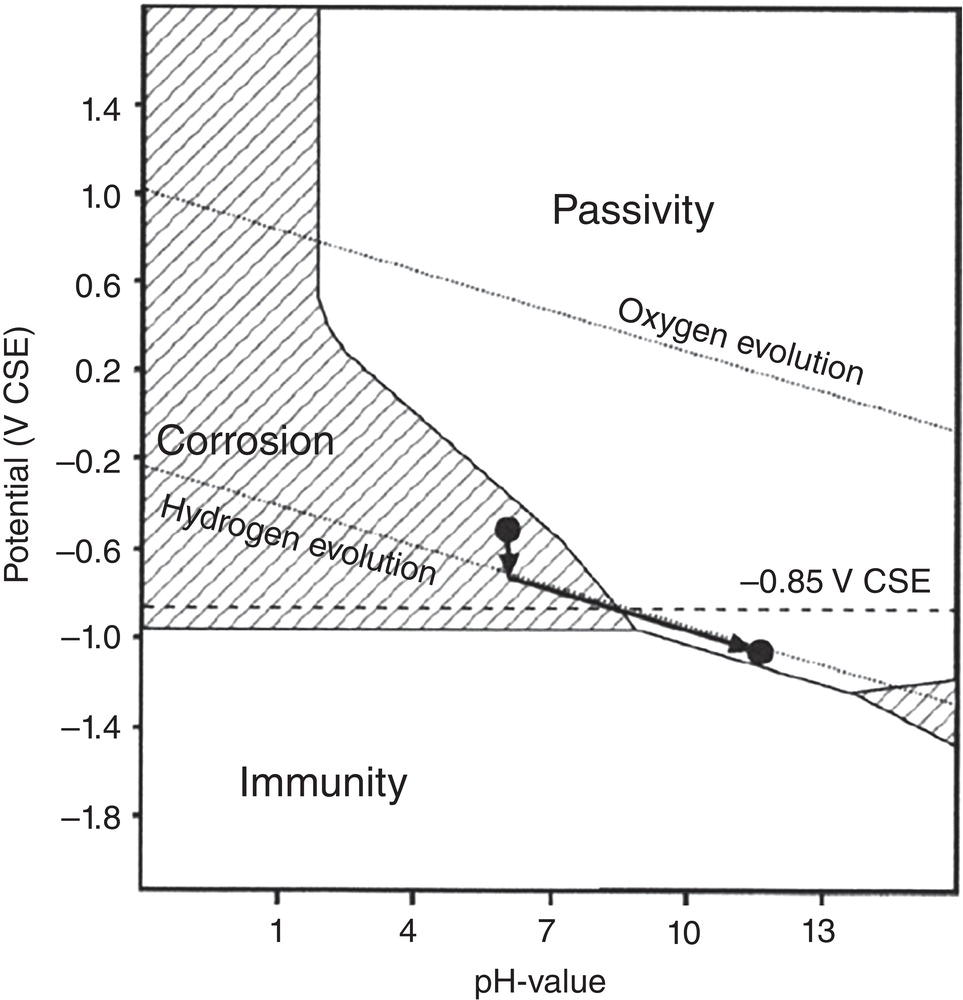
70.3.5 Coating Disbondment and Cathodic Protection Shielding
70.3.6 Crack Dormancy/Blunting
70.4 Similar Cases in Europe, North America, and the Literature
70.4.1 Natural Gas Pipeline in Europe
70.4.1.1 Interpretation
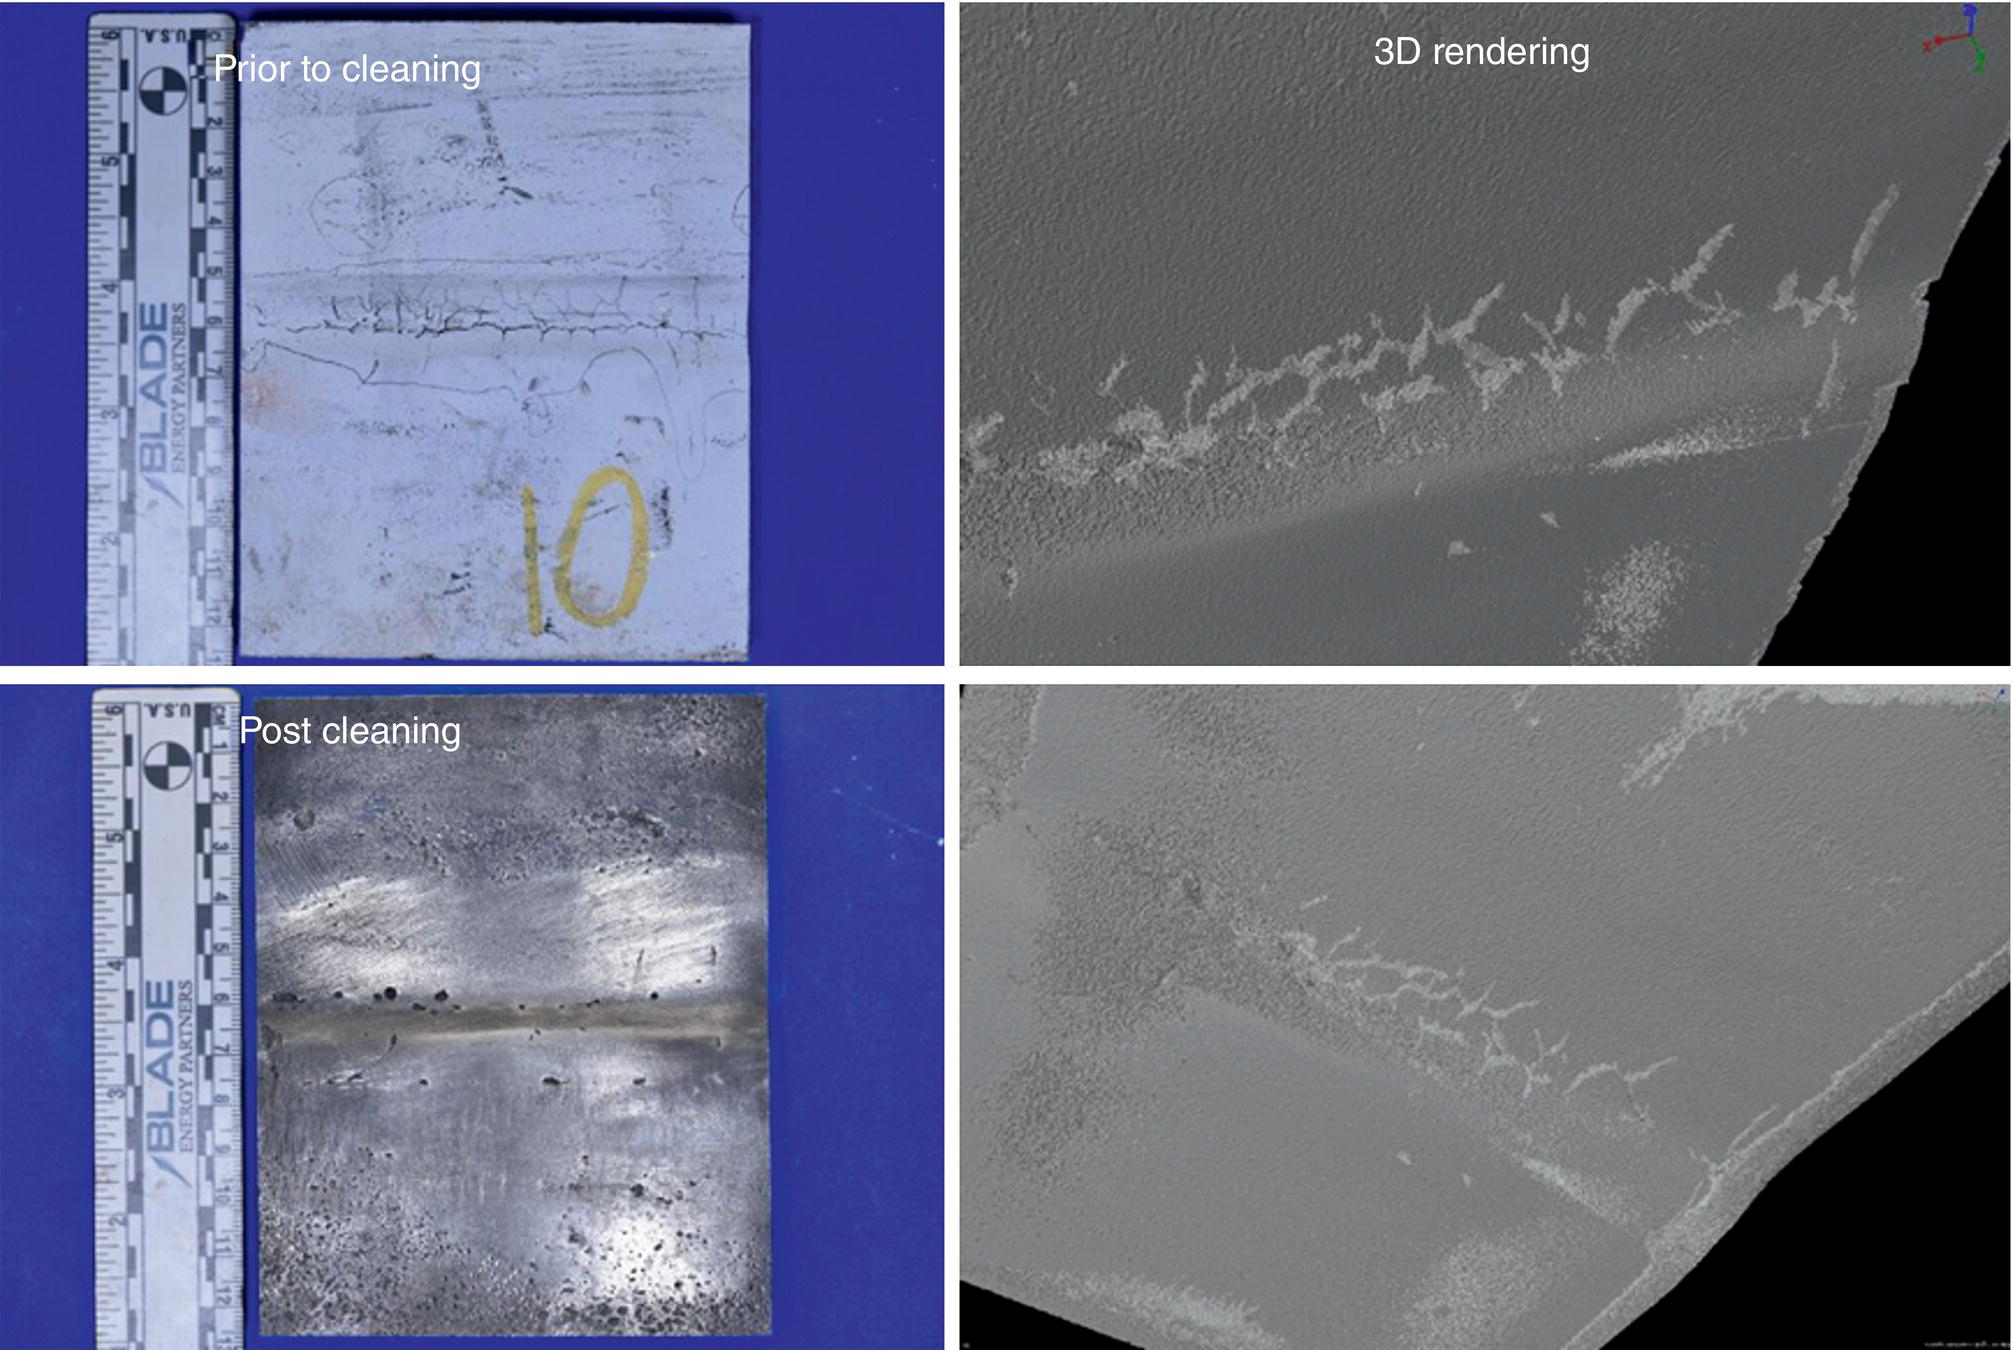
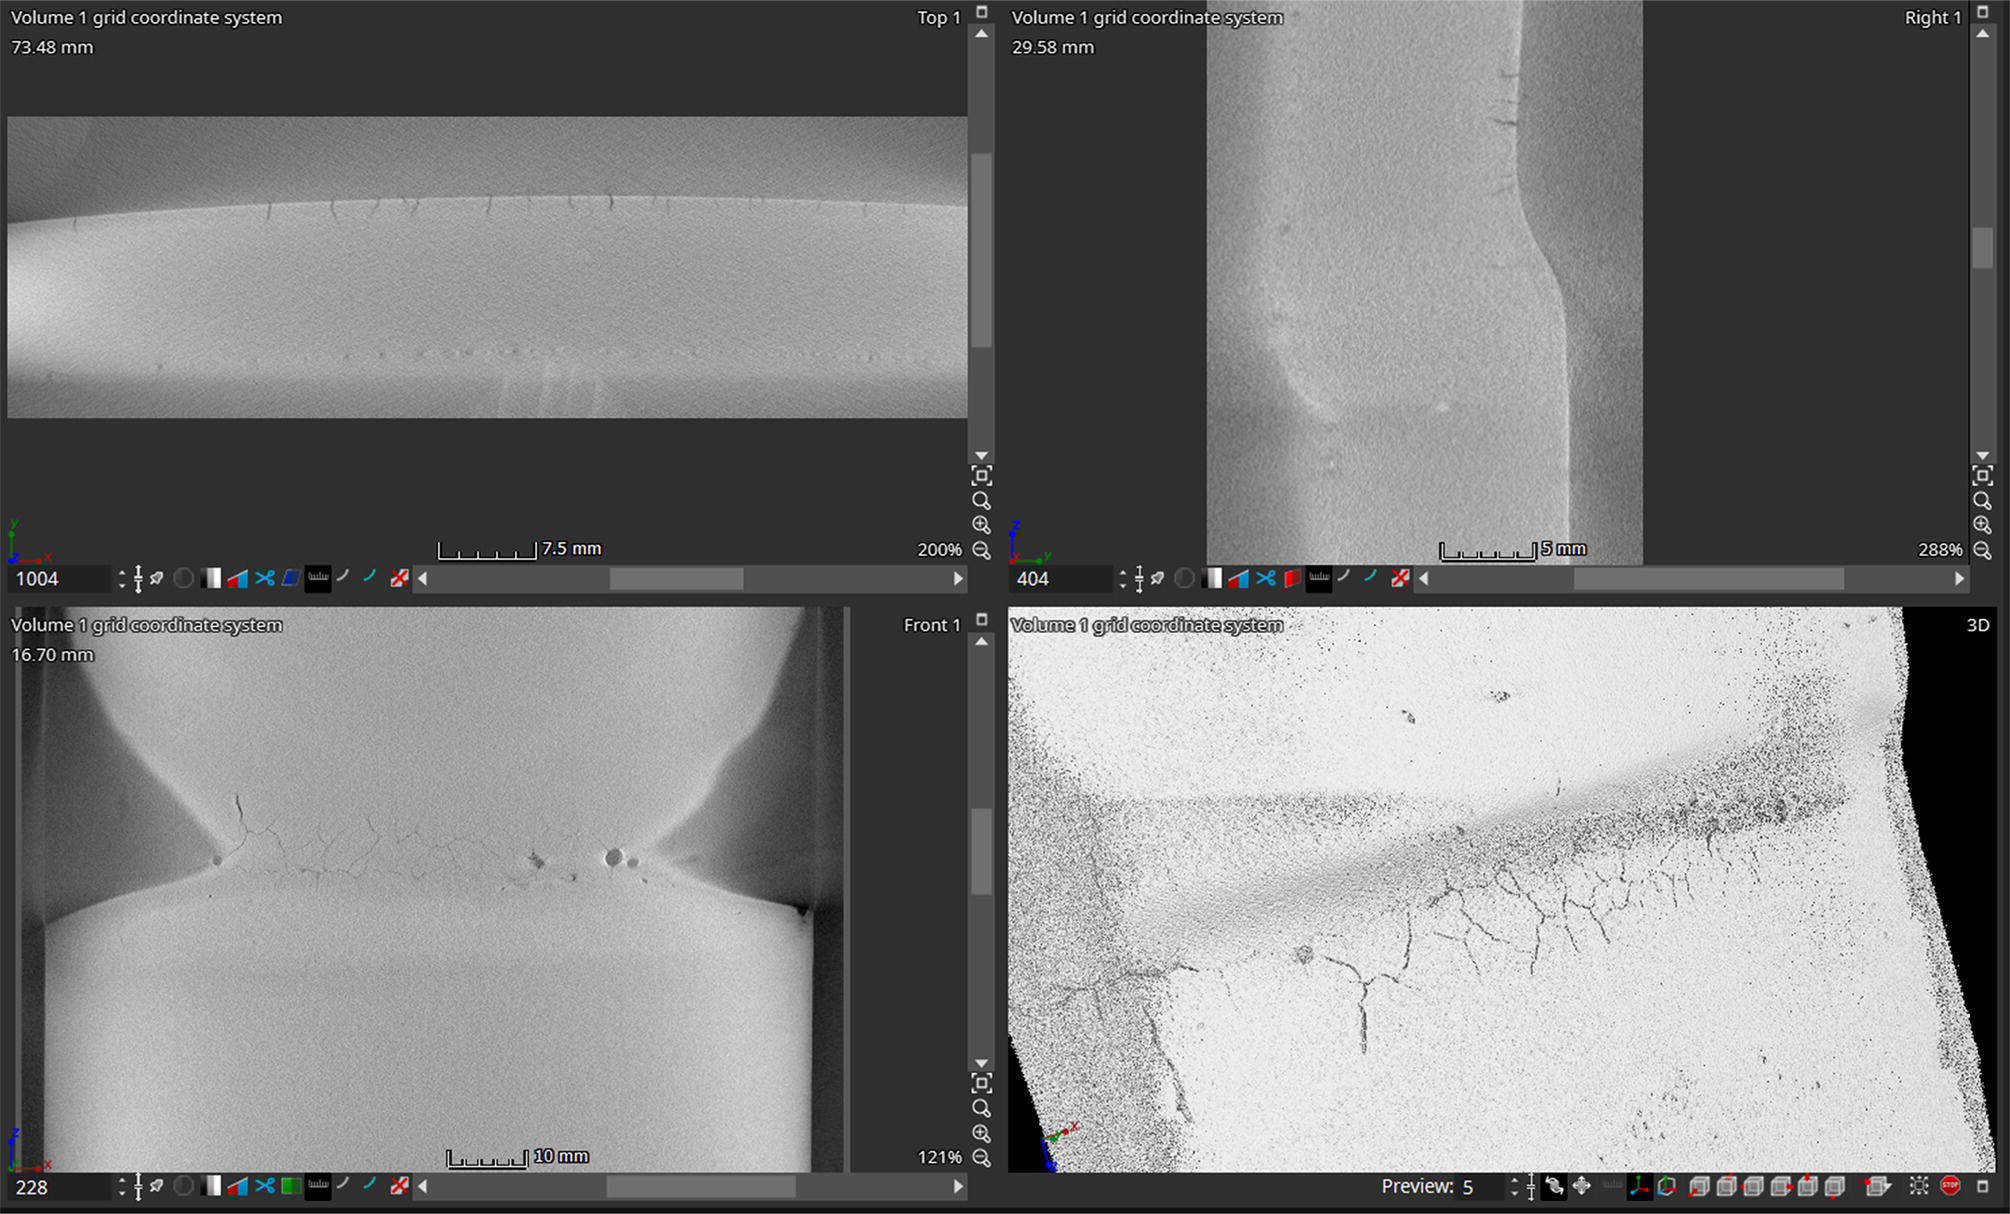
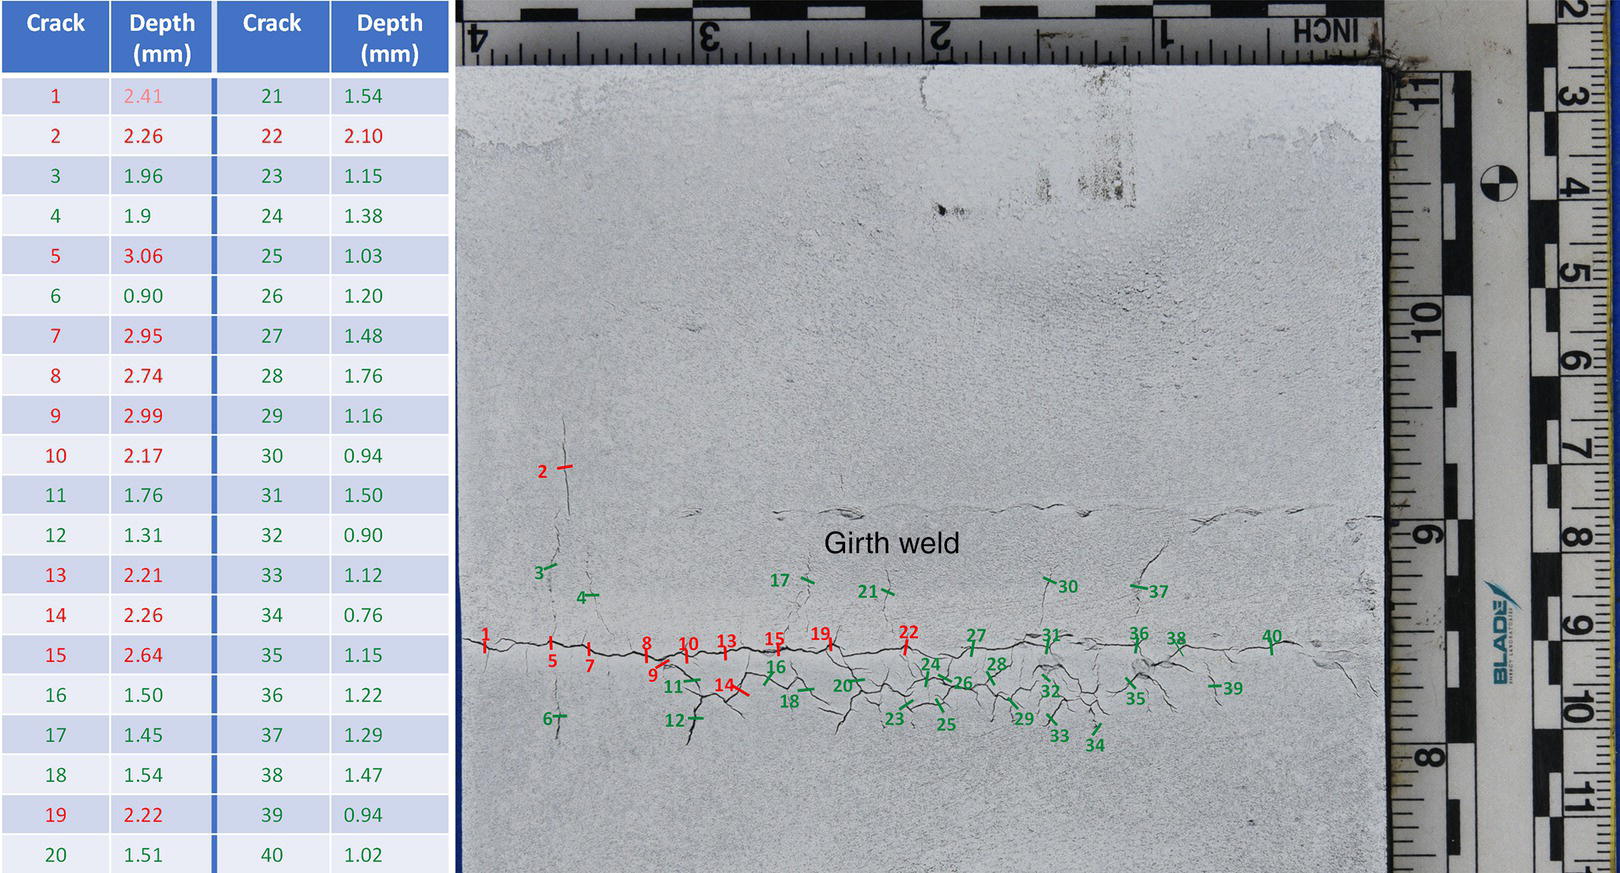
Sizing of Cracks
SEM Fracture Surface
SEM Fracture Surface After Cleaning
Mounted Specimen
SEM Cross Section for MnS Delamination
Cross Section Etched-Metallography
Hardness
Sample 10 (weld)
√
√
Acetone, Alconox, Citranox
√
√
√
√
Sample 4 (base metal)
√
√
Acetone, Alconox
√
√
√
√
Sample 7/9 (base metal)
√
√
√
√
√
√
Sample 6/8 (base metal)
√
√
√
√
√
√
Sample 1a (near weld)
√
√
√
√
√
√
Sample 3a (near weld)
√
√
√
√
Sample 3b (weld)
√
√
√
√
Transgranular
Intergranular
Flat Cleavage facetsa
{001} Orientation Pitsa
Undefined facetsb
Delamination
Crack Tip
Sample 10 (weld)
√
x
√
√
√
x
Blunt/dormant
Sample 4 (base metal)
√
x
√
√
√
x
Blunt/dormant
Sample 7/9 (base metal)
√
x
√
√
√
x
Blunt/dormant
Sample 6/8 (base metal)
√
x
√
x
Blunt/dormant
Sample 1a (near weld)
√
x
√
√

x
Blunt/dormant
Sample 3a (near weld)
√
Blunt/dormant
Sample 3b (weld)
√
Blunt/dormant
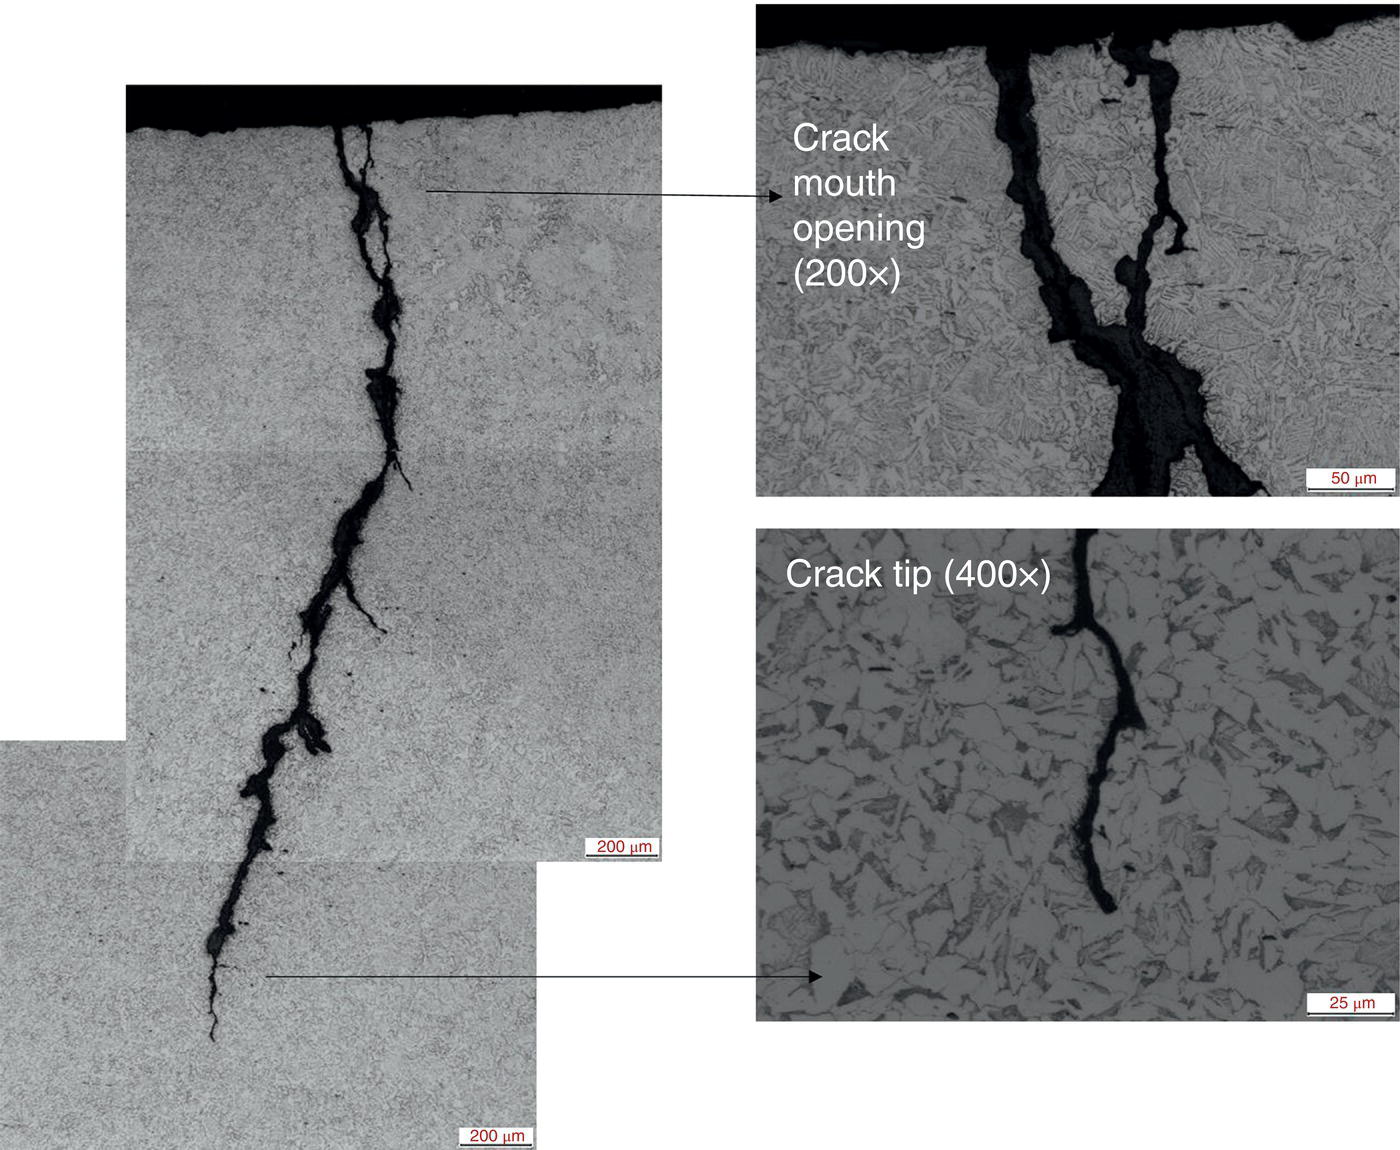
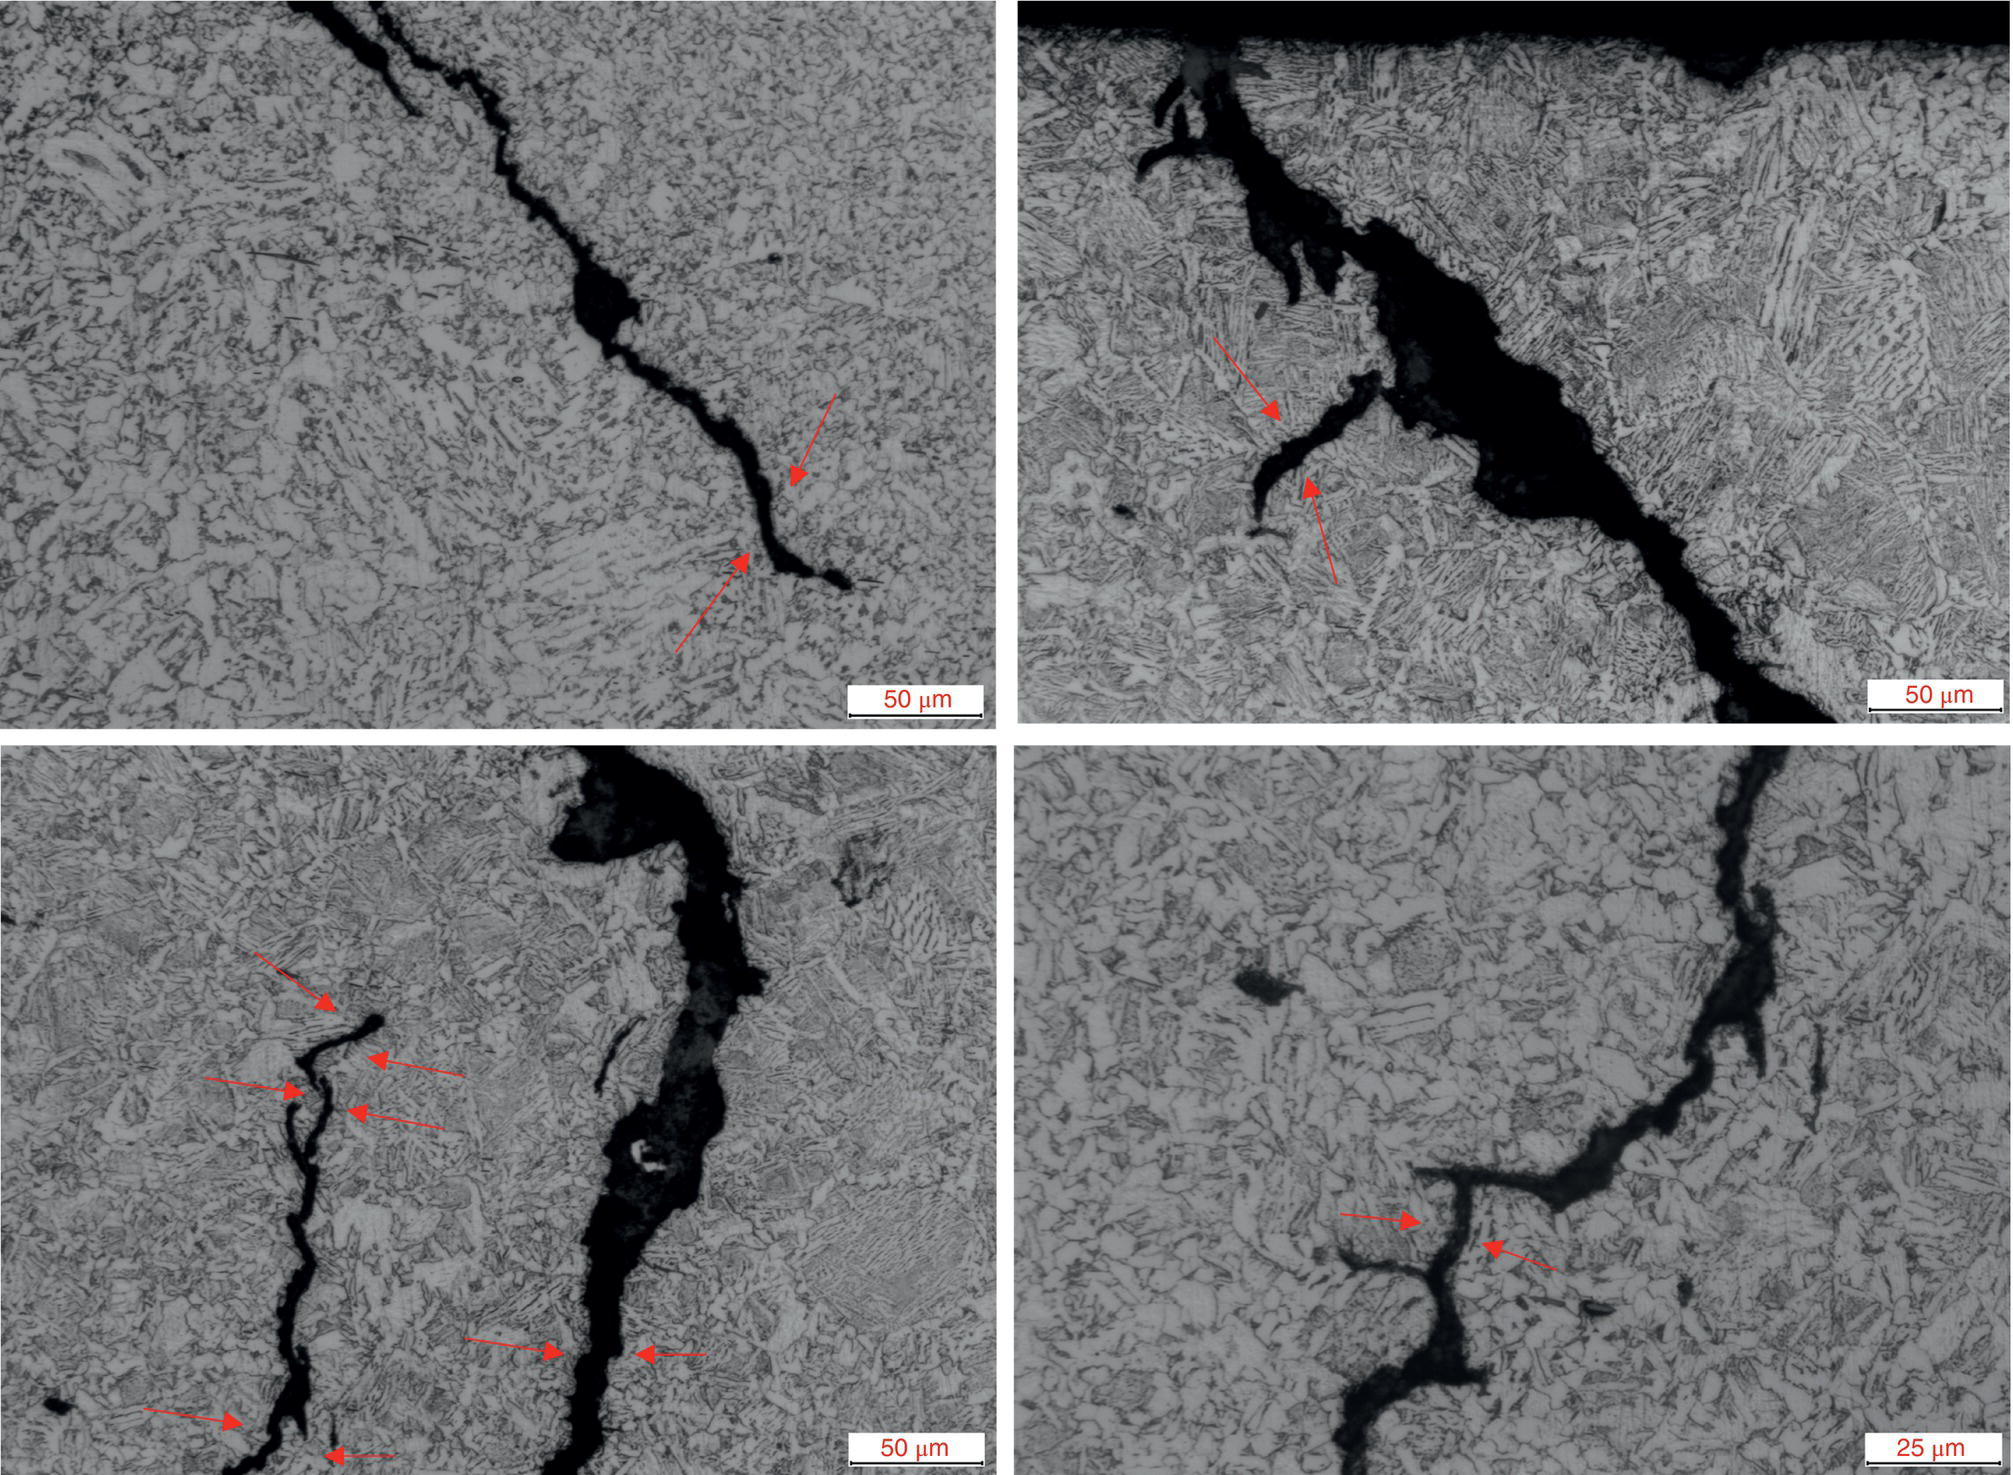
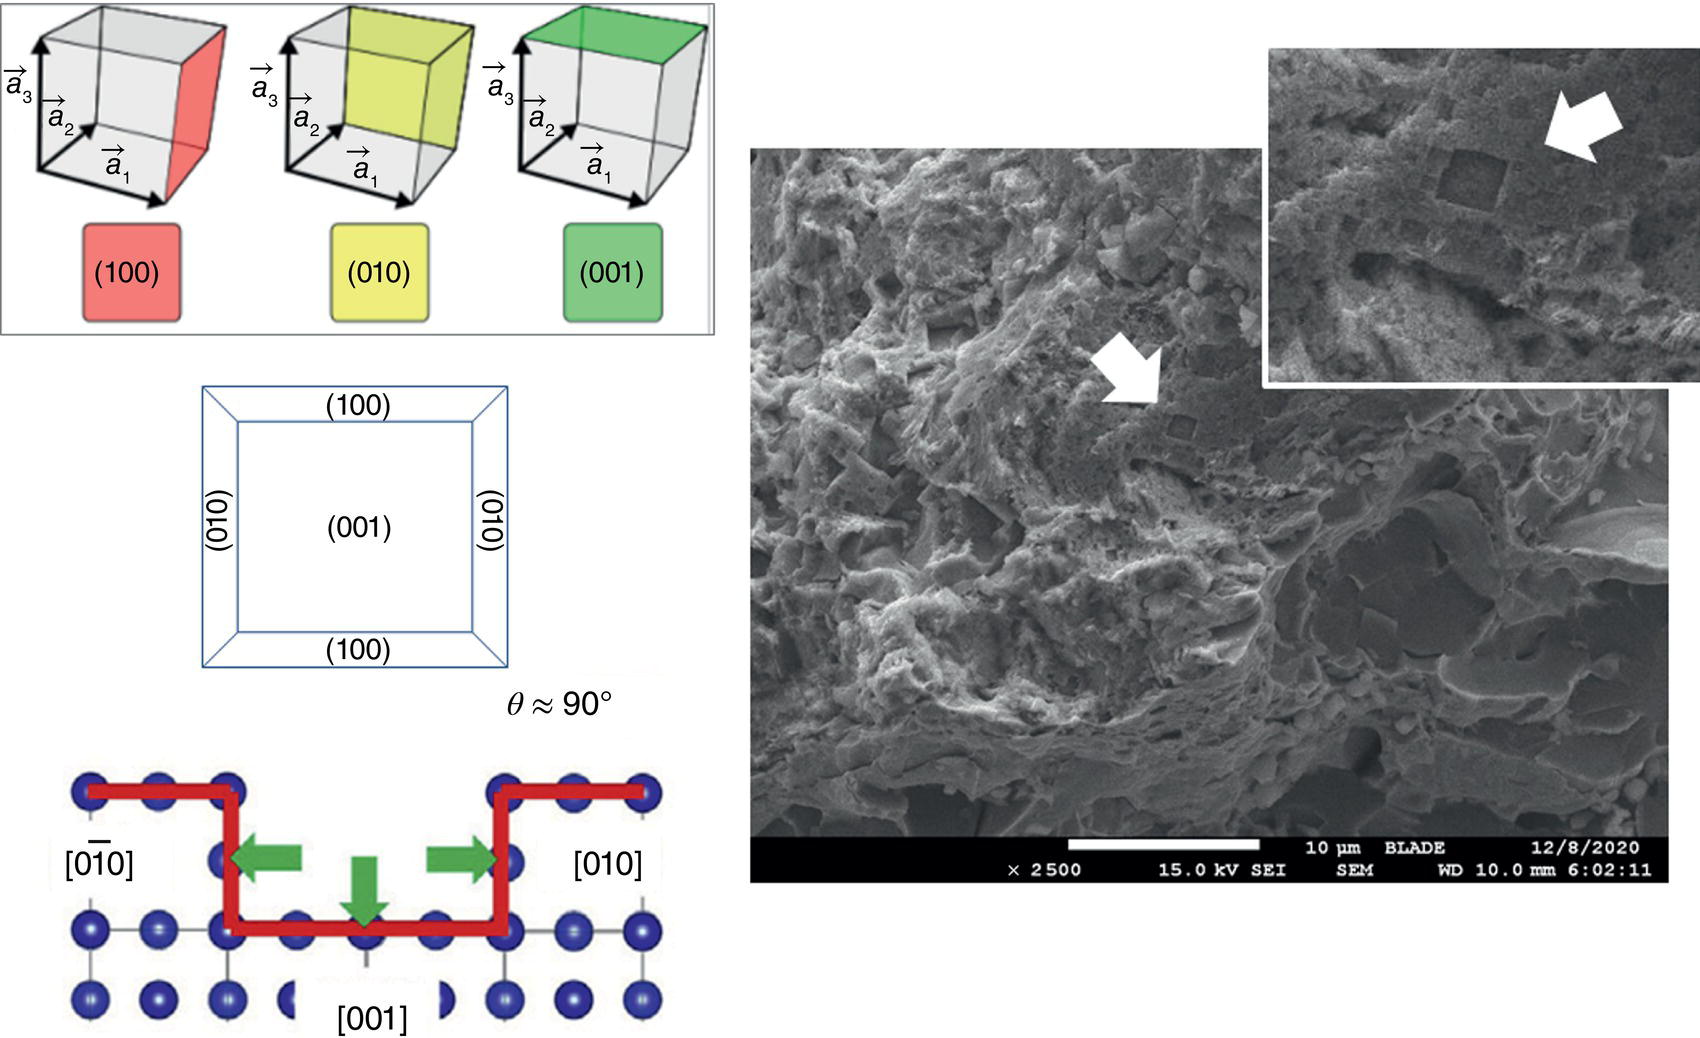
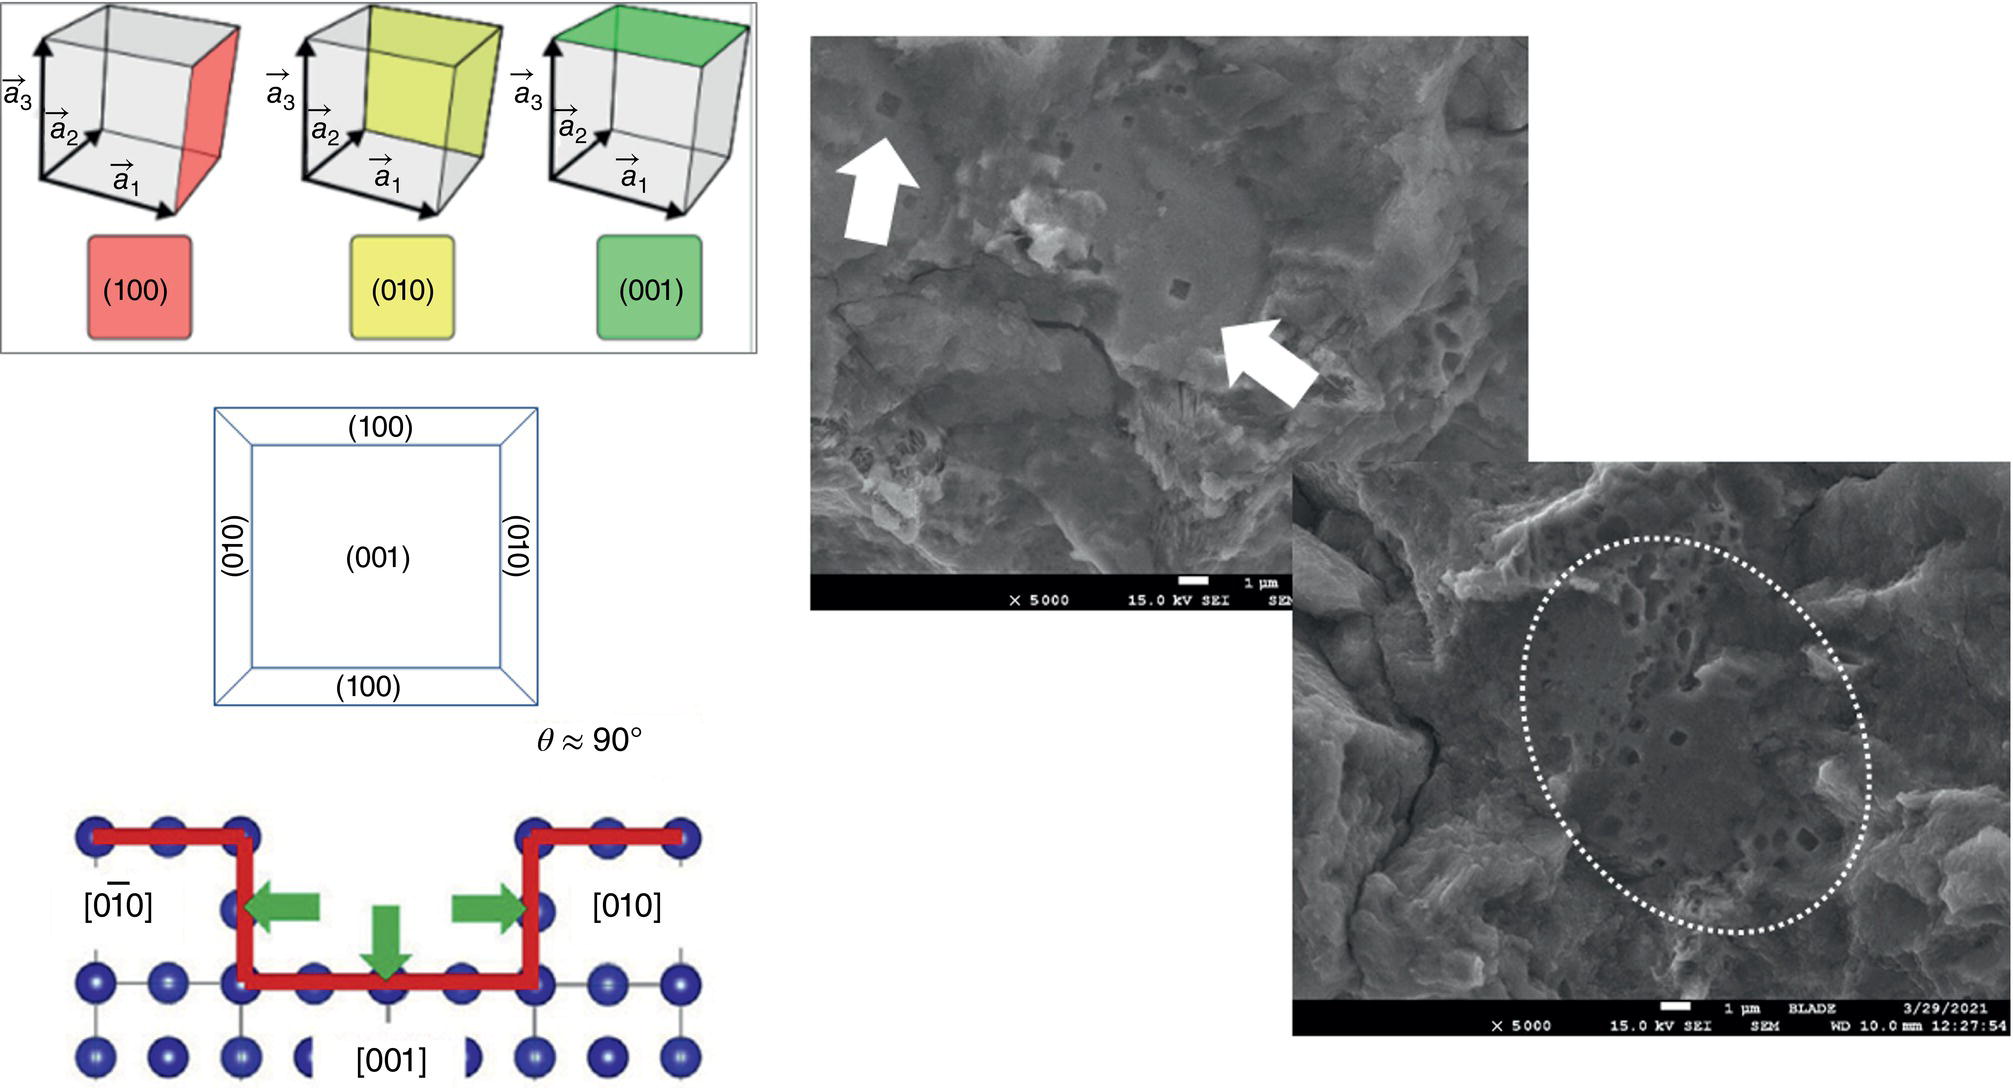
70.4.1.2 Discussion of the Findings from Natural Gas Pipeline in Europe
70.4.1.3 Effectiveness of the CP
70.4.1.4 Welding Defects
70.4.1.5 Crack Dormancy
70.4.1.6 Further Work
70.4.1.7 Summary of Findings
70.4.1.8 Conclusions of the Investigation
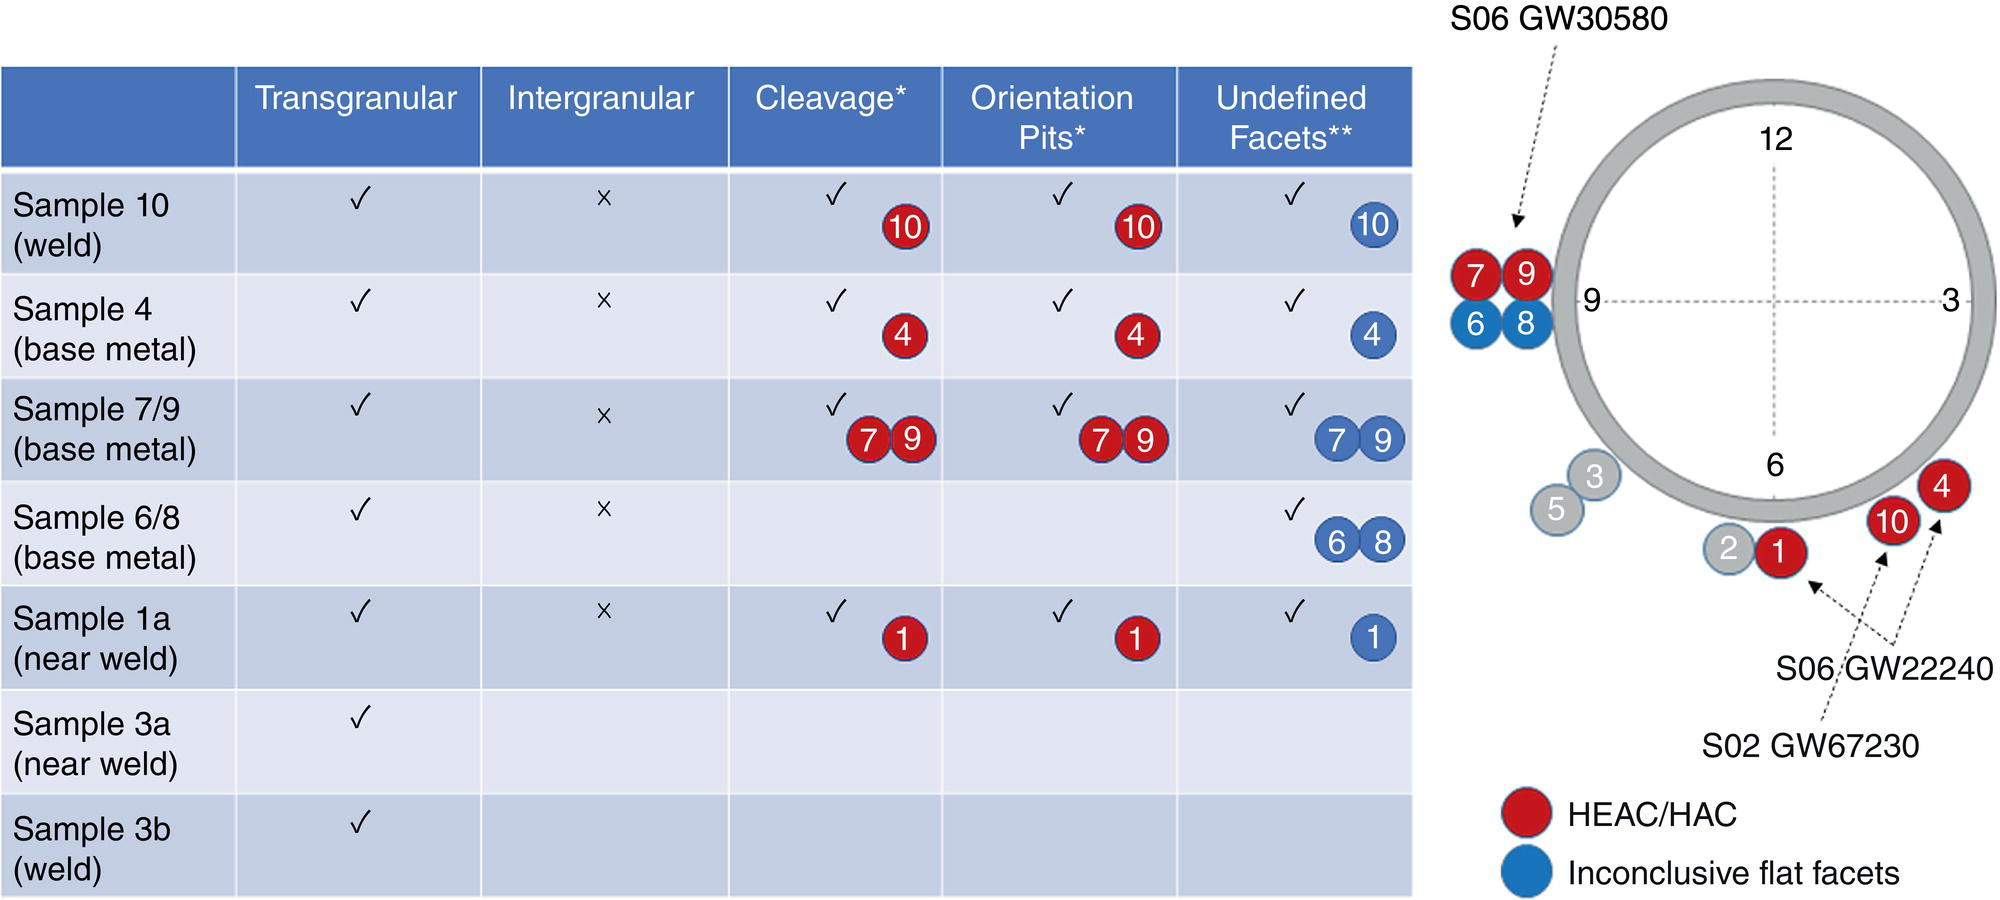
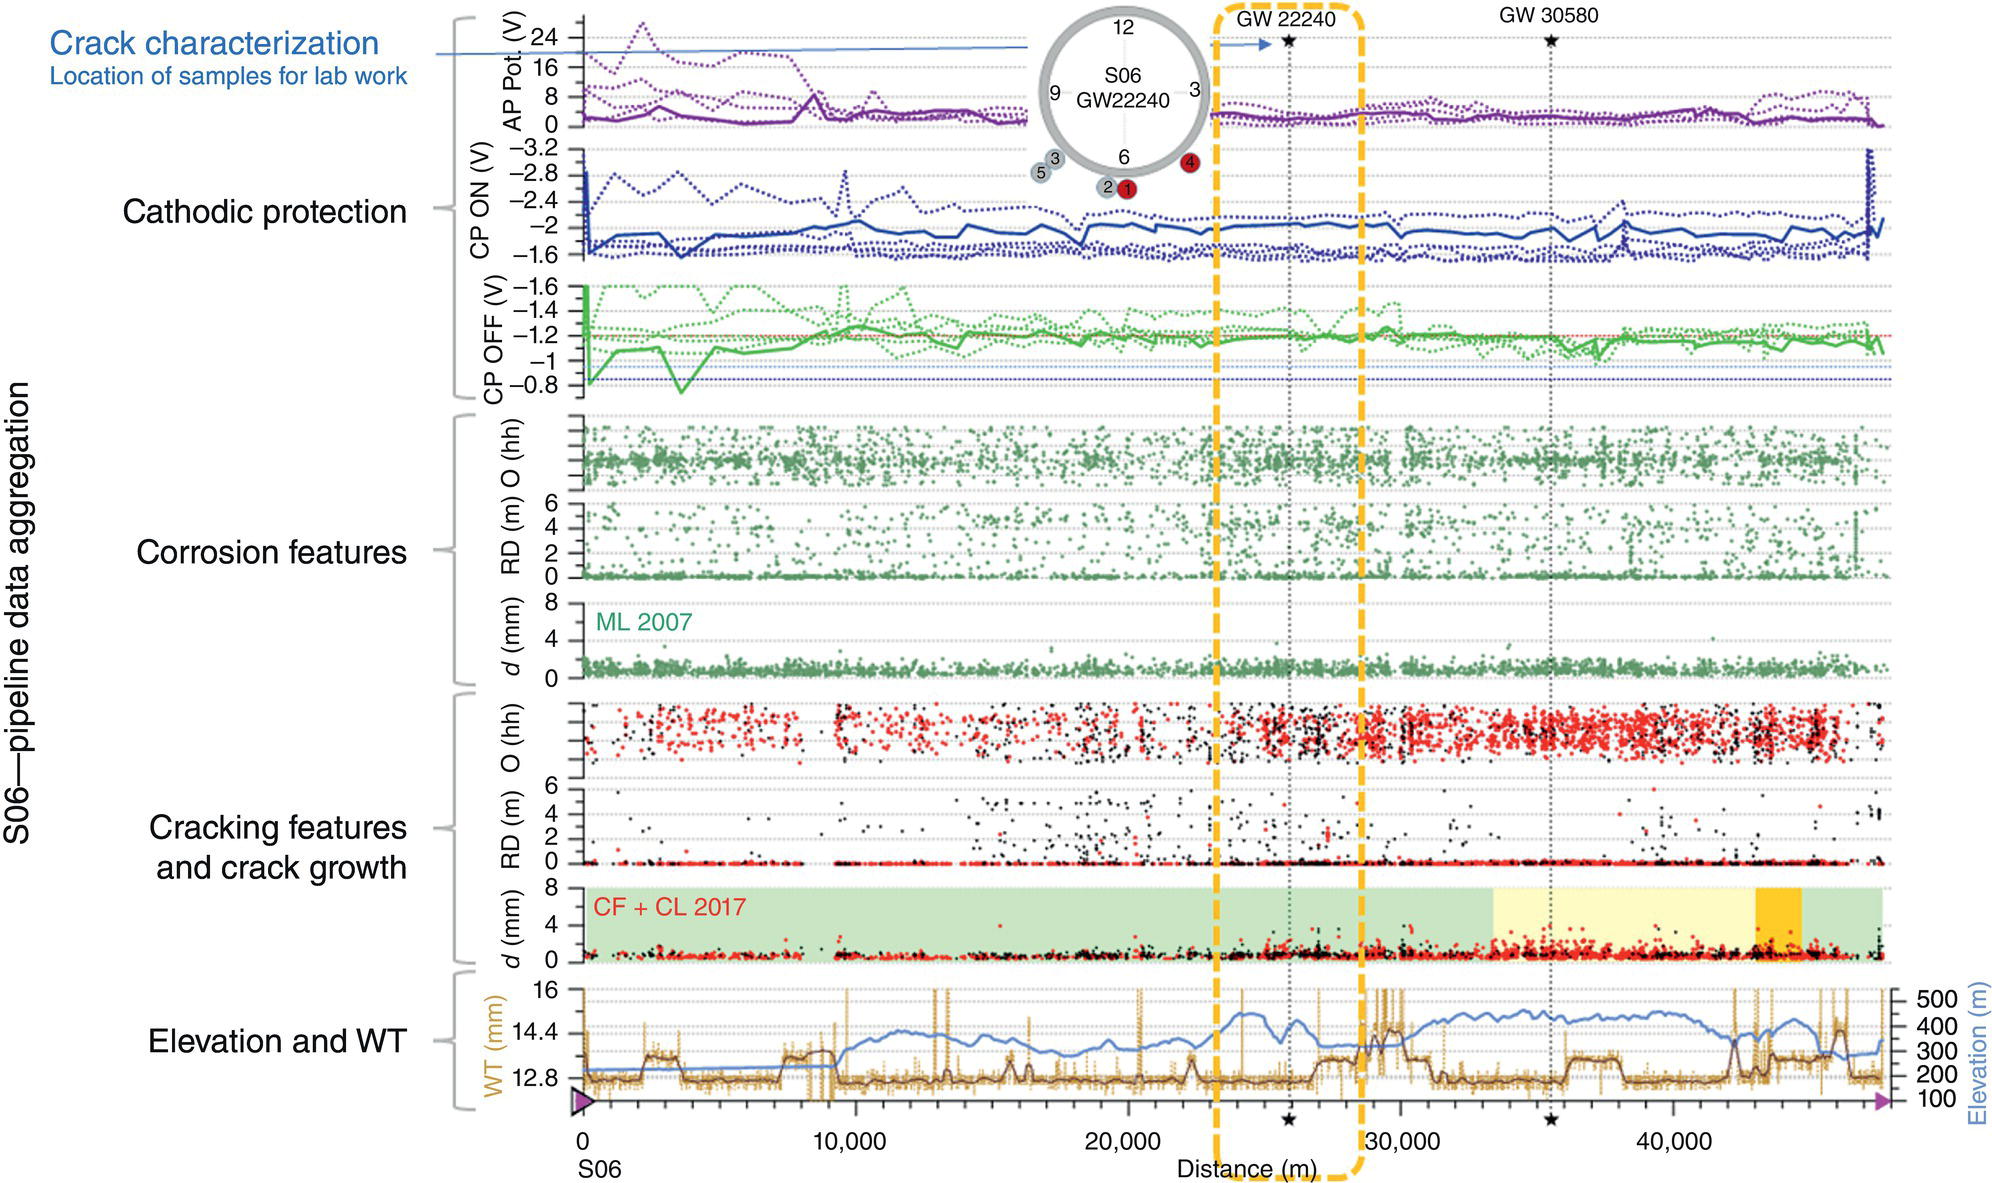
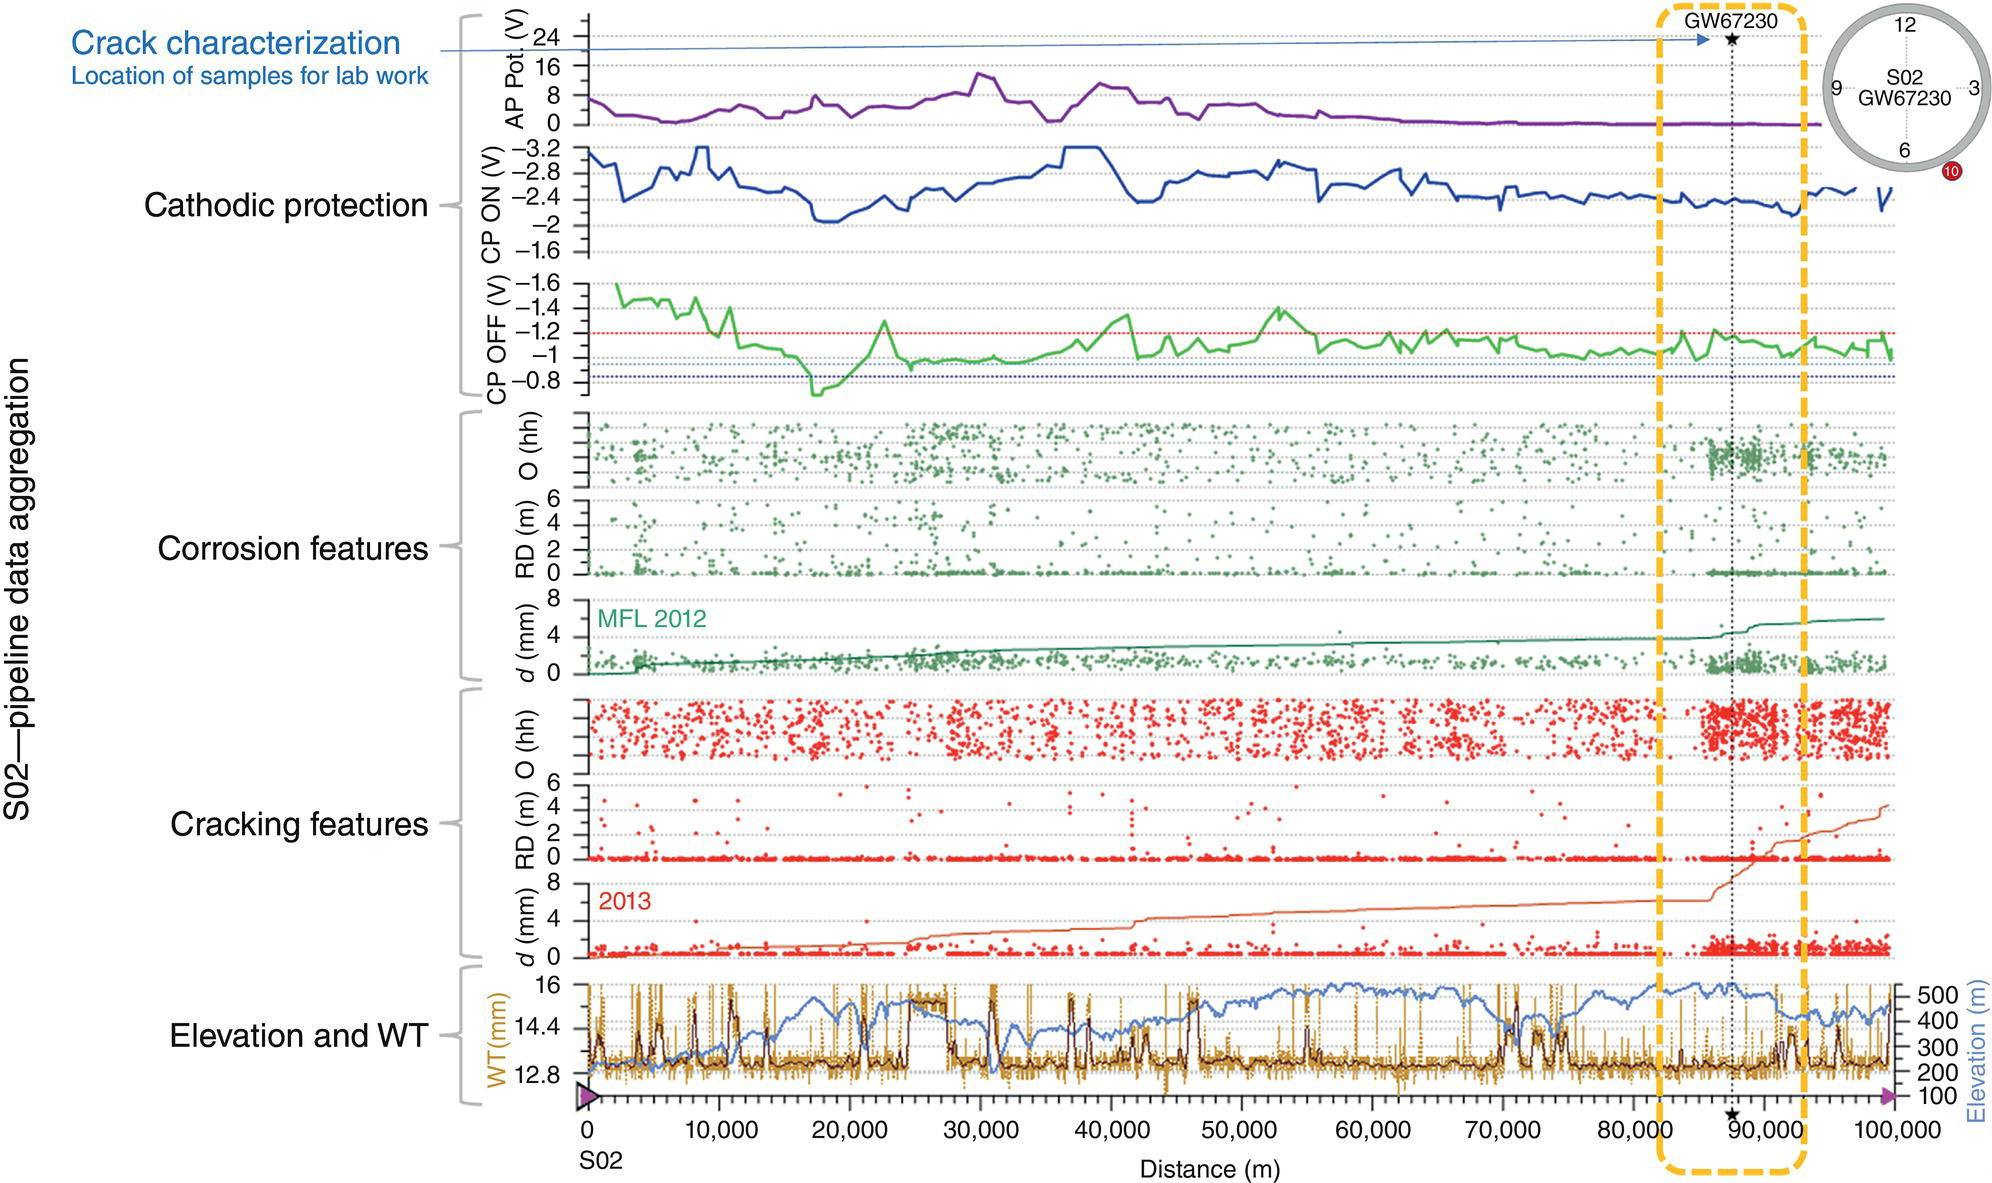
70.4.2 Refined Products Pipeline in the USA

70.4.3 Similar Cases in Literature
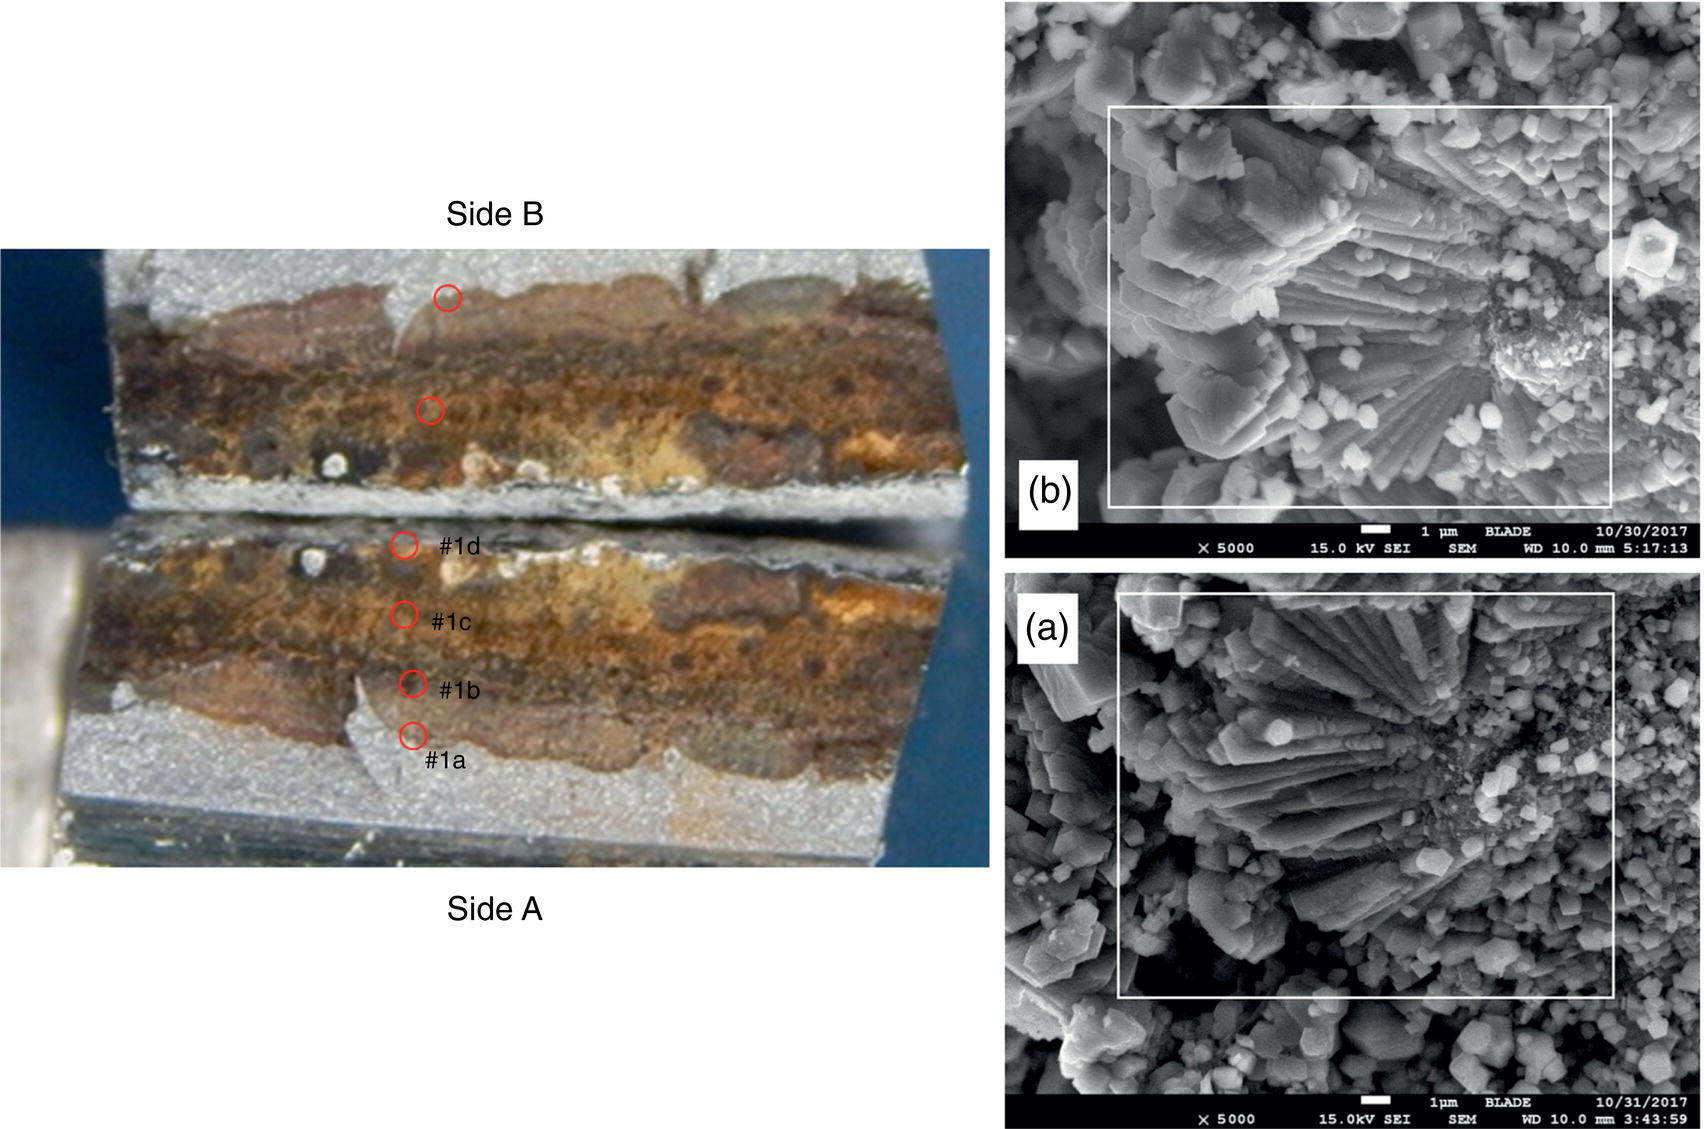
70.5 Effects of CP-Related Hydrogen on Other Types of Cracking
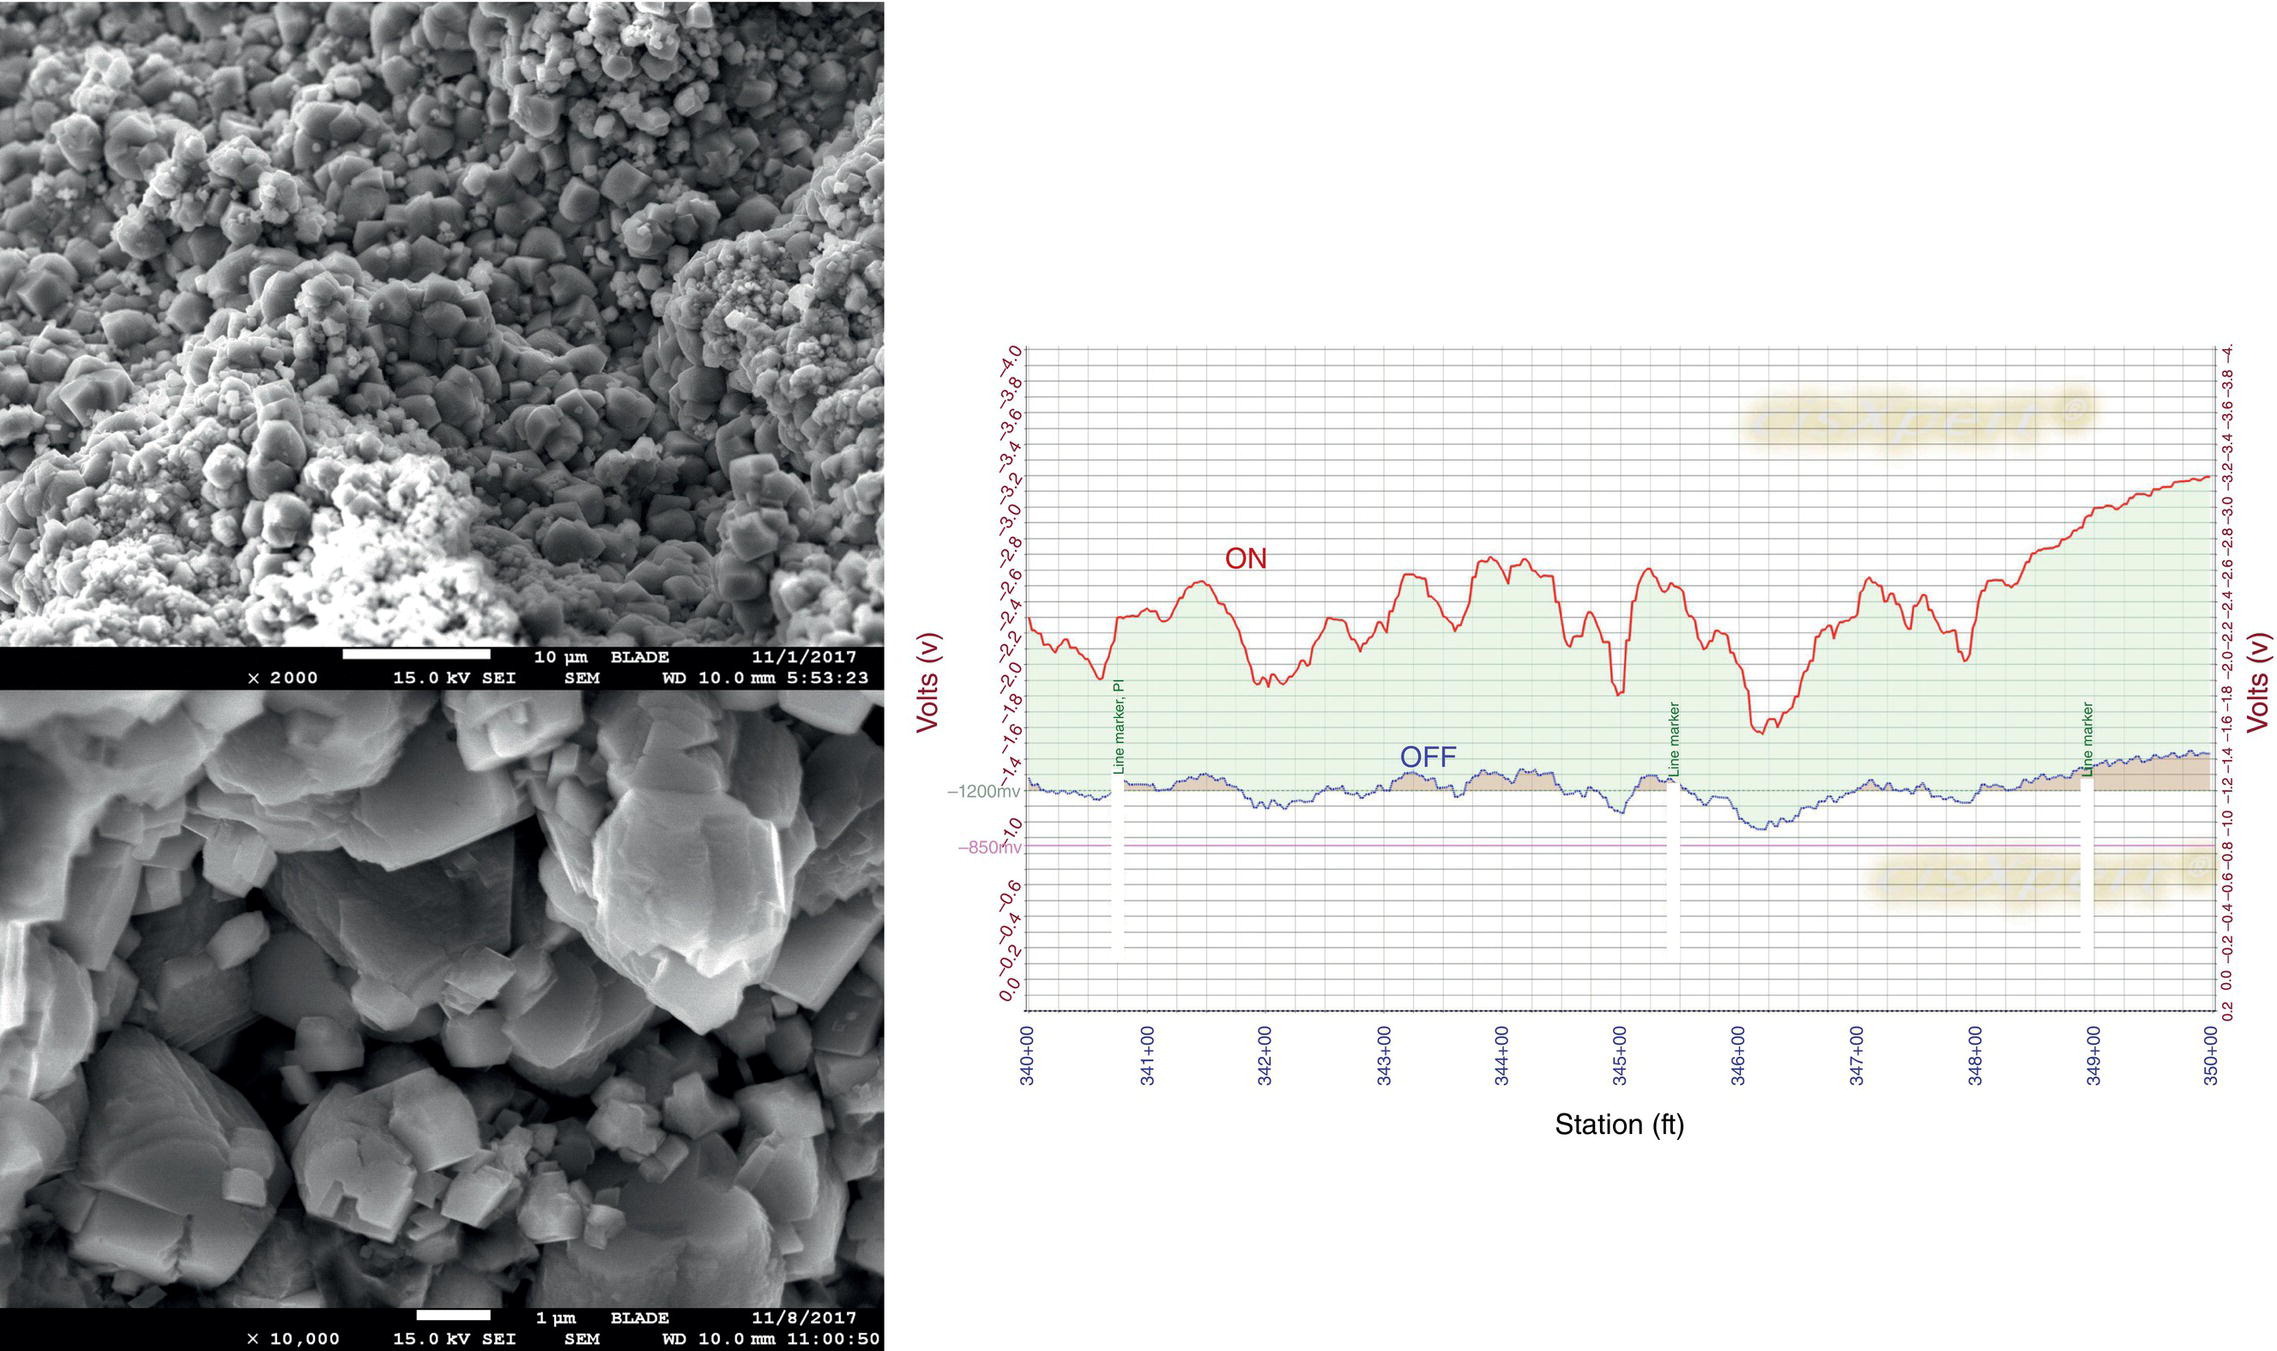
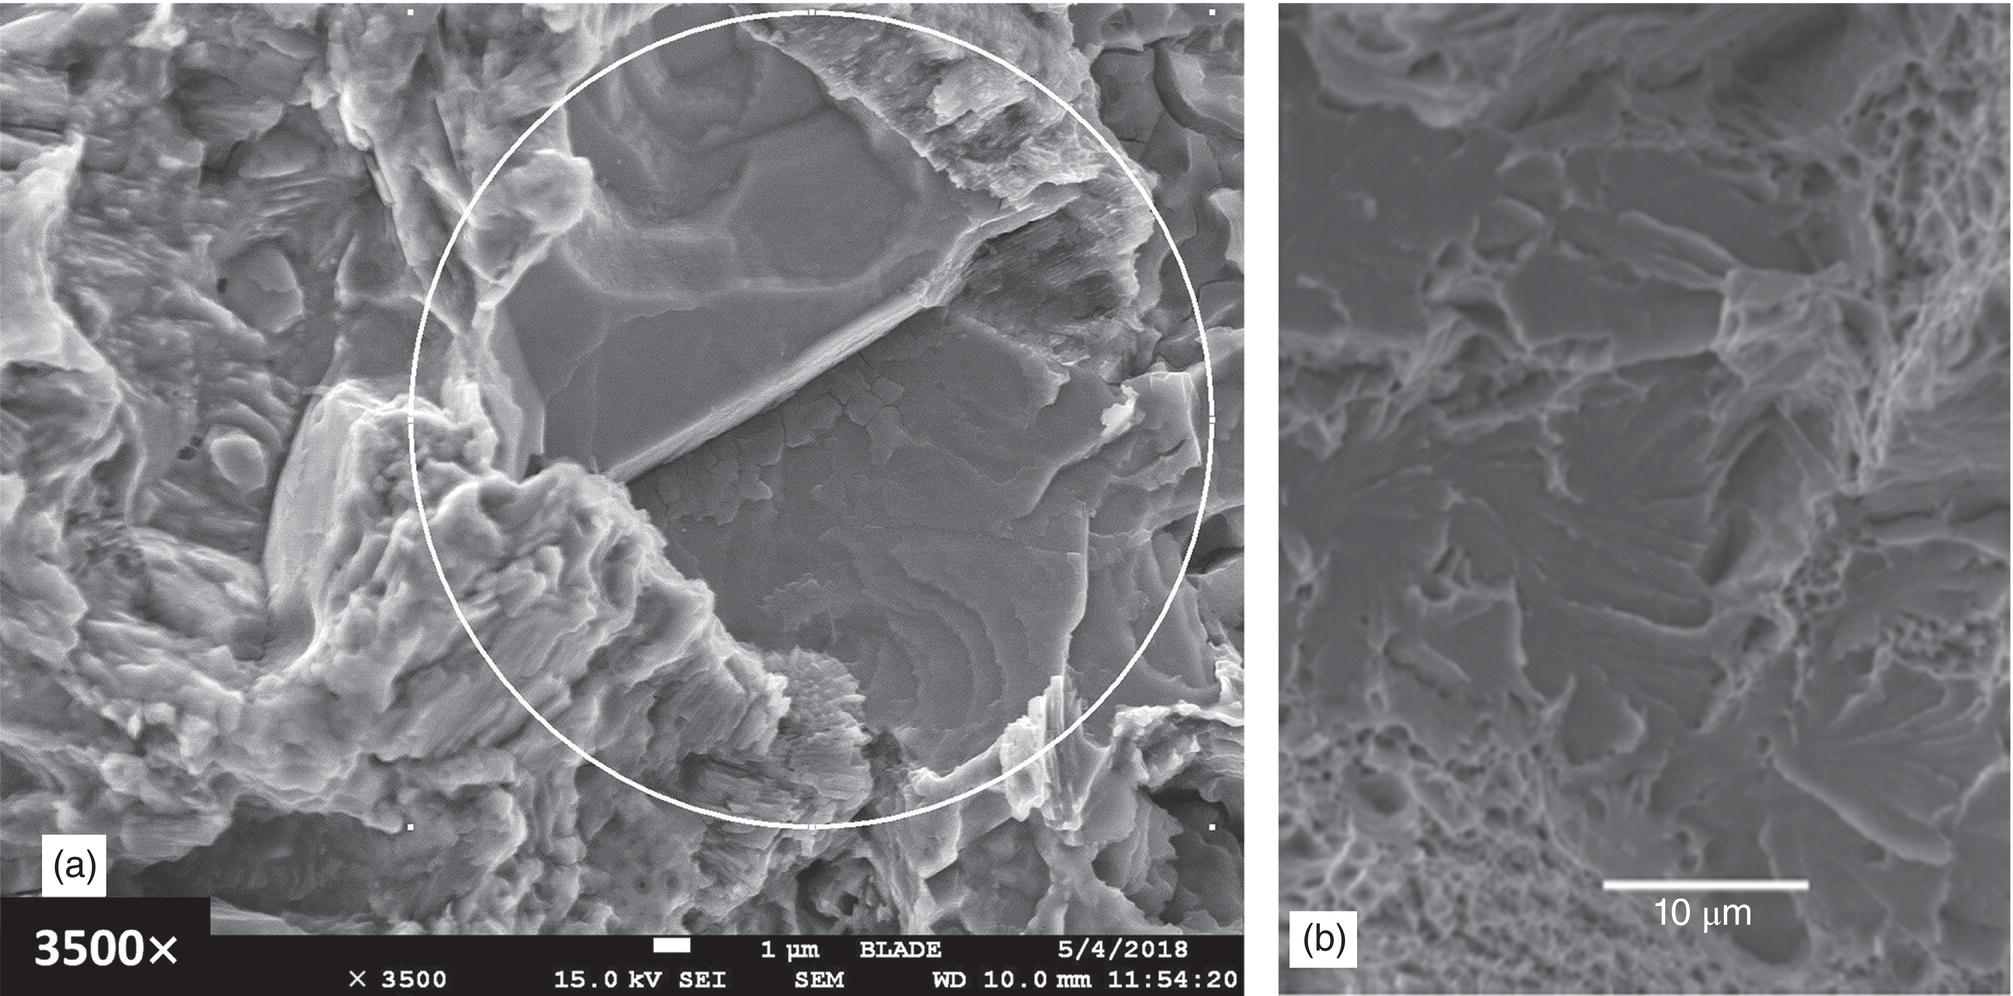
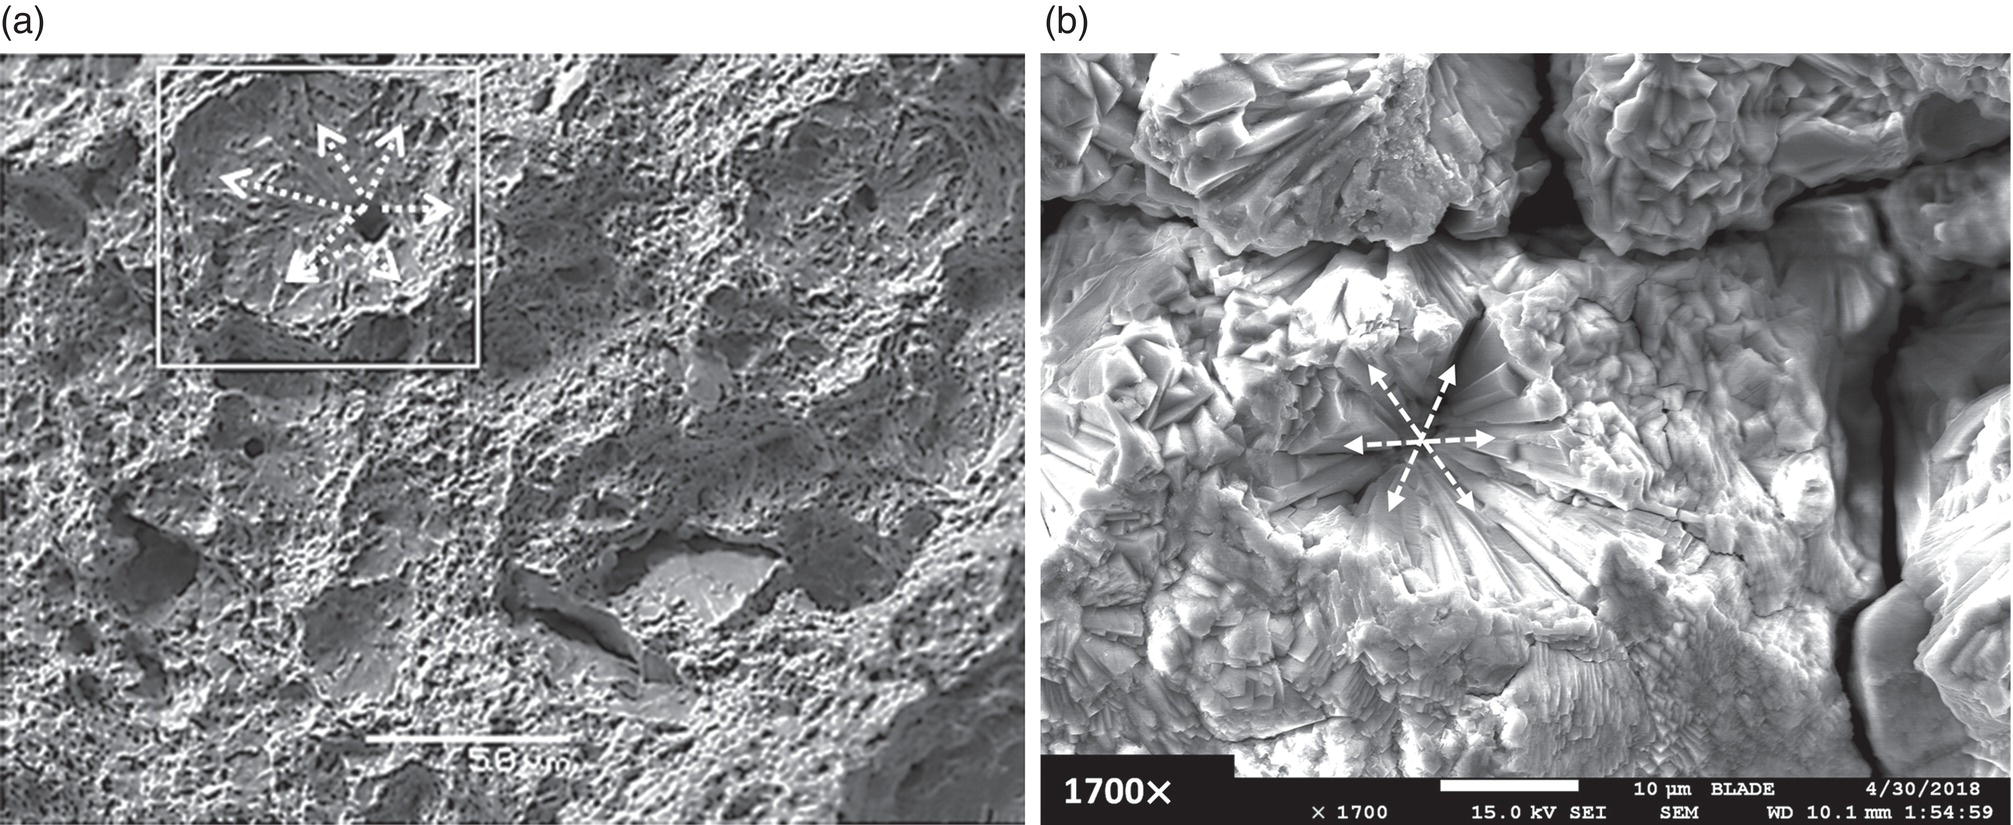
70.6 Mitigation Strategies
70.7 Closing Remarks
References
Note