Neb I. Uzelac Neb Uzelac Consulting Inc., Toronto, Ontario, Canada In-line inspection (ILI, also known as smart or intelligent pigging) has become an indispensable tool in pipeline integrity management, to establish the actual condition of the pipeline. The term “ILI” pertains to running devices equipped with some form of nondestructive testing (NDT) technology through the interior of pipelines to detect various types of defects and anomalies. In most applications, ILI tools are autonomous, free swimming devices that are propelled through pipelines by the flow of the fluid, and there is no external influencing the operation, controls, processing, and recording. Exceptions are tethered tools, typically for shorter pipeline sections and sections out of service, ILI tools that are connected by an umbilical with control and data storage done online from the outside. Intelligent pigging started in the late 1960s when the first tools aimed at detecting corrosion, utilizing magnetism, were developed. ILI has evolved in the meantime with additional types of tools, their wider applicability and improved reliability, accompanied by an overall increase in acceptance within the industry. This chapter introduces ILI in general terms, its place within pipeline integrity management, describes running tools, gives a nomenclature of tools based on their inspection purpose, and discusses verification and usage of ILI data. Since ILI has been introduced and increasingly in the recent years, there have been many contributions and case studies presented at industry conferences and in journals with a wealth of information pertaining to ILI methods, performance, specifics, limitations, and altogether very helpful when one is addressing ILI-related issues. A list of conferences and journals that cover the topics is given in the “Bibliography” section. Knowing the condition of a pipeline is an essential prerequisite for being able to devise an appropriate set of measures and activities to manage its integrity. There are numerous parameters defining the condition of a pipeline, most notably changes to its original, if known, state. Those range from precise pipeline route, changes to it due to unforeseen causes, mechanical damage such as dents, corrosion, or other types of metal loss, and cracks, all of which can develop over the lifetime of a pipeline. In addition, there could be defects that were present from laying of the pipeline unaccounted for that might develop over time and compromise its integrity, such as manufacturing and weld defects. Additionally, given the age of much of the pipeline network, there are pipelines for which there are not sufficient, incorrect, or no data at all. The fact that a buried pipeline is best accessible from the inside facilitated development of methods to look for increasingly many of potential flaws by having tools travel through the interior of the pipeline. This of course, providing that the pipeline is “piggable,” meaning that there are no obstacles for an ILI tool passing through it. Once a baseline inspection of a pipeline with clearly defined goals is performed, not only is its condition (presence of corrosion, cracks, etc.) captured in time, but repeating the inspections enables monitoring growth of detected defects allowing prioritization of mitigation measures and gauging their efficiency. ILI has been widely used throughout the world since the 1990s, and the first documents related to ILI were published by The European Pipeline Operators Forum (POF) in 1998, “Specifications and requirements for intelligent pig inspection of pipelines” [1], and NACE in 2000, “SOTA 35100, In-Line Nondestructive Inspection of Pipelines” [2], both since reissued. The goal of the latter document was to introduce existing ILI technologies and give an overview of the activities involved with running tools, both from an organizational and technical point of view. Since the introduction in the United States of Federal Rules for Pipeline Integrity Management in High Consequence Areas [3], the need arose for recommendations and more specific guidelines, also for utilizing ILI, and several documents were developed as a result: Running ILI tools is typically discussed between pipeline operators and ILI service providers ahead of the time to optimize the inspection. An indispensable step is filling out a pipeline questionnaire, a list of questions regarding characteristics of a pipeline section to be inspected, such that all potential restrictions can be identified on time and addressed. A sample questionnaire is included in Appendix 29.56.A.1 of this chapter. For an ILI to be successful, the following steps need to be fulfilled: Guidance in performing all of those steps is provided in the above listed standards [5–7]. Goal and objectives of an inspection have to be analyzed and matched with capabilities of ILI technologies regarding their ability to detect, locate, identify, and size defects adequately well to match the purpose of inspection and intended defect assessment methods. API 1163 provides guidance in understanding tool performance and how it should be specified, presented, and verified [5]. Chosen ILI tool has to be able to match the characteristics of the pipeline (see pipeline questionnaire in Appendix 29.A.1), its diameter, wall thickness, type of welds, and to pass all physical restrictions that might exist in the pipeline: valves, bends, tees, off-takes, river crossings (change of wall thickness and, hence, ID), and so on. In addition, the type of fluid has to be considered, its chemical suitability (aggressiveness), but also as operation of some of the technologies depend on type of liquid, cleanliness (generally, debris impacts operation of all ILI tools), speed of inspection controlled by flow of fluid, as for each ILI technology there is an optimal range, and so on. Majority of ILI runs are performed in operating pipelines, to minimize disruption, but there is also the option of using tethered tools and crawler devices for those that are not. Running those tools is different, but all that will be said in the section on ILI tool technologies and their performance will still apply, provided that they can be applied in that configuration and regime of operation. Launchers and receivers, additions to a pipeline section through which tools are inserted and retrieved from the pipe, have to fulfill certain requirements regarding configuration and size, depending on size and type (liquids or gas) of the pipeline, and ILI tool type. There are also elaborate procedures to make sure that launching and receiving are made safely (e.g., explosion protection) and effectively, all of which have to be covered in operational procedures [6]. Performing a successful ILI run, after having considered characteristics of the pipeline section and compatibility of ILI tools, entails a range of activities that have to be well planned and executed. It is a joint effort by the pipeline operator and the ILI service provider and involves activities from launching the tool, its tracking, controlling the inspection speed, and receiving the tool [5–7]. Each run is specific, and it is essential that the operator and the ILI provider discuss all the necessary steps before the run, as described earlier. ILI tools can be categorized based on the main purpose of inspection, and further breakdown is based on underlying basic principles of operation, which in turn define their characteristics and limitations. ILI has started its foray into mainstream pipeline integrity management in the 1990s. Originally, tools were used for looking at corrosion and deformation, but there has been an evolution of ILI technologies in both looking at different types of features and improving detection, identification, and sizing capabilities. With it came a higher level of understanding and acceptance within the industry, but also more stringent demands on performance and an improved set of requirements to define the performance. POF, The European Pipeline Operators Forum, started in the late 1990s, to work on “Specifications and requirements for intelligent pig inspection of pipelines” [1], suggesting what needed to be included in ILI reports. Very importantly, they introduced the concepts of: These characterizations have been accepted, and ILI technologies and tools have been characterized by following those guidelines. Each of the ILI service provider companies (pigging vendors) describes the performance of their tools by ILI technologies using those qualifiers in their performance specifications. In addition, for each of the ILI tools, there will be a tool specification listing its physical and operational characteristics [1, 5]. This section describes ILI technologies and divides them into general categories based on the main purpose of inspection. There might be an overlap in detection capabilities, for example, a corrosion detection tool may be able to detect dents, but the tool technologies will be organized by their primary purpose. Bidirectional tools: by and large, ILI tools are deployed to go with the flow in pipelines, from launcher to receiver, moved by pressure differential building on their cups, designed to withstand pressure from the back. In some cases, however, tools have to be able to move in both directions (bidirectionally), if there are no receivers, for example, so they have to be configured accordingly. Geometry tools, also known as deformation or caliper tools, measure the bore of the pipe and so can detect deviations from its nominal, circular shape such as ovalities, dents, and wrinkles. Typical applications for geometry tools are: These tools utilize mechanical arms, electromagnetic methods, or both, with the mechanical geometry tool, being prevalent in the industry. Mechanical arms are mounted on the tool body with their free end sliding along the internal surface of the pipe wall as the tool moves through the pipeline. There are different configurations of mechanical arms, some have wheels at the end, and some are mounted underneath cups; see Figure 29.1. The number of mechanical arms defines the circumferential resolution and the sensitivity to the angle of deflection the accuracy with which the deformations are being recorded. Each arm has to be recorded individually for circumferential position of deformations to be revealed. Those tools generally have the highest collapsibility of all ILI tools, such that they can be used to verify passage for other, more complex, tools. Figure 29.1 Geometry tools. Mechanical: (a) Baker Hughes [8]. (Courtesy of Baker Hughes Company.) (b) LIN SCAN [9]. (Courtesy of LIN SCAN.) Electronic: (c) ROSEN (Reference [10]/with permission of ROSEN Group); and combined mechanical and electronic: (d) ROSEN. (Reference [10].) There are also tools based on eddy current and tools combining mechanical and electronic (eddy current) method for increased accuracy; see Figure 29.1. Geometry tools can be used to detect deviations from the circular internal shape of the pipe such as These tools can be operated Mapping tools are used for mapping pipelines, that is, running them enables establishing accurate centerlines of pipelines in geographic information system (GIS) coordinates and generating precise pipeline route documentation. Mapping or inertial guidance tools use gyroscopes and accelerometers to detect changes in movement as the tool travels through the pipeline. It is necessary to know the spatial location for the starting and finishing points (launchers and receivers) and the tool will map the pipeline route in between. As these tools typically have a time-dependent drift, it is important to set intermediate reference points for correcting the ensuing error. The spatial locations of starting, ending, and the reference points are best established using GPS systems, such that the resulting data for the location of the pipeline can be achieved with high accuracy; see Figure 29.2. Above ground markers (AGMs) that sense passage of ILI tools are positioned at those reference points, and their exact GIS position is subsequently correlated with the ILI tool’s distance recording. These tools are used for mapping of newly laid pipelines or pipelines for which there is no proper documentation. They are also used to detect movement of pipe, like after landslides or earthquakes, if information exists about the pipeline route from before the event to which the results of mapping run can be compared. The results allow for calculating large-scale stresses that the pipeline is submitted to by being moved. Figure 29.2 Mapping tool’s inherent drift is corrected using reference points provided with high accuracy GPS location. Tools record the route of the pipeline and yield the location of the centerline of the pipeline in GIS coordinates, that is, longitude, latitude, and elevation, including locations of girth welds. The established route of a pipeline can be used for tying in all relevant pipeline information into a database, and overlaying of mapping results over areal pictures and maps provides an enhanced overview of the pipeline systems. Metal loss tools, also called corrosion tools, are the most widely used application of ILI. They are used to detect and size internal and external metal loss in the pipe wall, as caused, for example, by corrosion, erosion, or third-party damage. Precise locating and sizing of metal loss allows for estimating the pressure carrying capacity of the pipe diminished by the reduced wall thickness enabling prioritizing of maintenance and repair measures. There are different mechanisms causing metal loss in pipeline wall, resulting in different shapes, locations, and sizes. The principle of operation and configuration of ILI tools for metal loss detection will affect their suitability to detect, identify, and size different types of metal loss, and thus affecting the associated POD, POI, and sizing capabilities. It is important to understand the NDT technologies that the tools utilize to be able to assess their performance on different types of metal loss defects. When this technology was started in the 1960s, it was the very first to be applied for ILI inspection for metal loss, and it is still the most widely used. Pipeline wall is magnetized such that there is a uniform distribution of magnetic flux in the ferromagnetic steel, which will be disturbed if there are changes in the cross section of the pipe wall in the direction of magnetization, such as caused by metal loss; see Figure 29.3. MFL tools carry strong permanent magnets configured to magnetize the pipe wall to saturation, such that each reduction in the cross section of the pipe wall, as is the case with metal loss, will cause magnetic flux to “leak” or spread outside of the pipe wall. This flux leakage will be detected by sensors mounted on the tool sliding along the interior pipe wall and will provide the basis for estimating the amount of missing metal (metal loss). Hall element sensors are typically used for measuring the magnitude of flux leakage; in older tools, coils were used. The number of sensors around the circumference of the pipe defines circumferential resolution and the sampling distance as the tool moves, the axial resolution of the tools, both affecting the type and minimum size of detectable features. Even though the principle is the same, there are different designs and implementations of MFL, which all affect operational characteristics and inspection performance of the tools. Also, additional sensors are required to distinguish between external and internal defect location (ID/OD discrimination) in most cases mounted on a separate tool body, trailing the main magnetizing unit. Figure 29.4 shows some of the tools. Figure 29.3 Simplified schematics of axial pipe magnetization in which a sensor at the internal surface of the pipe detects magnetic flux leakage associated with internal and external metal loss. (Reference [11]/with permission of ROSEN Group.) Figure 29.4 MFL metal loss tools: (a) LIN SCAN [9]. (Courtesy of LIN SCAN.) (b) ROSEN [10]. (Courtesy of ROSEN Group.) (c) GE PII [12]. (Courtesy of General Electric.) (d) Baker Hughes [8]. (Courtesy of Baker Hughes Company.) Each metal loss type and its geometry will generate a specific pattern of flux leakage, and after an inspection run, the shape of recorded flux leakage will be analyzed to infer the metal loss that caused it. Over the decades of utilizing this technology, algorithms have been developed and expertise built up to improve detection and sizing capabilities of this technology. Because of differences in the ways that the tools are built that influence their mechanical performance and detection capabilities, labels “low” and “high resolution” have historically been used to denote their capabilities. It is, however, prudent to look at tool specifications rather than relying on such vague terms when looking for the right tool for one’s application. MFL metal loss tools typically magnetize the pipe in axial direction, but there are also some that magnetize it in circumferential and recently also helical direction; see next section. Both these versions were devised to overcome the difficulty with detecting and characterizing defects that are narrow in the direction of magnetization, like narrow axial defects for an axially magnetizing tool. Types of detectable features: MFL ILI tools are primarily geared toward detecting internal and external metal loss, such as The technology will also detect Note: As with any ILI technology, POD, POI, and sizing capabilities have to be looked at for individual tool configurations and regarding specific types of defects. General performance characteristics: Note: Generally, cleanliness is required for any ILI, some more than others, but it needs to be strived for! In the second half of the 1990s, tools came out with MFL applied circumferentially (transverse field, or transverse magnetization) to inspect for narrow axially oriented defects, in most cases associated with long seam welds in pipelines. Axially magnetizing MFL, as used in metal loss tools, is less effective on longitudinally oriented very narrow metal loss as they do not obstruct axial flux sufficiently for reliable detection and sizing; see the illustration of the effect that shape of defects has on MFL in Figure 29.5. But if the magnetization is oriented circumferentially, long and narrow axially oriented defects will present themselves as more of an obstacle and enhance flux leakage; see Figure 29.6. Similar results were also reported for helical magnetization, where the field is oriented spirally. Magnetizing the pipe circumferentially results in different levels of magnetization compared with axial MFL and as such has some attributes that make it different in performance, not just the types of defects that can be detected. There are also several configurations of magnetizers on tools presently available, each of which has its own performance characteristics. Types of detectable features: General performance characteristics: Figure 29.5 Narrow defects aligned (a) with the direction of magnetization do not disrupt flux leakage as much as those oriented perpendicularly (b). Figure 29.6 Circumferential pipe magnetization in which a sensor inside the internal surface of the pipe detects magnetic flux leakage associated with internal and external metal loss, including narrow axial defects such as axial crack-like defects. (Reference [11]/with permission of ROSEN Group.) Ultrasonic testing (UT) is the other major technology utilized for metal loss inspection. UT has been used in other NDT applications, but was not introduced to ILI until the late 1980s. UT is based on direct and linear wall thickness measurement, the same principle that is used in the manual (or automated) testing in-the-ditch. Ultrasonic piezoelectric transducers are mounted on a sensor carrier perpendicularly to the wall emitting pulses and recording incoming reflections (pulse-echo) (Figure 29.7). By timing the reflections from the inner and outer surfaces of the pipe wall (time of flight) and knowing the speed of sound in the coupling medium and the pipe steel, the distance of the transducer to the inner surface of the pipe wall and the wall thickness can be deduced. Deploying a sufficient number of transducers to cover the full circumference of the pipe and timing the measurement of each transducer as it moves down the pipeline, the tool yields a grid of wall thickness measurements with an axial resolution defined by the shot-to-shot distance and circumferential resolution given by (circumferential) sensor to sensor distance. Figure 29.8 illustrates UT transducers deployed on a sensor carrier of a UT metal loss tool, and Figure 29.9 shows pictures of some of the tools. This method requires the transducers (sensors), and by extension the tool, to be immersed in a homogeneous liquid with suitable ultrasonic properties for this type of measurement, as most of the light and heavy crude oils and refined products being pumped in liquids lines are. Figure 29.7 Ultrasonic wall thickness measurement, principle of operation of UT metal loss tools. Figure 29.8 UT transducers uniformly deployed to cover the full circumference of the pipe wall and measure metal loss. Types of detectable features: UT metal loss tools detect changes in the pipe wall thickness and so detect external and internal metal loss, such as: The technology will also detect Note: As with any ILI technology, specific POD, POI, and sizing capabilities have to be looked at for individual tool configurations and regarding specific types of defects. For example, feasibility of detecting small pits will depend on the spatial resolution of UT sensors and might or might not be available in a specific pipe size. General performance characteristics: Cracks in pipelines have been found to lead to ruptures and are among the most difficult types of defects to detect and even more difficult to size. The awareness about cracks in pipelines got a boost in Canada after the National Energy Board (NEB) Public Inquiry in 1996, prompted by several pipeline ruptures, and it was not until the early 2000s that the operators and regulators in the United States started openly talking about cracks, especially stress corrosion cracking (SCC). Figure 29.9 UT metal loss tools: (a) NDT Global. (Courtesy of NDT Global [14].) (b) Baker Hughes. (Reference [8]/with permission of Baker Hughes Company.) (c) LIN SCAN. (Courtesy of LIN SCAN [9].) Generally, cracks, even very tight ones, cause strong reflections for ultrasound hitting them perpendicularly, but the questions is how to get an ultrasound pulse propagating circumferentially in a pipe wall. In the late 1980s, an approach was tried with liquid filled wheels providing coupling between the UT transducers and pipe wall in gas pipelines. In 1995, a liquid-coupled tool was brought to the market and has remained the most reliable and accurate crack detection tool for liquids pipelines [13]. In the late 1990s, electromagnetic acoustic transducers (EMATs) were first introduced and continue to evolve as the method of choice for crack detection in gas pipelines. As cracks and crack-like defects have huge impact on pipeline integrity, other methods have also been tried to detect them, most notably using circumferential MFL, which, however, has not shown much success on tight cracks. Since the introduction of all the technologies, there have been many inspections and also publications of tool performances and case studies reported at major industry conferences and in pipeline journals; see the “Bibliography” section. Liquid-coupled ultrasonic crack detection is based on reflection of ultrasound from the corner of the crack and surface of the pipe wall (corner reflection). Piezoelectric transducers are mounted on a sensor carrier of the ILI tool oriented at an angle to the surface of the pipe, such that, based on the differences in propagation speed of ultrasound in the liquid filling the interior of the pipeline and the pipe wall (Snell’s law), a shear wave propagating under 45° in the pipe wall is generated (Figure 29.10). Similarly, to UT wall thickness measurement, pulse-echo method is being utilized where reflections are timed to derive location of reflectors, internal, external, and midwall. Since, due to hoop stress in pipelines, the prevailing orientation of cracking is axial, the first tools developed to use this technology were for detecting axial cracks and hence the propagation of ultrasound was set to be circumferential; see Figure 29.11a depicting a sensor carrier of a liquid-coupled UT crack detection tools aimed at axial cracks. Types of detectable features: Figure 29.10 Principle of operation of a liquid-coupled ultrasonic crack detection tool. Figure 29.11 Ultrasonic liquid-coupled crack detection sensor carriers for axial (a) and circumferential cracks (b). (Courtesy of NDT Global [14].) Figure 29.12 UT crack detection tools: (a) NDT Global [14]. (Courtesy of NDT Global.) (b) Baker Hughes. (Reference [8]/with permission of Baker Hughes Company.) (c) GE PII [12]. (Courtesy of General Electric.) Circumferentially or spirally oriented cracks can be detected as well, using this technology, but the sensor carrier has to be modified such that ultrasound propagates perpendicularly to the cracks; see Figure 29.12b. Other types of tight crack-like defects, like surface breaking laminations or stress-oriented hydrogen-induced cracking (SOHIC), can be detected with this technology too, but it is important to know their orientation to configure the sensor carrier, i.e., mount UT transducers accordingly. Tools configured for axial crack detection are shown in Figure 29.12. General performance characteristics: Ultrasonic has established itself as the most reliable method for crack detection, but generating ultrasound on the tool requires a medium to couple ultrasonic energy into the wall. Electromagnetic Acoustic Transducers (EMAT) overcome this in that the ultrasound is generated in the pipe wall itself through electromagnetic interaction between the sensor on the tool and pipe wall. The sensor comprises a coil in a magnetic field where a pulsing current in the coil generates vibrations in the pipe wall generating ultrasound (Figure 29.13), utilizing magnetostriction or eddy current mechanisms. The configuration of the sensor, that is, the layout of the magnetic field, shape of the coil, and characteristics of the current, dictates which mode of ultrasound will be generated in the pipe wall, which in turn determines its suitability for crack detection. Generally, guided waves are generated to propagate circumferentially through the pipe wall, sensitive to axial cracks, and sensors are configured for detecting both ensuing reflection and transmission, see Figure 29.14. Types of detectable features: Tools presently on the market (some of them shown in Figure 29.15) utilize slightly different EMAT configurations, but are all geared toward detecting axial cracks and crack-like defects, such as SCC, fatigue cracks, and long seam-weld imperfections. Figure 29.13 EMAT principle of operation, generating ultrasound in pipe steel without liquid coupling. General performance characteristics: As mentioned earlier, ILI has evolved not only in performance of existing ILI technologies but also in the development of new applications and combination of existing ones. The performance of each of ILI technologies described so far has improved over the years, with advancements in mechanical and electronic engineering along with progress in capabilities of data processing, but also with increasing usage and expertise that come with it. The need for operational practicality and ability to build more into tools than previously possible have led ILI companies to combine different ILI technologies into their tools. The types of technologies that can be combined will depend on pipe size, section length, and types of restrictions present. Generally, the smaller the pipe diameter, the less space is available, and tools get longer, same with longer sections as additional batteries are needed to cover the energy consumption that increases accordingly. Most common combinations are Figure 29.14 EMAT sensors operating in reflection and transmission. (a) From Ref. [15]. (Published by ASME, reproduced with permission.) (b) From Ref. [16]. (Published by ASME, reproduced with permission.) Figure 29.15 EMAT tools. (a) (Reference [15]/with permission of The American Society of Mechanical Engineers.) (b) (Reference [16]/with permission of The American Society of Mechanical Engineers.) Figure 29.16 Drawing of a combination tool with MFL metal loss, geometry and mapping capabilities. MFL as it is used most commonly for metal loss inspection, namely saturating the pipe wall, is not sensitive to changes in material properties, for example, cold working after denting or gauging, as it is not to remnant magnetization. But if the magnetization of the pipe wall is far lower, changes in magnetic properties, caused by changes in material properties, start affecting magnetic flux leakage and recorded signals. By combining two unites with MFL on the same ILI tool, one saturating the wall of the pipe and the other not and combining the results, it is possible to deduce and detect parts in the pipe wall that have undergone cold working, or generally changes in material properties like mechanical damage caused by third parties; see example of such a tool in Figure 29.17. One of the recent additions to the family of ILI technologies is measurement of currents induced by cathodic protection systems to the pipeline. The tool measures the voltage drop in the pipe created by cathodic protection current the characteristics of which can be traced back to the condition of cathodic protection in effect. Figure 29.18 shows such a tool. ILI for leak detection has been considered for many years, but has never really been developed as a mainstream ILI application. Tools available in the market have, for the most part, utilized acoustic sensors to detect and locate the acoustic noise associated with the leaking fluid; see Figure 29.19. There have also been attempts to measure pressure differentials on tools as they pass by a leak [20]. Figure 29.17 Multiple data set MFL tool. (Reference [17]/with permission of NACE (National Association of Corrosion Engineers).) One of the main objectives of ILI is to obtain data for estimating the burst pressure of a pipeline containing defects. A successful inspection will detect anomalies above certain size, properly identify and size them, such that they can be fed into appropriate defect assessment algorithms. Since there are different types and levels of assessment algorithms, it is important to match their requirements with adequate ILI data. For example, an algorithm might require just the length and maximum depth of a defect, whereas another, more advanced, requires the knowledge of its profile. Therefore, the ILI technology utilized has to be capable of delivering that profile. Verifications of results from ILI are essential not only to confirm the findings but also to provide valuable feedback to ILI service providers, which helps them improve their tools and data analysis. The API 1163 standard [5] gives recommendations on conducting verifications. Figure 29.18 Tool for inspecting cathodic protection current and influences of external AC and DC current sources [21]. Figure 29.19 Leak detection tools: (a) Gottsberg leak detection. (Reference [19]/with permission of Gottsberg Leak Detection.) (b) (Reference [18]/with permission of Pure Technologies Ltd.) Versatility of information pertaining to a pipeline section or system calls for integrating it to maximize the insight into pipeline integrity issues. The information gained from ILI should be viewed in conjunction with all the other knowledge, such as information on soil, coating conditions, operational regime, to name just a few. As an example, when analyzing the distribution of corrosion in a section of a pipeline, it is essential to look at those facts to fully understand what caused the distribution to be like that which, in turn, will facilitate devising the most effective mitigation measures. 1 SP0102-2010/In-Line Inspection of Pipelines © NACE International 2010. All rights reserved by NACE. Reprinted with permission. NACE standards are revised periodically. Users are cautioned to obtain the latest edition; information in an outdated version of the standard may not be accurate. Note: These values are recorded for regular line conditions. Pressures and velocities vary during the pig run. Figure 29.A1 Plan view of a generic pig trap. Bibliography: Journals, Conferences and Other Sources with ILI Related Content
29
In-Line Inspection (ILI) (“Intelligent Pigging”)
29.1 Introduction
29.2 Place of ILI in Pipeline Integrity Management
29.3 Running ILI Tools
29.3.1 Tool Type Selection
29.3.2 Making Sure the Tool Fits the Pipeline
29.3.3 Conducting the Survey
29.4 Types of ILI Tools and Their Purpose
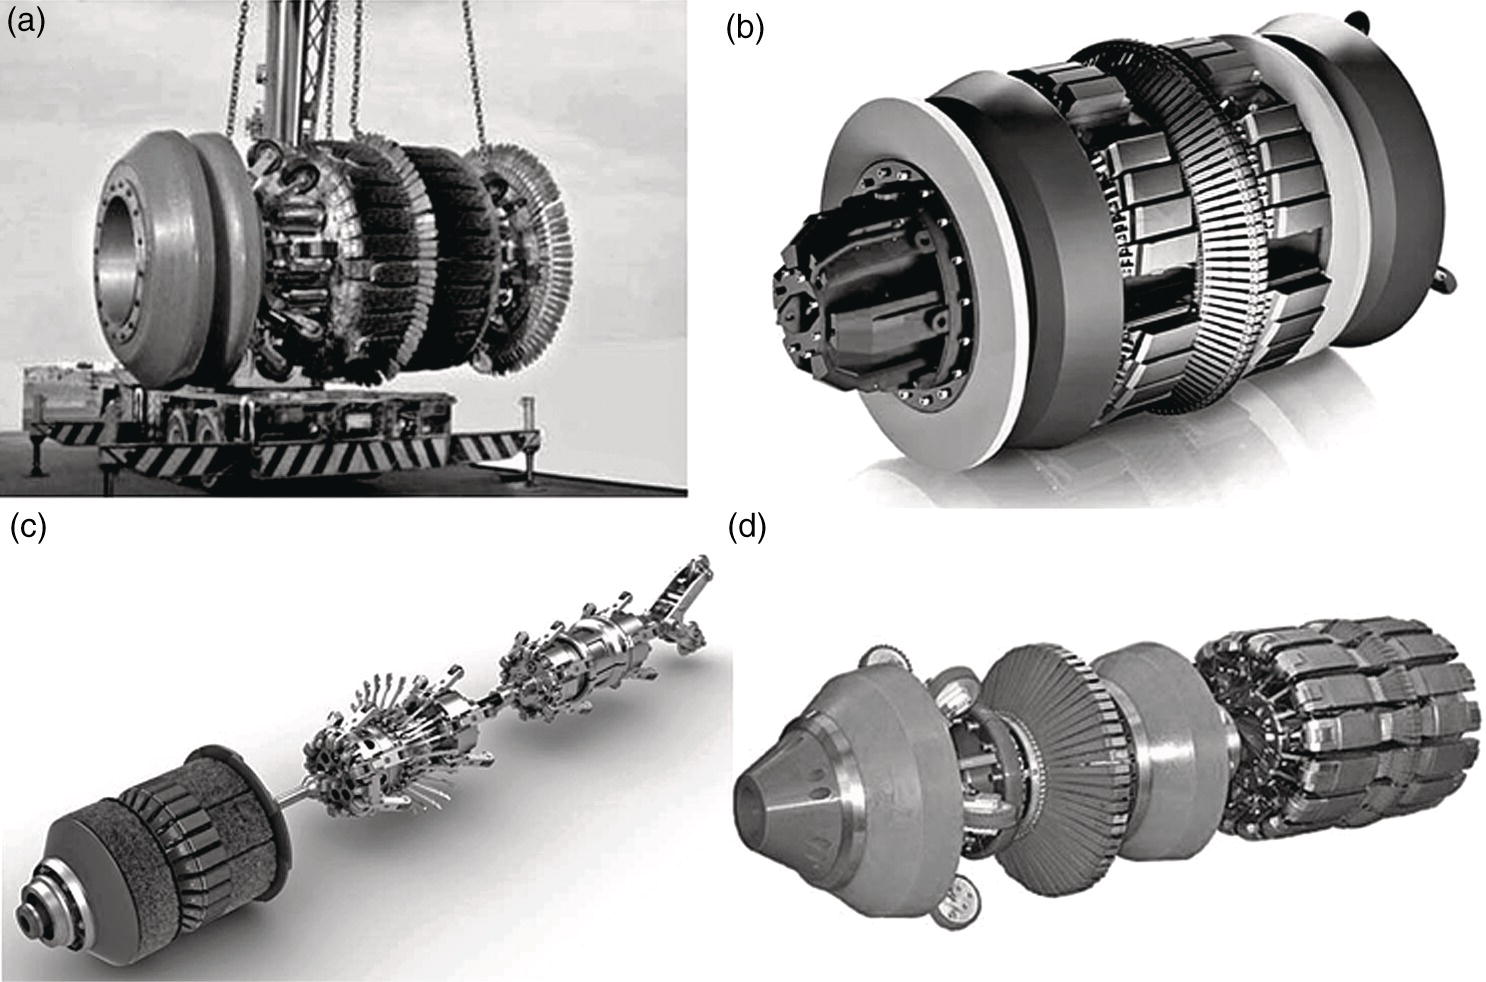
29.4.1 Geometry (Deformation) Tools
29.4.1.1 Principle of Operation

29.4.1.2 Types of Detectable Features
29.4.1.3 General Performance Characteristics
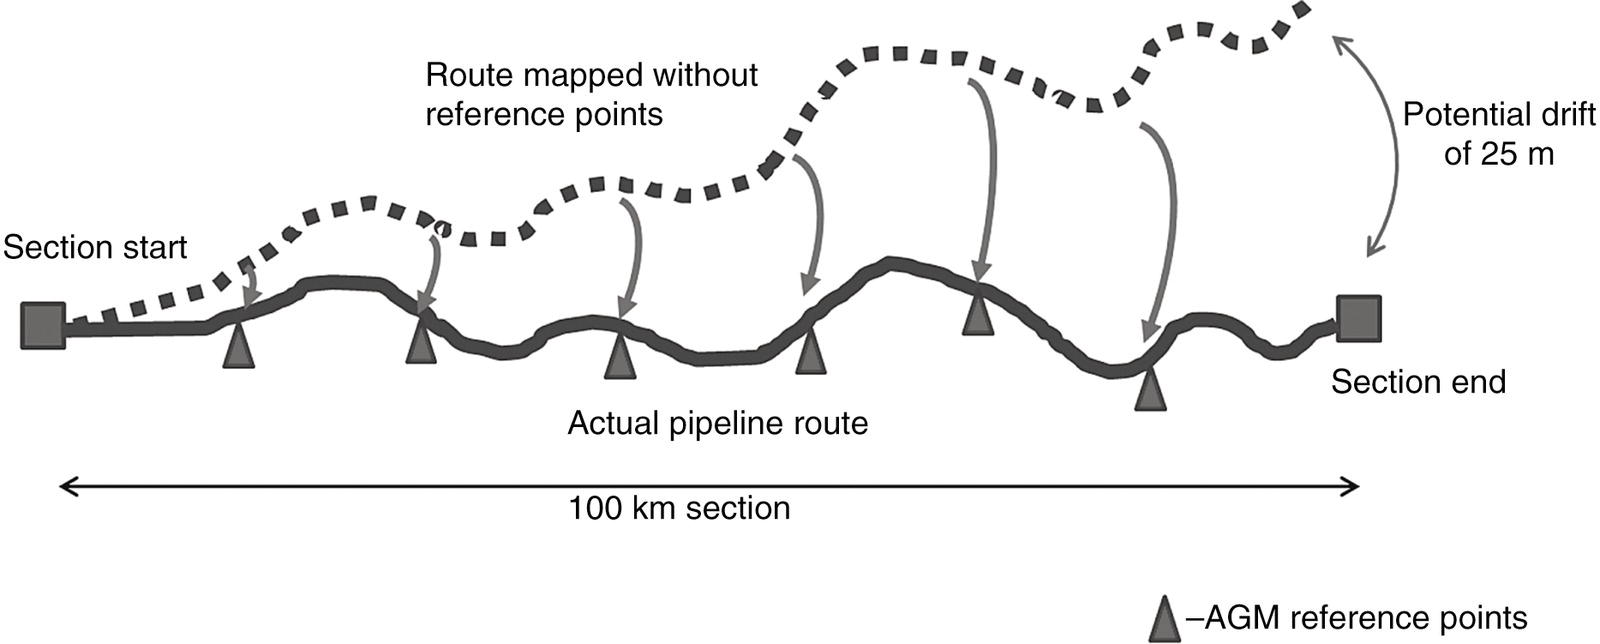
29.4.2 Mapping/GPS Tools
29.4.2.1 Principle of Operation
29.4.2.2 Types of Detectable Features
29.4.2.3 General Performance Characteristics
29.4.3 Metal Loss Tools
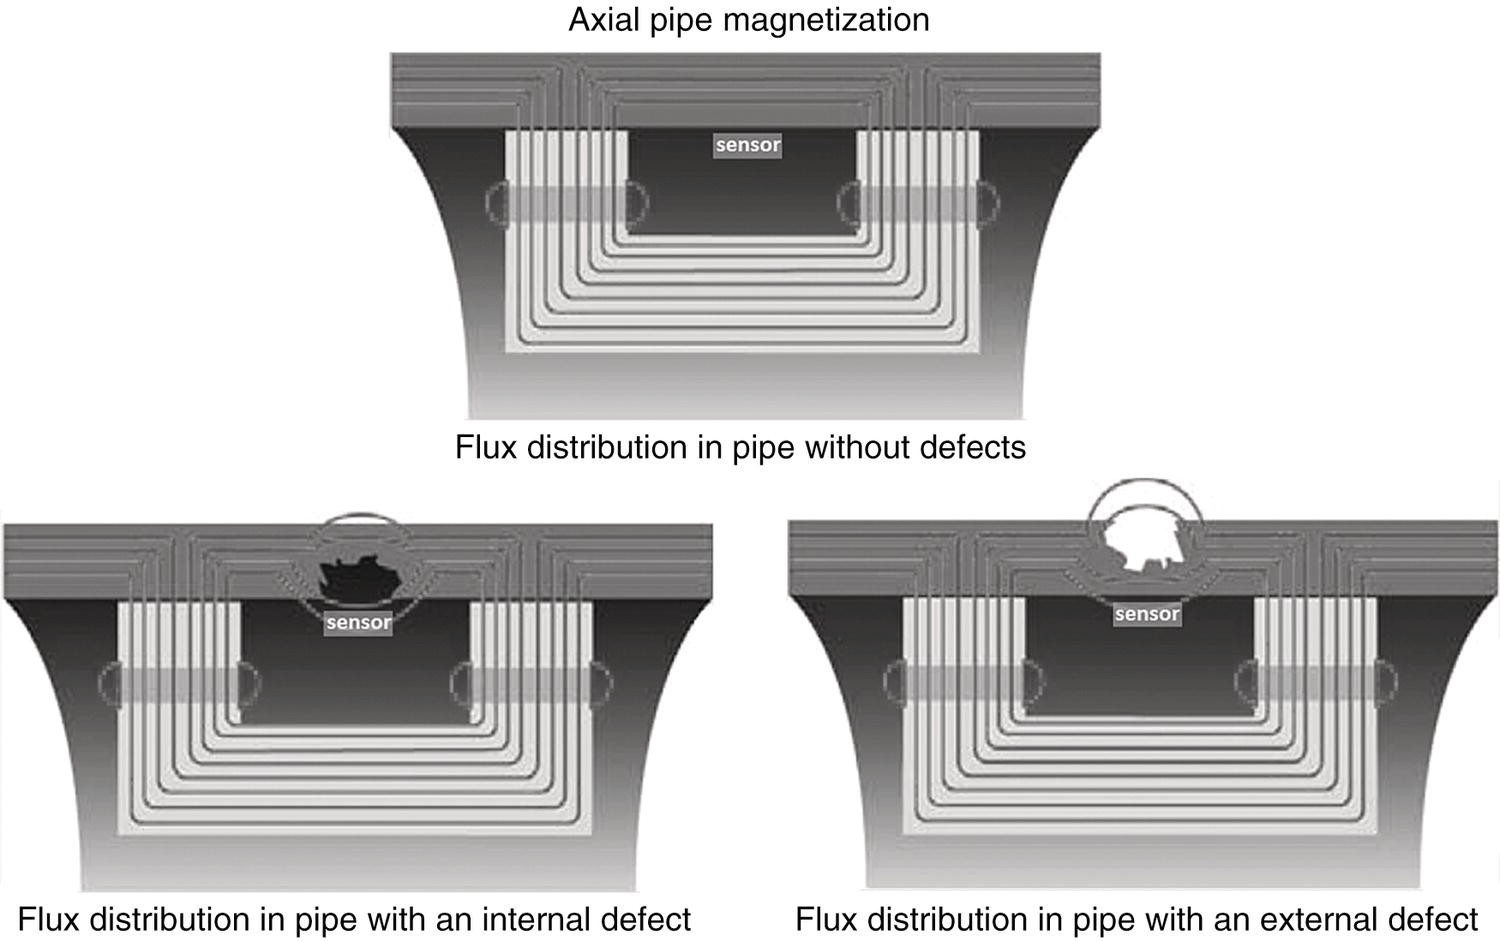
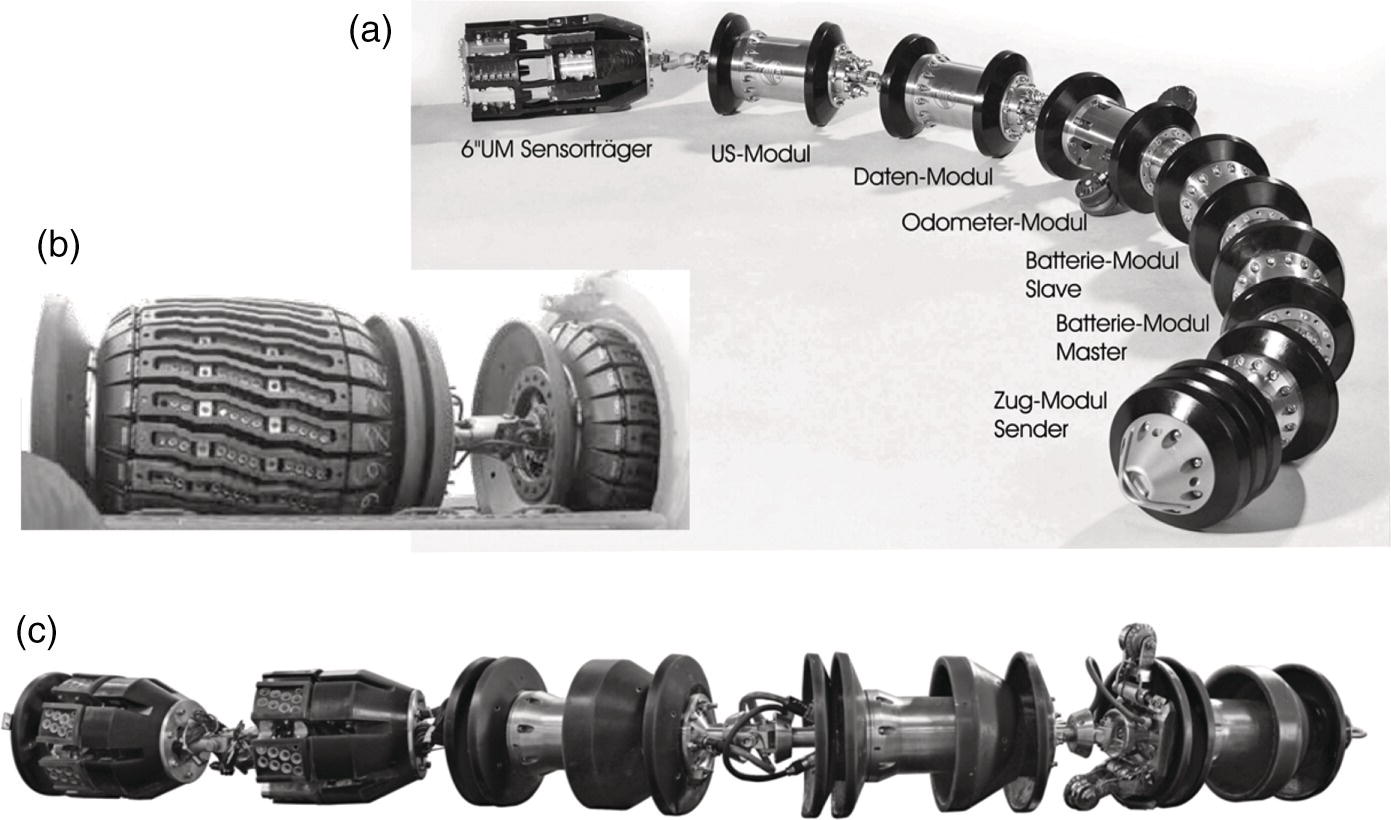
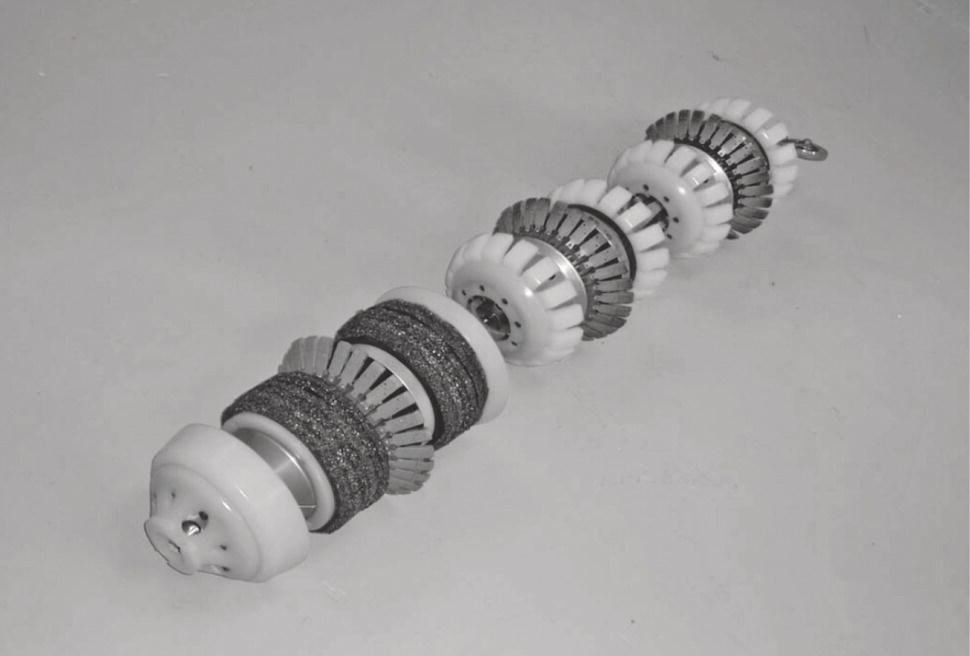
29.4.3.1 Magnetic Flux Leakage (MFL) Tools
Principle of Operation
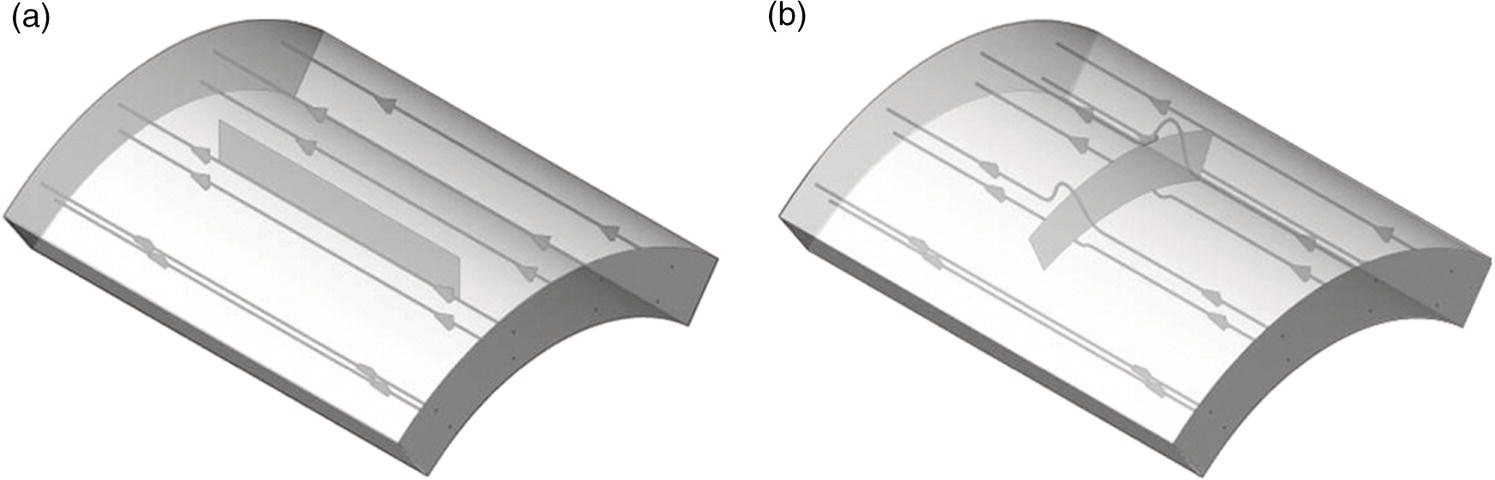
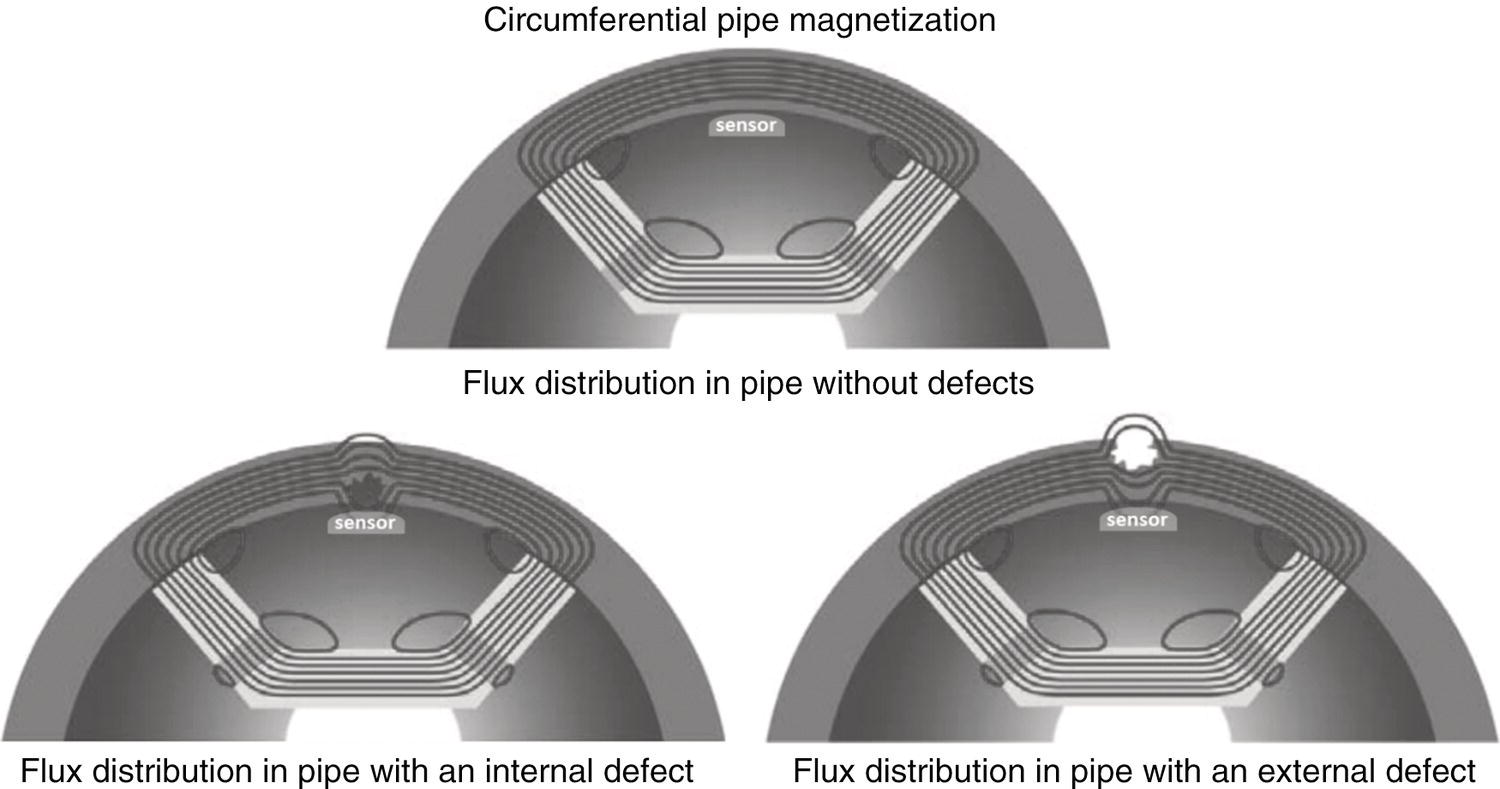
29.4.3.2 Circumferential Magnetic Flux Leakage Tools
Principle of Operation
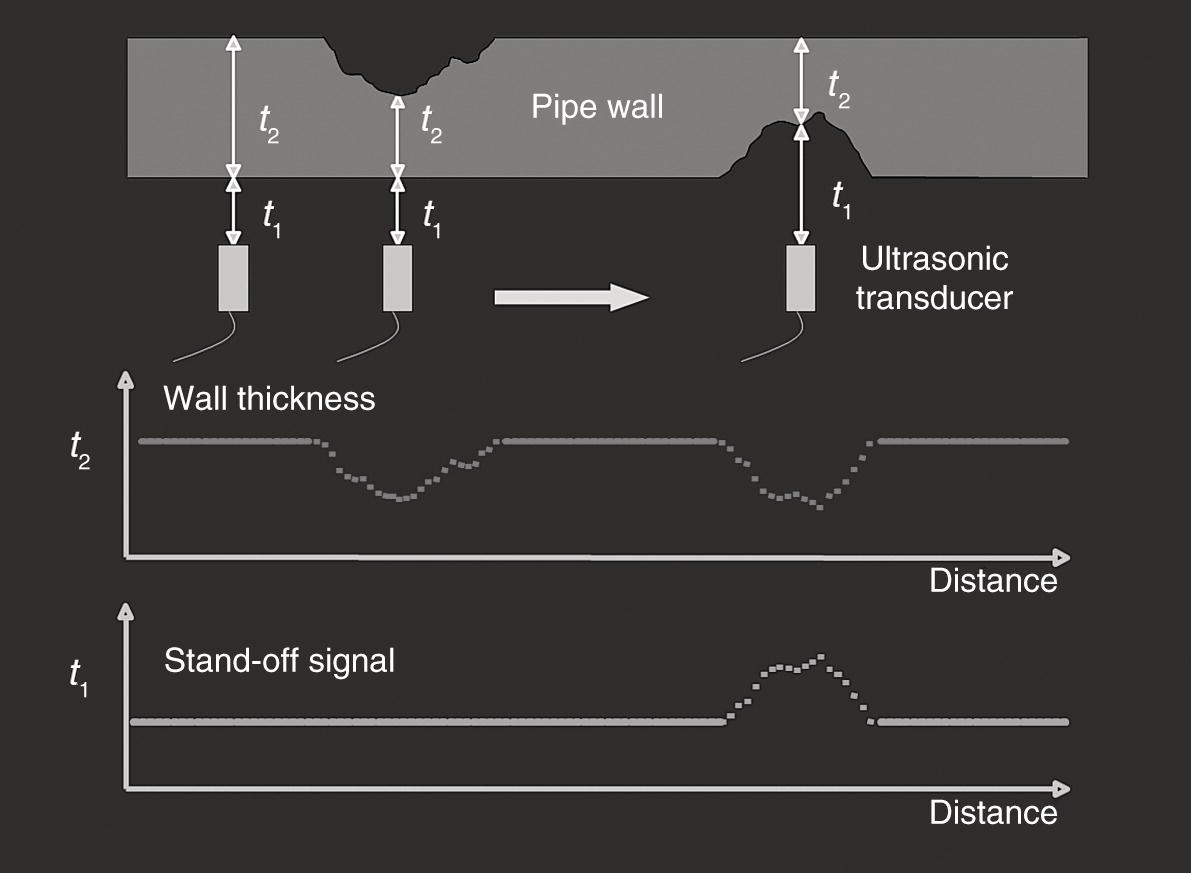
29.4.3.3 Ultrasonic Testing (UT) Tools
Principle of Operation
29.4.4 Crack Detection
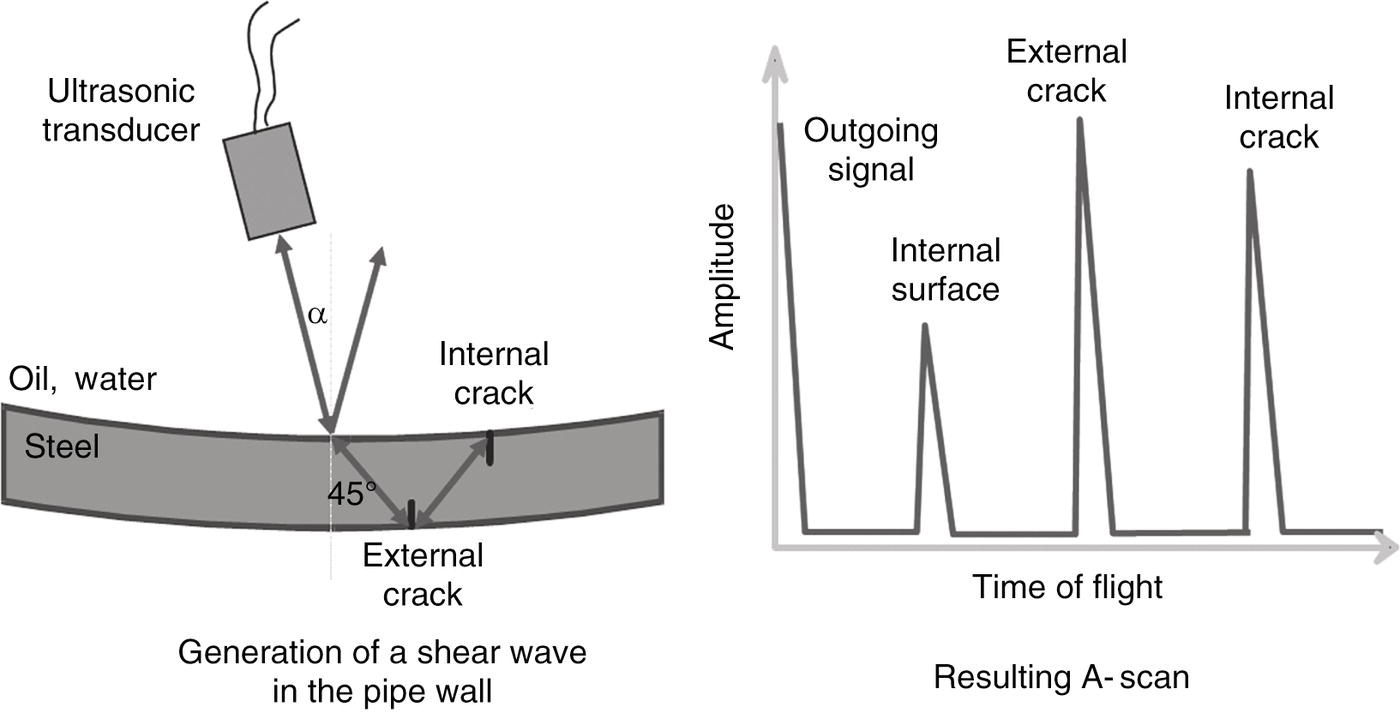
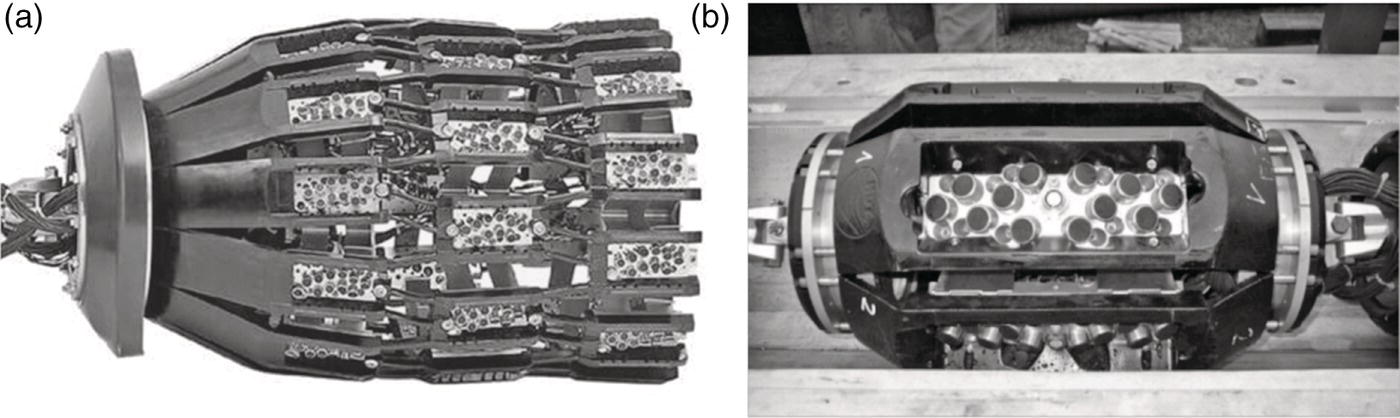
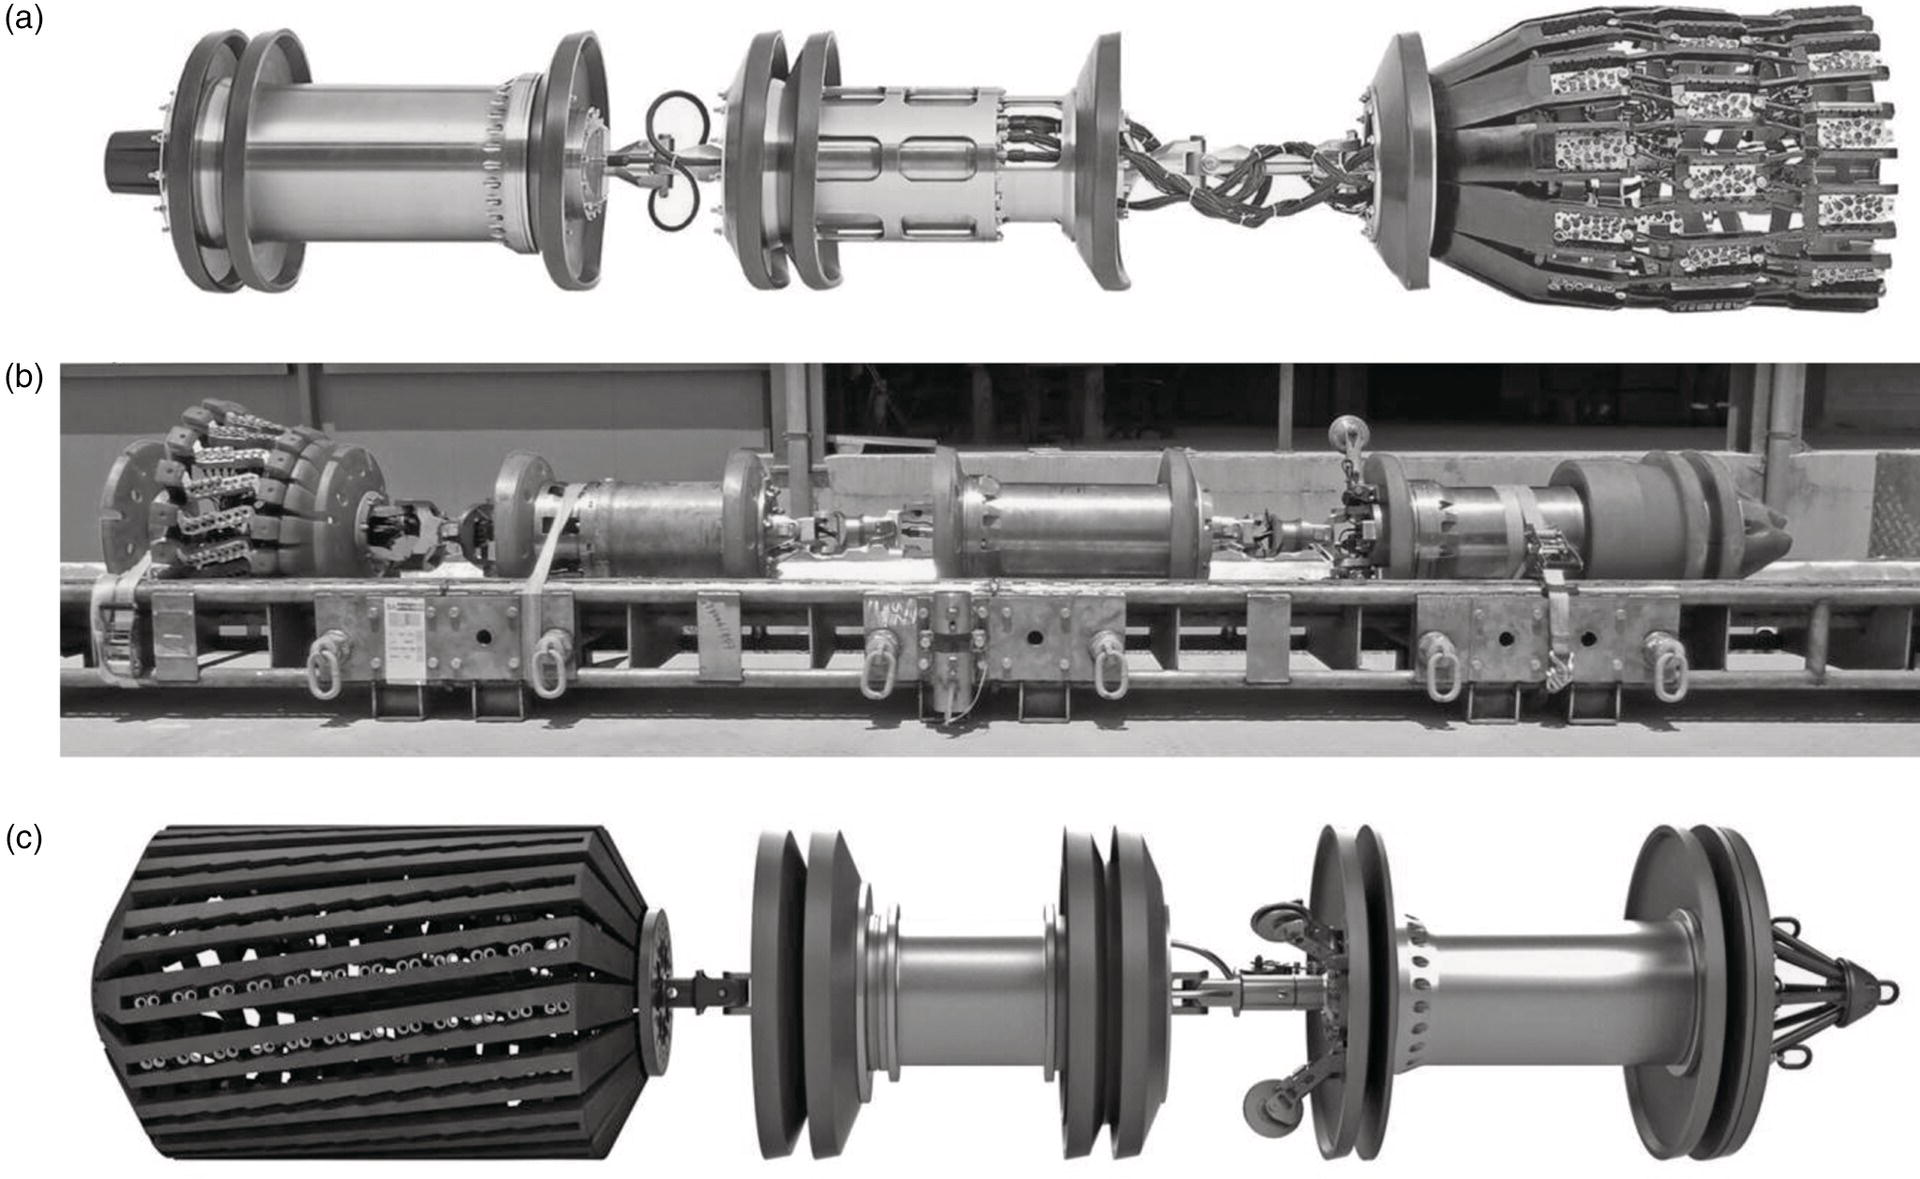
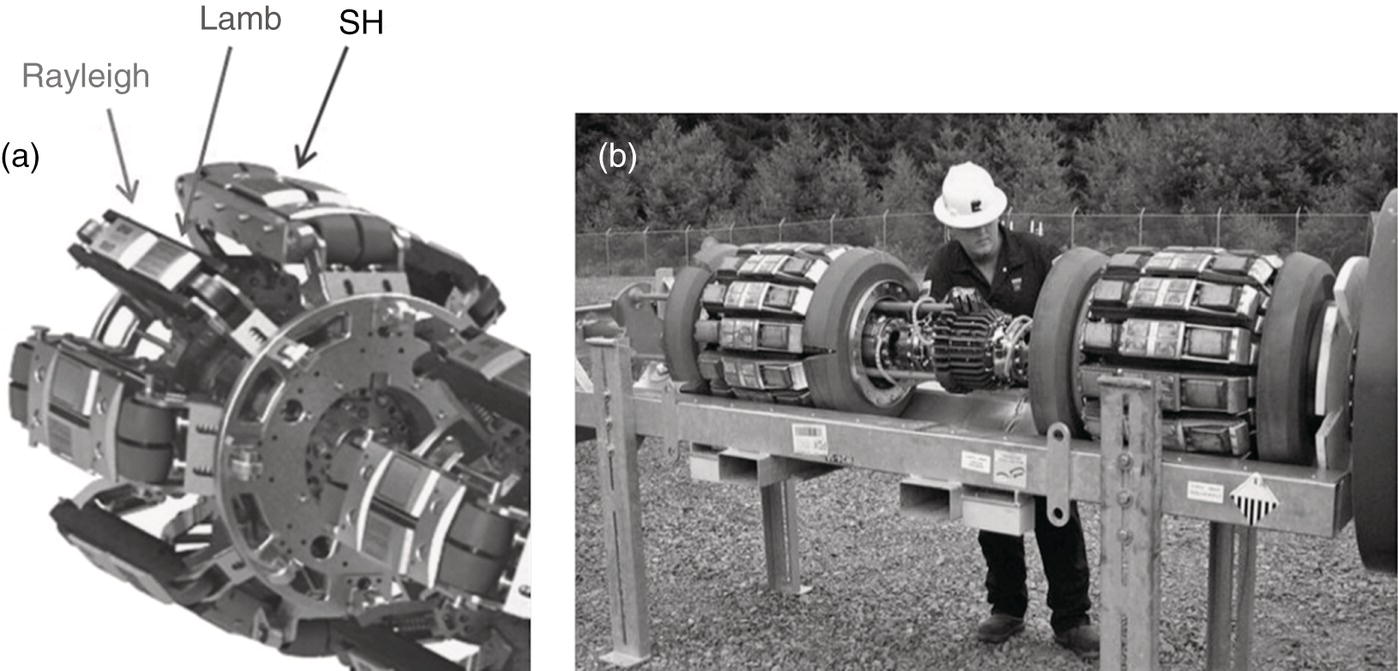
29.4.4.1 Liquid-Coupled UT
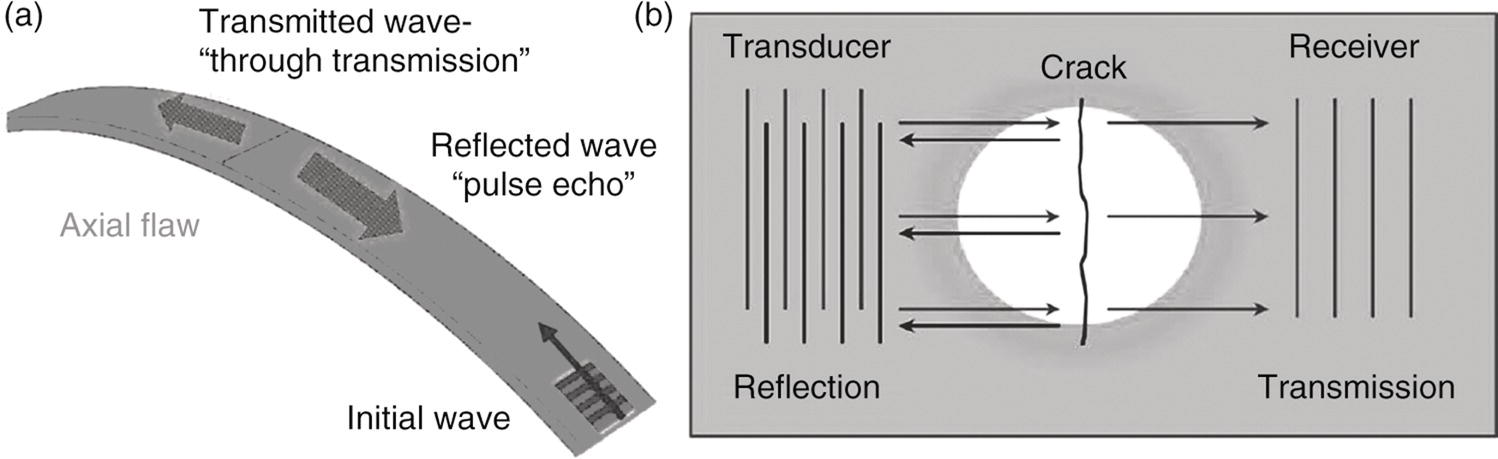
Principle of Operation
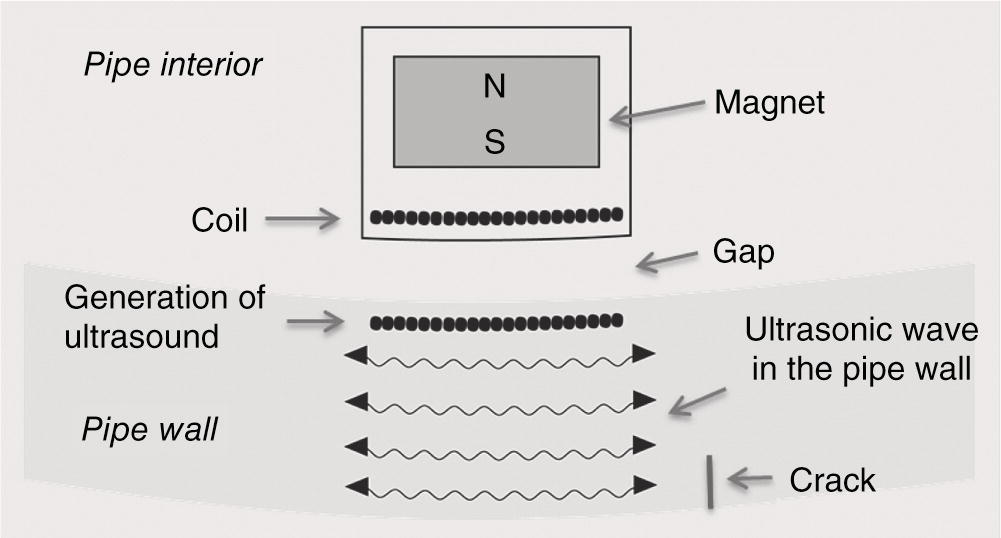
29.4.4.2 Electromagnetic Acoustic Transducers
Principle of Operation
29.4.5 Other
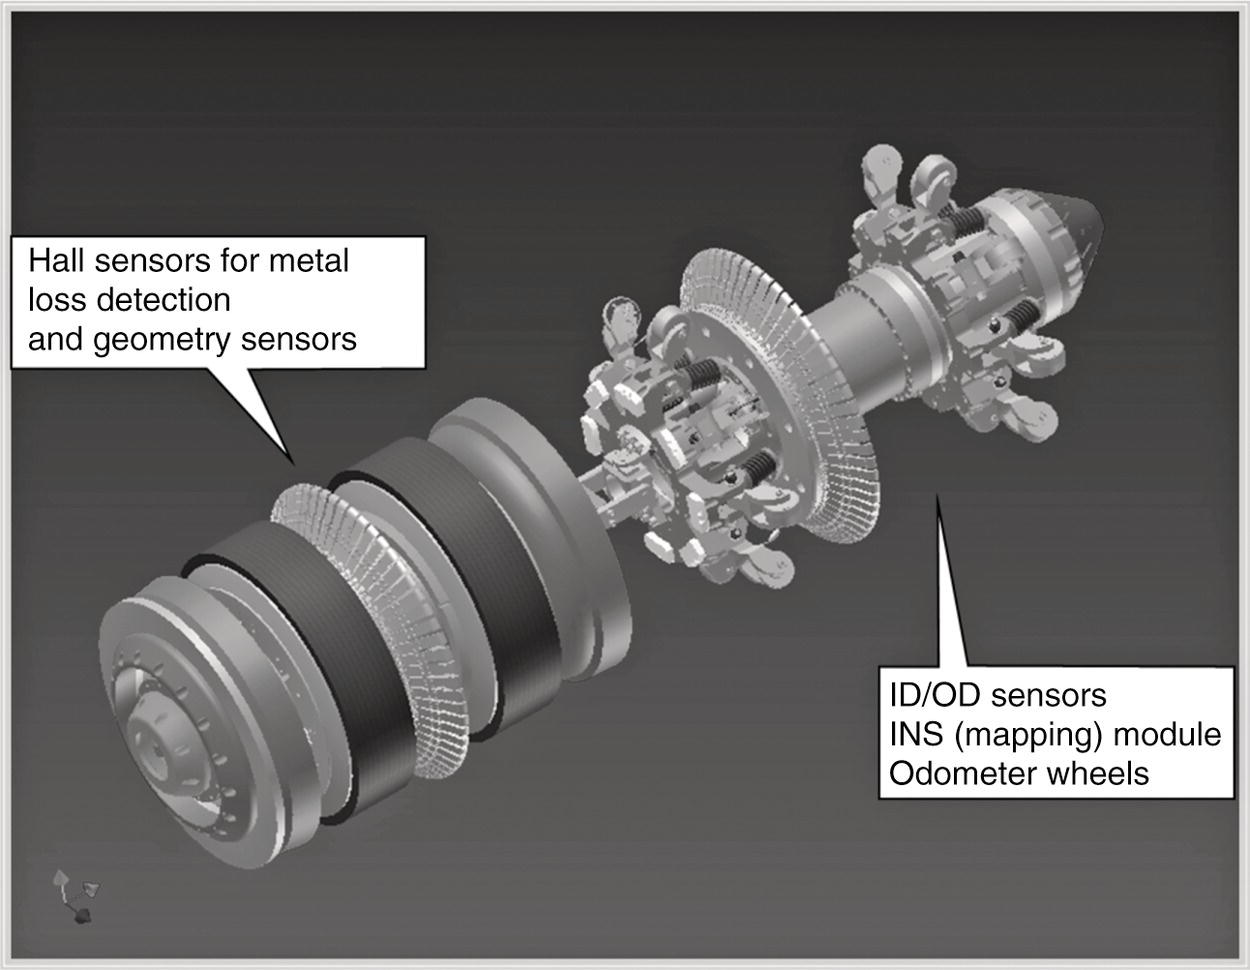
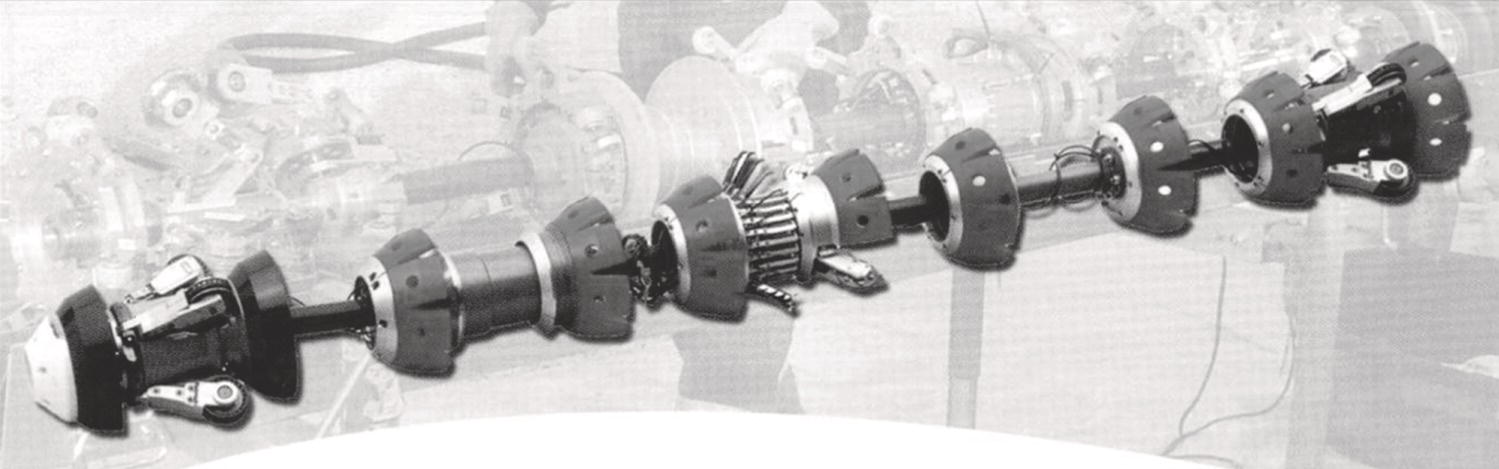
29.4.5.1 Combined Technology Tools
29.4.5.2 Detection of Mechanical Damage
29.4.5.3 Cathodic Protection Current Measurement
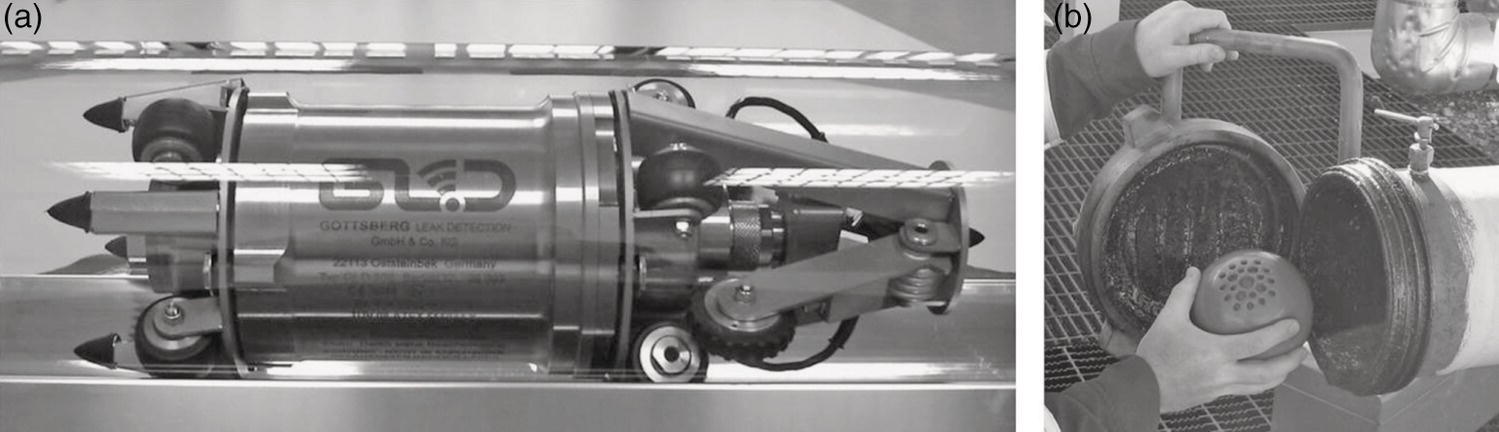
29.4.5.4 Leak Detection
29.5 Utilizing ILI Data/Verification
29.6 Integrating ILI Data
Appendix 29.A1: Sample Pipeline Inspection Questionnaire (Nonmandatory)
Company Name
Completed by
Name
Fax
Office phone
Date
Checked by
Name
Fax
Office phone
Date
Site Information
Pipeline Name
Line length
(km)
(mi)
Line OD
(mm)
(in.)
Launch site
L station #
Launch phone
Receive phone
Receive site
R station #
Base location
Base station #
Base Shipping Address
Base contact
Base phone
Type of inspection required: SCC MFL Dent Profile clean
Dummy tool required?
Locator required?
Pipeline alignment maps available?
Product Details
Product type
H2O content
Wax content
Slackline?
CO2 content
Hazardous?
H2S content
Protective equipment?
Type of Flow: Laminar Turbulent Two-Phase (Transitional)
Flow Property: Liquid Gas Two-Phase (Both)
Will the line be isolated?
Constant velocity?
Flow rate controllable?
Line Conditions
Min.
Normal
Max.
Launch pressure
(kPa)
(psi)
Launch velocity
(km/h)
(mph)
Launch flow rate
(m3/d)
(MMcfd)
Launch temperature
(°C)
(°F)
Receive pressure
(kPa)
(psi)
Receive velocity
(km/h)
(mph)
Receive flow rate
(m3/d)
(MMcfd)
Receive temperature
(°C)
(°F)
Pipe Details
Last inspection year
MAOP
Design pressure
Type of cleaning pig
Cleaning program?
Frequency
Known/suspected damage
Relevant historical data
Pipeline Conditions
Year of construction
Sphere tees installed?
Pipe cover depth max. min.
Type of pipe cover?
Are there high‐voltage lines in the vicinity of the pipeline?
Where?
Insulating flanges in the pipe? Where?
R.O.W. access (road, air, etc.)
Does pipe have hot taps?
Relevant historical data
Pipe Features
Yes
No
Yes
No
Does the pipeline contain the following features?
Thread and collar couplings
Chill rings
Bell and spigot couplings
Hydrocouples
Stepped hydrocouples
Stopple tees
Nontransitioned wall thickness changes
Wye fittings
Miter joints
Corrosion sampling points
Acetylene welds
Internal probes
Vortex breakers
Trap Details (Figure 29.A1)
Launch Length
Receive Length
A
Closure to reducer (m/ft.)
B
Closure to trap valve (m/ft.)
C
Closure to bridle CL (mm/in.)
d
Pipeline diameter (mm/in.)
d′
Pipeline internal diameter (mm/in.)
D
Overbore (NPS # or mm/in.)
D′
Overbore internal diameter (mm/in.)
E
Axial clearance (m/ft.)
F
Reducer length (mm/in.)
F′
Reducer wall thickness (mm/in.)
G
Reducer to valve (m/ft.)
H
Kicker line (NPS # or mm/in.)

Trap Conditions
Launcher
Receiver
Orientation
Type/internal diameter of trap valve (mm/in)
Centerline height of trap
(Aboveground) (mm/in.)
Is hoist available?
Yes No
Capacity
Lift height
Yes No
Capacity
Lift height
Is trap equipped with:
Pig‐sig?
Sphere tee?
Coupons or internal fittings?
Trap closure type
Trap pressure rating (kPa/psi)
Concentric or eccentric reducer?
Workshop near trap?
Access limitations (due to available area or ground conditions)?
AC power at trap site?
Intrinsic safe area, level?
Site drawings available?
Pipe Information
Nominal wall thickness of pipe (mm [in.])
Length of each wall thickness (km [mi])
Pipe weld type
Pipe grade (MPa/psi)
Mill
OD (mm [in.])
Total length=
Repair History
Nominal wall thickness and grade of pipe (mm/MPa [ksi/in.])
Length of each wall thickness (km [mi])
Start Chainage
End Chainage
Comments
Date of repair
Total length=
Bends
Type
Chainage of bend (km [mi])
Angle (degrees)
Bending radius
Minimum bore (mm [in.])
Comments
Tees/Off Takes/Branches
Type (forges, stopple, etc.)
Chainage of T/OT/B (km [mi])
O’clock Position
Max. off‐take diameter (mm [in.])
Barred or unbarred
Comments
Valves
Type
Chainage of valve (km [mi])
Manufacturer
Model
Minimum bore (mm [in.])
Diameter Changes
Type of reducer
Chainage of diameter change (km [mi])
Upstream diameter (mm [in.])
Downstream diameter (mm [in.])
Diameter transition length (mm [in.])
Comments
Coatings
(If concrete coated, is there any magnetic content?)
Internal
External
Aboveground References
Can any of the following be located from aboveground for references?
Line valves
Large bends
CP connections
Off tees
Major WT changes
Sleeves
Anodes
Casings
Girth welds
Insulation flanges
Known Metal Loss Information
Internal
External
Mechanical damage
Other
Special Attention
Comments
Completed by
_____________________________________________________________________________________________
Name
Signature
Date
Checked by
_____________________________________________________________________________________________
Name
Signature
Date
Updated by
_____________________________________________________________________________________________
Name
Signature
Date
References
Note