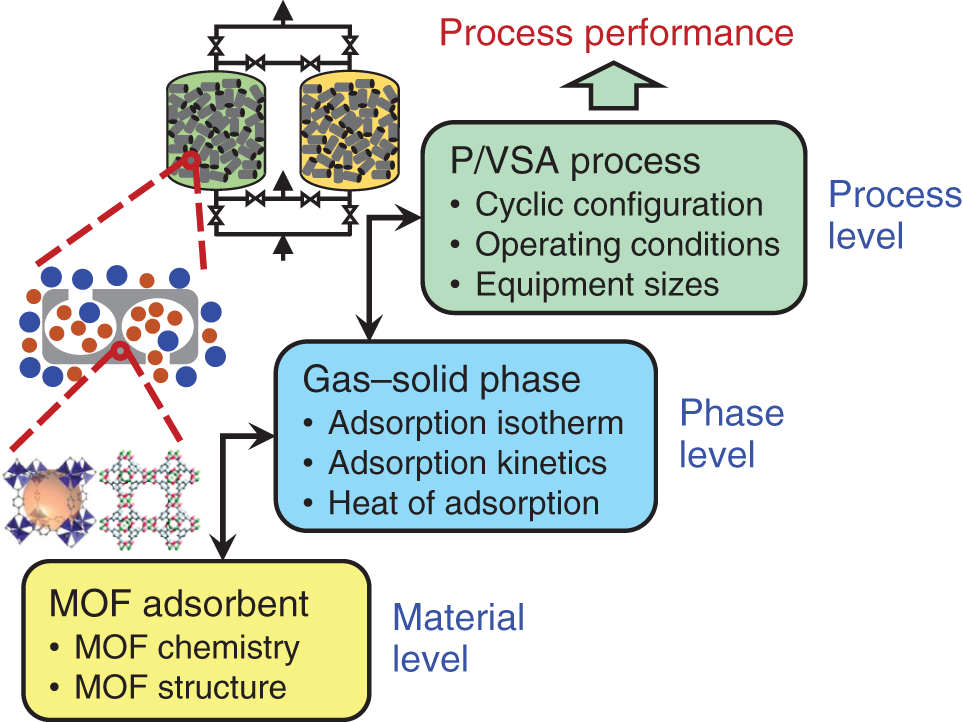
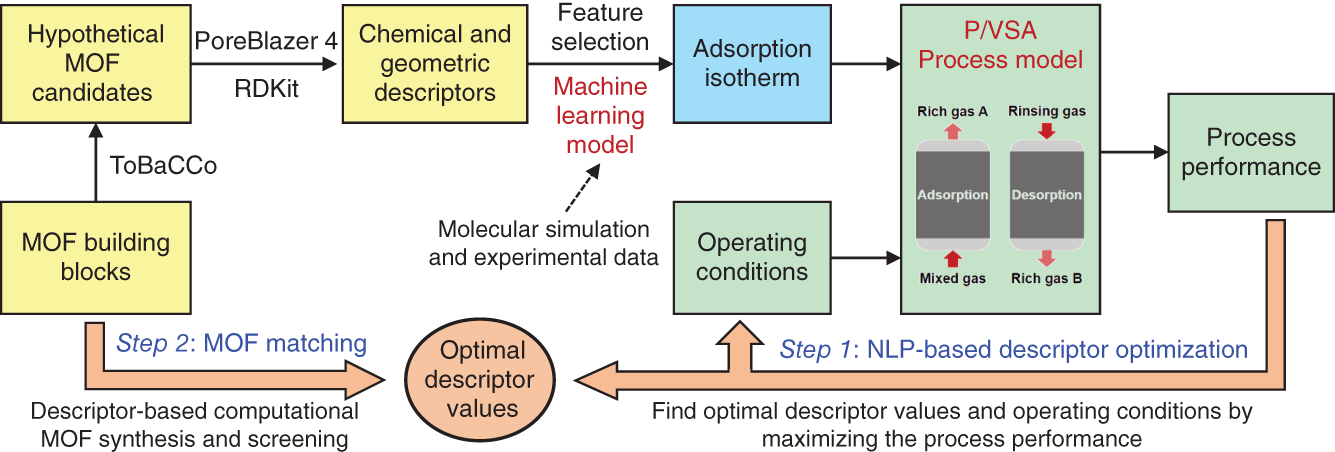
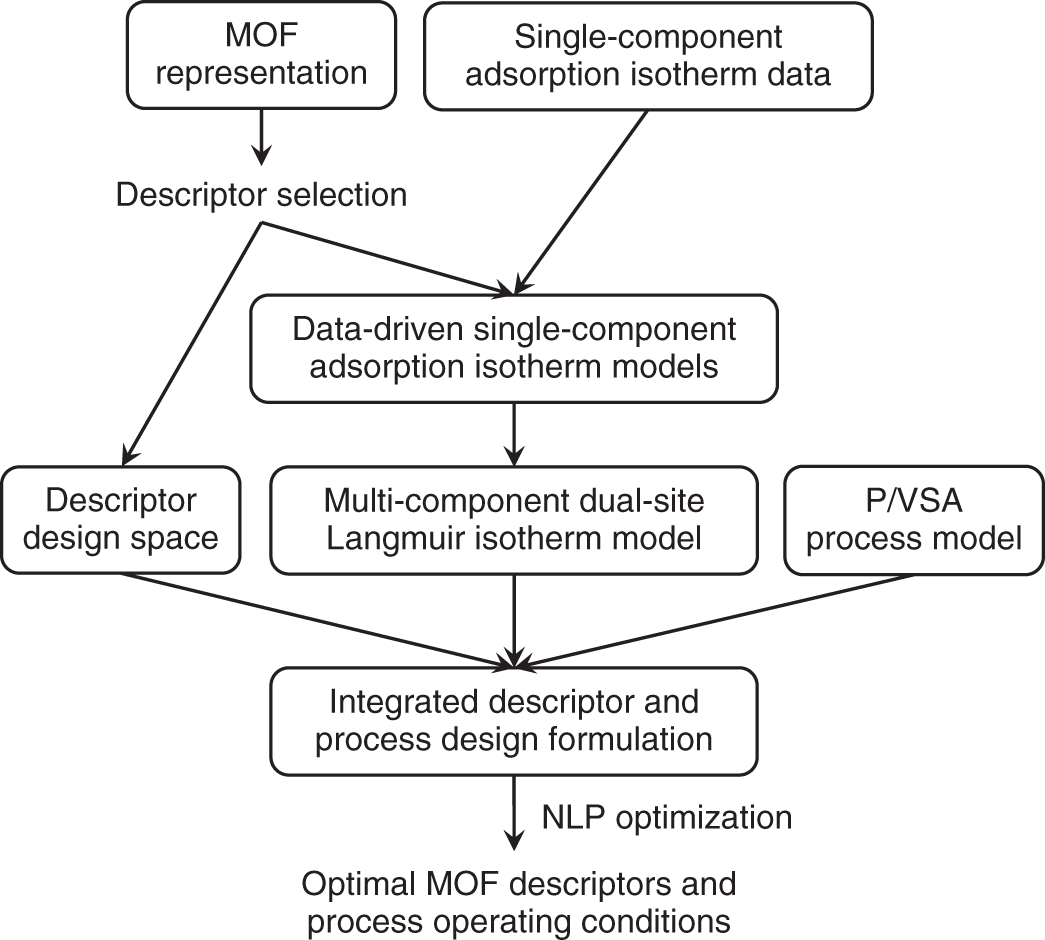
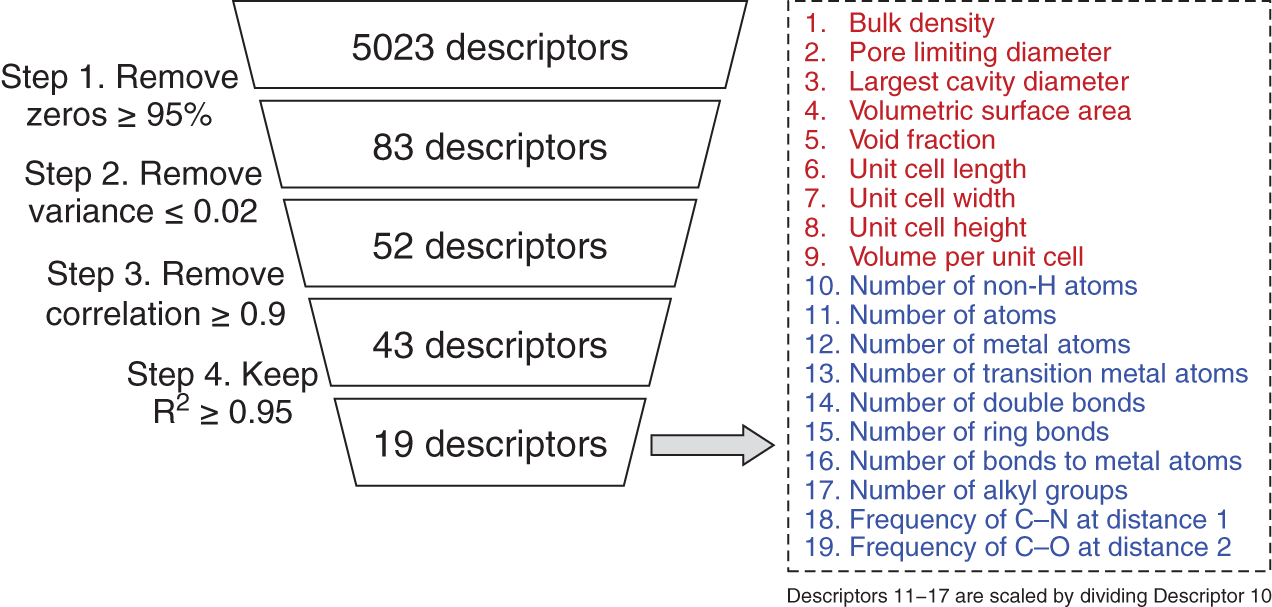
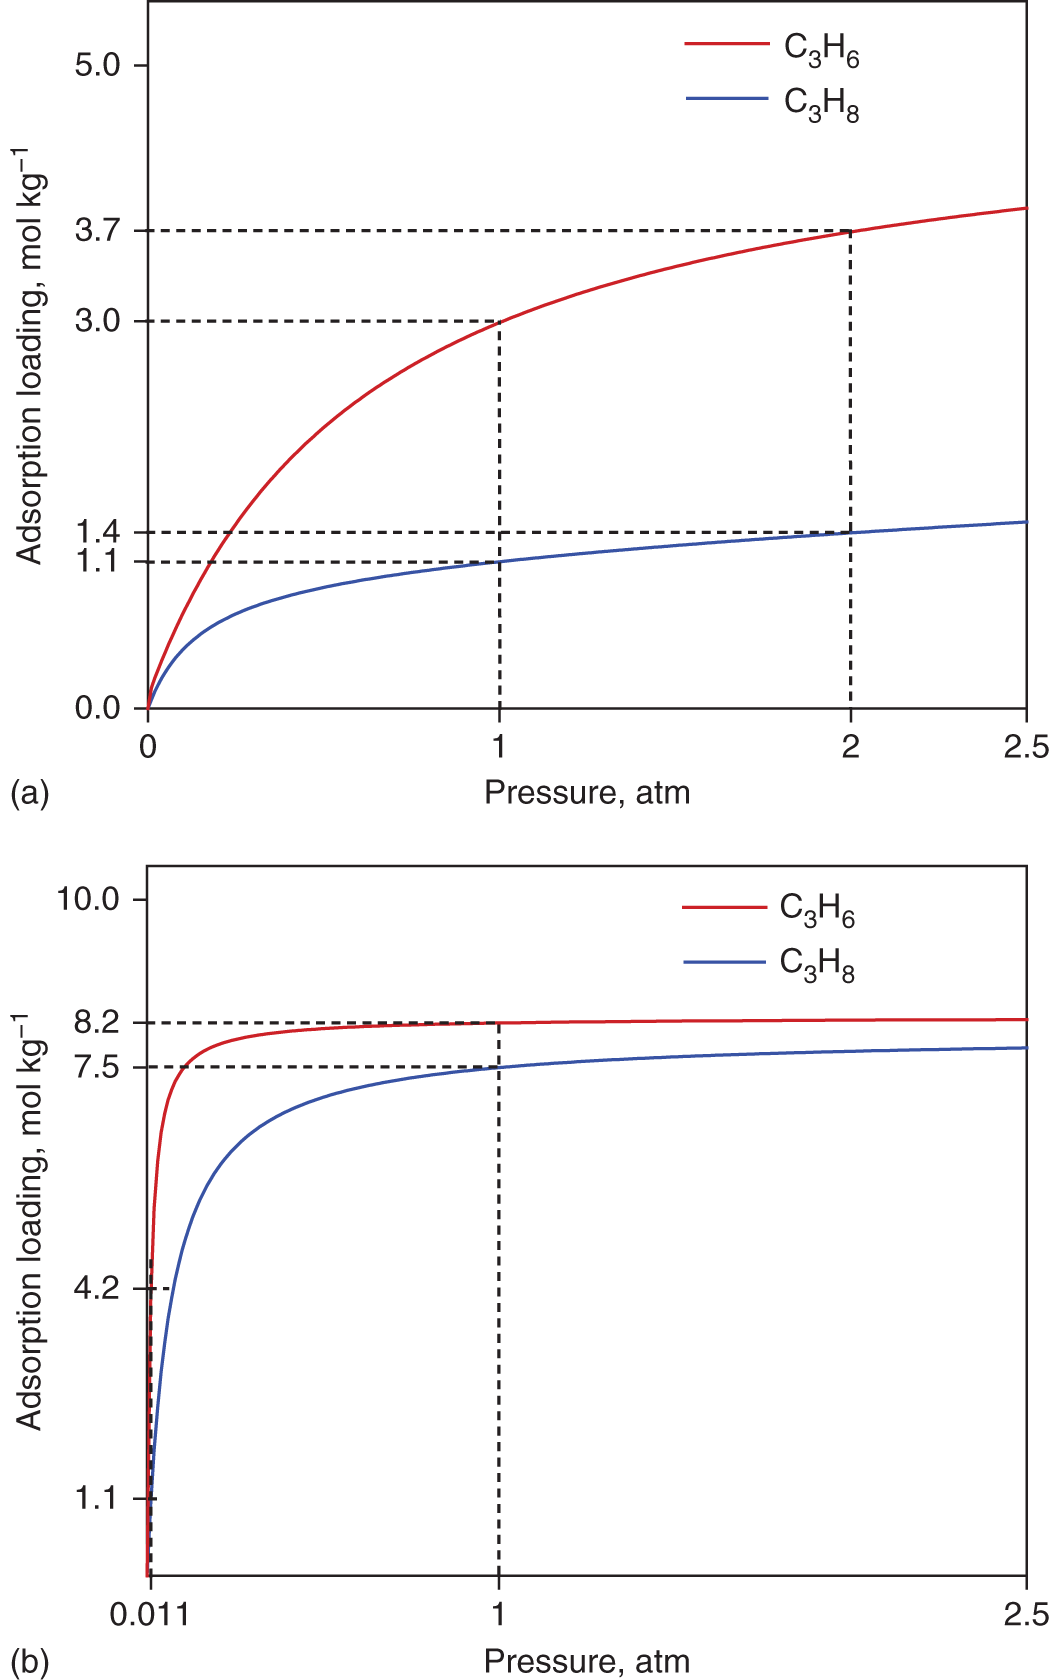
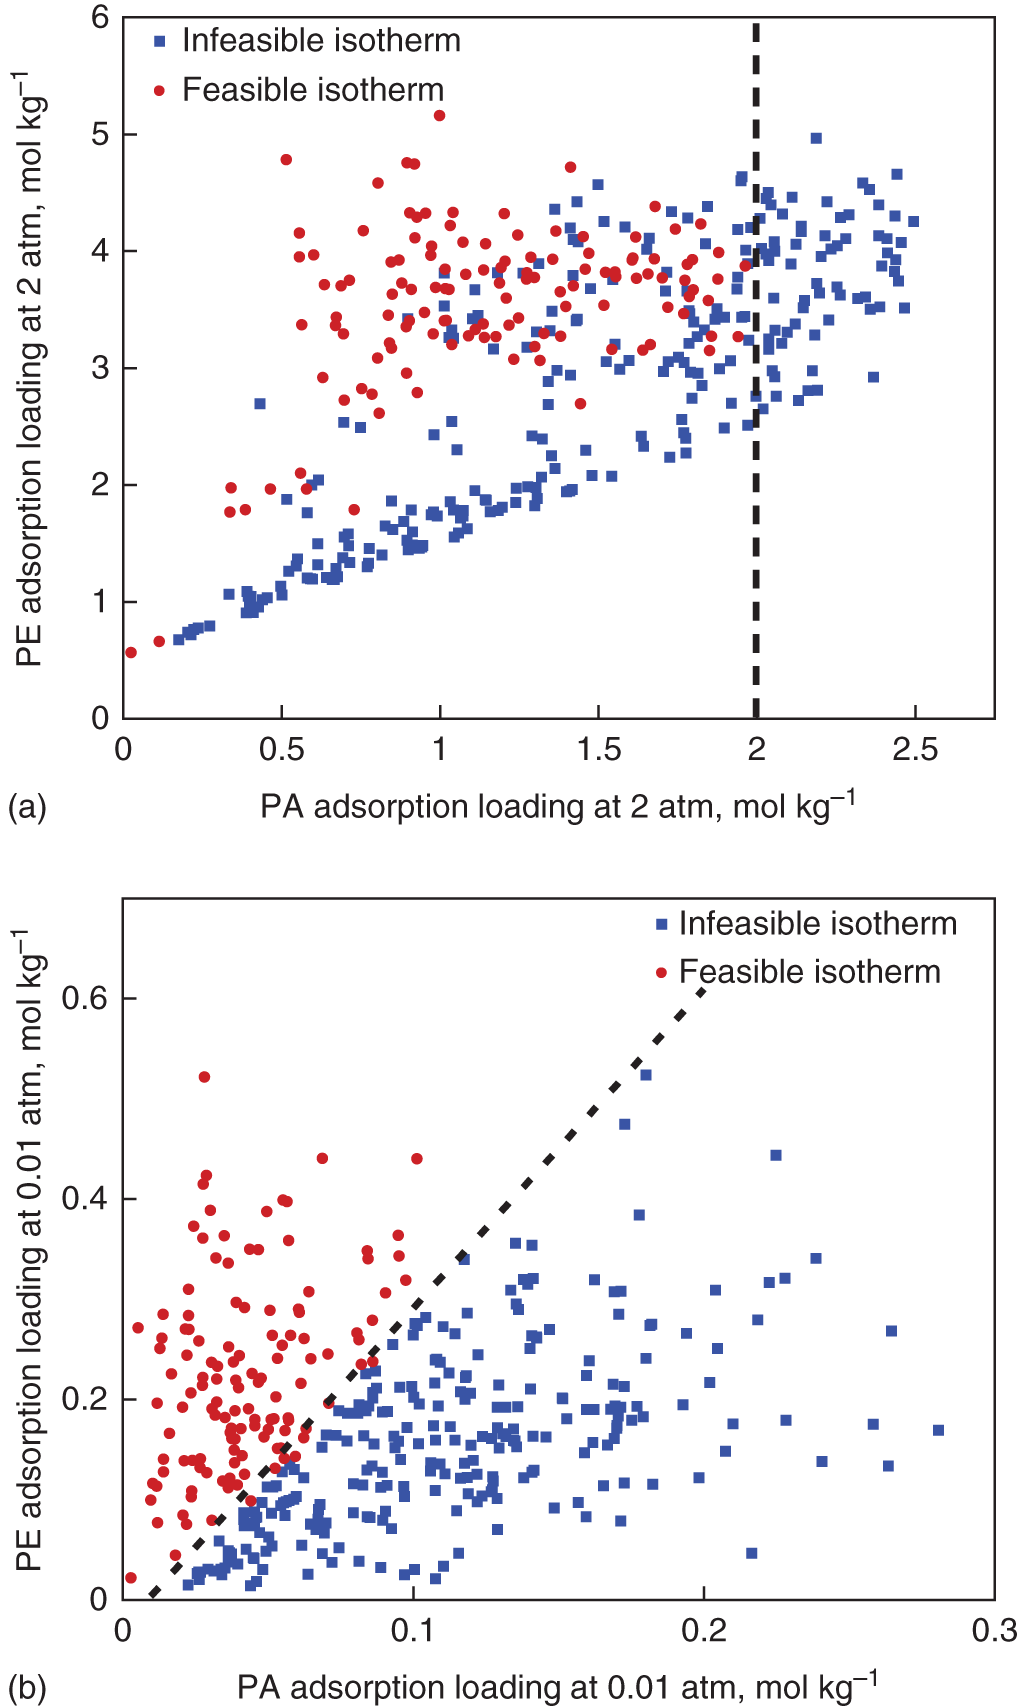
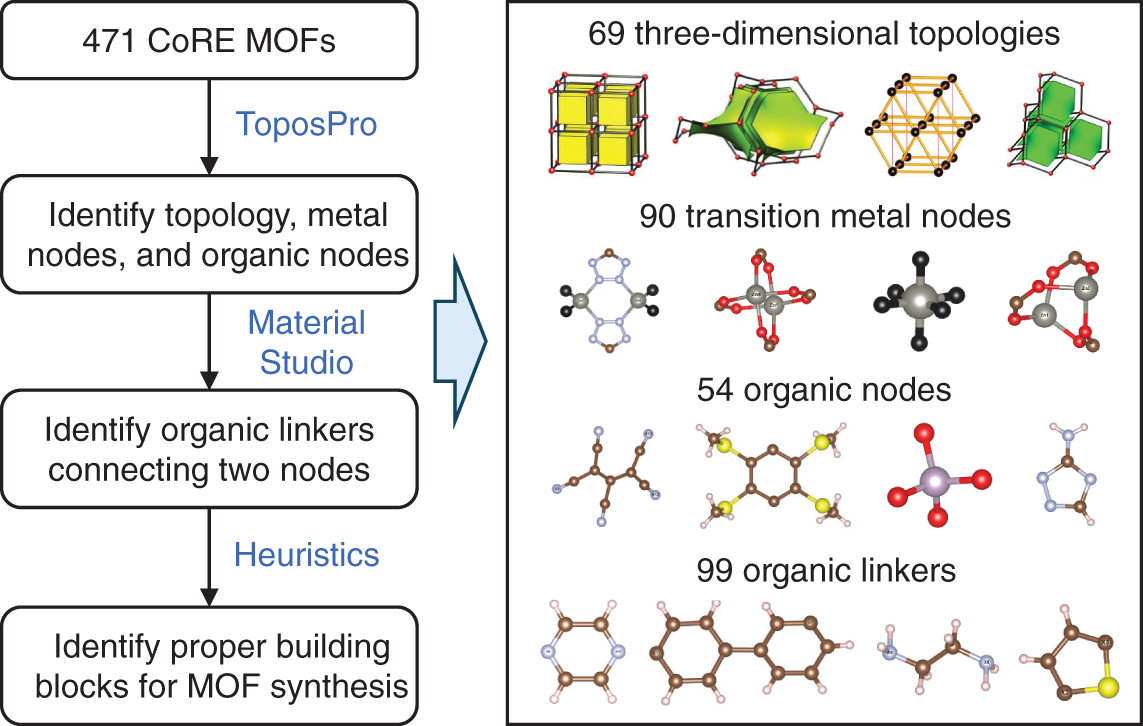
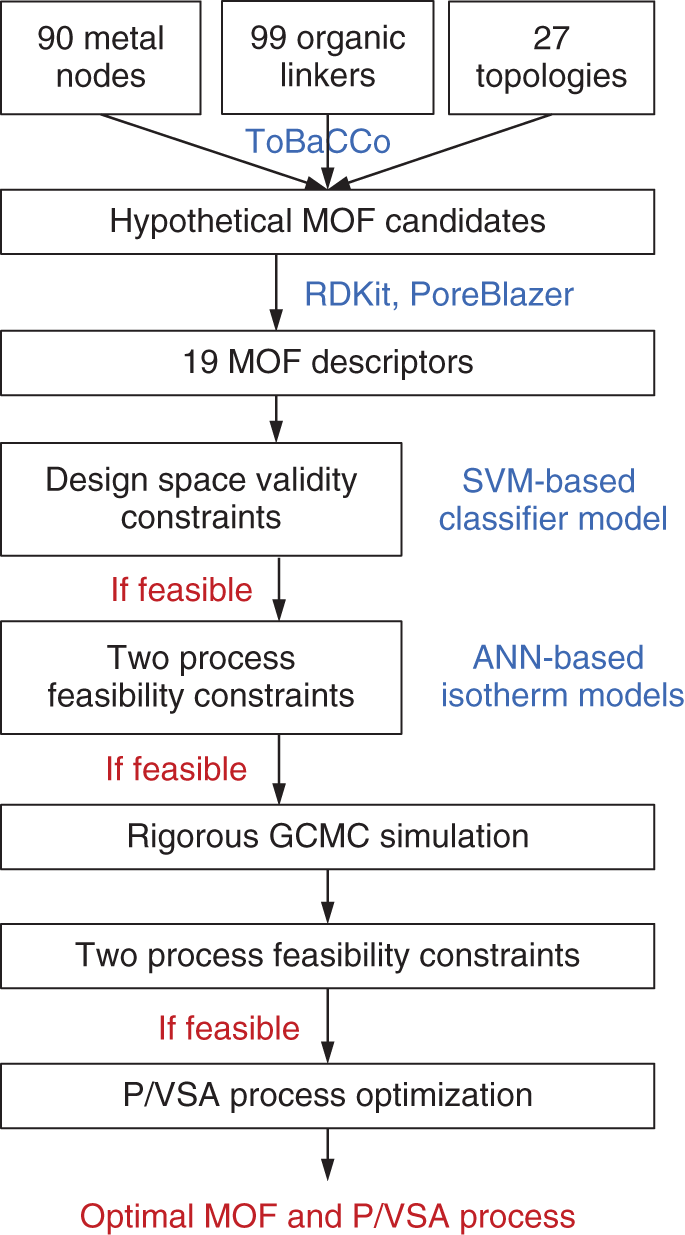
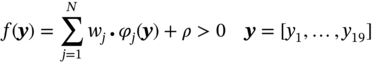
1East China University of Science and Technology, School of Chemical Engineering, State Key laboratory of Chemical Engineering, 130 Meilong Road, Shanghai, 200237, China 2The Hong Kong University of Science and Technology (Guangzhou), Sustainable Energy and Environment Thrust, Nansha, Guangzhou, 511400, China Pressure swing adsorption (PSA) is widely used for gas separation. It exploits different affinities of gases on solid adsorbents at different pressures to achieve separations. Currently, various porous materials are used as adsorbents, such as metal–organic framework (MOF) and zeolite. MOFs are formed via the self-assembly of molecular building blocks (i.e. metal nodes and organic linkers) in different topologies. The large variety of building blocks offers a huge design space [1]. In addition, MOFs own many superior properties such as ultrahigh porosity and controllable pore geometry. Thus, MOFs have great potential to achieve remarkable progress in gas separation [2]. MOFs can be adopted for separation via four alternative mechanisms: equilibrium separation, kinetic separation, molecular sieving, and gate-opening separation. Equilibrium separation, based on different species’ equilibrium gas loadings, is the most common method [3]. To date, numerous MOFs with distinct isotherm characteristics have been synthesized in the laboratory by tailoring MOF chemistry and structure. This trial-and-error experimental approach is time-consuming and inefficient. Importantly, many MOFs cannot lead to good process performance [4]. As depicted in Figure 5.1, the design of a MOF for use in PSA processes is a multiscale design problem that incorporates the interlinked material, phase, and process levels. Variations of both material and process operating parameters affect the adsorption behavior of the gas–solid system and thus jointly determine the process performance. With this picture in mind, a computational approach is highly desirable to expedite the identification of promising MOFs that can best serve the PSA process [6, 7]. In the literature, computational screening methods have been employed to find suitable adsorbents. The most popular one is high-throughput screening [8–13]. A large set of synthesized or hypothetical adsorbents are first collected and their adsorption and diffusion properties are computed using molecular simulation. Then, performance metrics (e.g. working capacity and selectivity) are calculated to identify top-ranked candidates for process evaluation. Although this approach works for a large adsorbent database, those widely used metrics can neither tell whether separation requirements are satisfied nor rank the adsorbents correctly in terms of real process performance [14–16]. Alternatively, hypothetical adsorption isotherms can be sampled for process optimization. With the results, surrogate models that correlate isotherm characteristics with process performance can be constructed for adsorbent screening [17–19]. This method generates an adsorbent ranking that is more consistent with process performance. However, like other screening methods, it applies to adsorbents with known chemistry and structure. The insights from the phase and process levels cannot be used to guide new adsorbent design. Figure 5.1 Multiscale structure of the pressure/vacuum swing adsorption process. Source: [5]/with permission of John Wiley & Sons. Unlike screening, the multiscale design problem can be formulated as an optimization problem. Each level is represented by different models. In this way, design variables at material and process levels can be simultaneously optimized. Such a strategy has been widely applied for integrated solvent and process design [20–24]. Its success lies in the foundation of the computer-aided molecular design method, molecular structure–property relationship models, and structural feasibility rules, etc. For adsorption processes, Khurana and Farooq [25, 26] integrated the phase and process levels. Isotherm characteristics and process operating conditions were simultaneously optimized for carbon capture. Optimal isotherm shapes are obtained, which can serve as targets for adsorbent design. However, without considering the valid design space of adsorbent materials, the isotherm targets may not correspond to any feasible adsorbents. Importantly, it is unknown which adsorbent chemistry and structure are favored for the process. To tackle these issues, material design should be incorporated into process optimization. Unfortunately, none has been done on this topic yet. The major challenge is the lack of mathematical models to guarantee the structural feasibility of the adsorbents and to predict the adsorbent properties. For instance, hypothetical MOFs are usually assembled using computational tools (e.g. ToBaCCo), and their structural feasibility is verified via ab initio calculations [27]. To determine the MOF adsorbent properties, a computationally expensive molecular simulation is needed [28]. Clearly, these computations are impractical to be embedded into a mathematical optimization problem. Figure 5.2 General methodology for integrated metal–organic framework and pressure/vacuum swing adsorption process design. Source: [29]/with permission of John Wiley & Sons. In this chapter, focusing on equilibrium separation, an integrated MOF and PSA process design framework is proposed in Figure 5.2 to tackle the above challenges. It consists of two steps: descriptor optimization and MOF matching. In the first step, a MOF is represented as a set of descriptors. Several data science techniques are adopted to select proper descriptors, define valid design space, and build data-driven models for predicting the adsorption isotherms. This produces an explicit formulation of the integrated design problem to enable the simultaneous optimization of MOF descriptors and process operating conditions for maximizing the process performance. In the second step, the aim is to computationally synthesize and screen hypothetical MOFs for enhancing equilibrium-based gas separation. The design guidelines and data-driven models obtained from the first step are well-adopted for designing new MOFs that can eventually result in better separation performance using optimized PSA processes. The framework is demonstrated on the separation of propene (PE) and propane (PA), which is currently achieved with energy-intensive cryogenic distillation. This chapter is organized as follows. For the first step, detailed material–property relationships are constructed, and the integrated design problem is formulated and solved. For the second step, detailed property–performance relationships are developed for fast MOF screening, and MOF building blocks are specifically extracted to perform in silico MOF design and subsequent screening. The workflow for the first step is illustrated in Figure 5.3. First, representative MOF descriptors are selected to serve as design variables. Meanwhile, the selected descriptors are used to develop data-driven models for predicting single-component adsorption loadings. Then, the data-driven models are employed to derive multicomponent dual-site Langmuir (DSL) isotherm models. Based on the generated descriptor dataset, specific models are defined to denote the valid design space of descriptors. Afterward, by integrating the design space model, the DSL isotherm model, and the PSA process model, the integrated MOF descriptor and PSA process design task is formulated as a nonlinear programming (NLP) problem. This problem is solved to identify the optimal descriptor values and process operating conditions. The detailed procedures and models are elaborated below. Figure 5.3 Workflow of the descriptor optimization step. Source: [5]/with permission of John Wiley & Sons. Every MOF has a unique chemical composition (metal node and organic linker) and/or structure (pore geometry and topology). For adsorption, MOF chemistry influences the interaction with the adsorbate. For instance, some metals (e.g. copper and zinc) can form open metal sites (OMSs), leading to a stronger interaction with olefins than with paraffins [30, 31]. In addition, since adsorbates tend to occupy the void spaces of an MOF during adsorption, pore geometry plays a crucial role in determining the adsorption capacity. Thus, chemical and geometric descriptors are required to cover the effects of MOF chemistry and pore geometry on the adsorption properties [32]. For differentiating MOF topologies, topological descriptors can be computed. However, those descriptors are hard to interpret and trace back to specific topology [33]. Additionally, only a small number of well-known topologies can be found in synthesized MOFs [34]. Considering the low interpretability and limited topology variations, topological descriptors are not included. Fourteen geometric descriptors are considered, including void fraction, volumetric surface area, and largest cavity diameter. These descriptors can capture the important geometric features of porous materials like MOFs [35]. Moreover, Gharagheizi et al. [36] recently defined 5009 chemical descriptors to describe MOF chemistry. Their definitions are adjusted from molecular descriptors that have been widely used in cheminformatics. The current study employs the 5009 descriptors directly. Four hundred and seventy-one real MOFs are selected from the CoRE MOF database where stable and synthesizable MOFs with available atomic coordinates are collected [37]. These 471 MOFs include considerable diversity of chemistry, geometry, and topology. For each MOF, the 14 geometric descriptors have already been computed using the open-source package Zeo++ with a probe radius of 1.86 Å [38]. Additionally, the molecular graph of MOFs containing atom positions and connections is read using the cheminformatics package RDkit to derive the 5009 chemical descriptors accordingly [39]. Data-driven models are developed to predict single-component adsorption loadings using MOF descriptors. A series of adsorption isotherm data is needed for model regression. The pure species isotherms of PE and PA on 471 MOFs have been computed by Tang et al. [40] using grand canonical Monte Carlo (GCMC) simulations at 300 K over a pressure range from 0.1 to 156 bar. Although it is useful to include a large number of descriptors, this leads to great difficulties in developing data-driven models. Since the effect of each descriptor on deciding the adsorption selectivity and capacity varies, the most influential descriptors can be selected to build simple and reliable data-driven models [41]. Figure 5.4 shows a systematic procedure for descriptor selection. Figure 5.4 Detailed procedure for MOF descriptor selection. Source: [5]/with permission of John Wiley & Sons. Based on the 19 descriptors, two new ANN models are trained to predict the single-component loadings of PE (qsE) and PA (qsA) at 300 K and different pressures, respectively. Fivefold cross-validation is performed to find the optimal hyperparameters. Each model has one input, one hidden, and one output layer. The tansig and purelin activation functions are applied in the hidden and output layers, respectively. The number of neurons in the hidden layer are 25 for the qsE model and 30 for the qsA model. The two models are summarized below, and the involved parameters are given at https://github.com/zx2012flying/Integrated-MOF-and-PVSA-Process-Design. where y1–y19 are the 19 descriptor values and P is the pressure. The R2 and MAE of both models are larger than 0.95 and less than 0.6, respectively. These indicate that the two models can provide reliable predictions on the single-component adsorption isotherms of PA and PE. Adsorption-based gas separation occurs in a multicomponent environment. To predict multicomponent adsorption equilibria, the DSL model is applied using single-component model parameters that are fitted from single-component adsorption loadings. This type of DSL model can provide good predictions for many systems including PE/PA [43]. The DSL model parameters are derived as follows. Given four pressures Pi = {0.01, 0.1, 1, 10} bar, the corresponding single-component PE and PA adsorption loadings are predicted by Meanwhile, the equilibrium adsorption loadings of PE and PA ( where yE and yA are the molar fractions of PE and PA in the gas phase, respectively. Eqs. (5.7) and (5.8) ensure that the adsorption loadings calculated from the two models match with each other. With these, the eight DSL model parameters ( Nineteen descriptors and two ANN models are identified from pure data without any thermodynamic basis. Additional constraints are added to confine the solutions inside the valid design space of the models. Data-driven models are valid in the domain that is densely covered by training data [44]. Any predictions outside the domain should be prevented. Here, the approach used is to build a one-class support vector machine (SVM) classifier with the radial basis function [45]. After importing the descriptor dataset, the kernel coefficient β is tuned to 2 × 10⁻⁹ to ensure that over 99.5% of the training data are inside the validity domain. The resulting classifier or boundary is written as where N is the total number of fitted support vectors, ρ is the intercept, and wj is the coefficient of the jth support vector SVj. These parameters were given in the GitHub shown below. Moreover, certain logic constraints have to be satisfied. Equation (5.11) ensures that each descriptor must be within its lower and upper bounds, namely minimal and maximal values in the training dataset. The largest cavity diameter (y3) should exceed the pore-limiting diameter (y2). The volume of a single unit cell (y9) should not exceed the cubic cell volume (i.e. y6 ∙ y7 ∙ y8). The number of atoms (y10) should be larger than the number of non-hydrogen atoms (y11). The number of metal atoms (y12) must be larger than the number of transition metal atoms (y13). Finally, the total number of bonds linked to metal atoms (y16) cannot exceed six times the number of metal atoms. A one-bed and four-step PSA process is considered. A complete process cycle consists of pressurization, adsorption, rinsing, and desorption [46]. For pressurization, the feed gas is compressed to a high pressure and fed into the bottom of the column. The top is closed and the internal pressure increases. At the adsorption stage, the supply of feed gas is continued, where PE is selectively adsorbed and a PA-rich stream leaves from the top. Then, a small fraction of the purified PE stream is re-fed to the column to rinse the PA-rich gas. At the rinsing step, the input gas compositions are presumably constant and equal to the average compositions of the purified PE stream. Finally, a low pressure is given at the bottom and the bed starts a desorption step where the pressure is reduced to a lower level and the released PE is collected at the bottom. In the end, the PE output is stopped and a new cycle starts. For simplification, the following assumptions are made [47, 48]: Based on these assumptions, the mathematical model for the four-step PSA process includes the component mass balances, the total mass balance, and the mass transfer kinetics are given in the GitHub. Six operating conditions are design variables at the process level. They are the durations of the four steps (tPR, tAD, tRI, and tDE) and two operating pressures (Plow and Phigh). Since the energy consumption is a critical factor for assessing the process performance, the objective function is defined to minimize the total energy consumption per ton of the purified PE product: where EPR, EAD, ERI, and EDE are the energy consumption for pressurization, adsorption, rinsing, and desorption, respectively. Moreover, Eq. (5.18) shows that PE purity is equal to the average PE molar fraction ( The purity and recovery of PA can be calculated based on the overall input–output mass balances. The integrated MOF and PSA process design problem is formulated and solved as an NLP problem. Nineteen MOF descriptors denoting the material variations and six process operating conditions are simultaneously optimized to minimize the energy consumption. Given pre-specified equipment sizes, the energy consumption as well as product purity and recovery are calculated from the PSA process models. PE recovery and purity should be constrained according to industrial requirements. This optimization problem cannot be solved directly. A spatial and temporal discretization of PDEs is carried out. The entire column is divided into 20 identical sections and the finite volume method with the upwind difference scheme is applied for spatial discretization. In addition, the backward Euler’s scheme is used for temporal discretization. The durations of the pressurization and rinsing steps are discretized into 10 identical time intervals while those of the other two steps are divided into 20 identical time intervals. Clearly, optimizing the durations of the four steps (i.e. tPR, tAD, tRI, and tDE) is equivalent to the optimization of the corresponding time-interval duration (i.e. ΔtPR, ΔtAD, ΔtRI, and ΔtDE). After the discretization, the PSA process model is described by a set of algebraic equations that are directly coded in GAMS for NLP optimization. The separation of an 85 : 15 PE/PA mixture is studied. The feed gas is at 2 atm. The feed gas has been cooled to 300 K, since the isotherm models are fitted at 300 K. Moreover, the purity of PE must be higher than 99%. Additionally, PE recovery is usually less than 30% when 99% PE is produced using PSA processes with no more than five steps [50]. Thus, the minimal PE recovery is set to 30%. The PSA process is modeled on a pilot–plant basis. Table 5.1 lists the input parameters [51]. The copper-based Cu-BTC has been recognized as one of the suitable MOFs for PE/PA separation due to its large PE adsorption capacity [52]. Here, a benchmark PSA process using Cu-BTC is optimized for comparison. The multicomponent DSL model of Cu-BTC is fitted using the experimental data [53]. The single-component isotherms are plotted in Figure 5.5a. The six process operating conditions are optimized to minimize energy consumption. The optimization problem is solved in GAMS 27.2 using CONOPT4. Different initializations are offered, and the best local optimum found is given in the second column of Table 5.2. The high pressure for adsorption is 1 atm when the initial selectivity SPE/PA is equal to 6.6. The low pressure for desorption is optimized to 0.011 atm and the minimal energy consumption is 505 kWh electricity per ton PE. Under the pre-specified requirements on PE purity and recovery, the integrated design problem in Eq. (5.20) is solved. The solver CONOPT4 and different initial values are used. It takes about 150 seconds to find the optimal solution. The optimal MOF refers to a hypothetical MOF (h-MOF). As listed in Table 5.2, the process operating conditions are different from those of the benchmark. The high pressure is 2 atm, which is equal to the initial pressure of the feed gas. The desorption occurs at 1 atm. Under such pressures, no gas compression is needed at pressurization and adsorption steps and no vacuum evacuation is required for desorption. Only a small amount of electricity is used at the rinsing step to re-compress PE to the high pressure. The overall energy consumption is 12.8 kWh of electricity per ton PE. This is much lower than that of the benchmark process. Table 5.1 Input parameters for the P/VSA-based PE/PA separation. Source: [5]/with permission of John Wiley & Sons. The large process variations are attributed to the significant differences in adsorption isotherms. As shown in Figure 5.5a, Cu-BTC has a poor PE desorption capability. A tough vacuum condition (i.e. 0.011 atm) is needed to meet the purity and recovery requirements. This leads to a large energy consumption at the rinsing and desorption stages. For the h-MOF, the isotherms can provide a better condition for adsorption and desorption. The PE loading difference between 1 and 2 atm reaches 0.7 mol kg−1. Such a gap at desirable pressures facilitates PE desorption and recovery. With the isotherm parameters of the h-MOF, the initial selectivity at the adsorption condition (2 atm and 300 K) is calculated to be 33.9. This is much larger than that of Cu-BTC, due to its much less PA adsorption capacity. Such a large selectivity helps achieve a high PE purity. On the other hand, due to the large PE adsorption capacity of Cu-BTC, the benchmark process has a higher PE production rate than our optimal process, although it needs a longer duration for one process cycle. Based on the above analysis, several adsorbent design guidelines are extracted. First, a large selectivity and small PA adsorption capacity are beneficial for better PE purity and recovery. Second, the PE adsorption capacity has a substantial effect on its production rate. This agrees with the previous literature findings [25]. Finally, to enable an energy-efficient separation, the adsorbent should offer a good adsorption–desorption balance that can better match the feed gas conditions. Figure 5.5 Adsorption isotherms at 300 K for (a) Cu-BTC and (b) Optimal h-MOF. Source: [5]/with permission of John Wiley & Sons. Table 5.3 lists the optimal MOF descriptor values. Important information can be drawn for the subsequent MOF matching. For the pore geometry, a relatively small cavity diameter and volumetric surface area are preferred. The former improves the selectivity of PE over PA, and the latter may result in a small adsorption capacity of PA, helping increase the selectivity as well. For MOF chemistry, using transition metals is desirable. Transition metals (e.g. copper and zinc) can introduce OMS and π-complexation, which lead to stronger interactions with PE than with PA. Regarding the organic linker, it is better to use the groups consisting of rings and double bonds as well as C–N bonds. Finally, it is not recommended to use organic linkers forming C–O pairs at topological distance 2 (i.e. with C–X–O chains), such as benzoic acid and furan. Table 5.2 Optimal results of the Cu-BTC based process and the h-MOF based process. Referring to the method from Iyer and Hasan [28], property–performance relationships of adsorbents are constructed by sampling various isotherms followed by process optimizations. By doing so, the obtained results can reveal the inherent correlations between adsorption equilibrium and process feasibility. To be consistent with step one, the binary-component DSL isotherm model in Eqs. (5.21) and (5.22) is used to represent adsorption equilibria, respectively. Table 5.3 Optimal MOF descriptors. Source: [5]/with permission of John Wiley & Sons. where the subscripts E and A denote PE and PA, respectively. qeq is the adsorption loading at pressure P. y is the molar fraction in the gas phase. Q and b are DSL model parameters. Clearly, the thermodynamic properties of any MOF can be characterized by the eight model parameters. From the process perspective, the eight parameters determine the adsorption process performance. Different combinations of the eight parameters were sampled for PSA optimization. All the model parameters refer to 300 K. The Latin hypercube sampling approach was used to generate samples randomly and uniformly. Additional constraints were added to ensure that the samples were distributed around the optimal isotherms obtained in the first step. The detailed constraints are given below. Considering the computational burdens of complex PSA process optimization, 400 samples were generated. The PSA process configuration and models used are the same as those above. 400 NLP optimization problems were solved. Not all the isotherms can satisfy the separation specifications. After analyzing optimization results, two feasibility maps were obtained and shown in Figure 5.6. Figure 5.6a shows the feasible regions with respect to the single-component adsorption loadings at 2 atm. Within the sampled space, when the PA adsorption loading at 2 atm ( Figure 5.6b shows the feasible map with respect to adsorption uptakes at 0.01 atm (q0.01) that are Henry’s constants. The samples can be roughly divided into feasible and infeasible regions. After a linear classification, a linear classifier model (see black dot line) was obtained to separate the whole region into two. With the extracted slope and intercept, the constraint in Eq. (5.25) must be satisfied to ensure that a sample is located in the feasible region. Clearly, the two constraints represent the quantitative correlations between adsorption properties and process feasibility. The single-component PE and PA adsorption loadings at 300 K can be directly predicted with the 19 MOF descriptors and pressure using the established ANN models. To validate the reliability of the two constraints, the process feasibility of the 471 CoRE MOFs was investigated. The single-component isotherm models of the 471 CoRE MOFs were fitted via collected adsorption loadings. The fitting was performed using the lmfit package with the Levenberg–Marquardt algorithm. The resulting models were used to predict the PE and PA adsorption uptakes at 0.01 and 2 atm. Based on the predicted loadings, the 471 CoRE MOFs were verified against the two feasibility constraints. 15 CoRE MOFs meet the 2 constraints. Figure 5.6 Feasibility maps based on (a) adsorption loadings at 2 atm and (b) adsorption loadings at 0.01 atm for deriving property–performance relationships. Source: [29]/with permission of John Wiley & Sons. Moreover, PSA process optimization was performed for the 471 CoRE MOFs, which gives the true process performance. The multicomponent DSL isotherm models in Eq. (5.2) were derived and imported into the PSA process model for optimization. Finally, 9 CoRE MOFs can meet the required separation specifications. Eight out of nine CoRE MOFs meet the two feasibility constraints except for FIQCEN (i.e. Cu-BTC), since its PA adsorption uptake at 2 atm is 7.76 mol kg−1, which breaks the first feasibility constraint. In summary, the results demonstrate that the two constraints can filter out MOFs that are infeasible to achieve the pre-specified separation requirements. The best of the 471 CoRE MOFs is SEYDUW, which refers to (μ3-N-(phosphonomethyl)iminodiacetato)-diaqua-yttrium-monohydrate [54]. The corresponding minimum energy consumption is 91.99 kWh per ton PE. This can act as a new benchmark for the subsequent computational MOF design. As the core of the second step, new MOFs were computationally designed for PE/PA separation. Proper MOF building blocks were first identified. Then, hypothetical MOFs were synthesized and in silico screened to identify top candidates leading to better PE/PA separation performance. For MOFs, at least one type of metal node must exist, and some topologies need to be constructed with more than one type of organic node. Different types of metal/organic nodes have different coordination numbers that determine the number of organic linkers connected to them. Due to the complex MOFs structures, there are multiple ways to dissect MOFs into different building blocks [55]. Figure 5.7 shows a general procedure for extracting MOF building blocks for in silico MOF synthesis. For an MOF in the form of cif file, the open-source program ToposPro can be utilized to analyze its topology, and its metal/organic nodes can be identified as well. Afterward, MOFs can be viewed in material studio to identify organic linkers. Meanwhile, the nodes and linkers can be manually extracted after deleting all other atoms in the MOF using material studio. The extracted nodes and linkers can be used as building blocks for computational MOF synthesis. Following the above procedures, the topology, nodes, and organic linkers of the 471 CoRE MOFs were analyzed, identified, and extracted. The detailed structural decompositions are summarized in the GitHub folder. Notably, the following heuristics were considered to discard unusable building blocks. Figure 5.7 Generation of MOF building blocks from the 471 CoRE MOFs. Source: [29]/with permission of John Wiley & Sons. Regarding the PE/PA separation, the design guidelines from the first step were taken into account. In total, 69 topologies, 90 metal nodes, 54 organic nodes, and 99 organic linkers were obtained from the 471 CoRE MOFs. The corresponding “cif” files have been uploaded to the GitHub folder. The abundance of building blocks obtained above offers an extensive design space. Due to the limited computational resources, only the 27 topologies requiring one type of node (i.e. metal node) were adopted. In other words, none of the organic nodes were considered for MOF synthesis. Table 5.4 lists the three-letter symbols of the 27 topologies and the coordination of the required metal node (i.e. the number of free connections). Given this simplification, Figure 5.8 shows the workflow for the computational MOF synthesis and screening. First, using the finalized building blocks, hypothetical MOFs were generated and their descriptors were calculated. Then, model-based screening was performed to identify promising MOFs. Their feasibilities were further assessed using rigorous GCMC simulations. Finally, PSA process optimization was performed to identify the real optimal MOFs. The detailed procedures and models are elaborated below. Table 5.4 27 topologies for computational MOF design in the PE/PA separation example. Source: [29]/with permission of John Wiley & Sons. The ToBaCCo 3 was employed for in silico MOF synthesis. Hypothetical MOFs were constructed on the basis of topological templates. Each template consists of information on the number, coordination, and symmetry of the metal nodes. Node symmetry represents the spatial arrangement of connected organic linkers. During construction, the coordination compatibility between topology and metal node is tested. A topology is incompatible with a metal node when its node coordination is different from that of the metal node. Based on MOF chemistry, some other factors (node symmetry, bond connectivity, etc.) are checked for sound feasibility. The detailed algorithms in ToBaCCo can be found in previous publications [55, 56]. Here, the 90 metal nodes and 99 organic linkers in the form of cif files were imported into the nodes and edges folders in ToBaCCo, respectively. The 27 topological templates are found in the ToBaCCo template database. With these, the differential evolution algorithm in ToBaCCo was used for structural scaling. As a result, 45 472 hypothetical MOFs were generated and stored in the form of cif files. Figure 5.8 Workflow of the computational MOF synthesis and screening. Source: [29]/with permission of John Wiley & Sons. Given the 45 472 hypothetical MOFs, the candidates leading to the best process performance should be identified. For this, calculating adsorption isotherms is a prerequisite. It is computationally demanding to perform rigorous GCMC simulations for all the candidates. Alternatively, the ANN-based isotherm models obtained in the first step can be applied for a model-based screening where only the 19 descriptors need to be calculated in advance. The open-source toolbox OpenBabel was used to convert the original MOF cif files into molfiles (.mol) and XYZfiles (.xyz) [57]. The molfiles were analyzed using the cheminformatics package RDKit to get detailed information on atoms, bonds, and groups. Accordingly, the 10 chemical descriptors can be calculated based on their definitions given in the first step. Additionally, the XYZfiles and the PoreBlazer 4 program were applied for computing geometric descriptors [58]. Depending on the topology, the computed geometric descriptors were scaled to a primitive cell level. On average, it takes around five minutes for a single CPU node to compute the 19 descriptors for a single MOF. The descriptors of the 45 472 hypothetical MOFs have been uploaded to the GitHub folder. Model-based MOF screening was performed using the material–property–performance relationships. First, the values of the 19 descriptors were sent to verify whether they were in the validity domain of the ANN-based models. Similar to the first step, the constraints on the lower and upper bounds (Eq. (5.11)) and the one-class SVM classifier model (Eqs. (5.9) and (5.10)) are considered here. After applying the validity domain constraints, 4269 MOF candidates were retained. For these MOFs, their PE and PA adsorption uptakes at 0.01 and 2 atm were predicted using the ANN models in Eqs. (5.1) and (5.2). With the predicted uptakes, the process feasibility constraints in Eqs. (5.24) and (5.25) were tested for all the 4269 MOFs. Only 364 MOFs are left and considered feasible for further studies. These 364 MOFs and their corresponding descriptors are tabulated in GitHub. The single-component PE and PA adsorption loadings at two pressure levels (0.01 and 2 atm) and 300 K were predicted with rigorous GCMC simulations for the remaining 364 MOFs. The open-source software RASPA was used for computation [59]. All MOFs were rigid, while PA and PE were flexible including intramolecular interactions for bonds, angles, and torsions. 105 Monte Carlo cycles were simulated including 5 × 10⁴ initialization and 5 × 10⁴ equilibrium cycles. Each cycle includes four possible motions (translation, rotation, reinsertion, and swap) with equal probability. The fugacity coefficient was 1. The Ewald summation method was applied to calculate electrostatic interactions with a relative precision of 10−6. The interaction energies were computed through the Lennard–Jones (LJ) potentials. The LJ parameters for adsorbent atoms were taken from the universal force field. The adsorbates were combinations of CH3, CH2, and CH. Their LJ parameters were from the TraPPE–UA force field. The Lorentz–Berthelot mixing rule was chosen and the cutoff distance was defined as 12 Å. The GCMC results are given in the GitHub folder. Only six MOFs meet the two feasibility constraints in Eqs. (5.24) and (5.25). These six MOFs were sent to PSA process optimization for quantifying their process performance. To do this, GCMC simulations were carried out to calculate the adsorption loadings of PE and PA at five different pressure levels (i.e. 0.01, 0.1, 1, 2, and 5 atm) and 300 K. The results were used to fit the DSL isotherm models in Eq. (5.2) for process optimization. Again, for the six MOFs, their complete GCMC results are provided in the GitHub folder. After fitting the DSL parameters for the six MOFs, six isothermal PSA optimizations were performed. Three of the six candidates meet the 99% purity and 30% recovery requirements. The three computationally synthesized MOFs are named as SMOF-1, SMOF-2, and SMOF-3. Figure 5.9 shows SMOF-1 and the corresponding projection to the X–Y plane. It consists of a 6-coordinated iron (Fe) metal node and pyrazine (C4H4N2) organic linker assembled in the sxb topology. The metal node and organic linker are extracted from CoRE MOF LEMNOH and FUDQIF, respectively. For SMOF-1, the optimal PSA process operating conditions are listed in the fourth column of Table 5.2. The adsorption is performed at 1.44 atm, which is lower than the initial pressure 2 atm of the feed gas but higher than the atmospheric pressure. Thus, no gas compression is needed at the pressurization and adsorption steps. Desorption occurs in a vacuum condition of 0.3 atm. Energy is consumed for gas evacuation during desorption and for gas compression at the rinsing step. Comparing the results of SMOF-1 with SEYDUW, it is found that their operating pressures are very different. For SEYDUW, the high and low pressures are 2 and 0.41 atm, respectively. The energy consumed at the rinsing step is 46.15 kWh per ton PE, which is much larger than that of SMOF-1 (24.68 kWh per ton PE). This is because SMOF-1 has a smaller gap between the high and low pressures and hence less energy is needed to re-compress the gases during rinsing. Figure 5.9 Computationally synthesized SMOF-1 (visualized by VESTA software). Source: [29]/with permission of John Wiley & Sons. In fact, the root reasons for different results can be explained by their different adsorption isotherms. As shown in Figure 5.10, SMOF-1 exhibits a larger gap of PE and PA isotherms than SEYDUW. The initial selectivity of SMOF-1 at the adsorption condition is calculated to be 10.1, larger than that of SEYDUW. This contributes to the production of high-purity PE products. Furthermore, SMOF-1 offers improved adsorption and desorption conditions. The PE loading difference between 1.44 and 0.3 atm already reaches 0.58 mol kg−1, facilitating the attainment of the desired 30% PE recovery. By contrast, for SEYDUW, a large pressure drop between adsorption and desorption (i.e. from 2 to 0.41 atm) is needed to ensure that enough PE is adsorbed and recovered. This directly leads to a higher energy consumption at the rinsing step. The third column of Table 5.2 lists the optimal process target obtained from the first step. Clearly, the process performance led by SMOF-1 is worse than that of the optimal process target. In other words, there are still substantial spaces for finding new MOFs whose isotherms can be closer to the optimal isotherm target. Figure 5.10 Single-component adsorption isotherms for (a) SMOF-1, (b) SEYDUW. Source: [29]/with permission of John Wiley & Sons. This chapter presents a new two-step framework for integrated MOF and PSA process design. In the first step, MOFs are denoted as a set of selected descriptors serving as design variables. Data-driven models are developed to describe the valid descriptor design space and to predict the adsorption isotherms. Combining the validity model, isotherm model, and PSA process model, the integrated design problem is formulated as an NLP problem where MOF descriptors and process operating conditions are simultaneously optimized. In the second step, multiple computational tools and in-house programs were used for in silico MOF synthesis and screening. Based on the optimal isotherm targets, the explicit relationships between adsorption properties and process feasibility were identified to develop model-based constraints for fast preliminary MOF screening. MOF building blocks were generated from 471 CoRE MOFs to create new hypothetical MOFs. The created MOF candidates were screened using the model-based constraints. In addition, GCMC simulations and PSA optimization were performed to further screen the MOFs. The best MOF candidate was identified, which shows a much better PE/PA separation performance than the benchmark CoRE MOF SEYDUW. The largest novelty is the use of multiscale modeling approach to integrate the variations of MOF chemistry and structure into PSA process design. This provides a reliable and efficient way for computational adsorbent design to maximize the practical adsorption process performance.
5
Innovation of Gas Separation Processes: Integrating Computational MOF Design and Adsorption Process Optimization
5.1 Introduction
5.2 Step One: Descriptor Optimization
5.2.1 Material–Property Relationship of MOFs
5.2.1.1 MOF Representation
5.2.1.2 Data-Driven Model for Single-Component Adsorption Isotherm
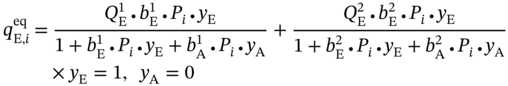
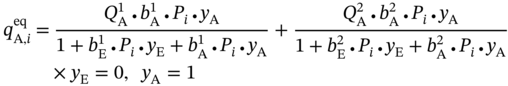
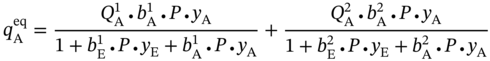
5.2.1.3 Multicomponent Dual-Site Langmuir Isotherm Model

 and
and  ) at pressure Pi can be calculated from the multicomponent DSL model by assuming that only one component exists.
 ,
,  ,
,  ,
,  ,
,  ,
,  ,
,  , and
, and  ) can be obtained.
5.2.2 Integrated Optimization of MOF Descriptors and PSA Operating Conditions
5.2.2.1 Descriptor Design Space


5.2.2.2 P/VSA Process Model
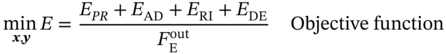
 is the weight of purified PE produced in one process cycle. The equations for calculating these variables are given in the GitHub [49].
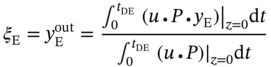
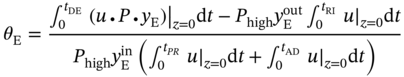
 ) in the outlet stream of desorption. PE recovery is expressed in Eq. (5.19). The bottom and top of the column are defined as z = 0 and z = L, respectively. L denotes the column length. u is the interstitial velocity, P represents the total pressure, and
  is the molar fraction of PE in the feed gas.
5.2.2.3 Integrated Design Formulation


5.2.3 Results
5.2.3.1 Benchmark Process Using Cu-BTC
5.2.3.2 Optimal MOF and Process from Integrated Design
Molecular weight of PE (g mol−1)
42.1
Molecular weight of PA (g mol−1)
44.1
Gas viscosity (kg m−1 s−1)
8 × 10⁻⁶
Isentropic coefficient of gas
1.15
Adsorbent particle density (kg m−3)
703
Adsorbent particle radius (m)
5 × 10⁻³
Mass transfer coefficient for PA (1/s)
0.83
Mass transfer coefficient for PE (1/s)
0.61
Bed porosity
0.43
Vacuum pump efficiency
0.75
Bed length (m)
2
Compressor efficiency
0.75
Bed diameter (m)
0.4
Pressurization duration (s)
1−50
Adsorption duration (s)
1−200
Rinsing duration (s)
1−100
Desorption duration (s)
1−600
High pressure (bar)
1−10
Low pressure (bar)
0.01−1
Benchmark
Optimal process
Process using SMOF-1
Process using SEYDUW
PR duration (s)
22.5
13.0
12.2
30
AD duration (s)
71.5
22.1
30.3
10.1
RI duration (s)
77.0
5.6
6.4
5.0
DE duration (s)
600
600
600
600
High pressure (atm)
1
2
1.44
2
Low pressure (atm)
0.011
1
0.3
0.41
PE purity
0.99
0.99
0.99
0.99
PE recovery
0.34
0.30
0.30
0.30
PE production rate (mol s−1)
0.16
0.06
203.6
117.8
Initial selectivity at high pressure
6.6
33.9
10.1
7.2
Energy consumption at pressurization (kWh per ton PE)
0
0
0
0
Energy consumption at adsorption (kWh per ton PE)
1.2
0
0
0
Energy consumption at rinsing (kWh per ton PE)
184.3
12.8
24.68
46.15
Energy consumption at desorption (kWh per ton PE)
319.3
0
47.75
45.84
Total energy consumption (kWh per ton PE)
504.8
12.8
72.43
91.99
5.3 Step Two: MOF Matching
5.3.1 Material–Property Relationship of MOFs
5.3.1.1 Property–Performance Relationship for PE/PA Separation
Descriptor
Value
Descriptor
Value
Bulk density (g cm−3)
1.9
Number of atoms
230
Pore-limiting diameter (Å)
5.9
Number of metal atoms
46
Largest cavity diameter (Å)
7.0
Number of transition metal atoms
46
Volumetric surface area (m2 cm−3)
279.4
Number of double bonds
14
Void fraction
0.82
Number of ring bonds
332
Unit cell length a (Å)
7.2
Number of bonds to metal atoms
18
Unit cell length b (Å)
11.0
Number of alkyl groups
5
Unit cell length c (Å)
7.5
Frequency of C–N at distance 1
0.45
Volume per unit cell (Å3)
589.1
Frequency of C–O at distance 2
0
Number of non-H atoms
230
 and
and  were sampled within 0.01–6 mol kg−1, while
  and
and  vary within 0.01–4 mol kg−1. The affinity parameters
  ,
,  ,
,  , and
, and  were allowed to vary between 0.01 and 20 (1/bar). In addition, the samples whose PE and PA adsorption loadings at 2 atm exceed 5 and 2.5 mol kg−1, respectively, were discarded.
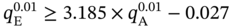
 ) exceeds 2 mol kg−1, the isotherm samples cannot achieve a feasible separation. Therefore, as written in Eq. (5.4),
  is expected to be less than 2 mol kg−1 for feasible PE/PA separation.
5.3.1.2 Validation with 471 CoRE MOFs
5.3.2 From Computational MOF Design to Model-Based MOF Screening
5.3.2.1 Identification of MOF Building Blocks
5.3.2.2 In Silico Synthesis of Hypothetical MOFs
Topology
Coordination of metal node
Topology
Coordination of metal node
srs
3
uni
4
ths
3
uog
4
atn
4
usf
4
cag
4
bnn
5
cds
4
sqp
5
dft
4
acs
6
dia
4
lcy
6
dmp
4
pcu
6
lon
4
rob
6
lvt
4
sol
6
qtz
4
sxb
6
sod
4
bcu
8
sra
4
hex
8
unc
4
5.3.2.3 MOF Screening via Validity and Feasibility Constraints
5.3.2.4 MOF Screening via GCMC Simulations
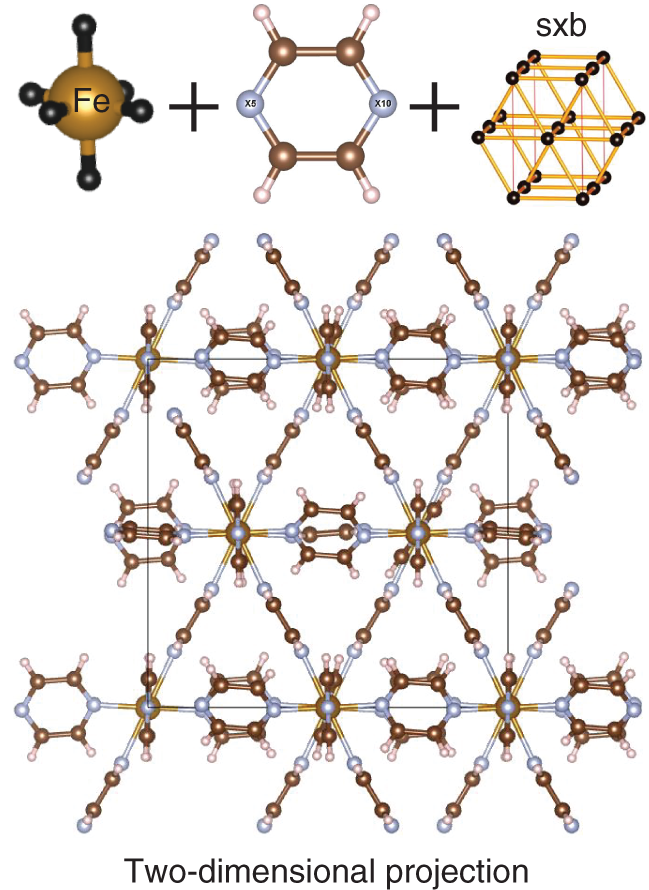
5.3.2.5 MOF Screening via PSA Process Optimization
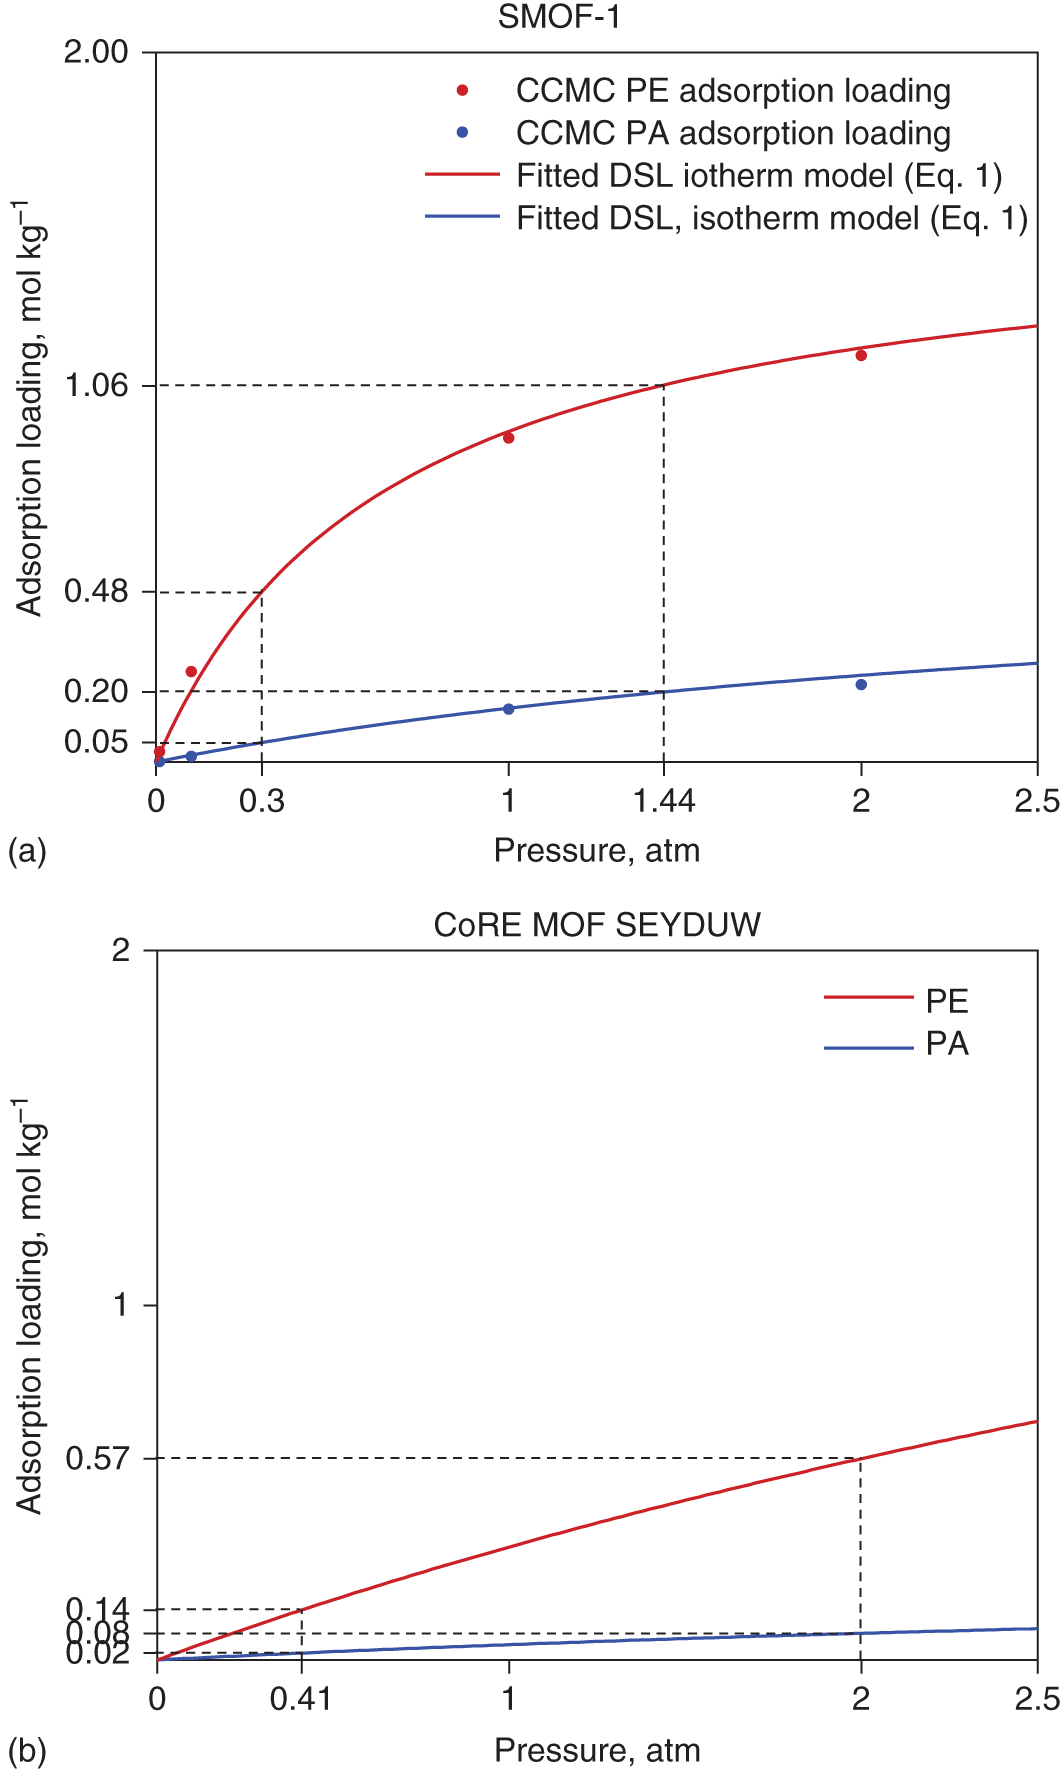
5.3.2.6 Optimal Results of SMOF-1
5.4 Conclusion
References
Innovation of Gas Separation Processes: Integrating Computational MOF Design and Adsorption Process Optimization


(5.3)

(5.5)
(5.6)

(5.12)
(5.13)
(5.14)
(5.15)
(5.16)
(5.17)
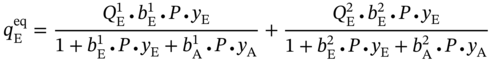
(5.23)