“Nobody wants failures. But you also don’t want a good crisis to go to waste” —(Professor Henry Petroski, in his book “Success Through Failure”, Princeton University Press, 2006) Items 8 and 9 in Section 1.3 highlight the importance of learning about the column and/or event history. The question, “What are we doing wrong now that we did right before?” is perhaps one of the most powerful troubleshooting tools available. The most common technique is identifying the time when the problem initiated and simply plotting synchronized operating charts for key variables at around that time on a single plot. With the aid of this plot, carefully review the sequence of events. This type of analysis can reveal not only what the problem is but also what initiated it and how it progressed to give the apparent symptoms. Below are some guidelines: Contributed by M. Harrison, Eastman Chemical, Kingsport, Tennessee. The operation team called the troubleshooter to the control room because “the tower did not make on-spec products.” A review of the operation charts (Figure 9.1a) showed that the tower was flooded. This is evidenced both by the dP rise and the reduction in bottom flow. The operating team was aware of the flooding but stated that the tower products were off-spec even before the column flooded. Figure 9.1a confirms this by showing the reflux increasing well before the tower flooded, evidently with the intent to improve product purity. Rolling back the charts to the start of the reflux rise (Figure 9.1b) indicates that at that time the tower was again flooded. This is evidenced by the high dP, but this time the base level and bottom flow rate were also high. With an ordinary flood, the bottom flow rate and base level tend to fall as liquid accumulates in the tower. Figure 9.1c shows the initial event. The bottom pump was temporarily lost, causing the base liquid level to go up. The bottom level indicator initially showed a level increase, but then leveled off as it reached the maximum of its range. The liquid level kept on rising, now into the trays, as evidenced by the increase in tower dP. A while later, the pump came back on and intensely pumped out the base liquid. The liquid accumulation in the tower was interrupted, and the dP first leveled off, then started to decline (Figure 9.1b). Soon later, the bottom level came back to normal. The dP did not fall back to normal; it fell to a value below normal, suggesting some trays collapsed or were damaged during the high liquid level event. At the same time, the reflux started increasing in an endeavor to meet the desired purity with the reduced number of trays. Raising the reflux and boilup brought the tower to flood (Figure 9.1a), still without getting the product back on-spec. Figure 9.1 Operating charts of a high liquid level damage incident (a) final charts, indicating rise in reflux leading to flood in the tower; (b) intermediate charts, showing rise of reflux following a flood incident; (c) initial charts, showing high liquid level that caused tray damage. (From Harrison, M., in H. Z. Kister, “Distillation Troubleshooting,” John Wiley and Sons, NJ, 2006. Reprinted with permission.) This case provides a classic illustration of the importance of studying the history of an event (or the tower) and the sequence of events. A high pressure tower (201) equipped with a vertical thermosiphon reboiler removed lights from water-insoluble organic high boilers. Tower bottom at about 180°C contained a small fraction of water. The tower experienced cycling of the heating medium flow and bottoms level. Figure 9.2a is an event timing chart. The dip in the heating medium flow rate indicates reduced boiling. This was caused by the boiling point of the organics approaching the heating medium temperature. Over a period of time, or due to operation changes, the concentration of low-boiling water in the tower base was depleted, raising the base temperature. The reboiler temperature difference declined, and the boiling was largely ceased. With little boilup, lights-rich liquid from the trays was dumped into the base, which raised the bottom level. The lights restored the reboiler temperature difference, the reboiler took off, and the heating medium flow rate surged. After stabilizing, the lights and water were slowly boiled off and depleted from the base, and the cycle repeated. Figure 9.2 Reboiler surge incident (a) Operating charts; (b) raising bottom draw-off to avoid depletion of water eliminated the surging. ((Part (a): From Kister, H. Z., “Distillation Operation,” Copyright © McGraw-Hill, 1990. Used with permission of McGraw-Hill. Part (b): From Kister, H. Z., “Distillation Troubleshooting,” John Wiley and Sons, NJ, 2006. Reprinted by permission.) To cure, the reboiler drawoff was elevated to about a foot above the bottom (Figure 9.2b), so that water accumulated below the bottom draw nozzle and went back to the reboiler. This ensured the reboiler always received some water and eliminated the surges. Kister, H. Z., and T. C. Hower, Ref. 222. Reprinted Courtesy of the American Institute of Chemical Engineers. A vertical thermosiphon reboiler on a demethanizer was heated by condensing refrigerant vapor (201, 222). Condensate flow from the reboiler was controlled by the control tray temperature (Figure 9.3a). During low-rate operation, the tower was overreboiled because bottom purity was critical, while the overhead purity was less important. During this operation, the bottom product went off-spec. An event timing analysis (Figure 9.3b) shows a slight drop in the tower control tray temperature. The controller raised the reboil. This should have raised the control temperature back up, but it did not. The temperature continued dropping. A switch of the controller to manual slowed down, but did not stop the temperature drop. The low temperature induced methane into the bottom stream, getting it off-spec. The operating charts show that the control system responded as expected. A drop in temperature led to opening the control valve, increasing the refrigerant (heating medium) flow rate. This increase should have brought the temperature back up, but it did the opposite: it caused a loss of heat transfer. When a control valve is at the outlet of the reboiler (Figure 9.3a), it holds a liquid level in the reboiler shell, which covers a portion of the tubes. This level also liquid-seals the reboiler, preventing vapor from escaping with the condensate. When the rate of flow through the outlet valve exceeds the rate at which vapor condenses in the reboiler, the liquid level, and therefore the liquid seal, may be lost. When the seal is lost, vapor channels through the reboiler without condensing, and condensation dramatically falls. Figure 9.3 Reboiler seal loss incident (a) Demethanizer using reboiler heated by refrigerant vapor; (b) Operating charts. (From Kister, H. Z., and T. C. Hower, Jr., Plant/Operations Progress, 6(3), p. 151, 1987. Reprinted with permission.) To re-establish the condensate seal, the condensate outlet flow was largely reduced by heavily throttling the outlet valve (Figure 9.3b). Once the seal was re-established, column operation returned to normal. To avoid seal loss, another plant monitored the condensate temperature. When a liquid level is held in the reboiler, the condensate comes out subcooled. A rise in the condensate temperature signals an approaching loss of the reboiler seal, and the operator can take timely action. Adapted from Kister, H. Z., and D. W. Hanson, “Control Column Pressure via Hot Vapor Bypass,” Chemical Engineering Progress, p. 35, February 2015. In a hot vapor bypass control scheme for total condensers (no vapor product), the condenser area is partially flooded by condensate. Condensation takes place only in the unflooded area. Tower pressure is controlled by manipulating the unflooded area. Raising condenser liquid level reduces the condensation area, raising tower pressure. Conversely, lowering the condenser liquid level increases condensation area, and lowers tower pressure. The flooded area performs little condensation, but it subcools the condensate. Further discussion is available in Refs. 206 and 221. Figure 9.4 shows a typical pressure control by hot vapor bypass. In this scheme, the condenser is at ground level, while the drum is elevated, often mounted on the lowest platform. Typically, the liquid level in the condenser is 10–20 ft below that in the drum. The vapor pressure difference between the condenser liquid surface, which is at the bubble point temperature, and the drum liquid surface, which is colder due to condensate subcooling, lifts the condensate to the drum. Figure 9.4 Hot vapor bypass control scheme. (from Kister, H. Z., “Practical Distillation Technology”, course workbook. Copyright © Henry Z. Kister. Reprinted with permission). Even a few degrees of subcooling can lower the vapor pressure tremendously and lift the condensate from 50 to 100 ft, and even more. However, the drum liquid surface is heated by the condensation of hot vapor from the bypass. As process liquids are good thermal insulators, it is the hot surface temperature, much hotter than the subcooled bulk liquid underneath, that sets the vapor pressure, and therefore the pressure, in the drum. Tower pressure is controlled by varying the liquid lift from the condenser to the drum. Opening the bypass valve heats the drum liquid surface, raising the drum pressure. This pushes liquid from the drum into the condenser, flooding more tubes, reducing condensation, and therefore raising the tower pressure. Conversely, closing the valve cools the drum liquid surface, reducing the drum pressure, and sucking liquid from the condenser to the drum, unflooding tubes, and therefore lowering tower pressure. In one C3–C4 splitter with the hot vapor bypass control of Figure 9.4, the condenser liquid level was 10–12 ft below the drum liquid level. The control usually worked well at a tower overhead flow rate (reflux plus product) of less than 25,000 BPD. At higher flow rates, especially in the summer, there were frequent episodes of the drum suddenly filling up. The drum level controller would increase reflux rate, the condensate temperature rose, and the condenser appeared to lose its seal. The drum level would then sharply drop, the reflux rate plummet, and the reflux pump cavitate. To restore stability, it was necessary to cut back reflux. This restricted the tower and gas plant capacity. A similar instability at times occurred at lower rates. Per guideline 5 in Section 9.1, we chose to analyze the sequence of events in Figure 9.5, which occurred at lower rates (17,000 BPD of reflux plus product) because at these rates no variables went off-scale, and the condensate seal was not broken, as evidenced from the condenser outlet temperature remaining unchanged. Referring to Figure 9.5, at about 10:40 p.m. the differential pressure across the hot vapor bypass jumped from the normal 4.5 psi to 7 psi in about one minute, and to 12 psi within five minutes. Over the same five minutes, the tower pressure decreased only slightly from 289.5 psig to 288.5 psig, raising the valve opening from 50% to 80%, while the drum liquid level jumped from 40% to 80%. Over the next 15 minutes, the pressure drop, valve opening, and drum liquid level returned to their pre-event values, while the tower pressure slightly rose to 290.5 psig. Boilup, reflux and product flow rates, and condenser outlet temperature did not change significantly during the event. To analyze such events, the control valve opening changes as well as the drum level changes need to be translated into flow rate changes (item 3 in Section 9.1). From the control valve characteristic, a plot of flow versus valve opening at various valve pressure drops was prepared and showed that opening the valve from 50% at 4.5 psi pressure drop to 80% at 12 psi pressure drop increased the vapor flow rate through the valve from 5500 lb/h to 31,000 lb/h (221). Over the five-minute event, with approximately a linear increase in valve opening and pressure drop, an additional 1000 lb of vapor entered the drum (above the normal rate). The drum was of 9 ft diameter, just over 20 ft long (tangent to tangent). To raise the drum liquid level from 40% to 80% on the level transmitter takes 21,000 lb. This is a huge movement of liquid over five minutes, tripling the quantity of liquid entering the drum, from 17,000 BPD to about 50,000 BPD. Determining where this huge amount of liquid can come from is the key to diagnosing the root cause of this event. From the control valve calculation above, the additional amount of vapor entering the drum would account for about 1000 lb. Condensation of the drum vapor which was replaced by the liquid during the event would account for another 2000 lb. This leaves 18,000 lb unexplained. Figure 9.5 Operating charts of a hot vapor bypass upset event. (From Kister, H. Z., and D. W. Hanson, Chemical Engineering Progress, p. 35, February 2015. Reprinted Courtesy of Chemical Engineering Progress (CEP). Copyright © American Institute of Chemical Engineers (AIChE).) Ambient condensation was considered. Records from the nearby airport show light rain, easing off and intensifying, ambient temperature of about 63°F and wind of about 4 miles per hour with occasional gusts to 20 miles per hour. For a change in heat transfer coefficient of 15 Btu/h per °F per ft2 upon the onset of a sudden heavy rain, the condensation rate on an uninsulated vessel would rise by about 2000–3000 lb/h. Over five minutes, a heavy rain accounts for additional liquid generation of 200 lb, too little to impact the 18,000 lb liquid movement. One conceivable source remains: liquid sucked from the condenser into the drum. There were two condensers in parallel, each 46 in. diameter and 20 ft long. The condenser shells held approximately 8000 lb of liquid when full. Based on the condenser areas and heat transfer coefficients, we estimate that during the low rate operation of Figure 9.5 (17,000 BPD reflux plus product) at relatively cold ambient temperatures, only about 25% of the condenser heat transfer area performed condensation. So the condenser shells contained only about 6000 lb of liquid, well short of accounting for the large liquid movement of 18,000 lb. However, emptying all the liquid from the condensers would quadruple the tube area exposed to condensation. The liquid generated by quadrupling the condensation area (from 25% to 100% five minutes later) is calculated at about 16,000 lb. Adding this liquid to the 6000 lb drained from the condenser gives 22,000 lb, in excess of the 18,000 lb increase in the drum liquid. This means that some liquid stayed in the condenser shells, retaining the condenser liquid seal and the subcooled outlet temperature, as observed in Figure 9.5. The intensified condensation rate reduced the tower pressure, and the pressure controller rapidly opened the hot vapor bypass valve, eventually catching up with the disturbance. The drum liquid surface heated up, the drum vapor pressure rose, the liquid returned to the condenser, column pressure rose back up, and normal operation resumed. The relatively large liquid inventory in the condenser shells provided a cushion against complete emptying of the condenser liquid during the Figure 9.5 event. This inventory was large due to the colder cooling water (as can be inferred from the low condenser outlet temperature) and the low rate of operation. At warmer ambient temperatures and/or higher plant rates, the liquid inventory in the condensers was smaller, making it much easier to lose the condenser liquid seal. This was the experience described earlier at high reflux plus product rates, especially during the summer. Initiation It takes a very strong suction to move 18,000 lb of liquid in five minutes. Figure 9.5 shows a fast rise in control valve differential pressure, i.e., of the difference between the tower and the drum pressures. Since the tower pressure changed only slightly (Figure 9.5), the big change was in the drum pressure, eight psi over five minutes. From a vapor pressure–temperature relationship (e.g., the Antoine Equation), an eight psi vapor pressure reduction corresponds to cooling of the liquid surface of the drum by only 2.5°F (221). We searched for the source of a 2.5°F cooling of the drum surface temperature. A heavy rain would have increased the condensation rate only by 2000–3000 lb/h (see earlier), easily offset by the additional 25,000 lb/h flow rise through the hot vapor bypass. Further, many episodes occurred under dry conditions. This source was therefore ruled out. Hot vapor impingement ruffling the liquid surface was also ruled out. At the beginning of the event the vapor velocity was only about 6 ft/s, giving a ρvV2 of 100 lb/ft s2, too low to ruffle the liquid surface 5 ft below (where ρv. is vapor density, lb/ft3, and V is vapor velocity at the drum inlet nozzle, ft/s). Also, this vapor flow rate was common during normal operation. During the first minute, the valve pressure drop rose from 4.5 psi to 7 psi, which corresponds to a drum surface temperature decrease of 1°F. At the drum pressure of 285 psig the corresponding liquid surface temperature was 125°F, much hotter than the 66°F of the bulk subcooled liquid (Figure 9.5). Replacing as little as 1.5% of the hot drum liquid surface by subcooled liquid can explain a temperature drop of 1°F and corresponding pressure fall of 2.5 psi. This puts the liquid entry in focus. The liquid entered the bottom of the drum via a 6″ nozzle, at an upward velocity of 5.7 ft/s, slightly exceeding the good design practice of 4 ft/s max. With the liquid level only 3.7 ft above, the initial momentum may have raised a jet of the subcooled liquid to the surface, possibly piercing the hot liquid surface. This may even occur during normal operation, with some surface cooling by the rising jet balanced by some of the hot vapor. A step-up of the subcooled liquid reaching the surface may offset the balance. Just prior to the pressure differential rise, the tower pressure fell by about 0.5 psi and the drum level rose by about 2–3% (Figure 9.5). Both indicate a step-up in condensation rate, possibly due to heavy rain hitting the drum vapor space. The drum pressure fell, sucking liquid from the condenser. A level rise of 2% in the drum is equivalent to about 1000 lb. Sucking 1000 lb from the condensers would raise the area available for condensation by around 50%, quickly reducing the tower pressure. The pressure drop across the hot vapor bypass remained constant at that time, meaning that both the drum and tower pressures fell by the same 0.5 psi. The additional condensate flow, about 1000 lb in two minutes, would increase the liquid inlet velocity to the drum from 5.7 ft/s to 7 ft/s. The higher velocity intensified the incoming jet, raising more subcooled liquid onto the liquid surface. A self-accelerating “fountain” set in. The additional subcooled liquid cooled the surface, the drum pressure fell, sucking more liquid from the condenser, the jet and the fountain intensified, the surface further cooled, sucking more liquid, and so on. At the pressure differential peak, the liquid jet velocity exceeded 15 ft/s, high enough for the jet to break through the liquid surface, even at 80% drum level. Solution Field measurements (221) showed that increasing the pressure drop in the lines leaving the condenser can mitigate the self-accelerating process. A manual throttling valve was installed in the line from the condenser to the drum (Figure 9.4). The dP across the valve is measured locally, regularly checked by the operators, and maintained at 2 psi. The valve severely limits the rate of increase in liquid flow to the drum, giving the hot vapor a chance to catch up. This completely eliminated the problem. The modified system can now run the reflux plus product up to even 40,000 BPD during both summer and winter with no instability. Adapted from Kister, H. Z., “Reboiler Circuit Debottleneck with No Hardware Changes,” Chemical Engineering, p. 30, August 2017. A deethanizer stripper reboiler circuit bottlenecked a newly built gas plant. The stripper was a 15′–6″ tower equipped with four-pass conventional valve trays with moving round valves. A preferential baffle in the tower base divided it into separate reboiler draw and bottoms product draw compartments. Liquid from the bottom tray was diverted into the reboiler draw compartment (Figure 9.6) using strategically placed notches in the bottom tray seal pan. The reboiler return internal piping had cutouts that directed the vapor–liquid mixture returning from the reboilers toward the bottom draw compartment (Figure 9.6). The purpose is to divert all the bottom tray liquid to the reboiler compartment and all the reboiler return liquid to the bottoms product draw compartment. Any excess bottom tray liquid not boiled by the reboilers overflowed the baffle into the bottoms product draw compartment (207). Boilup to the deethanizer stripper was supplied by four horizontal thermosiphon reboilers, arranged in two parallel circuits, “A” and “B” (Figure 9.6). The lower reboiler in each circuit (E-4A or E-4B) was heated by hot naphtha liquid, while the upper reboiler (E-3A or E-3B) was heated by high-pressure steam. In each circuit, the design heat duties of the naphtha and steam reboilers were 32 MM Btu/h and 40 MM Btu/h, respectively. Liquid to the reboilers was supplied from the reboiler draw compartment via a 24″ pipe that was split into two 18″ pipes, each feeding one circuit. From each circuit, the reboiler effluent returned to the tower via a 24″ line. Initial Performance To stabilize the tower at the low rates during start-up, steam was taken out of reboiler E-3A, creating a steady steam flow through the E-3B. Afterward, the plant had been unable to re-establish flow through the E-3A/E-4A reboilers. For the next six months, the E-3B/E-4B circuit did all the reboiling. Figure 9.6 compares typical operating data from 6 months after startup to the design. The A circuit had no boiling and no significant liquid circulation, as indicated by the zero steam flow through E-3A and the insignificant temperature difference across the heating side of E-4A. Steam to E-3B was maximized, but this was not enough to make up the lost duty of E-3A. Figure 9.6 Deethanizer stripper reboiler circuits. (From H. Z. Kister, Chemical Engineering, August 2017, p.30. Reprinted Courtesy of Chemical Engineering.) Troubleshooting To provide gas lift that would jump-start the thermosiphon through the A circuit, nitrogen was injected for four to six hours through a bleeder valve immediately downstream of E-3A. This action was unsuccessful. This was surprising, as gas lifting in other reboilers (192, 201, 233) had been successful. An event timing analysis focused on the change from the initial operation, with both the A and B circuits active, to the B circuit only shortly after stripper startup (Figure 9.7). Before 22:30, at a stripper feed rate of about 1700 BBL/H (barrels per hour), both E-3A and E-3B reboilers operated stably with a steam flow rate of about 32,000 lb/h to each. For both E-4A and E-4B reboilers, the naphtha entered at about 400°F and exited at about 320°F, a healthy temperature difference. At 22:40, the stripper feed rate plunged to about 1200 BBL/H. To improve stability, the steam flow to E-3A was cut to about 8000 lb/h, with the steam flow to E-3B unchanged. The temperatures of naphtha into and out of E-4A became the same, about 360°F, indicating it stopped heating. The A-circuit stopped circulating. Simultaneously, the naphtha outlet temperature from E-4B decreased to about 260°F, indicating that this reboiler was working much harder. The next day, the feed rate to the stripper rose again to 1500 BBL/H, but the A circuit remained inactive. Opening and closing the steam valve to E-3A did not re-establish circulation. This event timing analysis diagnosed the existence of two hydraulic steady states, with an easy switchover from two-reboiler circulation to one. A likely root cause would be low pressure drop in the reboiler circuits. A review of the licensor’s design confirmed a low design pressure drop, about 11 ft of liquid head, which would be less at the low operating rates. With 19 ft elevation difference between the tower tangent line and the bottom of the naphtha reboiler, the liquid level would be in the 24″ reboiler liquid inlet pipe, well below the reboiler draw compartment. At a low liquid head, resistance to flow is small, so fluids tend to form their preferred flow patterns. Two steady states can form: (1) the two reboilers operating simultaneously, as intended, and (2) all the boiling in one reboiler, the other filling with liquid to the liquid height in the reboiler liquid inlet pipe. Once the one-active-reboiler steady state was formed, the 8000 lb/h still going to E-3A after midnight on the second day in Figure 9.7 would strip the lights out of the near-stagnant reboiler liquid. High-boiling components would remain, making this liquid difficult to boil. This stabilizes the one-active-reboiler steady state, and it will persist. Gamma and neutron scans can test the above theory. Both the gamma and neutron scans measured 10–12 ft of liquid in the bottom product draw compartment, in full agreement with the level instrument. Both gamma and neutron scans showed no liquid level in the reboiler draw compartment, supporting the two steady state theory. Figure 9.7 Process data for initial operation of stripper reboiler circuits. (From Kister, H. Z., Chemical Engineering, p. 30, August 2017. Reprinted Courtesy of Chemical Engineering.) Solution A switch from the stagnant “A” reboiler steady state back to the two active reboilers steady state can be achieved by raising the liquid head in the reboiler draw compartment. The higher head will raise the pressure drop through the active reboiler circuit, inducing some of the liquid to follow the easier path (less pressure drop) and circulate through the inactive reboiler. This circulating liquid will bring lights with it, get heated, start boiling, and establish the thermosiphon in the previously inactive circuit. To build level in the reboiler draw compartment, the level in the bottoms product draw compartment was raised by reducing the bottoms flow rate until the level overflowed the baffle. The bottom product draw compartment was kept full, with the overflowing liquid filling the reboiler draw compartment. The tower differential pressure transmitter was closely watched to prevent the high liquid level from ascending to the trays and causing flooding and possible damage there (Section 2.13). Once the level in the reboiler draw compartment increased to 13 ft, the steam flow to the E-3B reboiler sharply fell (indicating less liquid to the B side) and the E-4A hot-side temperature sharply decreased, both indicating that the “A” reboilers were starting to circulate liquid. Steam was quickly opened to E-3A to sustain “A” reboiler circulation. Almost immediately, even split and duties were established between “A” and “B” circuits. Bottoms product flow was increased, baffle overflow discontinued, and bottoms level was returned to normal. The column remained prone to steady state switches, possibly because of some weeping from the bottom tray liquid bypassing the reboiler side of the baffle, and the reboiler continues to stall periodically. The procedure of raising the liquid level in the product draw compartment to switch steady states has been executed several times to regain lost reboiler circulation. A refinery kero side stripper (Figure 9.8) had problems meeting the kero flash point spec. The kero flash point indicates the concentration of lights in the kero. Not meeting the flash point spec means that the lights are not adequately stripped from the kero bottom product. The stripper worked well until an incident in which the unit had to shut down the fractionator top pumparound (TPA) and use more drum reflux to compensate. The drum reflux was cold (100°F) and wet. During the incident, water separation in the reflux drum was poor due to the larger flow through the drum, so water and salts could have entered the fractionator, causing corrosion and fouling. Salts or corrosion products would end in the kero stripper feed from tray 11. Before the incident, the delta T (kero draw temperature from the fractionator minus stripper bottom temperature) was 40°F, indicating excellent stripping, and there was no problem meeting the kero flash point spec. Increasing the steam flow rate increased the temperature difference and raised the kero flash point as expected. Following the incident, the delta T dropped to 30°F and the flash point decreased. Increasing the steam flow rate no longer increased the delta T nor raised the flash point. A review of the post-incident bottom level operating charts showed two distinct operating modes (Figure 9.9a). In one mode, the stripper bottom level fluctuated wildly, about 20% peak to valley. With a level transmitter span of 48″, this comes to about 9″. The peak-to-valley period was about five minutes, so the movement came to about 40 gpm, a small fraction of the feed rate of about 730 gpm. The draw line from the tower to the stripper was 14″ diameter, large enough for self-venting flow (Figure 4.9). When the level fluctuated, so did the temperatures of the stripper vapor return and of the stripper bottoms. Before the incident, the vapor return and stripper bottom temperatures were 430°F and 390°F, respectively. Gamma scans with the stripper in a fluctuating mode showed the pan distributor flooded, with liquid accumulation about 10 in. above the risers. Figure 9.8 Atmospheric crude fractionator and the kero side stripper that experienced flash point problems. Sometimes the stripper switched to another operating mode (Figure 9.9a). The switch happened very quickly. In the second operating mode, there were no fluctuations but the separation deteriorated. The bottom level became steady (Figure 9.9a). The flash point dived; at times, the stripper could not meet the flash point spec. When this happened, the unit needed to raise the crude fractionator overhead temperature from 250°F to 270°F to reduce the lights content of the stripper feed and thus keep the kero flash point on spec. The stripper vapor return and bottom temperatures became the same. The stripper was 6.5 ft in diameter and contained random packings. The orifice pan distributor (Figure 9.9b) had 16″ tall rectangular risers. At 730 gpm, we calculated a liquid head of 2.5″ using Eq. 4.2. This means that there should have been no overflow unless more than half the holes were plugged. One thing that looked suspicious on the scan is that the top foot of packing in the stripper was missing. It may well be that these packings were uplifted into the distributor, causing the plugging or aggravating it. The parting box sat right on top of the risers (Figure 9.9b), there was no clearance between them. The risers were discontinued under the parting box, so that liquid can equalize as it leaves the parting box. The total riser area was about 24% of the tower cross-section area. The gamma scans showed buildup of liquid level at about 10 in. above the top of the risers, which is near the top of the parting box. This liquid could not descend into the risers, because the risers’ vapor velocity exceeded the system limit. We estimated a risers C-factor (Eq. 2.1) of 0.88 ft/s. This is likely to cause liquid buildup above the risers. It is quite conceivable that when enough liquid piled up above the risers it would dump. So the fluctuations are likely to have been caused by intermittent liquid buildup and dump. Figure 9.9 Kero stripper two steady states (a) Bottoms level operating chart, showing two modes of operation; (b) Packing distributor plan. Under certain conditions, the liquid accumulation may have become unequal on both sides of the parting box. When this happened, vapor would tend to channel through the risers that saw the lower liquid head. As the vapor velocity through the risers increased, liquid would dump through the risers on the opposite side of the parting box. The system limit would disappear, and the liquid would descend freely through the risers on one side of the parting box while vapor would ascend through the risers on the opposite side. This would give a very stable flow and eliminate the entrainment, flooding, and fluctuation. However, the channeling would produce very poor separation, as was being experienced. During a startup of an atmospheric crude tower (Figure 9.10), five trays below the feed inlet (“flash zone”) and six trays above the feed (the trays between the feed and the bottom pumparound (BPA) draw) were severely damaged (Figure 9.11). The intensity of the damage exceeded expectations. The Pressure Spike Incident In this refinery, crude feed was pumped by the cold crude pumps via preheat exchangers (to 250–300°F) to a large settling drum (a desalter) where free water and salts were removed. From the desalter, the crude was pumped by booster pumps through additional preheaters and then a fired heater. Effluent from the fired heater entered the flash zone of the crude fractionator, as shown in Figure 9.10. The key events that led to the pressure spike were: Figure 9.10 Atmospheric crude fractionator that experienced startup damage. Figure 9.11 One of the severely damaged trays above the feed of a crude fractionator. Figure 9.12 Operating charts for pressure surge (a) tower pressure; (b) feed, bottoms, and overflash flows; (c) temperatures. Event Timing Analysis Just before the loss of feed flow (10:55), the fractionator established a preliminary temperature profile (Figure 9.12c). Bottom temperature was about 410°F, flash zone about 430°F, heater outlet temperature about 440°F, diesel draw 355°F, kero draw 285°F, tower top 285°F. This suggests the presence of low boiling components on the trays at and above the kero draw, which was 18 trays above the flash zone. When the incident happened, the pumparounds were not yet established. The reported level at 11:02 was at 39 ft. Normally, this would be about 6 ft below the bottom of the feed entrance nozzle but above the top stripping tray. The location is somewhat uncertain because the startup liquid in the tower bottom had different specific gravity than the normal liquid. At the time, stripping steam (Figure 9.10) was not used, indicating the stripping section contained liquid rather than froth, so the level measurement is unlikely to have been adversely affected by frothing. At 11:03, the bottom level plunged from 39 to 31 ft over less than two minutes (Figure 9.12b). From the tower geometry, 8 ft of liquid in the bottom of this tower contain about 140 barrels of liquid. Between 10:58 and 11:03, the feed rate to the crude tower was much lower than that between 10:15 and 10:58. The bottoms flow rate remained unchanged (Figure 9.12b). Roughly, over the five minutes of lower feed rate, the tower received 160 barrels of feed less than it would have received at full feed. This feed reduction fully accounts for the 140 barrels drop in the liquid level (above). When the booster pump stopped (about 11:00), the bottom and flash zone temperatures were 420°F and 440°F, respectively. By 11:03 (until the pressure spike peaked), these temperatures dropped to 375°F and 390°F, respectively, a 50°F drop (Figure 9.12c). The only source of cooling would have been liquid from the cooler upper trays dropping into the bottom. Liquid on the upper trays in the crude tower was around 290–350°F (Figure 9.12c). The liquid would dump to the bottom once the feed (vapor source) stopped. Figure 9.12b shows a large spike in overflash flow rate during that time, probably augmented by liquid weeping through the trays. Some of this liquid would vaporize upon contacting the hot liquid in the bottom, resulting in cooling the bottom liquid. The rest would mix with the bottom liquid. Very rough estimates would give 100 barrels at a median temperature of 320°F to cool around 700 barrels of bottom liquid by 45°F. Most of this liquid vaporized. Assuming a liquid inventory per tray of about 1–2 in., the total liquid inventory on the trays between the feed and the top of the tower would be about 100–200 barrels, which is well in line with the above approximations, suggesting that much of the upper trays liquid dumped between the feed interruption and the pressure spike. This is a not surprising considering a typical time constant per tray is 0.1 minute. At 11:03, hot feed (heater outlet temperature of 460°F) contacted the flash zone liquid at 390°F. The flash zone quickly heated to 460°F and the pressure spiked. We estimate that the heat in the hot feed liquid was capable of vaporizing about 50 barrels. That is, not accounting for any heating of the bottom liquid. However, the bottom liquid heated by about 30°F, which will account for most of the heat in the hot liquid feed. This suggests that most of the heat in the hot liquid feed was used for heating the bottom liquid, not for vaporizing. A rough calculation, based on the column volume and gas laws, shows that to give a pressure spike of 13 psi takes a vapor accumulation in the tower equivalent to about 40 barrels. The total vaporization rate for such a pressure spike would be much higher, possibly double (80 barrels), as some of the vapor generated was condensed in the overhead condenser and in heating the upper sections of the tower. It therefore can be concluded that the heat in the hot liquid feed alone was far too little to effect the vaporization rate required to generate the observed pressure spike. This leaves water. The conceivable source is dumping from the upper trays during the feed interruption. At 10:00, about an hour before the upset, temperatures as low down as the kero draw, 18 trays above the feed, were only about 210°F, so it is conceivable that pockets of water were present on the upper trays. These pockets would probably have taken some time to descend from the upper trays to the flash zone. The pockets could have got to the flash zone just at the time when the feed resumed. Upon contacting the 460°F feed, the water would vaporize rapidly, generating the pressure surge. Due to the low molecular weight of water, only a small amount of water would be needed to generate the observed pressure surge. The top stripping tray contained special tall weirs for directing the feed liquid to the inlet regions of the top tray. These weirs may have formed ideal pockets for water trapping. Adapted from Bernard, A., “Distillation Tower Startup Following a Plant Revamp with Focus on Reboiler Operation,” Topical Conference Proceedings, Kister Distillation Symposium, AIChE Spring Meeting, Houston, Texas, March 12–16, 2023. Background The ethylene fractionator is the product tower in an ethylene plant, separating a pure ethylene top product from an ethane bottoms stream that is recycled to the thermal cracking reactors (furnaces). Figure 9.13 is a typical simplified flow scheme. Due to the high ethylene purity and the closeness of the boiling points between ethylene and ethane, ethylene fractionators contain a large number of trays (commonly between 80 and 120), are operated at high reflux to distillate ratios (commonly 2.5–3.5), and are of large diameter (10–20 ft common). Often, the tower overhead is condensed by boiling low pressure propylene refrigeration, while the reboiler is heated by condensing high-pressure propylene refrigeration vapor. With these utilities the tower operates at high pressure, typically 200–300 psig. Here and in Figures 13 and 14, the acronym “C3R” denotes propylene refrigeration. Unique Features In this installation, the tower had two parallel symmetrical reboilers. The reboilers process inlet nozzles were about 17 ft below the tower tangent line, and the reboilers process outlet nozzles were 6 ft below the tower reboiler return nozzles. Normal Startup Procedure The ethylene fractionator in this plant is started on total reflux. The tower is first freed of nitrogen in a series of steps of pressuring and depressuring with ethylene vapor from the pipeline. Once nitrogen-free, the tower pressure is raised with ethylene vapor to near its normal operating pressure, at which point ethylene can be condensed. The condensate flows to the reflux drum. Once the liquid level in the drum rises high enough, a small reflux flow is started. This liquid descends through the trays and reaches the bottom sump. In preparation for liquid arrival at the bottom sump, the vapor valve to the reboiler is cracked open to warm up the reboiler. Once the liquid reaches the bottom sump, the reboiler starts boiling. A liquid level in the condensate pot indicates that the reboiler has started working. As more liquid arrives at the bottom sump, boilup is increased. The tower internal circulation rate is driven by the reboiler duty. The reflux drum level control adjusts the reflux in response to changes in reboiler duty. Managing the reflux drum and bottom sump inventory is critical for ensuring smooth startup. The boilup is increased stepwise, with each step small enough to avoid a large drop in tower sump level, and allowing sufficient time for the reflux to compensate. Aggressive raises in C3R vapor to the reboiler drop the sump level, which may affect, and even stall, the reboiler and the startup. Figure 9.13 Simplified scheme of a typical ethylene fractionator, showing the controls relevant to event timing analysis in Section 9.1.9. (from Kister, H. Z., “Practical Distillation Technology”, course workbook. Copyright © Henry Z. Kister. Reprinted with permission). As vapor condenses and the condensed vapor fills up the trays, downcomers, and sumps, liquid inventory in the reflux drum and bottom sump is depleted, so ethylene makeup needs to be added to the tower to maintain the inventories. Event Timing Analysis At one startup, instability delayed establishing a stable total reflux operation for several hours. An event timing analysis was performed to understand the root cause and to improve future startups. Figure 9.14 shows operating charts for the key variables, plotted against time in minutes. For good analysis, the charts are subdivided into seven intervals, as advocated in Section 9.1.1. Figure 9.14 Ethylene fractionator transition to total reflux (a) Levels (b) Flows. (From Bernard, A., “Distillation Tower Startup Following a Plant Revamp with Focus on Reboiler Operation,” Topical Conference Proceedings, Kister Distillation Symposium, AIChE Spring Meeting, Houston, Texas, March 12–16, 2023. Reprinted Courtesy of Andre Bernard.) Improving Startup Procedure The event timing analysis paved the way for understanding the problem and for an improved procedure that would shorten startup by about 10 hours. Intervals 3, 4, and 5 can be eliminated by bringing up a large external makeup once the cycling between the reflux drum and bottom sump starts and by ensuring enough C3R flow to the reboiler to overcome its turndown limitation. Another lesson taught was the criticality of keeping a bottom sump level high enough to permit good thermosiphon action. At low sump level, the circulation of liquid in a thermosiphon reboiler stops (192), and so does heat transfer. In this case, the limitation was particularly severe due to the low process velocities at the reboilers at low sump levels and the 6 ft long height between the reboiler process outlet and the tower reboiler return nozzle. Bernard’s article (30) presents a detailed analysis of the heat transfer turndown limitation. Last but not least, this case illustrates the value of event timing analysis to understand interaction of variables and to improve startup and plant operation. Item 11 in Section 1.3 highlights the importance of “checking the patient’s responses.” Making small, inexpensive changes, one at a time, and monitoring the column’s response provides invaluable information for diagnosing the problem. The key is to perform each of these changes judiciously, one step at a time. Performing several steps simultaneously makes it difficult, even impossible, to identify the step that made the difference, and may lead to an incorrect diagnosis. Previous chapters of this book identified the variety of diagnostic techniques available to troubleshooters. This section demonstrates how these techniques can be combined to reach the correct diagnosis. The cases illustrate the stepwise approach and how to learn the most from field tests. Lessons from plant tests include: This was the largest debutanizer tower the author has ever seen (216). It was serving three fluid catalytic cracking (FCC) units in a refinery. The tower was built in the 1970s. Years later, as the plant rates were raised beyond the original design, a reboiler bottleneck was encountered. In the 1990s, the reboiler was replaced by a new larger one, and feed rates were raised. At the higher rates, the tower ran into flood initiating near the tower bottom at 80% of the calculated flood point. Observations and checks by the plant bred many alternative theories. The author was invited to join the troubleshooting team. At the kick-off meeting, the unit process engineer jotted down the 12 theories on the white board, briefly describing each. Some theories suggested it was a vapor flood, others a liquid flood. The author spoke: “It may be a good idea to perform some vapor and liquid sensitivity tests” (Section 2.7; the column control system was as per Figure 2.4). For the sake of the unfamiliar, during the meeting, the author described these tests, as explained in Section 2.7. But as the author was speaking, he noticed one of the operations team members getting uncomfortable. It was not long before he stopped the author. “Let me tell you something about OUR column. Right now, I have 40,000 BPSD reflux going into the column. If I add another 1000, make it 41,000, it’s going to flood like you ain’t seen a column flood before. So I don’t need to do no sensitivity tests. You ain’t gonna get more than 40,000 BPSD without flooding it.” The author turned to him and asked, “Does the experience that you are describing happen only when the temperature control is in automatic, or does the same thing happen when the temperature control is in manual?” Had the flooding occurred at 40,000 BPSD when the temperature control was on manual, then it would have pointed to a liquid flood, in which case there would have been no need to perform the liquid sensitivity test. His plant observations would have sufficed. The vapor sensitivity test would still have been needed. He replied, “I don’t need to run no temperature control on manual. You ain’t gonna get more than 40,000 BPSD out of it without flooding.” We talked to other operation people. No one had any recollections of having the temperature control on manual. The team decided to proceed with the tests. With the temperature control on manual, we raised the reflux to 61,000 BPSD. The column was drawing straight lines. There were no signs of flooding whatsoever. We then reduced the reflux back to 40,000 BPSD. The steam rate was 150,000 lb/h. As soon as we raised it to 155,000 lb/h, the tower flooded like the author had never seen a tower flood before. He was right about that. The test conclusively established that the flood was a vapor flood, with no sensitivity to liquid rates. We increased the liquid rate quite a bit, but the tower did not respond. We went back to the white board, Out of the 12 theories we scratched seven out. Every theory arguing a mechanism that has liquid sensitivity was invalidated. We went down from 12 to five. Per Section 2.2, a vapor flood can be a jet flood, a downcomer backup flood, a system limit flood or a downcomer unsealing flood. Gamma scans can give insight as described in Sections 5.5.2 and 5.5.3. We therefore gamma-scanned the tower. During this time the temperature control was run in automatic. As recommended in Section 5.3, item 6, we performed flooded and unflooded active area scans. In the unflooded scans, froth heights in the loaded areas were 16″ out of 24″ tray spacing, and the vapor peaks were near the clear vapor line. The vapor and liquid rates were raised by as little as 3% and the trays flooded. Per reasoning in Section 5.5.2, this denied jet flood. At 97% of jet flood, the dispersion would have been close to 24″ tall, and no clear vapor would have been observed. In the absence of tray damage, downcomer unsealing flood is highly unlikely, as this tower operates at high liquid loads. As system limit is an ultimate jet flood, it too was denied. So this left us with a vapor sensitive downcomer backup flood. This finding ruled out two more theories that argued a jet-flood type mechanism. We went down to three theories. One theory that is well consistent with a vapor-sensitive downcomer backup flood is plugging (Section 2.2). To evaluate this theory, it is important to learn about the tower history. There are two types of history: ancient and modern. Both need to be evaluated. Ancient history: the tower has been in existence since the 1970s. Has tray plugging been experienced? We checked with the operations team, some of them have been in the plant all these years. The answer was negative. Neither fouling nor plugging has ever been experienced in this tower. Modern history: When did the problem initiate? Immediately after startup or many months into the run? Many months into the run would support a plugging or fouling theory. The answer was immediately after startup, as soon as the limiting rate was reached. The bottleneck did not get better or worse since. The trays were well inspected at the turnaround, they were clean and have not been changed since the 1970s. Not done yet. Next question: Were there any events during the startup or initial operation that could have plugged or damaged the trays? Look for high base levels, pressure surges, feed contamination, high dP at startup rates. We talked with the operations team, and critically reviewed the startup records. None. It was a very smooth startup. Our history study taught us that plugging or damage is unlikely. One more theory crossed out. The number of theories was down to two. The two remaining theories were liquid maldistribution in the four-pass trays and issues due to a poor design of the chimney tray below the bottom tray. This tray collected liquid from the bottom tray and sent it to the reboiler. It was oriented at 45° to the tray above and was poorly designed. To check on the liquid maldistribution theory, we gamma scanned the active areas of two adjacent side and center passes, as described in detail in Section 5.5.7 (this is the same tower). The gamma scans provided non-conclusive evidence supporting this maldistribution theory. There was no need to go further. The corrective action would be to replace the trays, including the chimney tray, with well-designed ones. The question of whether the chimney tray was a bottleneck or not is of academic interest only. This case demonstrates how a step-wise testing procedure can narrow in on the likely root cause. This case demonstrates the importance of using plant data and experience in developing effective theories (218). A chemical tower processed different liquid feeds when running different campaigns. At the rate-controlling campaign, feed to the tower (Figure 9.15a) was organic chemicals, plus 2–3% water, 2000 ppm dissolved NaCl, and 100 ppm dissolved CaCO3 salts. The 23″ ID tower had five packed beds, the bottom three filled with a proprietary small random packing, and the top two with 1″ Pall rings. After six years of smooth operation, the feed and bottom distributors were replaced by high-performance distributors to improve separation. A year and a half later, instability set in, forcing a feed rate cut from 130 lb/min to 100 lb/min. Following a startup, the column would operate well for a day or two with the normal expected temperature profile. Then the temperatures below the feed would gradually decline. When the temperature about 3 ft above the bottom (T1) dropped to 90–95°C, the bottom pressure started increasing, eventually reaching 42 in w.g. Simultaneously, temperature T2 would decline to 85°C. The local pressure gauges indicated that most of the increase in pressure drop was in the stripping section, but on more than one occasion it was observed in the section above the feed. As a temporary cure, operators cut boilup, which lowered the bottom temperature from normal 148°C to 100°C. During this time, they diverted the off-spec bottoms to the feed tank. An hour later, they raised the bottom temperature back to 148°C and diverted the bottoms back to the product tanks. The tower stayed good for a day or two, after which the procedure needed repeating. Rinsing the tower with water from the top stretched the well-behaved run to two to three days. After a month, the tower was water-rinsed and then opened. The rings in the bed just below the feed were taken out of the tower. The surface of some of them was covered with calcium carbonate. No deposits were found in the distributors. Any water-soluble deposits would have been washed in the water rinse. Figure 9.15 Chemical tower that experienced salt plugging (a) the tower (b) the feed distributor (c) the previous feed distributor. (From Kister, H. Z., and S. Chen, Chemical Engineering, p. 129, August 2000. Reprinted Courtesy of Chemical Engineering.) A pressure survey during one of the runs measured 50 in. w.g. pressure at the bottom, 42 in. w.g. between the two bottom packed beds, and 10 in w.g. above the feed distributor. This indicated flooding below the feed, which was believed to be due to plugging of the small packings. The plant decided to replace the small packings below the feed by a larger packing of the same type. The tower had more separation stages than needed (when clean), so losing some separation due to the larger packings was not an issue. The result was disappointing. Run times between plugging episodes did not change. This argued against packing plugging, as the larger-size packing should have helped. Hydraulic calculations showed that with clean packing, the bottom bed operated at 65% of flood, and the next bed operated at 54% of flood. This shifted attention to the distributors (Figure 9.15b). Each distributor had 30 drip tubes, 7/8″ ID and 7″ tall, and five 10″ tall chimneys. Each drip tube had a 0.2″ hole at 1″ above the bottom plate and a second 0.35″ hole 4 in. above the plate. Each of the 30 drip tubes extended 2″ below the plate. The feed liquid entered via an elbowed-down 1.5″ feed pipe that discharged liquid from a height of 2″ onto the center of the hat covering the center chimney of the feed distributor. Calculations using the orifice equation (Eq. 4.2) showed that the distributor liquid levels should be 4.5–5 in. at 100 lb/min feed, rising to 5.5 in. at 130 lb/min feed. The actual levels may have been a little higher due to frothing, but in the absence of plugging, they should have remained below the top of the drip tubes. The calculations also showed that had the lower 0.2″ holes plugged, the liquid level would exceed the top of the drip tubes at feed rates just below 115 lb/min, and the liquid above the top of the tubes would be entrained into the next bed. Plugging of the 0.2″ tubes was quite plausible. When the tower was opened to change packings, many of the 0.2″ tubes were plugged, even after the water rinse. The important next step is to check the distributor plugging theory against field observations, as follows: With the theory matching all the field observations, the solution was to modify the two old lower distributors below the feed (those that worked before their replacement). The modifications were to redrill the 30 0.33″ holes to eighteen 0.625″ holes to enhance plugging resistance. As the risers in the old distributors were only 3.5″ tall, reducing the liquid head to 1″–1.25″ for the 130 lb/min feed would give comfortable margin from overflow. It was appreciated that some separation would be lost, but the stripping section had more height than needed, so it was acceptable. With the modifications, the bottom product remained on spec, and the instability totally eliminated, never to return. From Kister, H. Z., “Tower Doctor: Downcomer Unsealing: A Current Diagnosis Brings a Correct Cure,” Chemical Engineering, p. 32, September 2022. Reprinted Courtesy of Chemical Engineering. This case illustrates the importance of analyzing operating experience, performance data, testing theories, and most of all, asking questions, rather than relying on hunches. Following a distillation conference hosted by a simulation vendor, the delegates were bussed to a venue where the simulation vendor put a delicious BBQ. A gentleman sitting next to the author introduced himself. After exchanging a few greetings, he asked “Do structured packings work in the wash section of an atmospheric crude tower?” “They do as long as you have good liquid and vapor distribution and they do not plug” I replied. “Some refiners swear by them. They experience occasional plugging episodes, but are comfortable living with them.” “I was afraid you’ll say that. We have to put these in the wash section of the tower.” “Why? What is wrong with trays?” “Trays just do not work for us. We are struggling with dark gas oil” (this means poor separation in this section). “Had the trays ever worked for you?” “At one time they did. But not any more.” That reply got me. “You went up in rates and then ran into a bottleneck?” “Not really. We have always run 50,000 BPSD crude” “This is getting interesting. Why would trays all of a sudden stop working?” “If you really want to know, I will be happy to tell. At one time trays worked for us. Figure 9.16a shows the tray details. The 12″ nozzle at the bottom is the tower feed. Nozzle 14 is the atmospheric gas oil (AGO) draw. It is a total draw. Reflux is pumped on flow control and returned above it. We ran 1000 BPSD reflux, which is about 2% of the crude feed.” “I would not complain about this. This is a 1–1.5% overflash on the crude, which is excellent. You won’t do much better with packing” (footnote: “overflash” is the term used for the reflux exiting the wash section into the feed zone, as illustrated in Figure 9.10. The temperature there is hotter than the reflux, so on the way down some of the 2% reflux entering vaporizes, so the remaining overflash liquid is 1–1.5% on the crude) “Yes, but these days are gone and we cannot get back to them” “Why?” “About six years ago a vendor reviewed our tower. They were alarmed by the small feed nozzle, so they enlarged it from 12″ to 24″, and added a vane vapor horn distributor (similar to the feed in Figure 9.17) on it. They also added splash baffles on the trays to avoid them drying up, and downpipes on the spent wash to avoid re-entrainment (Figure 9.16b). When we came back on line, we needed to go to 6000 BPSD reflux to get the AGO on color. Actually, once it got on color, we could cut the reflux down to 1500 BPSD. But if we went down below this, it would go dark and we will need to go up to 6000 BPSD to get the AGO back on color.” “We complained to them. They then reconsidered the vapor horn, and in the next turnaround removed it. They also changed the trays. The ones we had before were the venturi moving valves that have smooth orifices and give low pressure drops. They were concerned that these trays will excessively weep, and changed them to moving valves with sharp edged orifices (Figure 9.16c) that are more weep-resistant.” “Did this improve things?” “Quite the contrary. Now we cannot get the AGO on color, even if we run a reflux as high as 15,000 BPSD. We went to different vendors. They all say we need structured packings.” Figure 9.16 Atmospheric crude tower wash section (a) Initial (b) after first set of modifications (c) after second modification. ((From Kister, H. Z., Chemical Engineering, p. 32, September 2022. Reprinted Courtesy of Chemical Engineering.) “There are many towers that have trays working in the wash zone. And the trays worked for you at one time. What I believe you need is troubleshooting to find why the current trays are not working. I smell a downcomer unsealing problem, but need to take a close look at the dimensions and do a few sums.” “If you can find a way to keep trays you will be a hero. But you’d better come up with a good proof that trays will work, because most people in our refinery, including management, are believing the vendors and have given up on trays.” Once we drew the sketches to scale (Chapter 8), the problem became apparent. The 2″ clearances under the center downcomer are just too large for the low liquid rates experienced in the wash section, which typically operates at very low liquid loads. With this large clearance, vapor will break through into the downcomers. With the splash baffles 1.5 in. away from the weirs, and with the draw pan restricting the vapor exit from the center downcomer, the vapor breaking into this downcomer would not allow the liquid in. The middle tray will flood, and the bottom tray will not receive liquid and dry up. There will be no separation, and the AGO will go dark. The problem was introduced by adding the splash baffles. The vendor was right about the venturi valves weeping. This weep was actually beneficial, as it allowed the liquid a path downward by weeping through the valves. Once enough weeping occurred, it would seal the center downcomer, preventing vapor rise through it. This happened at about 6000 BPSD reflux. Once the downcomer was sealed, they could go back down to 1500 BPSD. In the next revamp, the venturi valves were replaced by the sharp-orifice valves that are resistant to weeping. Without weeping there was no way for liquid to go down, so even increasing to 15,000 BPSD reflux would not bring the AGO on color. “Nice theory, but can you prove it?” “Absolutely. We can run a test that will get your AGO on color. You we will need to reduce the charge rate to lower the vapor velocity in the downcomer and allow liquid to descend. We will need gamma scans to watch for liquid in the center downcomer.” We proceeded with, the test in which we used gamma scans to continuously watch the center downcomer (“Time Studies,” Sections 5.2.4). Initially, the center downcomer contained vapor, no seal. Then when the charge rate was sufficiently reduced, the gamma scans saw liquid in the downcomer and the AGO came on color. In the next turnaround, we removed the splash baffles and installed inlet weirs. We also made some modifications to the AGO draw. After these changes, the tower operated at a wash rate down to 700–800 BPSD with the AGO always on color. The takeaway when the patient’s health suddenly deteriorates for an obscure reason, always go back to the last time the patient was well, and investigate all changes from then on. In memory of Neasan O’Shea, a brilliant engineer, a great leader, and a real gentleman and friend. A vital element of troubleshooting highlighted in this section is proper testing of each theory with valid field tests. One good field test can humble thousands of expert opinions (243). In this case, an atmospheric crude tower lost capacity following a retray (by others) with high-capacity trays. A systematic investigation utilizing extensive field tests identified two completely independent root causes for the capacity loss. The diagnosis led to a very simple solution that overcame both bottlenecks, required no hardware changes, circumvented the need to shut down the crude unit, cost little to implement, and recovered most of the losses almost immediately. In the longer term, the diagnosis led to low-cost modifications of tower internals that produced capacities well above the design. Tower Revamp A 4 m ID atmospheric crude tower (Figure 9.17) separated 52,500 BPSD (7070 t/d) crude into an overhead light naphtha (LN) product, a heavy naphtha (HN) side product drawn from tray 23, a diesel product drawn from tray 11, and an atmospheric residue (“resid”) bottom product. The tower contained two pumparounds, which are direct contact cooling circuits: BPA and TPA. The heavies contents of each side product was controlled by manipulating the duty of its adjacent pumparound. The TPA was drawn from a sump just under the downcomer from Tray 21 to Tray 20, the balance overflowing onto Tray 20 to become reflux to the naphtha–diesel fractionation section below. The BPA was drawn from a total draw chimney tray below Tray 9. The level control on the chimney tray manipulated the wash-back, which was the reflux to the wash section below. Initially, the tower contained 34 single-pass jet tab trays. In the early 1990s, the tower sections from tray 20 down were revamped to increase fractionation efficiency and to permit intermittently drawing a kerosene side-cut while maintaining the same throughput of 52,500 BPSD (7070 t/d). The changes are color-marked on Figure 9.17. Trays 11–20 were replaced by single-pass high-capacity Nye trays. The trays in the wash and stripping sections below were replaced by structured packings. A new kerosene side draw was installed at the inlet to Tray 16, and a side stripper was added to strip lights from the kerosene. Initially, the kerosene side draw was not operated because the rundown system was incomplete. After the retray, the tower flooded at throughputs exceeding 38,000 BPSD (about 5200 t/d), well short of the previous 52,500 BPSD, with a rise in pressure drop and excessive heavies in the HN product. Gamma scans showed flood initiating near the unused kerosene draw (around Trays 14–16) and building up to tray 23. The TPA trays 21–23 were jet tab trays and were not changed in the revamp. Figure 9.17 Revamp of the lower section of the crude tower in Section 9.2.5, design conditions. In addition, a severe instability, “Excursion,” set in at about the same rates as the flooding initiated. A relatively small reduction in tower feed temperature (coil outlet temperature, COT) or increase in BPA duty would trigger a massive reduction in tray 10 temperature, usually accompanied by a HN yield loss, with the lost yield showing up in the residue. Nature of the Excursion In an atmospheric crude tower, reducing COT or increasing the BPA duty cools the tower, often inducing distillate loss to the residue. The excursion was an intense, sudden version of this phenomenon that took place at feed rates exceeding 36,000 BPSD (4800 t/d), especially at high diesel product rates. There was an instantaneous large drop in Tray 10 temperature, usually (but not always) accompanied by loss of naphtha yield and gain in residue yield, and by about 5°C cooling on trays 11–23. Two sensors measured tray 10 temperature, one connected to the controller (TRC), the other to an indicator (TI). Normally, both TRC and TI read about 300°C. During excursions, the TRC dropped sharply by about 11°C, but the TI dropped much more, as much as 30–40°C. Historically, the TRC on Tray 10 manipulated the BPA heat duty to control the diesel cloud point at 0°C. After the revamp, the response of the cloud point to the TRC became erratic, and the diesel cloud point could no longer be controlled from the TRC. Early simulation work correlated the excursion with a leak of around 20% of the liquid from tray 11. The tower was briefly shut down and both the diesel draw sump and the BPA chimney tray were water-tested. Neither showed any leaks; both were effectively seal-welded in a previous turnaround. A few popped-out valve caps on tray 11 were reinstated and the joints of tray 11 were seal-welded to minimize leakage. Some minor modifications were made to the diesel draw (below). There was no appreciable improvement in performance upon return to service. Diesel Draw Geometry and Modification Figure 9.18 shows the diesel draw revamp modifications (in pink). Tray 11 downcomer terminated in a seal pan that overflowed into the diesel draw pan. The draw pan floor was 380 mm beneath the seal pan. The draw pan outlet weir rose 290 mm above the top of the seal pan outlet weir. The diesel was drawn by a 12-in. nozzle almost flush with the draw pan floor. The retray reduced the downcomer width from 585 mm to 370 mm. The downcomer clearance was increased from 50 mm to 90 mm, and the seal pan weir height was raised from 50 mm to 115 mm. Figure 9.18 (roughly to scale) shows the location of the TI and the TRC sensors on tray 10. The TI was close to the top of the draw pan overflow weir. During the brief inspection shutdown, in an endeavor to minimize splashing of liquid from the draw pan on the TI, the draw pan outlet weir was raised from 720 to 770 mm and in the vicinity of the TI sensor to 820 mm. Theory 1: A Hydraulic Bottleneck at the Diesel Draw The excursion seemed to take place at a diesel flow rate of about 2000 tons/day (t/d). At 2000 t/d, the liquid velocity at the downcomers entrance was about 0.06 m/s, well below the downcomer entrance flood (downcomer choke) velocity (Section 2.16). The downcomers residence times were well within good design practices (192, 245). A downcomer choke flood was therefore ruled out. Adequate degassing of liquid requires a residence time exceeding 30–60 seconds (Section 2.15, item 1). The degassing time in the revamped downcomer (Figure 9.18) was only 12 seconds. While there is no need to degas downcomer liquid exiting to the tray below, degassing can be important for liquid draws. Without adequate degassing, the diesel draw nozzle and rundown lines need to be sized for self-venting flow (Section 2.15). Figure 4.9 shows that the 12-in. draw line could handle up to 2000 t/d of non-degassed liquid, which coincided with the maximum observed diesel draw rate. Any additional liquid would back up in the draw pan, overflow its weir, and cool down the TI and the TRC. Being closer to the draw pan, the TI cooled down more. The original (pre-revamp) downcomer had twice the volume, doubling the residence time to about 24 seconds, quite close to the time needed for adequate degassing. While the diesel draw nozzle and rundown line were undersized for self-venting flow, they were adequate for degassed liquid. It was therefore theorized that the excursion reflected a diesel draw bottleneck resulting from the reduction in downcomer volume at the revamp. Figure 9.18 Diesel draw revamp modifications. Test 1: Did the Diesel Draw Pan Overflow? To test the above theory, the diesel draw was neutron-scanned at excursion conditions with the diesel draw rate near 2000 t/d. The scans showed that the diesel draw pan contained about 300 mm of liquid or very dense froth, with lower density froth for 255 mm above. The 210 mm above this were clear, showing neither liquid nor froth. The draw pan did not overflow. Theory 1 was disproved. Theory 2: Excursion Linked to Flooding Initiating on Trays 14–16 Some people linked the excursion with the flooding that initiated on trays 14–16. A multitude of gamma scans showing no flood on trays 11–13 argued against this theory, so it was considered unlikely. Nonetheless, good troubleshooting should test both the likely and the unlikely theories (item 15, Section 1.4). Test 2: Would the Excursion Persist with the Flood Eliminated? The tower was set in the “no excursion” mode with the diesel flow near 2000 t/d. Then the BPA duty was raised to about 15%. The TPA duty was reduced by an equal amount, with the feed rate kept constant. This drastically lowered the vapor traffic on trays 11–23 and positively got them out of flood. The result: tray 10 TRC dropped by 23°C, and tray 10 TI by 45°C. The HN product rate dropped by 300 t/d with an equivalent rise in resid production. An excursion took place. In this test, the flooding was eliminated, yet the excursion occurred. Had the excursion been linked to the flooding, it should not have occurred in this test. Theory 2 was disproved. Theory 3: Excursion Caused by Tray 11 Leakage The observation that the excursion occurred upon vapor flow rate reduction, bred the theory that leakage or weeping, not flooding, caused the excursion. With all the liquid from tray 11 removed by the diesel total draw, a mass balance on the BPA gives: Based on equation (9.1), the leakage rate can be measured by monitoring the wash-back flow rate while maintaining the BPA condensation rate (i.e., the BPA heat duty) constant. Test 3: Tray 11 Leakage Test The tower was set at the excursion mode. The tower feed temperature (COT) was raised from 365°C to 370°C. The BPA duty was kept constant by manipulating the BPA flow rate. Raising the COT dropped the wash-back by 160 t/d and the residue make by 100 t/d, and raised the HN make by 120 t/d. Tray 10 TRC rose 14°C, tray 10 TI rose 35°C, and temperatures on trays 16 and 19 rose by about 5°C. The tower got out of the excursion mode. Per equation (9.1), the large observed change in wash-back flow rate at no change in BPA duty was proof that the excursion was due to changes in leakage from tray 11. Theory 4: Excursion Caused by Tray 11 Weep With tray 11 leakage verified, liquid weep from tray 11 raining on the TI and TRC, causing them to drop, became the prime theory. Raising the COT stopped the weep, the TI and TRC dried and heated up. The weep at the TI was larger than at the TRC because the vapor rate at the TI was obstructed by the nearby draw pan. This theory gave simple explanations for all the observations. The difficulty of explaining the suddenness of the change was its only weak link. Also, it needed testing, like any other theory. Test 4: Tray 11 Weep Theory Test Lockett and Banik (300), as well as Colwell and O’Bara (74), found the tray weep rate to primarily depend on the vapor hole velocity. This is consistent with the Test 3 finding that small changes in COT, that change the vapor hole velocity and strongly affect weeping, can get tray 11 in and out of excursion relatively fast. The same authors (74, 300) also found the weep rate to be a much weaker function of liquid flow rate. A “devil’s advocate” test of the weep theory would monitor the response of the excursion to changes in liquid load at constant vapor rate. No response, or a minor response of excursion to mild changes in the liquid load would validate the tray 11 weep theory. For this test, the tower was set in the excursion mode. Both the BPA duty and the COT were kept constant to maintain constant vapor rate to tray 11. The TPA duty was reduced by turning off a fan on the TPA air cooler. This change reduced the tray 11 liquid flow rate at constant vapor rate, and was expected to have no effect on weeping, and therefore, the excursion. The result was amazing. The TRC on tray 10 rose by 12°C and the TI on tray 10 by 35°C. The wash-back rate dropped 260 t/d, the residue and diesel make dropped 100 t/d and 50 t/d, respectively, and the HN make rose 140 t/d. The column coming out of excursion upon liquid flow rate reduction disproved the tray 11 weep theory. The observation that higher HN draw rates got the column out of excursion pointed to a liquid-sensitive, not a vapor-sensitive, bottleneck. This test sent us back to reconsider the initial diesel draw bottleneck (Theory 1). Further testing was needed to verify the strong liquid rate sensitivity. Test 5: Kerosene Mode Tests By this time the kerosene draw was commissioned and provided an invaluable clue. The operators noticed that there were no excursions while the tower operated in the “kerosene mode”—i.e., when kerosene was drawn. Drawing kerosene reduced the diesel make, so the diesel draw bottleneck would not be encountered. To test the revived diesel draw bottleneck theory, we attempted to force an excursion while in the kerosene mode by lowering the COT. In the no-kerosene mode, when the COT was below 363°C the tower seldom got out of excursion. Test 5A: Can Lower COT Bring an Excursion in the Kerosene Mode? The tower was set in the non-excursion mode with 350 t/d of kerosene drawn. The COT was slowly lowered from 371°C to 357°C. The BPA duty and tower reflux were kept constant. To maintain the heat balance, the TPA duty was allowed to decrease. No excursion took place. Both tray 10 TRC and TI cooled down by 15°C. The wash-back did not change. The diesel make dropped by 175 t/d, and the residue make rose by 250 t/d. This test determined that there was very little weep from tray 11, and confirmed that unloading the diesel draw would keep the tower out of excursion. Test 5B On/Off with the Kerosene Draw At different times during Test 5A, we shut (or nearly shut) the kerosene draw-off valve. This could only be maintained for 0.5–1 minute because the surge volume of the kero stripper was small. The results are listed in Table 9.1. Excursion occurred only when the diesel plus kerosene flows exceeded 1960 t/d. It occurred immediately upon valve closure. Excursion Cause The extensive field tests returned us to Theory 1 of a hydraulic limit at the diesel draw at about 2000 t/d. At this draw rate, the flow through the diesel draw nozzle and rundown line switched from self-venting flow to choked flow. Before the revamp, the downcomer from Tray 11 provided 24 seconds of degassing time, sufficient to degas the diesel draw. Both the draw nozzle and rundown line were sufficiently large to handle the degassed diesel flow rate. The revamp halved the downcomer volume, halving the residence time. Twelve seconds of residence time was insufficient to degas the liquid, and it remained aerated. Per the Figure 4.9 correlation, the diesel draw nozzle and rundown line encountered a self-venting flow limit at 2000 t/d. Beyond this diesel draw rate, the vapor bubbles choked the line, backing up liquid in the diesel draw pan. Rain pouring from the diesel draw pan caused the large drop in tray 10 temperature upon excursion. The TI was closer to the draw pan than the TRC (Figure 9.18), so it got wetter and experienced a much larger temperature drop. At diesel draw rates below the self-venting flow limit (about 2000 t/d), there was no rain, and both the TI and TRC read the same. The neutron scans in Test 1 disproved overflow from the diesel draw pan but did not rule out entrainment. Neutron scans provide excellent measurement of liquid levels and froth densities, but only near the tower wall (Section 6.3). To address the flooding in the tower, several gamma scans were previously shot, and were now revisited focusing on the region below tray 11. One scan chord detected a large quantity of liquid in the vapor space right above the draw pan wall in the excursion mode, consistent with extensive entrainment from the diesel draw pan. A plausible explanation for the extensive entrainment is as follows. At non-excursion conditions, flow in the diesel rundown line was self-venting. The aerated liquid comfortably descended, leaving an 80 mm vapor gap between the top of the liquid level in the diesel draw pan and the floor of the seal pan above (Figure 9.19a). Vapor returning from the rundown line spread horizontally through this vapor space. The low vapor velocities generated little entrainment. Upon reaching the self-venting flow limit in the diesel draw nozzle and rundown line, liquid/froth backed up in the diesel draw pan and filled the vapor space between the liquid in the draw pan and the floor of the seal pan above (Figure 9.19b). Vapor returning from the rundown line formed a high-velocity jet that broke through the liquid right near the nozzle. This jet entrained the liquid, which caused excursions. Figure 9.19 How the excursion caused entrainment. Solution The same field tests that diagnosed the root cause of excursion taught that operation in the kerosene mode prevents excursions. The kerosene mode became the normal mode of operation. The economic penalty was minor, as the kerosene product could be blended with the diesel when not desired as a product. An unexpected windfall was that the kerosene mode operation also alleviated the flood, as described elsewhere (244). With the excursions eliminated and the flooding alleviated, the tower throughput soared from 38,000 BPSD to 49,100 BPSD, just a little short of the design capacity. A primary absorber in a refinery fluid catalytic cracker (FCC) gas plant operating at about 200 psig flooded when the lean oil flow rate was 25% below design (125). This 25% needed to be bypassed around the absorber, at the penalty of deficient absorption. Attempts to increase the lean oil rate resulted in a pressure drop increase in the tower and lean oil carryover to the downstream secondary absorber. An engineering contractor study using computer simulation and vendor hydraulic calculations, but without field tests, identified vapor flowing up the downcomer and restricting its capacity to be the root cause. The fix was a retray with fewer valves on the trays and shorter downcomer clearances. Upon restart, the tower flooded when the lean oil rate was 50% below design, worse than before. A postmortem by the contractor concluded that the tower may experience very severe foaming. However, as this service is usually considered mild or non-foaming, the plant doubted the validity of this conclusion and hired a consulting company to conduct a proper troubleshooting investigation. The approach strongly advocated by this consulting company (125, 126, 129, 133, 153) is strategic field testing. This approach is strongly endorsed by the author. The absorber had two intercooler loops of similar design. Figure 9.20a depicts this design. Each intercooler loop condenses some of the tower vapor, so the vapor and liquid loadings below an intercooler loop are usually higher than above. This means the highest hydraulic loadings in the absorber are below the lower intercooler loop. So a regular flood is likely to initiate below the lower loop. Additionally, points of transition (inlets, outlets) are common trouble spots where flooding may initiate (Chapter 8). Test 1. Is a high base level the root cause of flooding? A high base liquid level is a common cause of premature flooding (Section 2.13). To check, the base level was reduced and 50% of the lean oil was bypassed, so the tower was out of flood. The lean oil flow rate was then increased, keeping the level low. The tower dP rose at the same lean oil rate, indicating flooding. This ruled out excessive base levels as the root cause. Test 2. Identifying the flood location With the lean oil 50% bypassed (no flood), a pressure survey was conducted to provide a baseline. The lean oil rate was then increased, flooding the tower, and the pressure survey was repeated. The survey determined that the flooding started at the lower intercooler draw (Figure 9.20b). The trays above the draw had liquid accumulation, causing the high pressure drop. Test 3 Does the intercooler draw rate affect the flood? The draw to the lower intercooler was closed. This routed all the liquid from the tray above via the seal pan overflow. With the draw closed, the tower started flooding earlier, at lean oil rates even lower than 50%. This test confirmed that the flooding was caused by a problem in the intercooler draw. Figure 9.20 Liquid side draw to intercooler that initiated premature flood (a) arrangement (b) same as (a), but showing flow patterns (c) modification that fixed the problem. (From Golden, S. W., Oil & Gas Journal, p. 62, April 7, 1997 and April 14, 1997. Reprinted Courtesy of The Oil & Gas Journal.) Analysis Ideally, all the liquid entering the downcomer should go into the intercooler. This will happen if the liquid head (6 ft, see Figure 9.20a) is high enough to exceed the pressure drop in the intercooler and its piping, and the draw line is sized for self-venting flow. Liquid exiting the downcomer contains entrained vapor bubbles, and these need to vent back through the downcomer, hence the need for self-venting flow in the draw line. If the intercooler pressure drop exceeds the liquid head, or if the draw line is not sized for self-venting flow, liquid will back up in the downcomer and seal pan and overflow the seal pan weir. Theory The theory postulates that some liquid was overflowing the seal pan weir. The liquid in the downcomer is aerated, while the liquid in the seal pan is mostly degassed, and therefore has a higher density, as depicted in Figure 9.20b. So 2 ft of liquid in the seal pan will raise the downcomer froth to about 3–4 ft. This is almost to the next tray. Adding the pressure drop of the bottom tray causes the downcomer backup to spill over to that tray, initiating column flood. This theory explains why the retray made things worse. The original valve trays had more valves, so they tended to weep, bypassing some liquid around the downcomer, seal pan, and intercooler loop. Eliminating the weep by using fewer valves increased the intercooler loop pressure drop and the liquid level in the seal pan. In addition, the fewer the valves, the higher the tray pressure drop. All these would bring the flood earlier. Solution Figure 9.20c shows the solution. The downcomer was separated from the deep seal pan, terminating in its own seal pan, so that there will be only a few inches (instead of 2 ft) of clear liquid causing backup in the downcomer. The valve tray above the intercooler draw was replaced by a chimney tray to reduce the aeration in the downcomer as well as the pressure drop that backed up liquid in the downcomer. This solution permitted the absorber to operate well at 100% of the lean oil flow rate. An atmospheric crude tower (282) had two pumparounds (PAs), a TPA and a BPA, similar to those shown in Figure 9.17. Both PAs take liquid from a tray, cool it, and return the cooled liquid on an upper tray, two or three trays higher. The trays between them are used as direct-contact condensers. The return piping of the TPA and BPA is sketched in Figure 9.21a (282). After the startup of a grassroots tower, column vibrations and hammering were experienced, most audible in the PA sections. The hammer could only be silenced by running a colder tower feed temperature, which led to losing diesel product to the tower bottoms residue. An engineering study by the internals supplier looked at PA pump cavitation, PA heat exchanger vibrations, cavitation of the PA check valves, and flashing at the PA return nozzles and distributors. All these were investigated but were ruled out both by observations and calculations. The supplier did not visit the site or talked to the operating team. An independent troubleshooting endeavor was initiated by a consultant (282), this time by interviewing plant operators, and putting together their observations: Figure 9.21 Liquid entry piping arrangements of top and bottom pumparound returns in an atmospheric crude tower (a) initial, experienced hammering (b) hammering mechanism (c) Modified, eliminated hammering. (From Lenfeld, P., and D. Lin, “Tricky Liquid Distributors,” in Kister Distillation Symposium, Topical Conference Proceedings, p. 428, AIChE Spring Meeting, San Antonio, Texas, March 26–30, 2017. Reprinted by permission.) These observations suggest a mechanism similar to that in Section 7.2.11 (Figure 9.21b). Due to the low vapor pressure of the subcooled liquid, hot condensable vapor from the tower entered the distributor pipes. It then collapsed onto the liquid surface, generating a local vacuum inside the PA return pipes, causing more vapor to be sucked in, collapsing onto the subcooled liquid. Eventually the condensate was pushed out by the PA liquid, and the cycle repeated. The collapse mechanism initiated hammering in the pipes, as illustrated in Figure 9.21b. The problem was eliminated after the PA return liquid pipe distributors were equipped with hydraulic liquid seals to prevent the backflow (Figure 9.21c). Case study 5.5 in Ref. (201) describes a similar hammering issue in a pipe distributor bringing a highly subcooled feed into a chemical tower. In this case, the solution was turning the pipe distributor (similar to the top PA distributor in Figure 9.21a) upward so the sparger pipe always remained liquid-full. A shielding baffle then deflected the issuing feed liquid downward. Still X and Still a had been specialty product finishing columns in the same service. In the early 1990s, a leading packing supplier repacked both stills with the exact same packing heights in each column: two lower packed beds of A meters each and an upper bed of B meters. The stills were about 5 ft in diameter. The packing was similar to BX wire-gauze-structured packing that is commonly applied in fine chemical manufacturing, which requires deep vacuum distillations to prevent compound deterioration. At an expected efficiency of five theoretical stages per meter, each column was expected to have about 50 theoretical stages. In the early 2000s, a test mixture was run in both Still X and Still a. The results showed that Still X had about 11 effective stages in the lower beds, while Still a had >40 stages in the lower beds. Separation efficiency of the lower beds of Still X was 25% of what it should be. The test was repeated in the spring of 2015 with identical results. With this low efficiency, Still X was unsuitable for fine product purification. Still X was gamma-scanned in 2001. Typically, packed beds are grid-scanned (Figure 5.6a), but due to the surrounding structures, only two scan lines (a + scan, Figure 5.6c) were shot. The scans found all distributors and collectors at the correct elevations, and all three beds having the proper bed heights. The top bed had a density gradient in the packing and some maldistribution. There was some maldistribution in the top half meter of the middle bed. The liquid distribution in the rest of the middle bed and throughout the bottom bed was good. The packing density was constant throughout the middle and bottom beds. The scanners concluded that there appeared to be no serious mechanical damage, fouling, or major distribution problems that would explain the absence of such a large number of theoretical stages. Neither the gamma scans nor operation saw any signs of flooding. Still X was a taller column than Still a, mostly due to the longer downcomers between the packed beds (about 20 ft long) that brought reflux liquid to the feed parting box below. Some felt that this caused the difference in the stills performance. It was argued that the problem was the high velocity in the pipes blowing out the parting box liquid. During an outage, Still X was inspected through the manholes. It was water-washed with the manholes open and water running through the packed beds. Nothing out of the ordinary was noted. In the fall of 2015, a world-class expert contractor in mass transfer tested and evaluated Still X and came up with a stage count very similar to the previous two tests. The contractor pointed to bed height, drip point density, and other possible issues. The contractor recommended replacement of the internals and three packed beds, using the latest low pressure drop wire gauze packings and contractor-designed internals. Other options considered included adding a fourth bed, changing the packings but not the internals, and changing the internals but not the packings. During the fall 2015 test, discussions were held with a long-serving operator. His recollections were that initially both columns had the exact same separation efficiency. “This is an important point, as some believe that the design the of the Still X column internals may have an impact on the current performance.” In the late 1990s, the separation efficiency of Still X degraded, and it no longer performed as an equivalent to Still a. Significant efforts to recover the column performance at that time were unsuccessful. “About the time that the performance was lost – the column was unknowingly distilling organic chlorides. Two other columns were also engaged with these distillations and were significantly damaged.” However, manhole inspections have not revealed any damage to Still X. To develop a good diagnosis, it was decided to perform a detailed in situ water test. Water was introduced through the reflux line and meter. All the manholes were open and observations made at each redistributor. The flow rate was increased from the minimum liquid loading to the maximum distributors capacity. At maximum flow, there was no splashing at the parting boxes, all looked well there, denying the argument of issues with the long pipes. However, at the bottom manhole, the water poured right out of one section of the packing (Figure 9.22a). There was definite channeling in the lower section of packing. Maldistribution below the middle bed was not as obvious as it was below the bottom bed. To get a rough quantitative evaluation, a test using the bucket and stop watch method was conducted (Figure 9.22b) and clearly highlighted channeling in the middle bed as well. Round 1 had the water fed through the reflux distributor, and round 2 through the feed distributor, both showing much the same results. There was heavy flow toward the center (position 1), with section 4 the driest. The in situ water tests proved that the problem was liquid maldistribution. In situ tests also explained why the gamma scans failed to detect the maldistribution. With a + scan (Figure 5.6c), both scan chords passed through the middle (position 1) where the flow was high. Upon seeing the same high central flow, both chords looked similar, leading to the erroneous conclusion that distribution was good. In situ tests provide a much broader picture of the liquid distribution than regular gamma scans. Following this test, all of the packing was replaced in all three beds. The older internals (including all distributors and collectors) were reused since the similar column next to it (Still a), had adequate separation, and also because these internals have not changed from the time that the tower worked well. Still X efficiency was recovered to the expected and continues to perform well today. Takeaways In situ water tests are invaluable when conducted properly. Incorporating simple quantitative rough measurements like the bucket and stop watch method is very informative. Keeping the test basic helps reach conclusive results. Figure 9.22 In-situ water test of chemical tower (a) visual observation, showing a high liquid flow near the center (b) results of bucket and stop watch measurements. In-situ water tests view liquid distribution over the entire tower cross-section area, whereas gamma-scan chords cover a smaller area. In situ tests may therefore be able to detect some types of maldistribution that gamma scans may miss. Always do the test yourself. The water test was a repeat of a previous test many years earlier that found the still to be “good.” There was no real record from the initial test – other than that it was “good,” and there was no record of how well the test was performed. Always reach out to the operators; often, you can save a lot of expenses and headaches by just listening and gathering information. The long-serving operator’s recollection that the column worked and then it started to operate poorly was a milestone in the path to a correct diagnosis. The world-class mass transfer experts were pointing to bed height, drip density, and other things – they were wrong. One good measurement is worth more than a thousand expert opinions.
Chapter 9
Making the Most of Field Data to Analyze Events and Test Theories
9.1 EVENT TIMING ANALYSIS
9.1.1 General Application Guidelines for Event Timing Analysis
9.1.2 Diagnosing the Unexpected Cause of Off-Spec Product
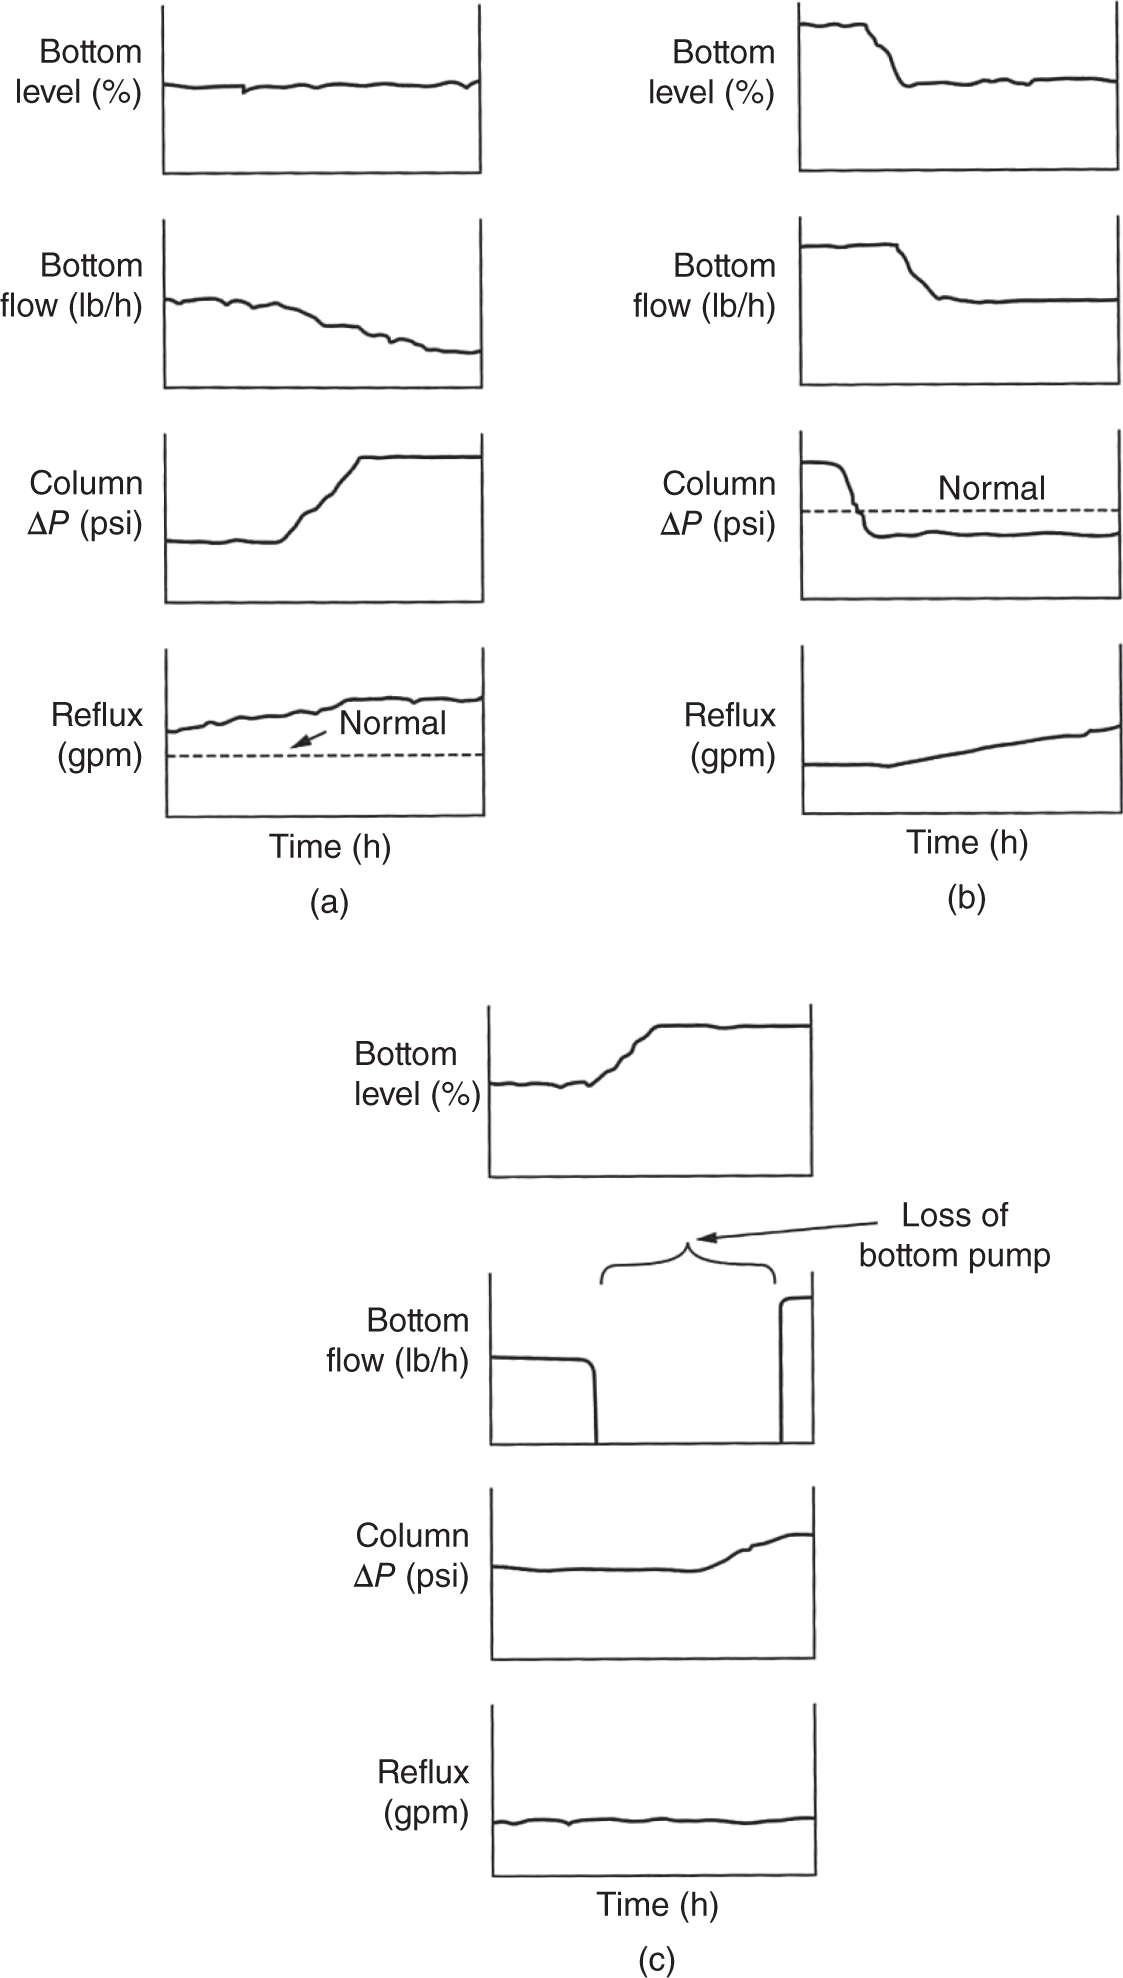
9.1.3 Diagnosing Reboiler Surging
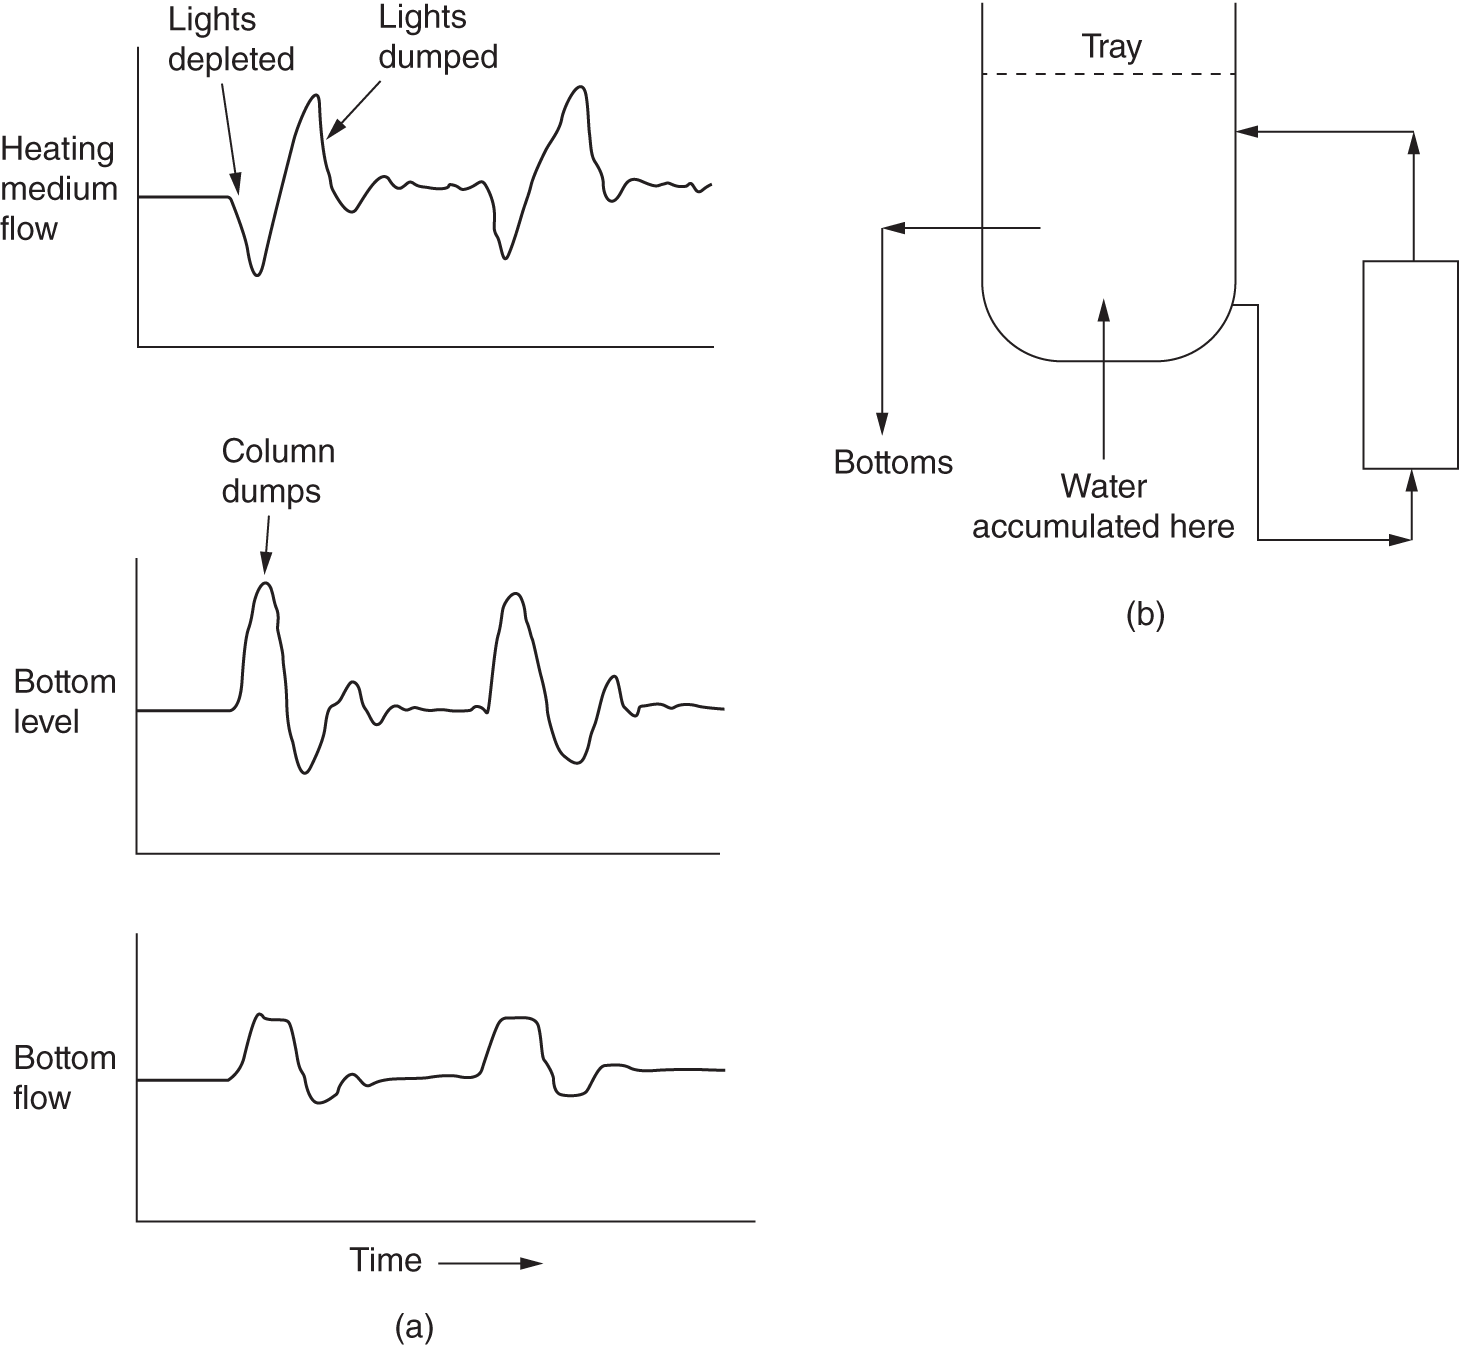
9.1.4 Loss of Condensate Seal in a Demethanizer Reboiler
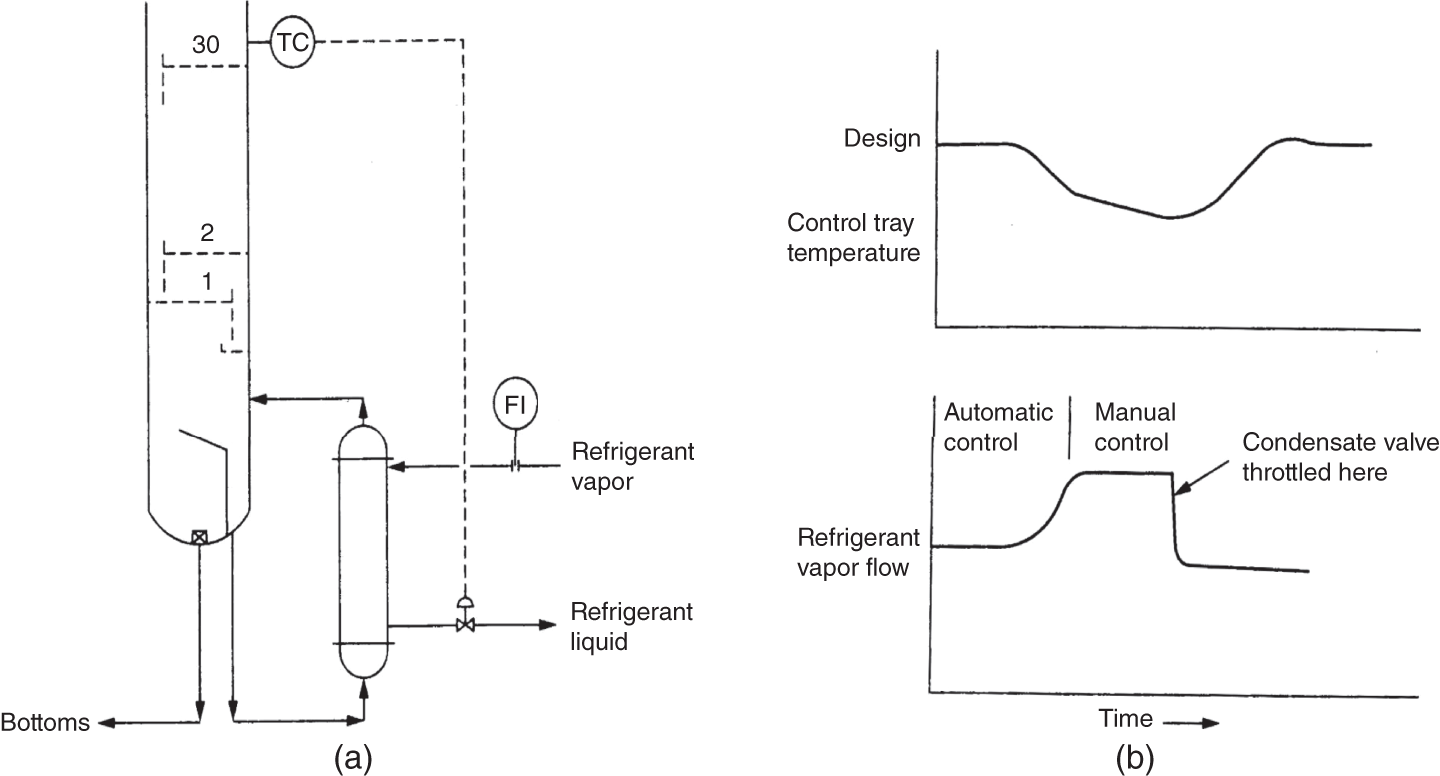
9.1.5 Figuring out Hot Vapor Bypass (HVB) Instability
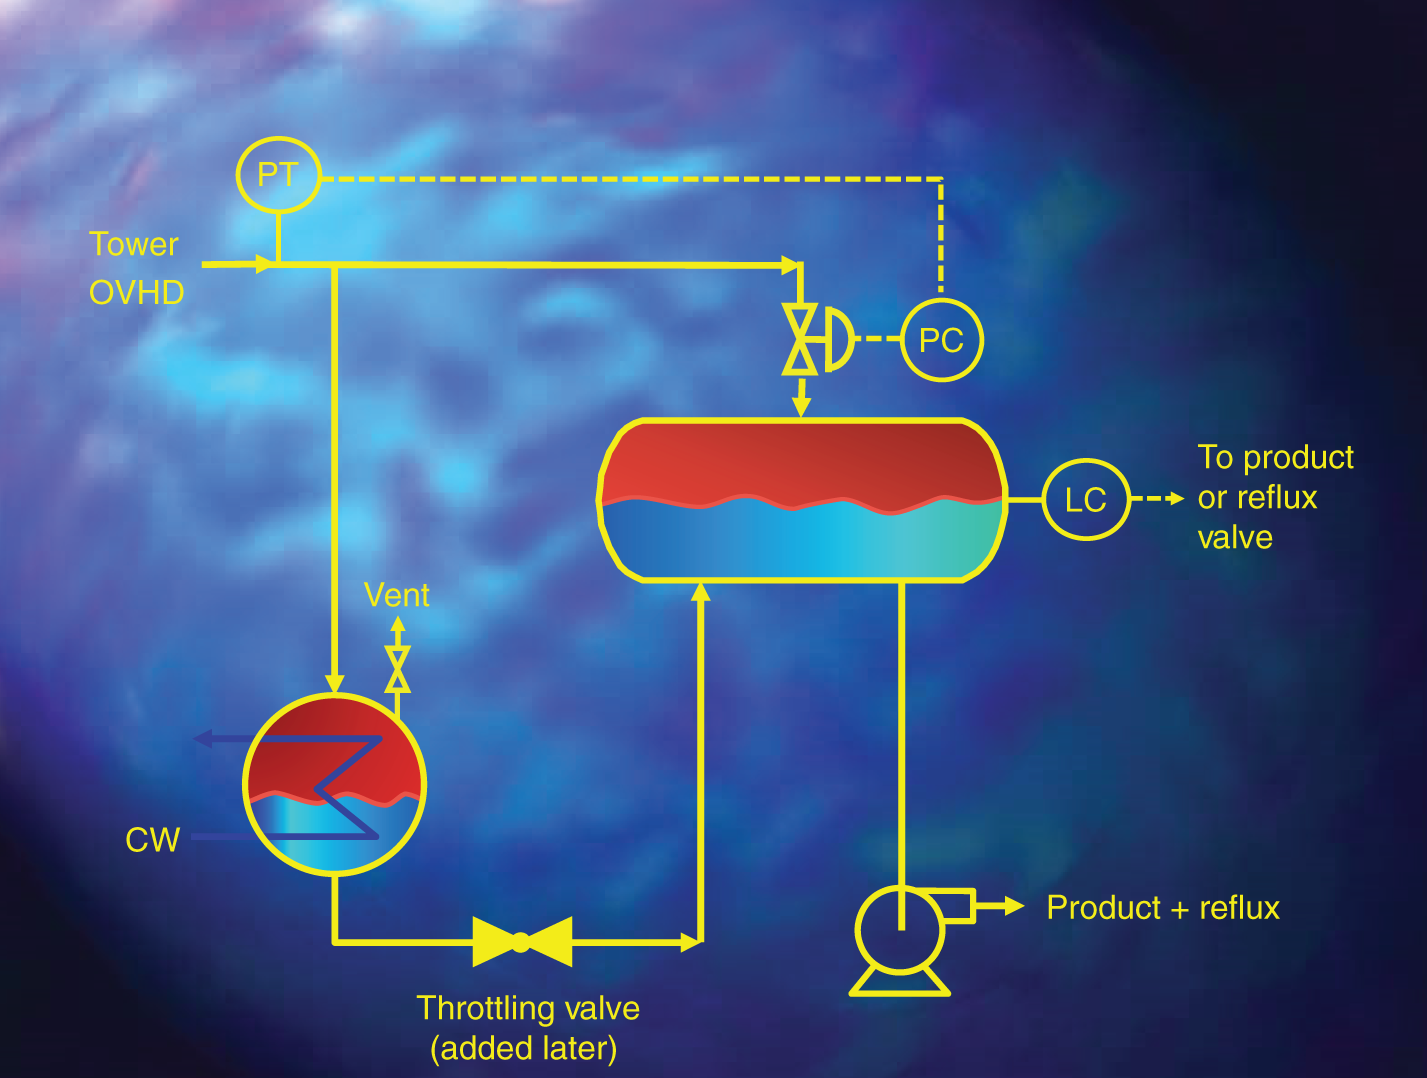
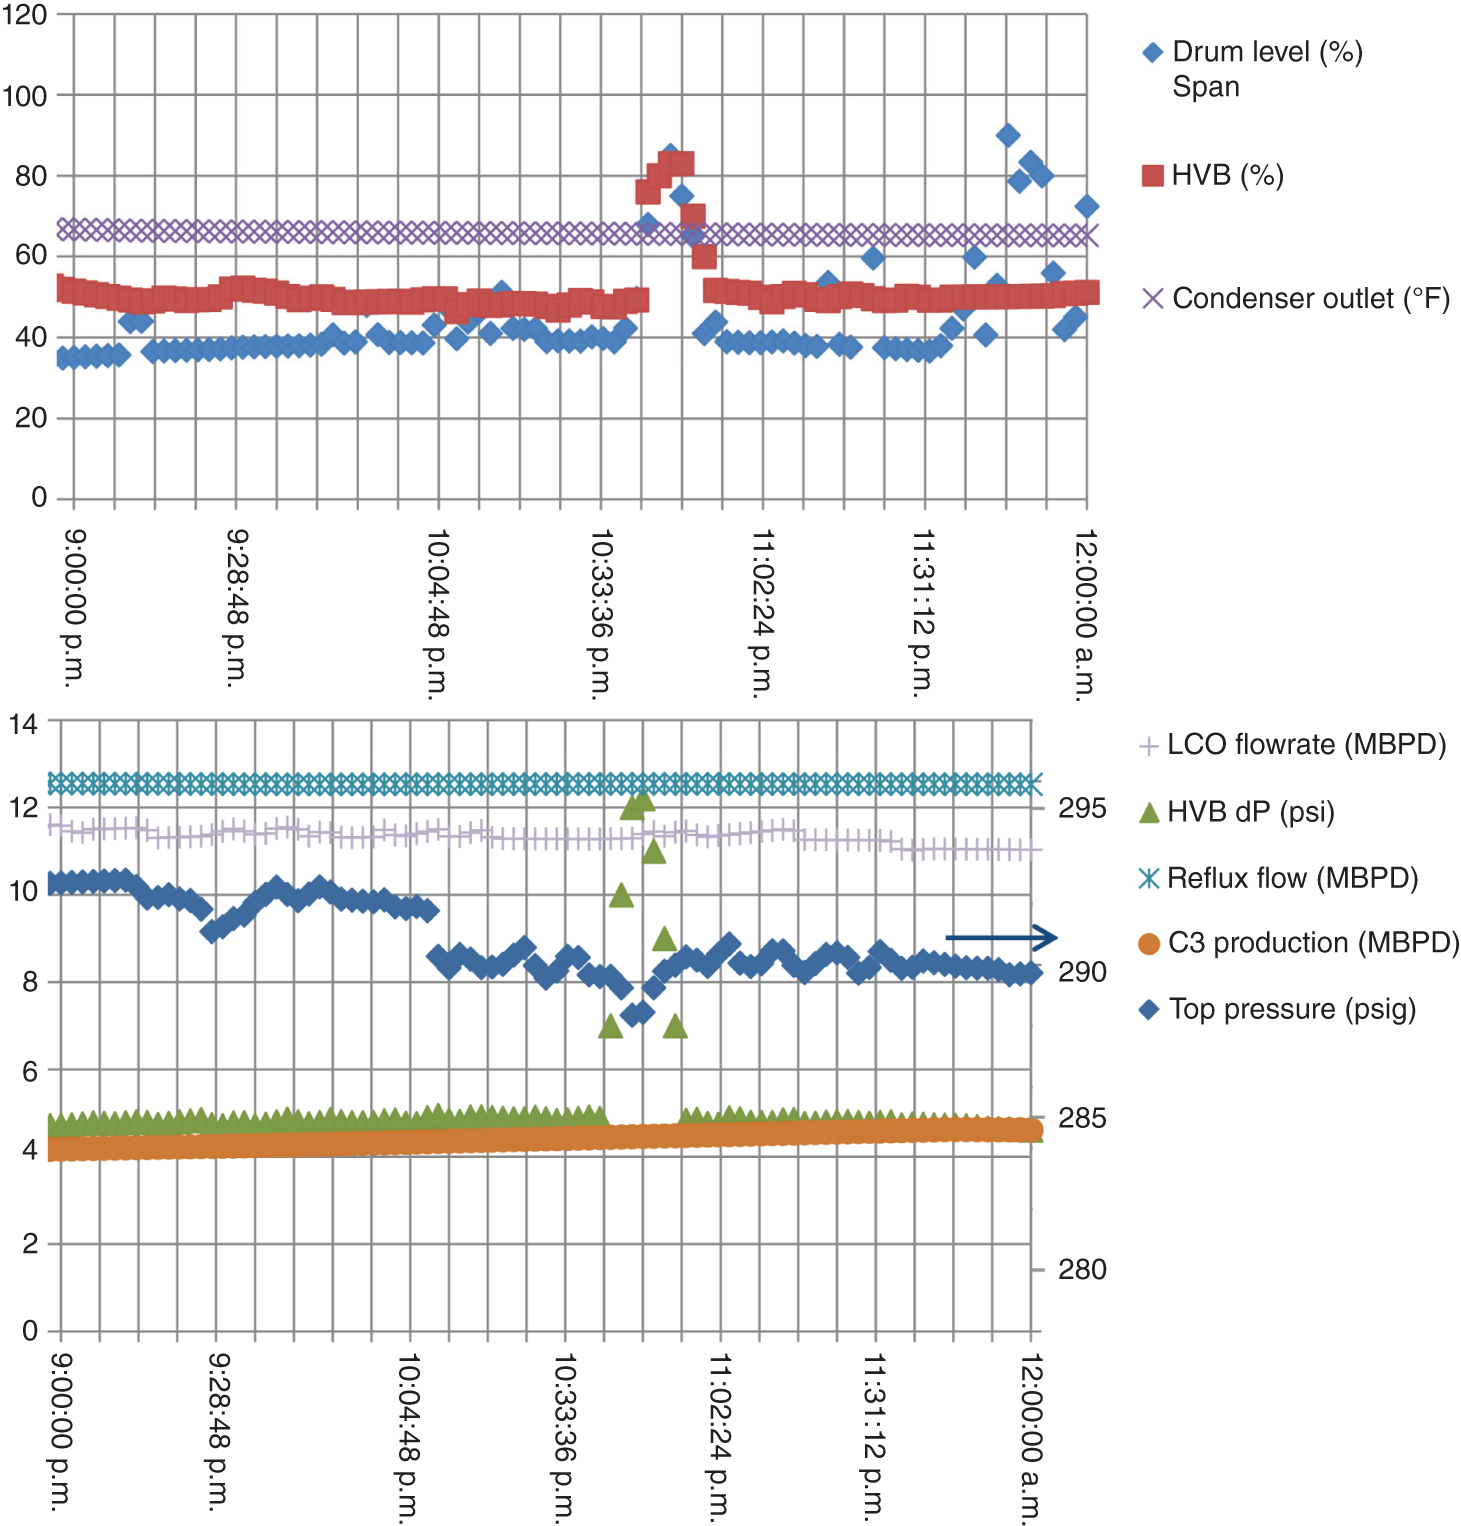
9.1.6 Can Multiple Steady States Occur in a Reboiler System?
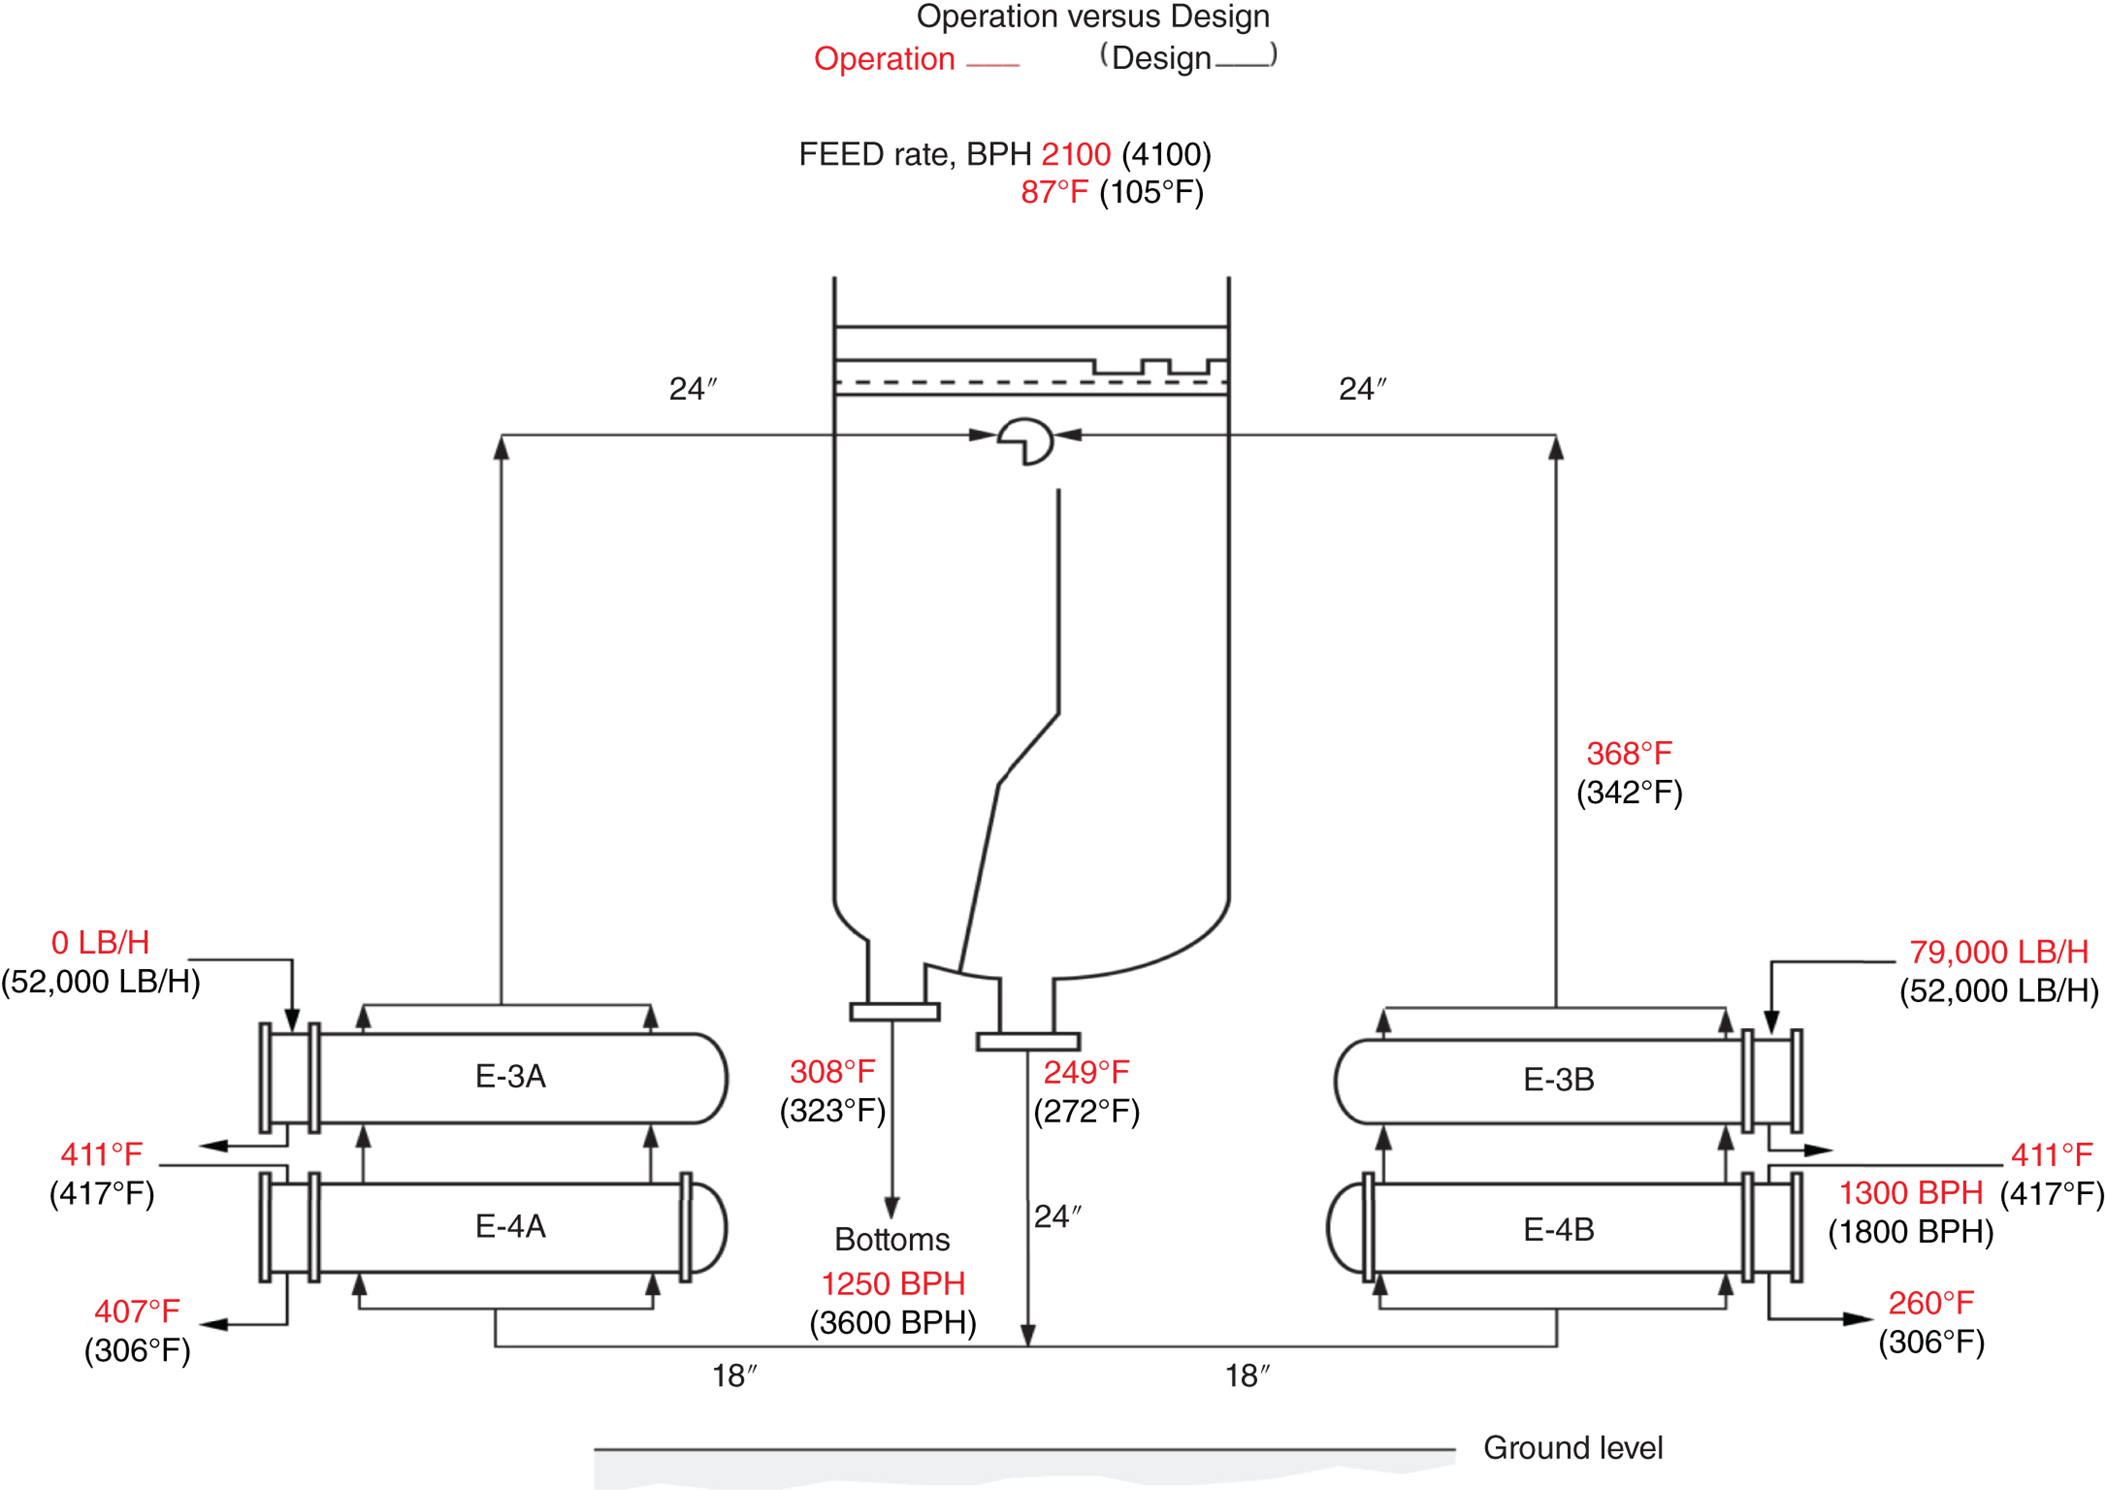
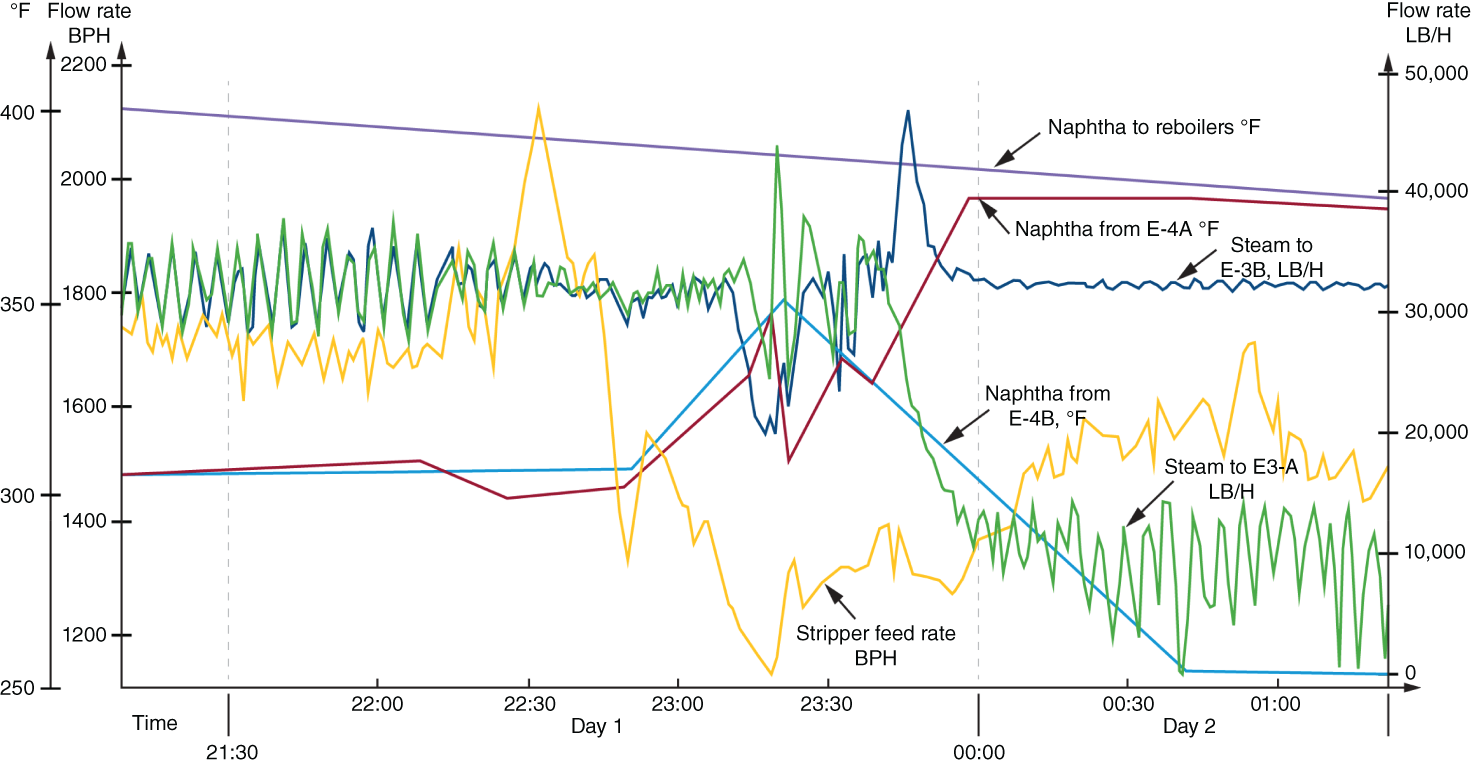
9.1.7 Can a Plugged Packing Distributor Generate Two Steady States?
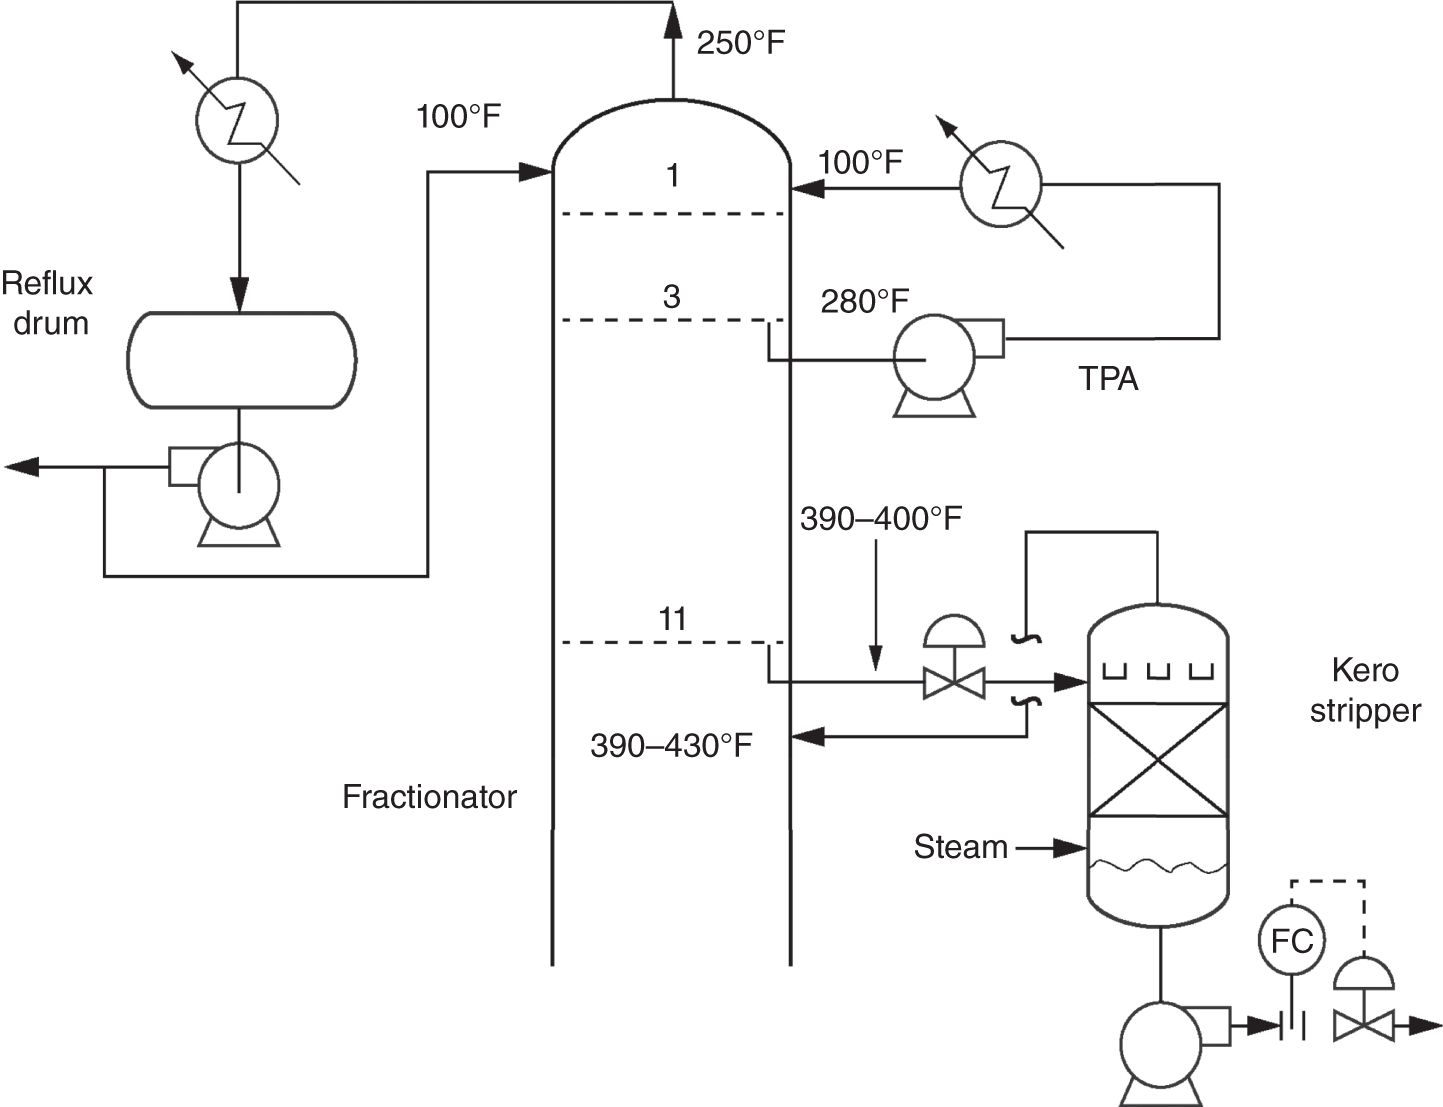

9.1.8 What Caused Tray Damage in Refinery Atmospheric Crude Fractionator?
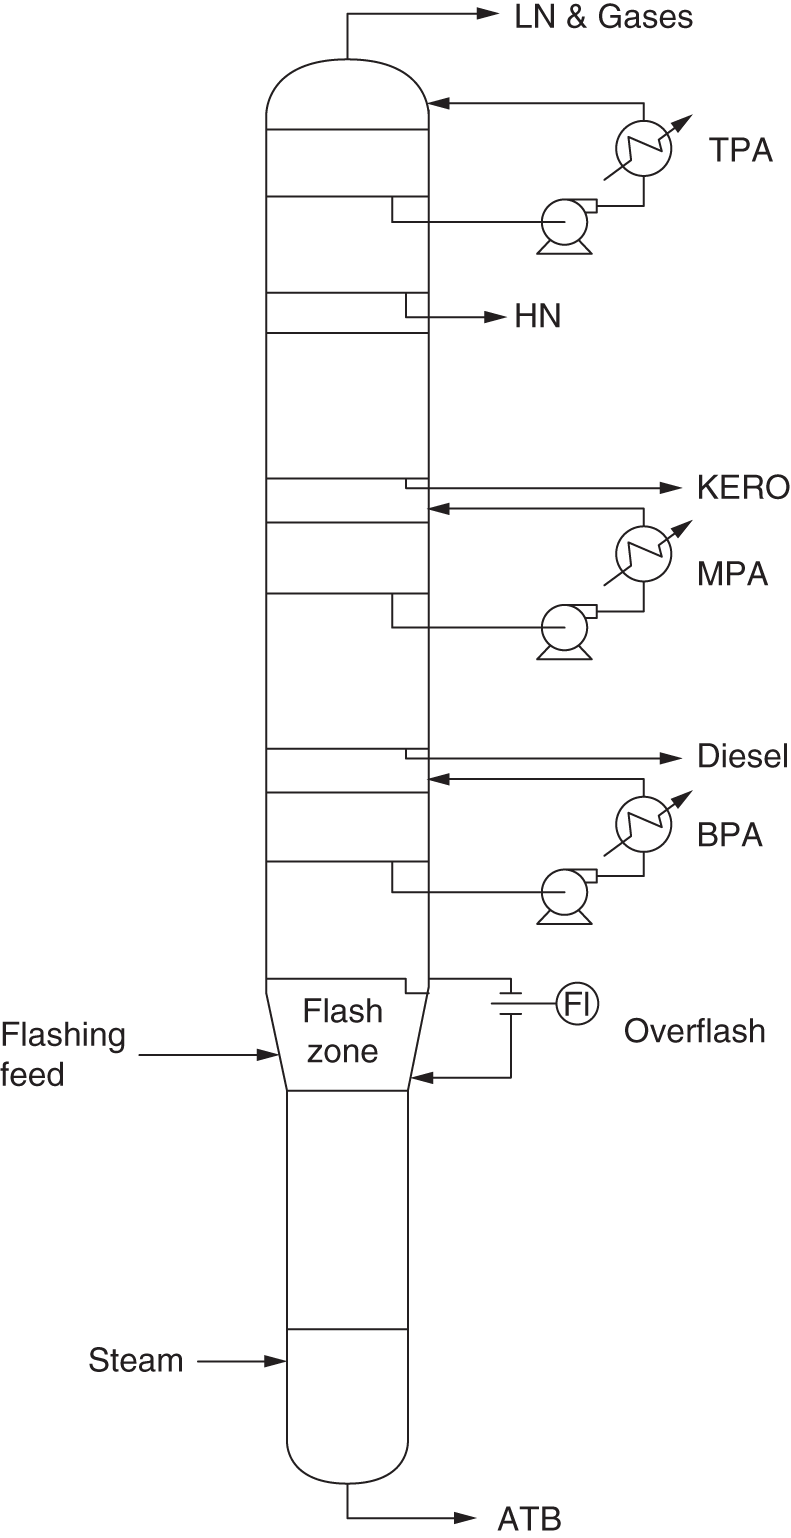
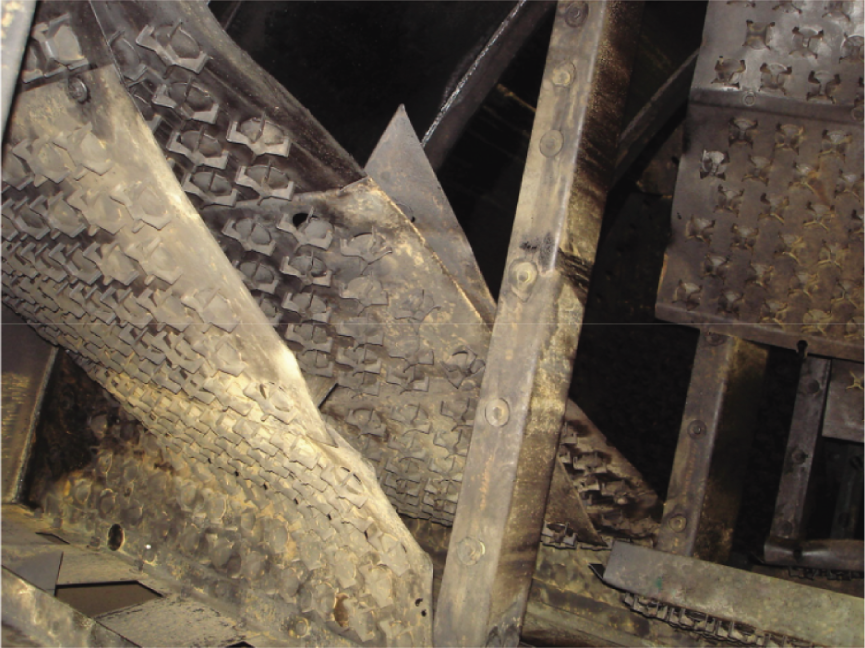
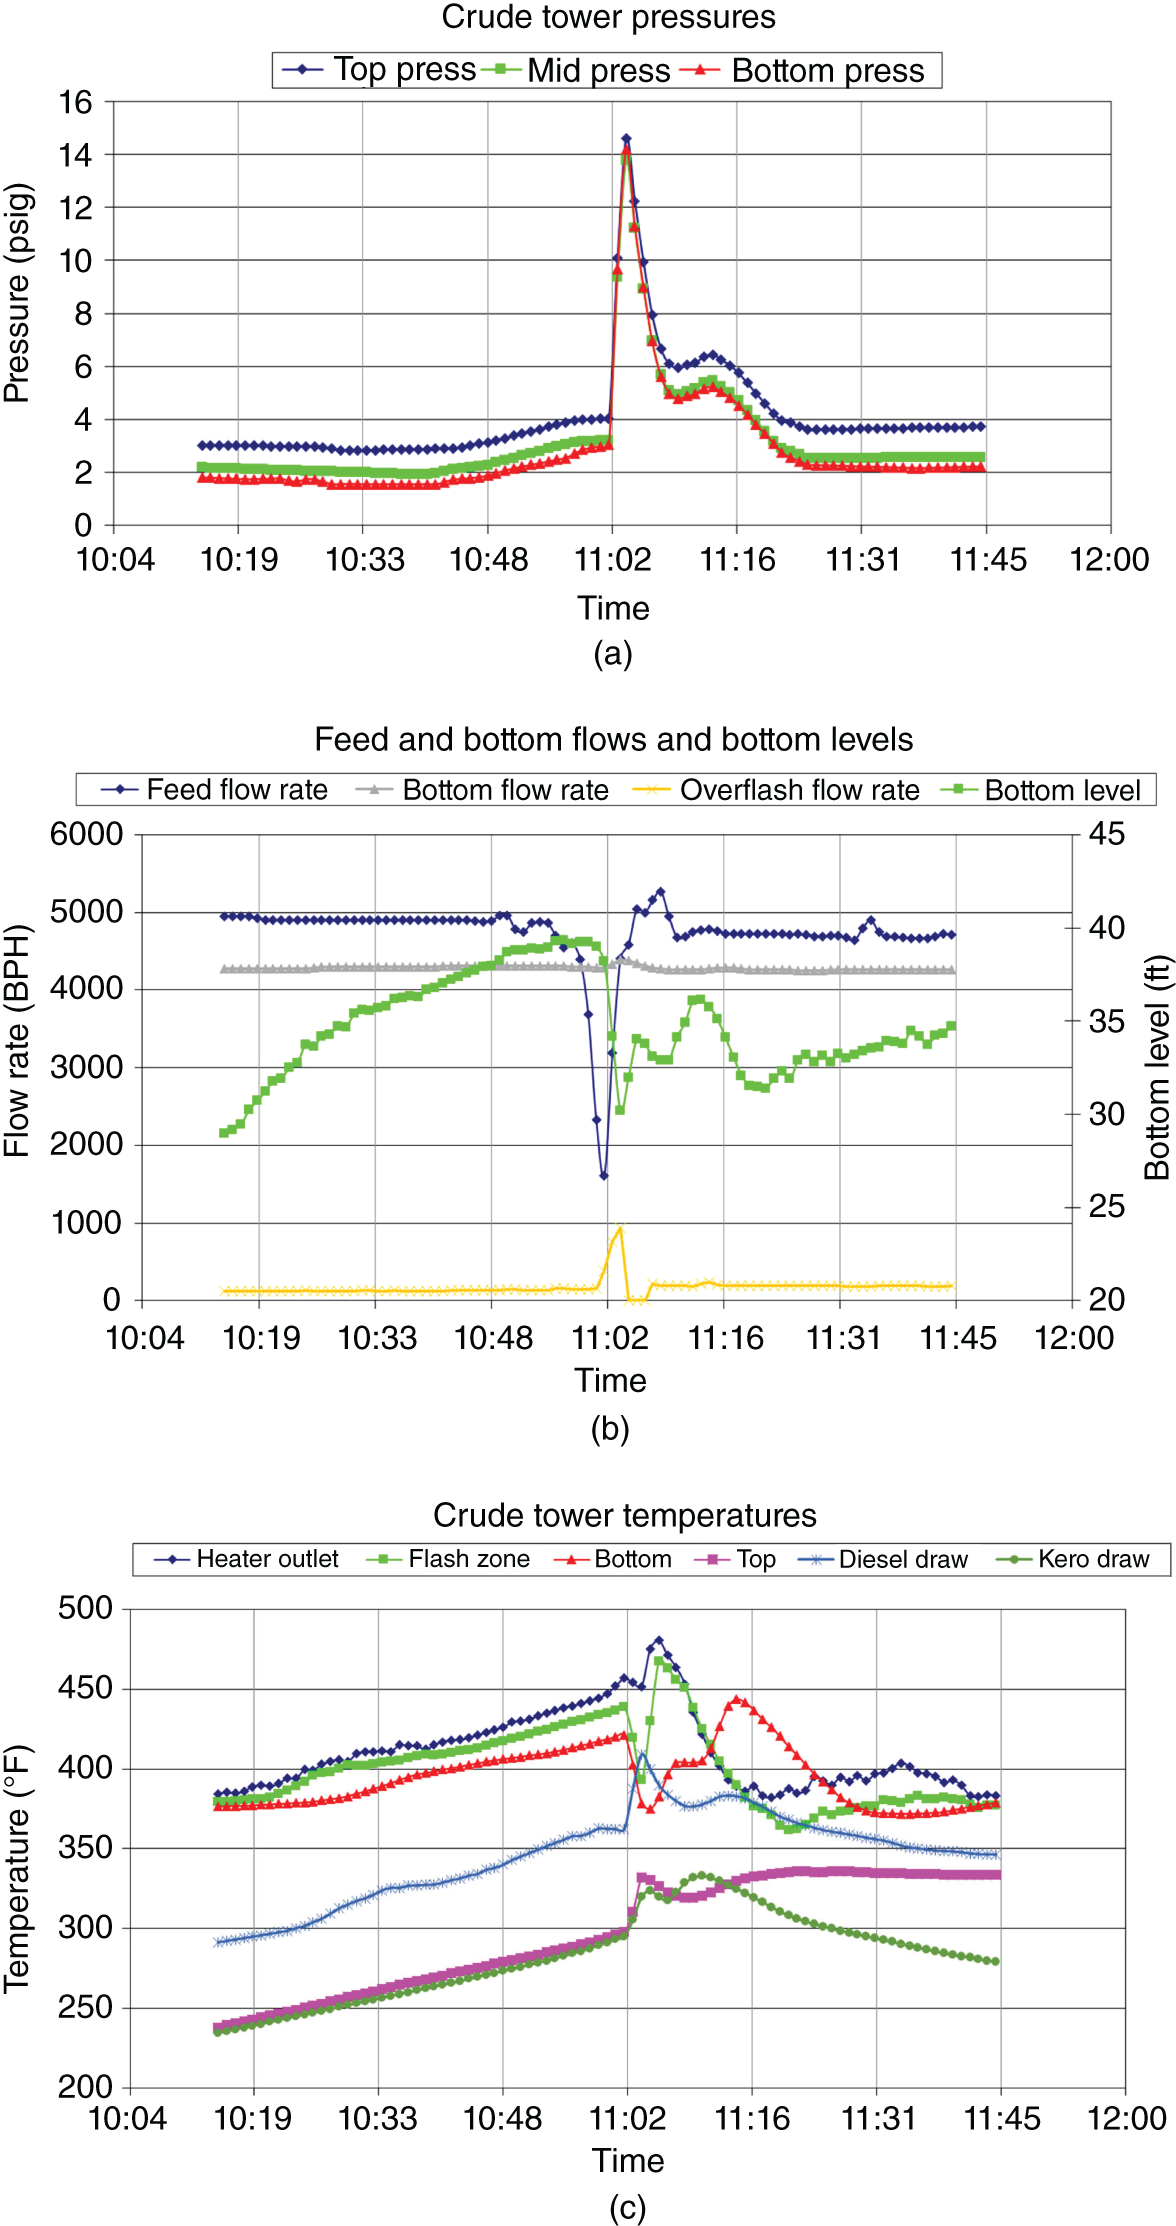
9.1.9 Event timing Analysis of Startup Instability Leads to Improved Startups
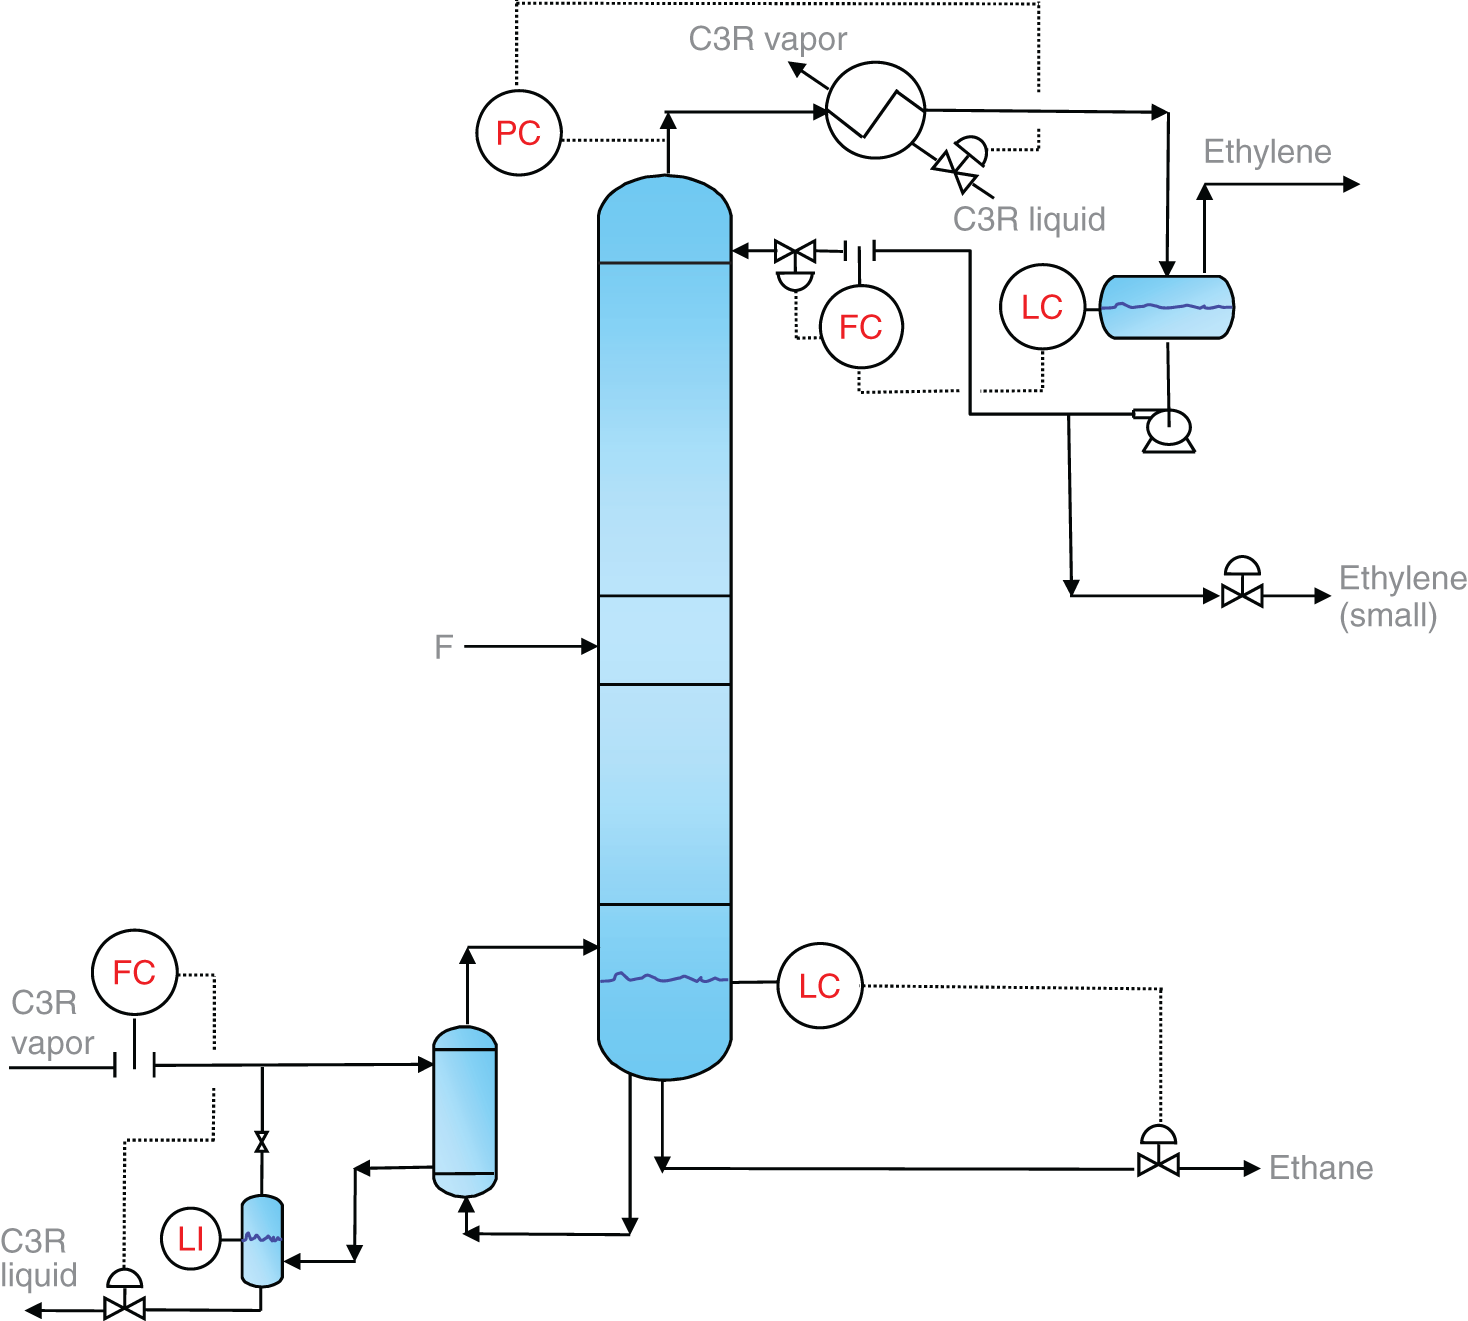
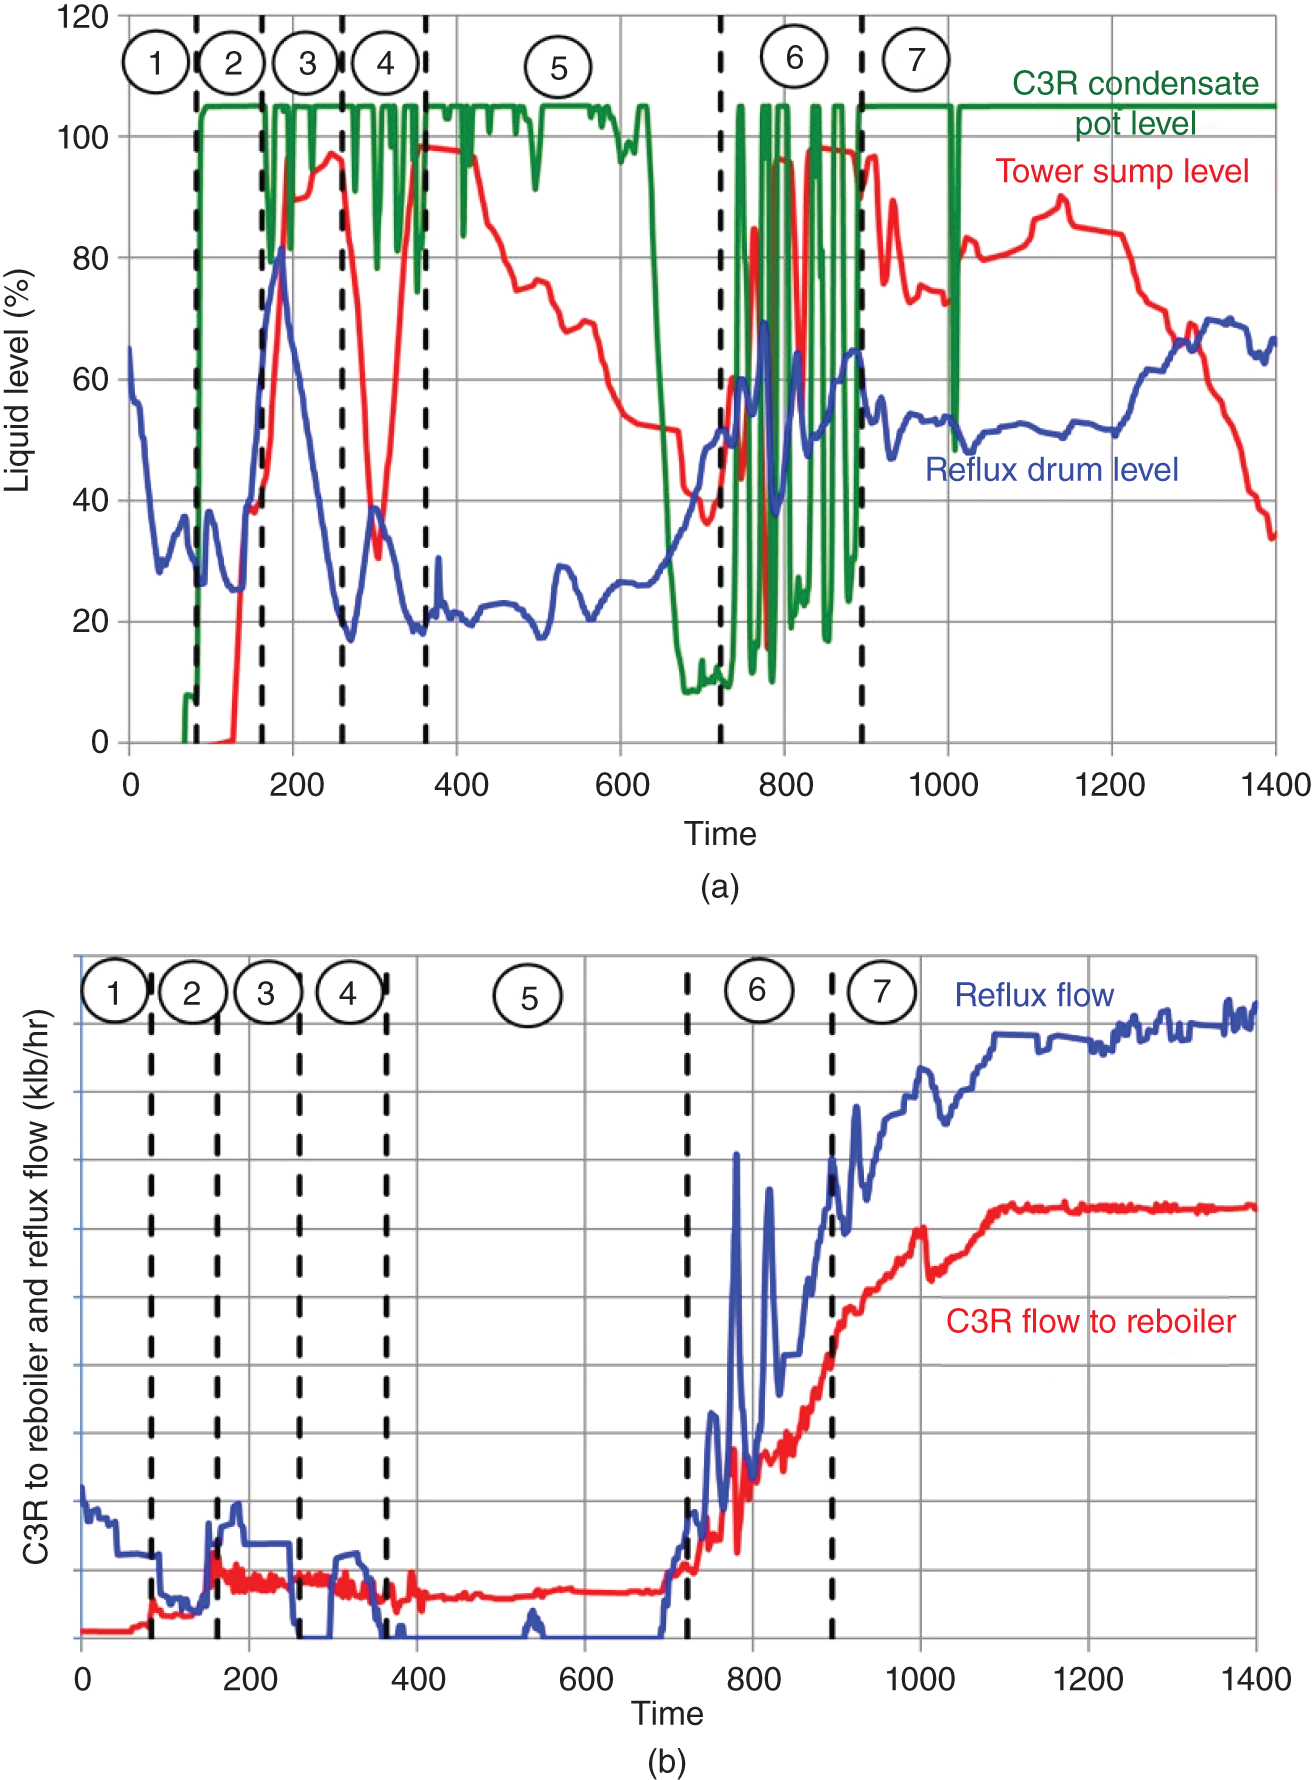
9.2 FIELD TESTING
9.2.1 General Application Guidelines for Field Testing
9.2.2 Narrowing Down from 12 Theories to the Root Cause
9.2.3 Making Sense of Plant Data and Operation Experience in a Packed Tower
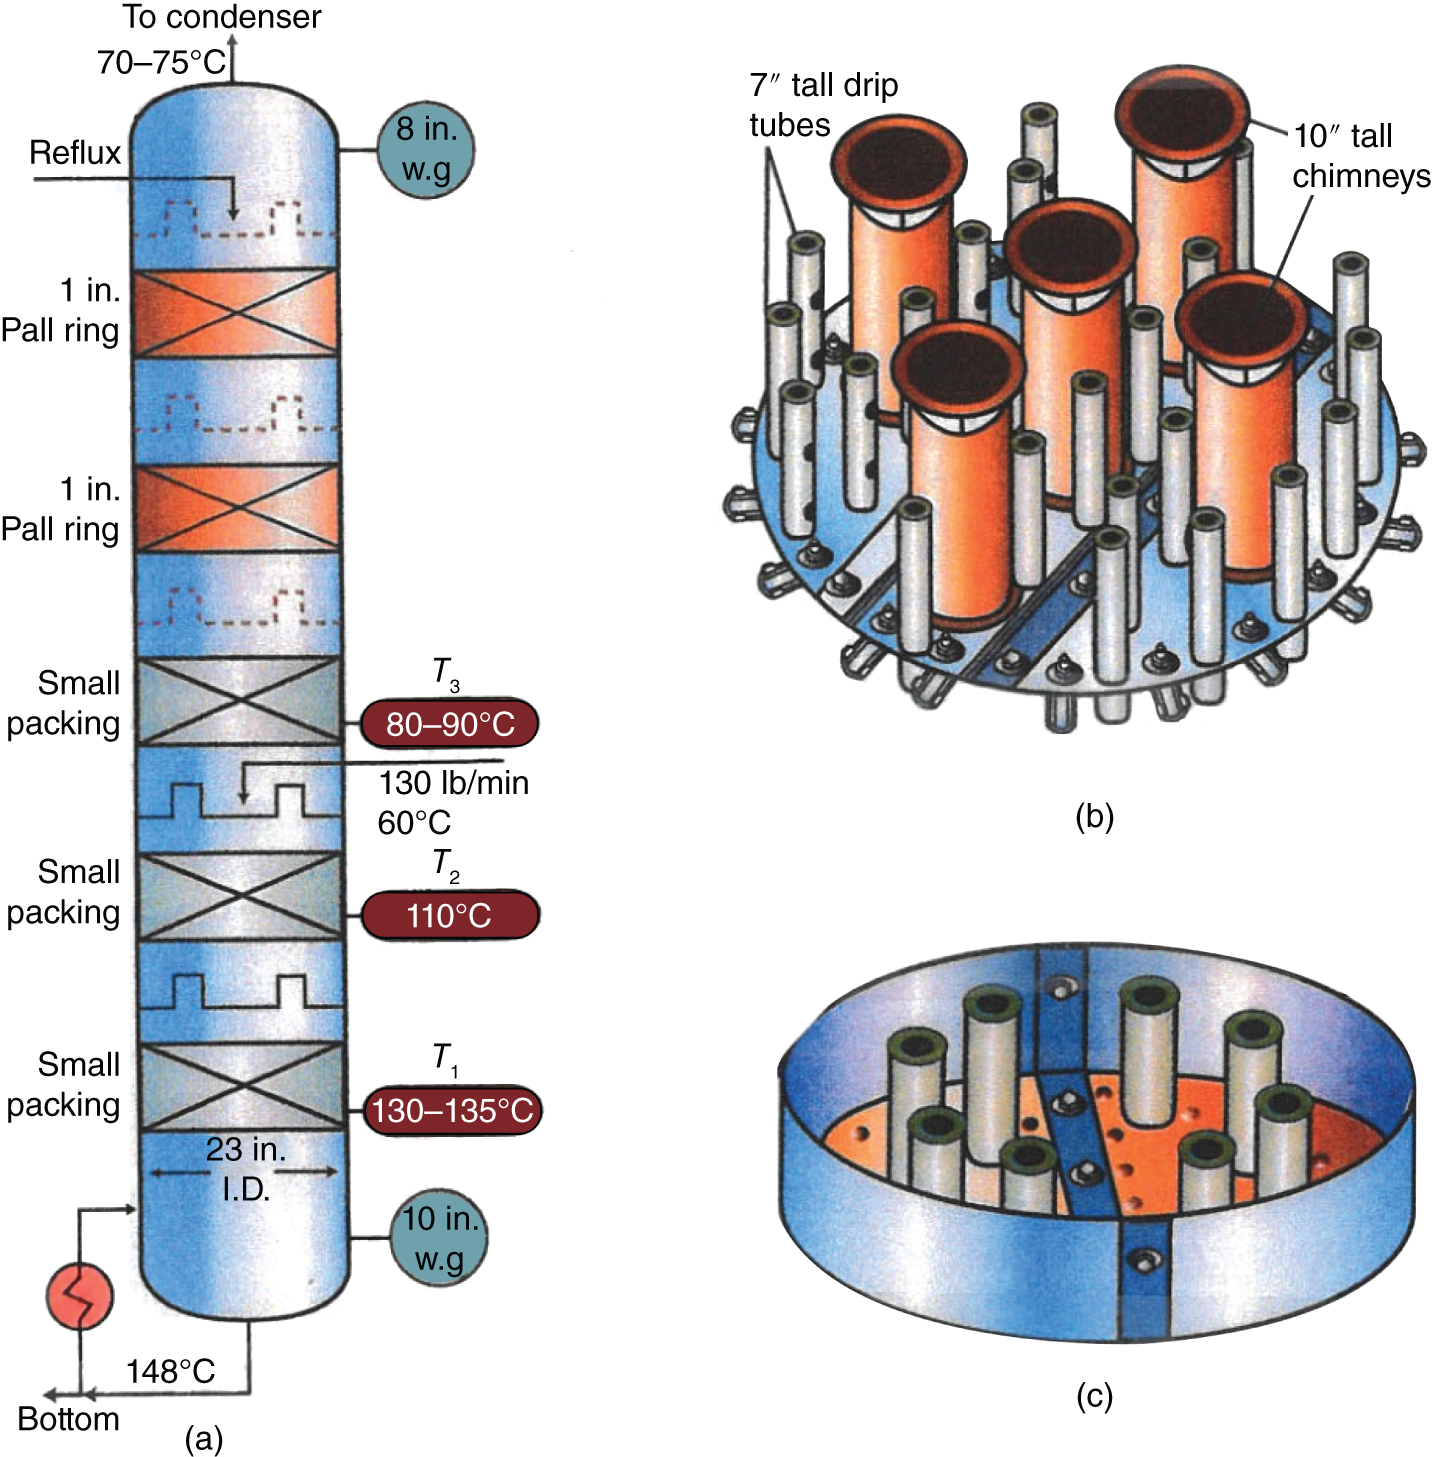
9.2.4 Downcomer Unsealing: A Correct Diagnosis Brings a Correct Cure
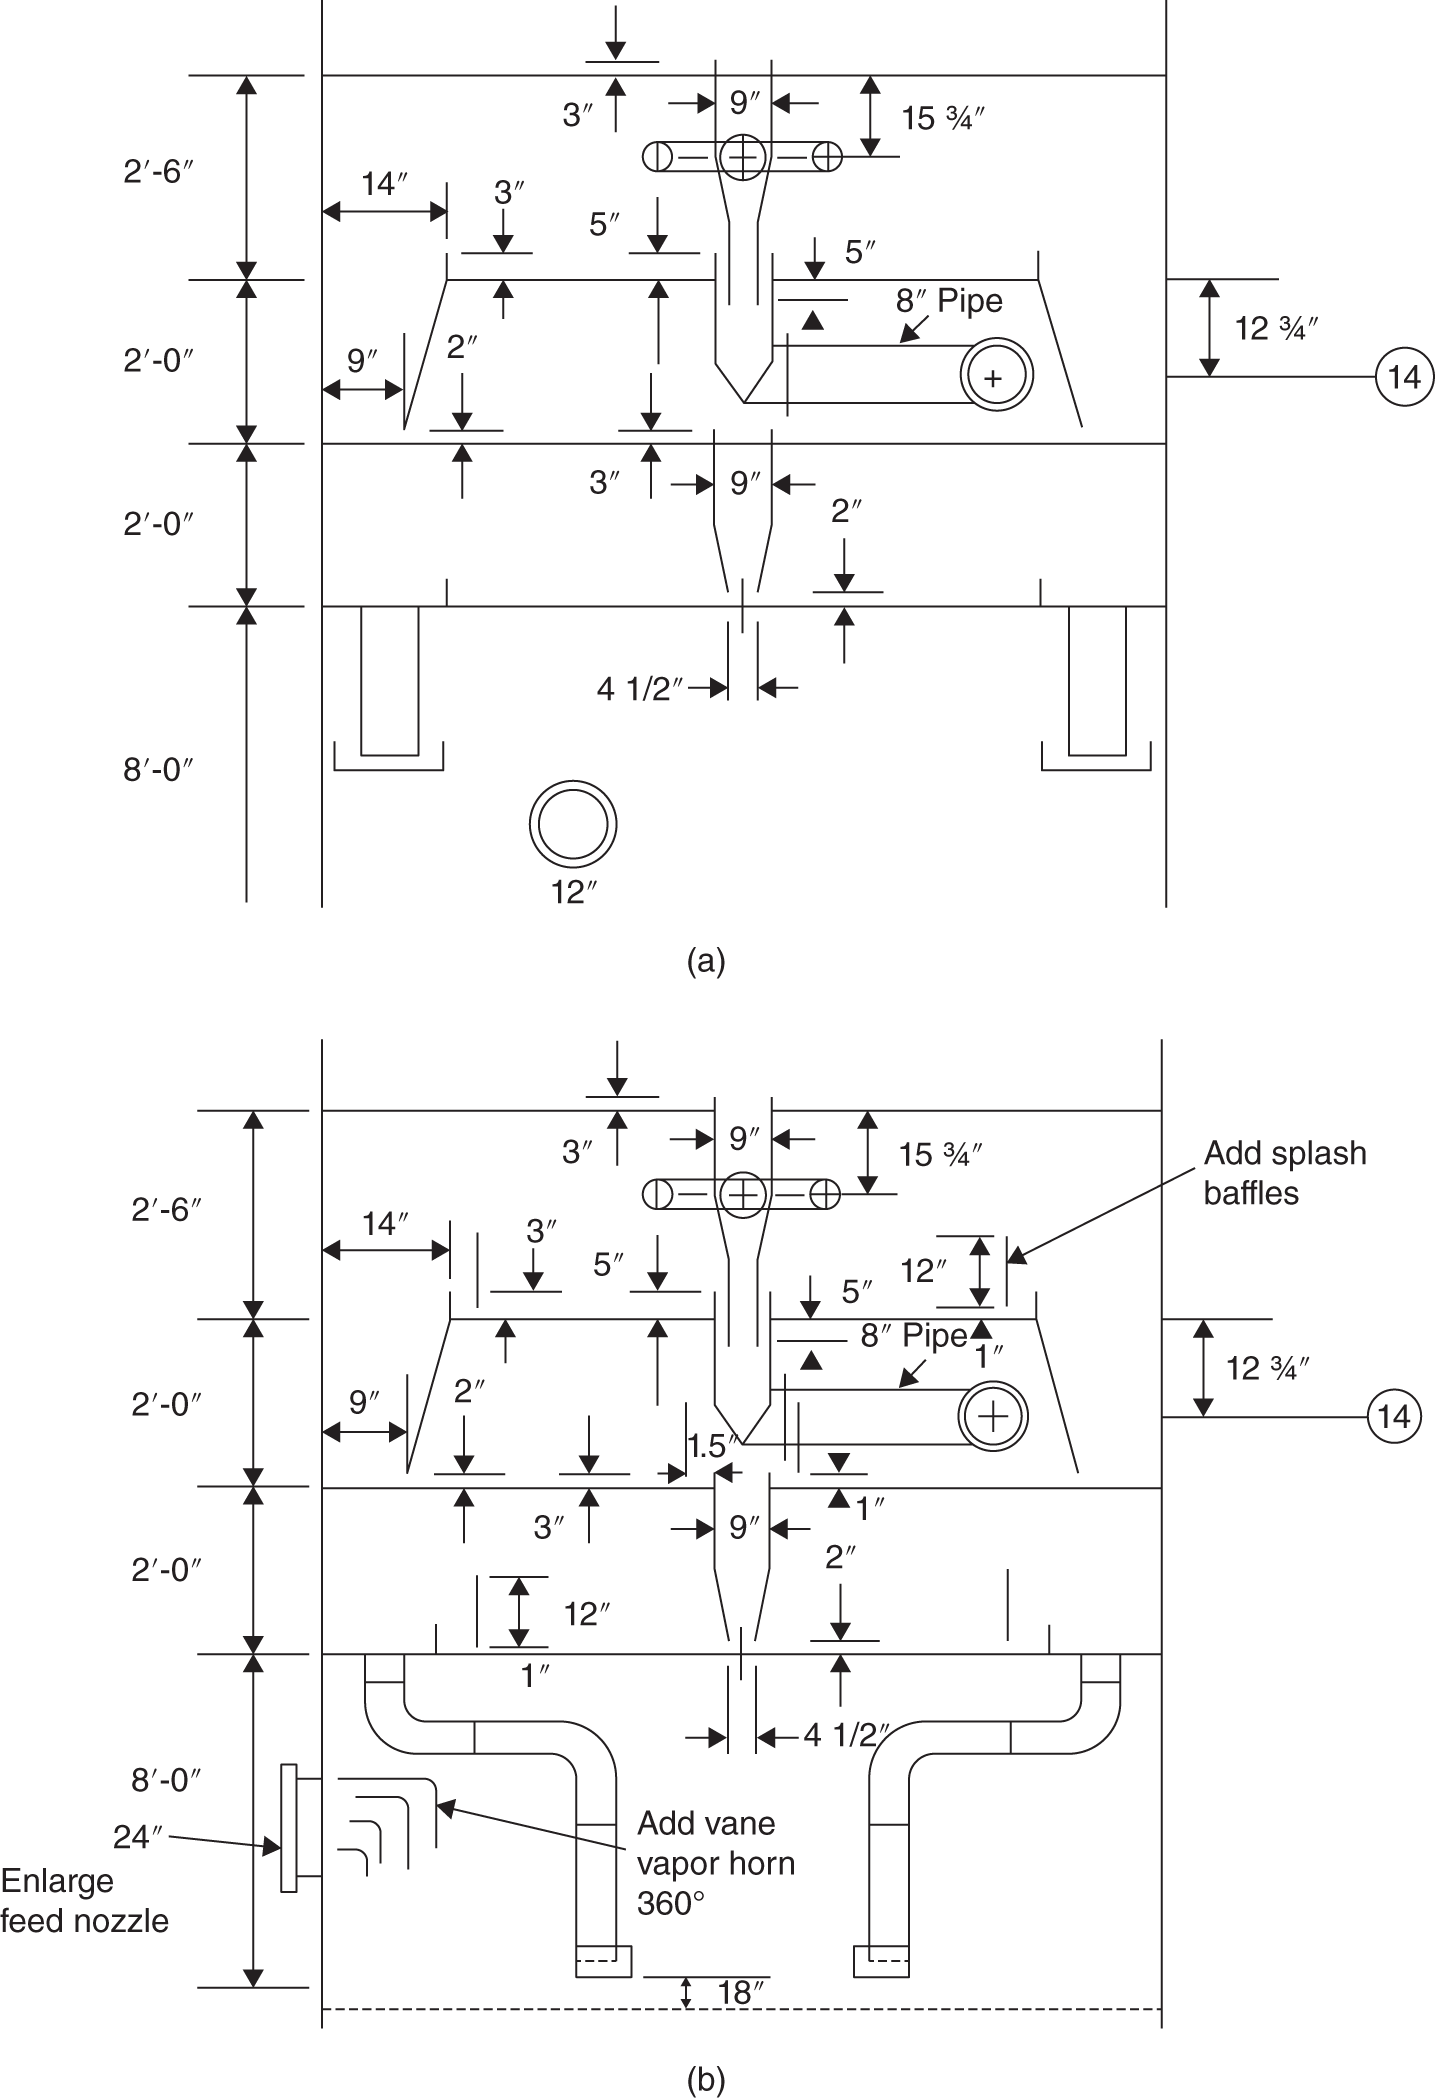
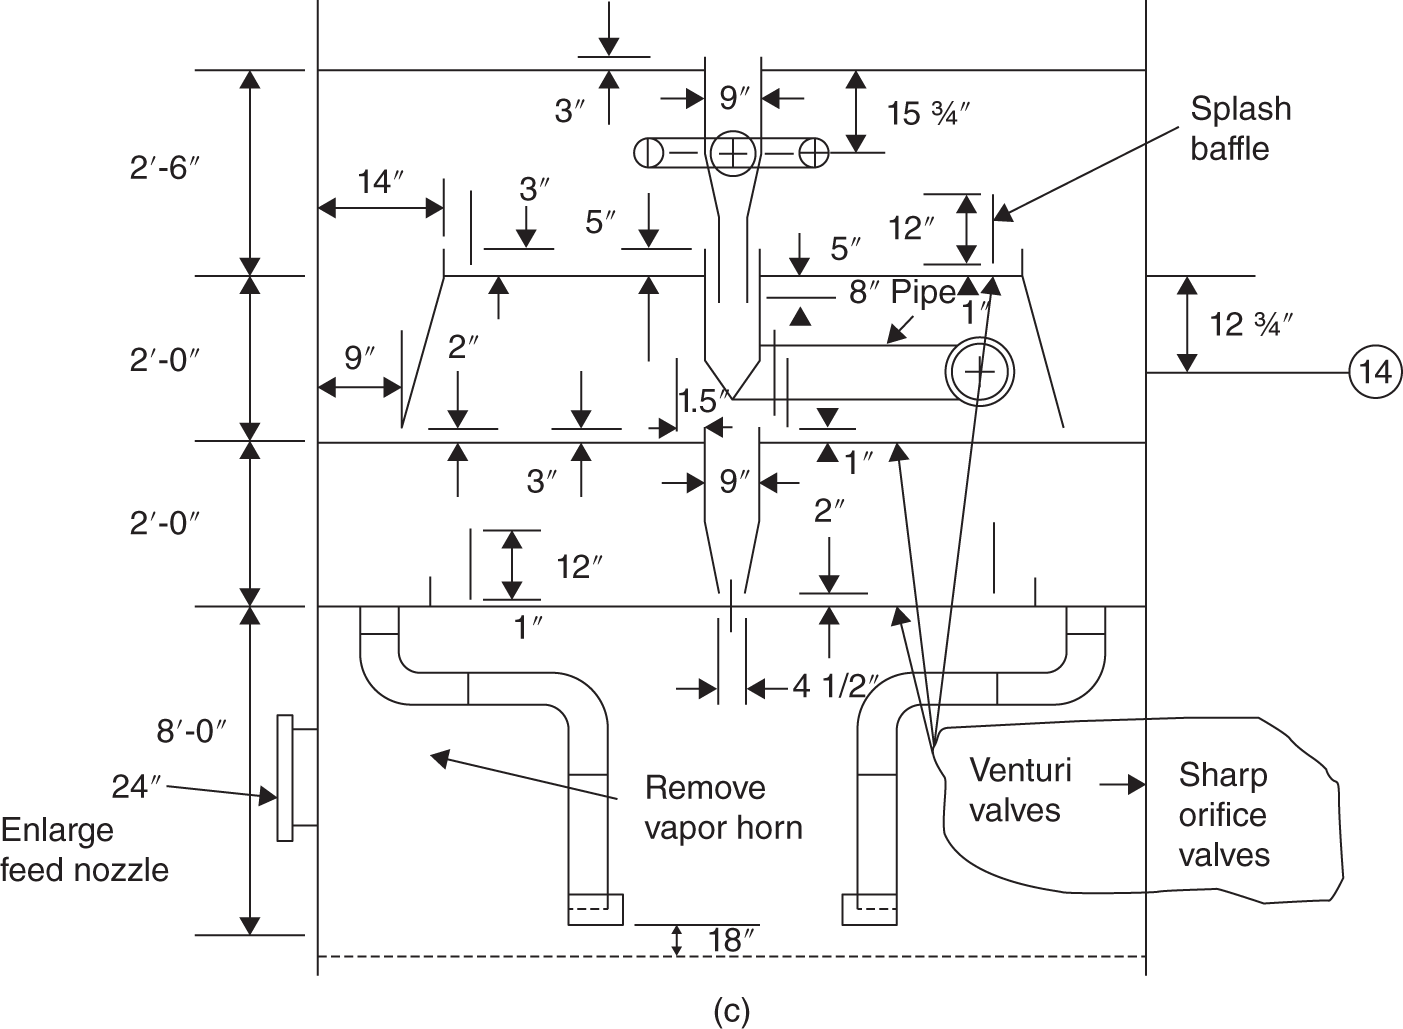
9.2.5 Well-Targeted Field Testing Brings a Correct Diagnosis and an Unexpected Simple Solution
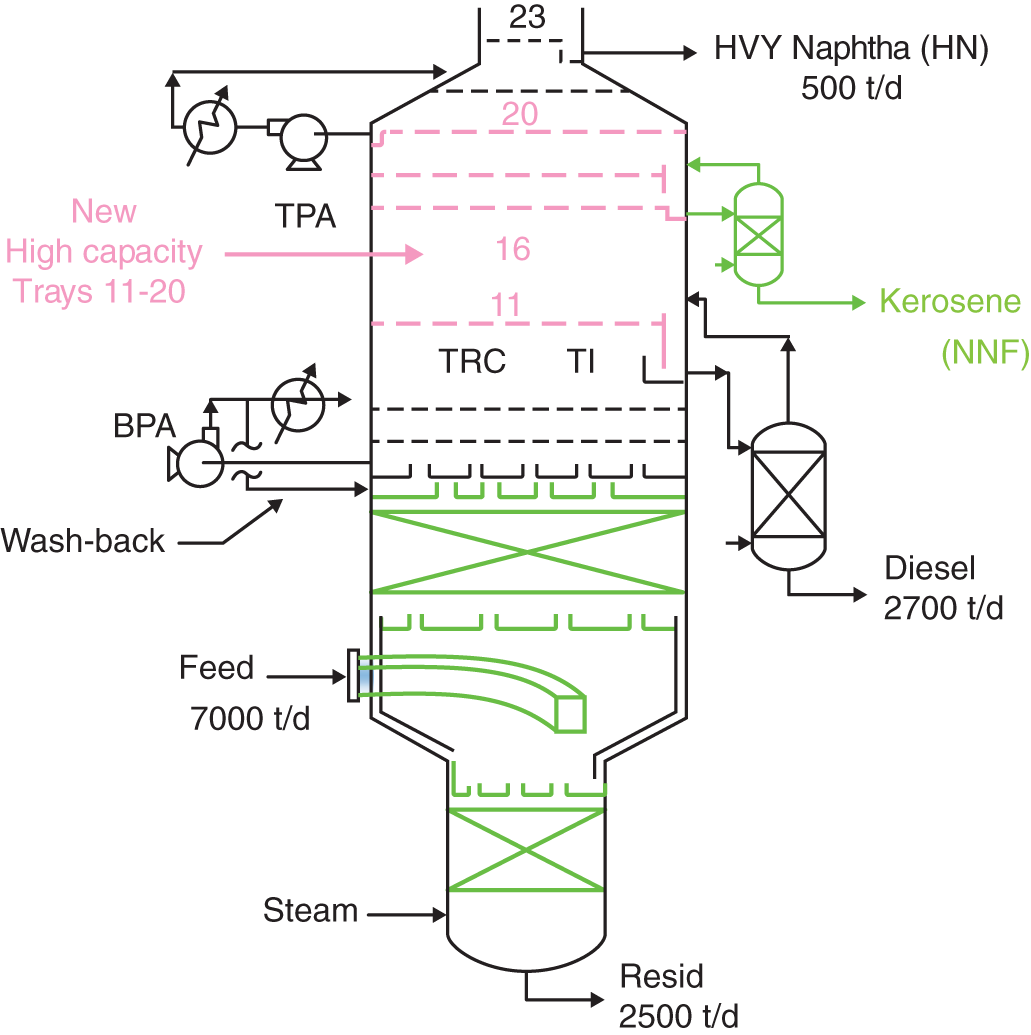
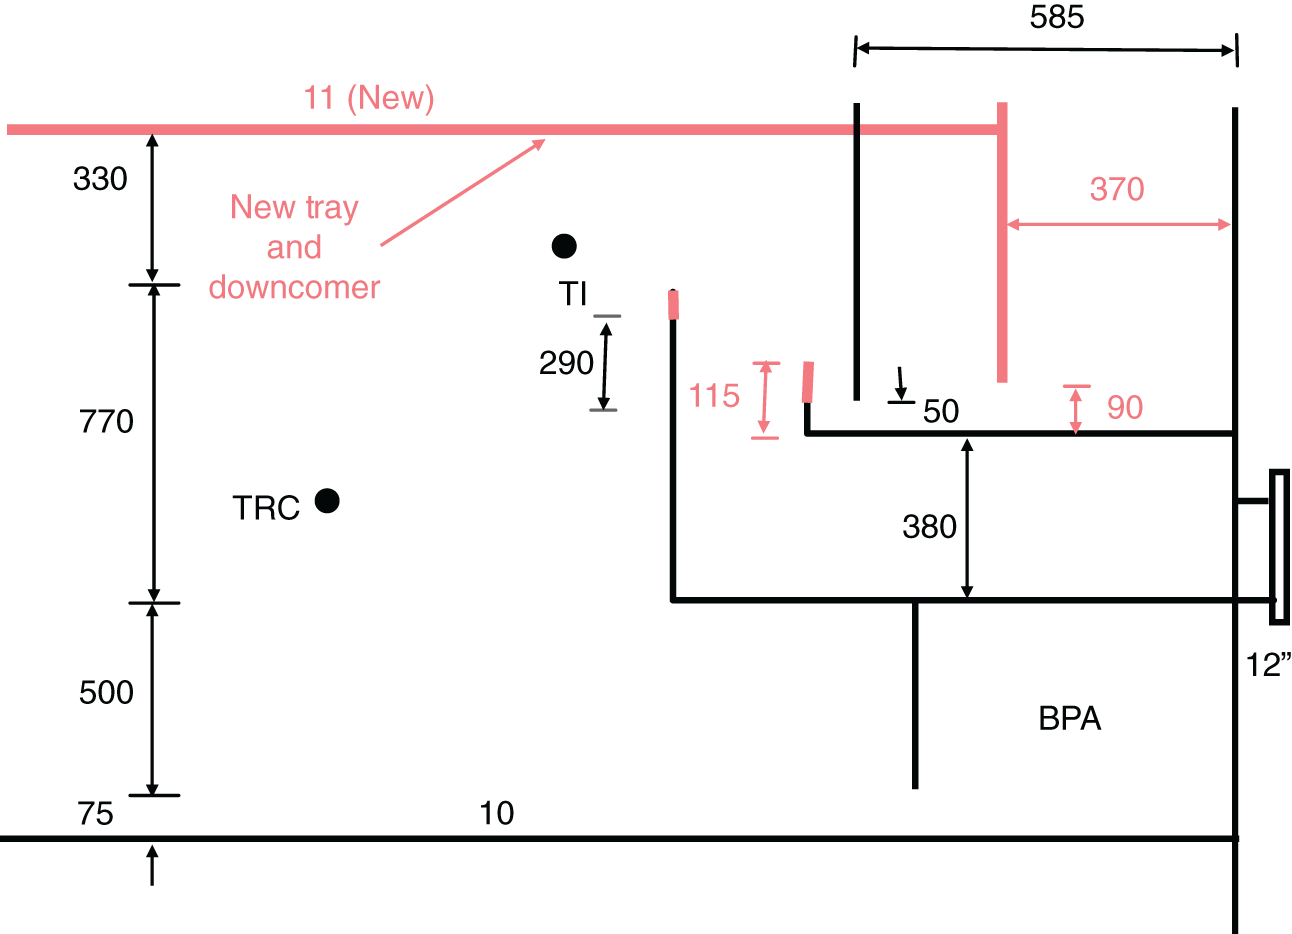

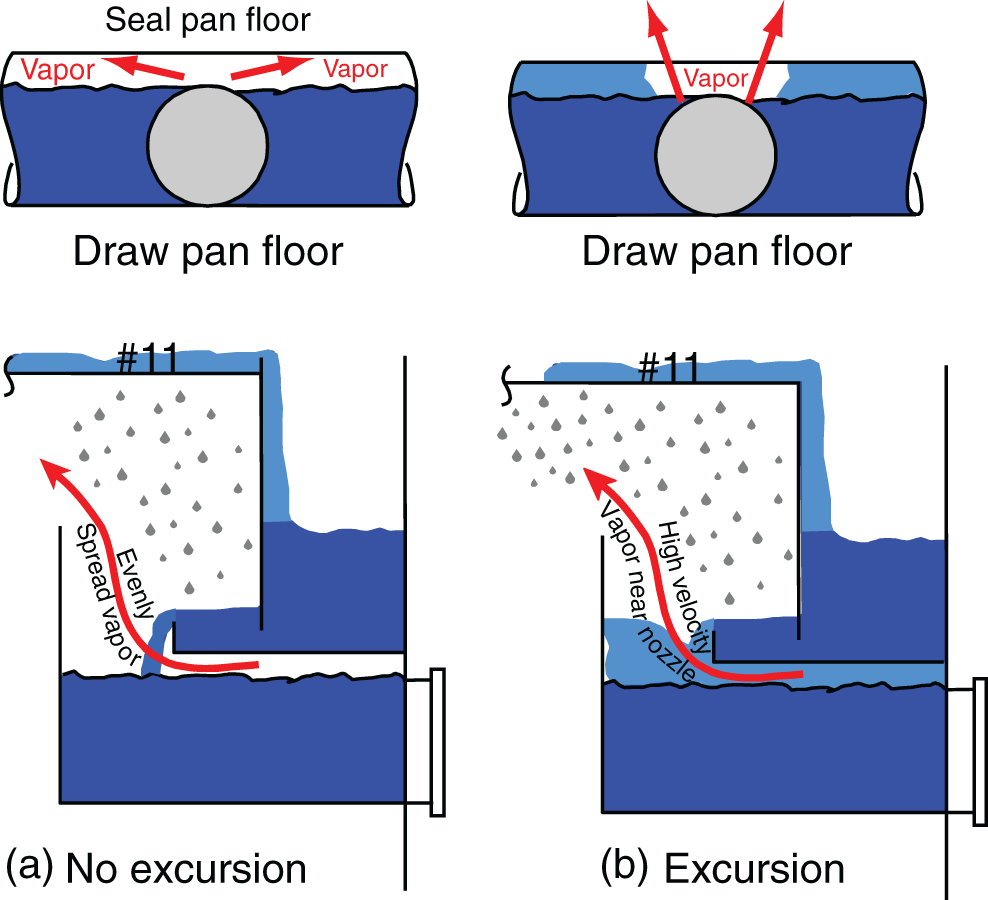
9.2.6 Field Testing Brings a Correct Diagnosis where Engineering Analysis Failed
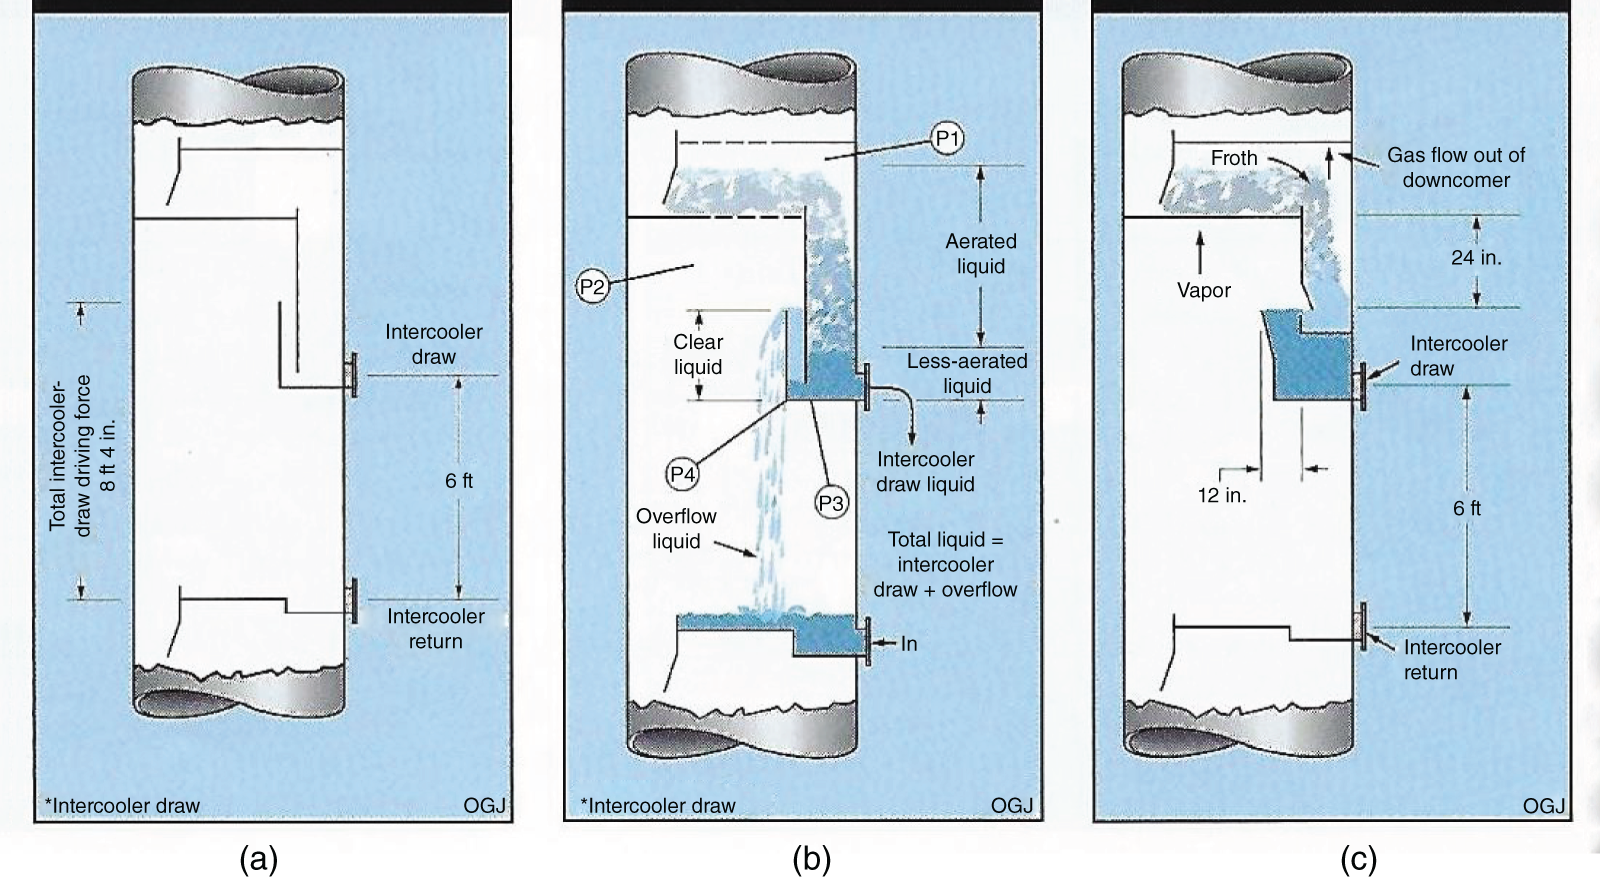
9.2.7 Operating Team Observations and Field Testing Brings a Correct Diagnosis where Engineering Analysis Failed
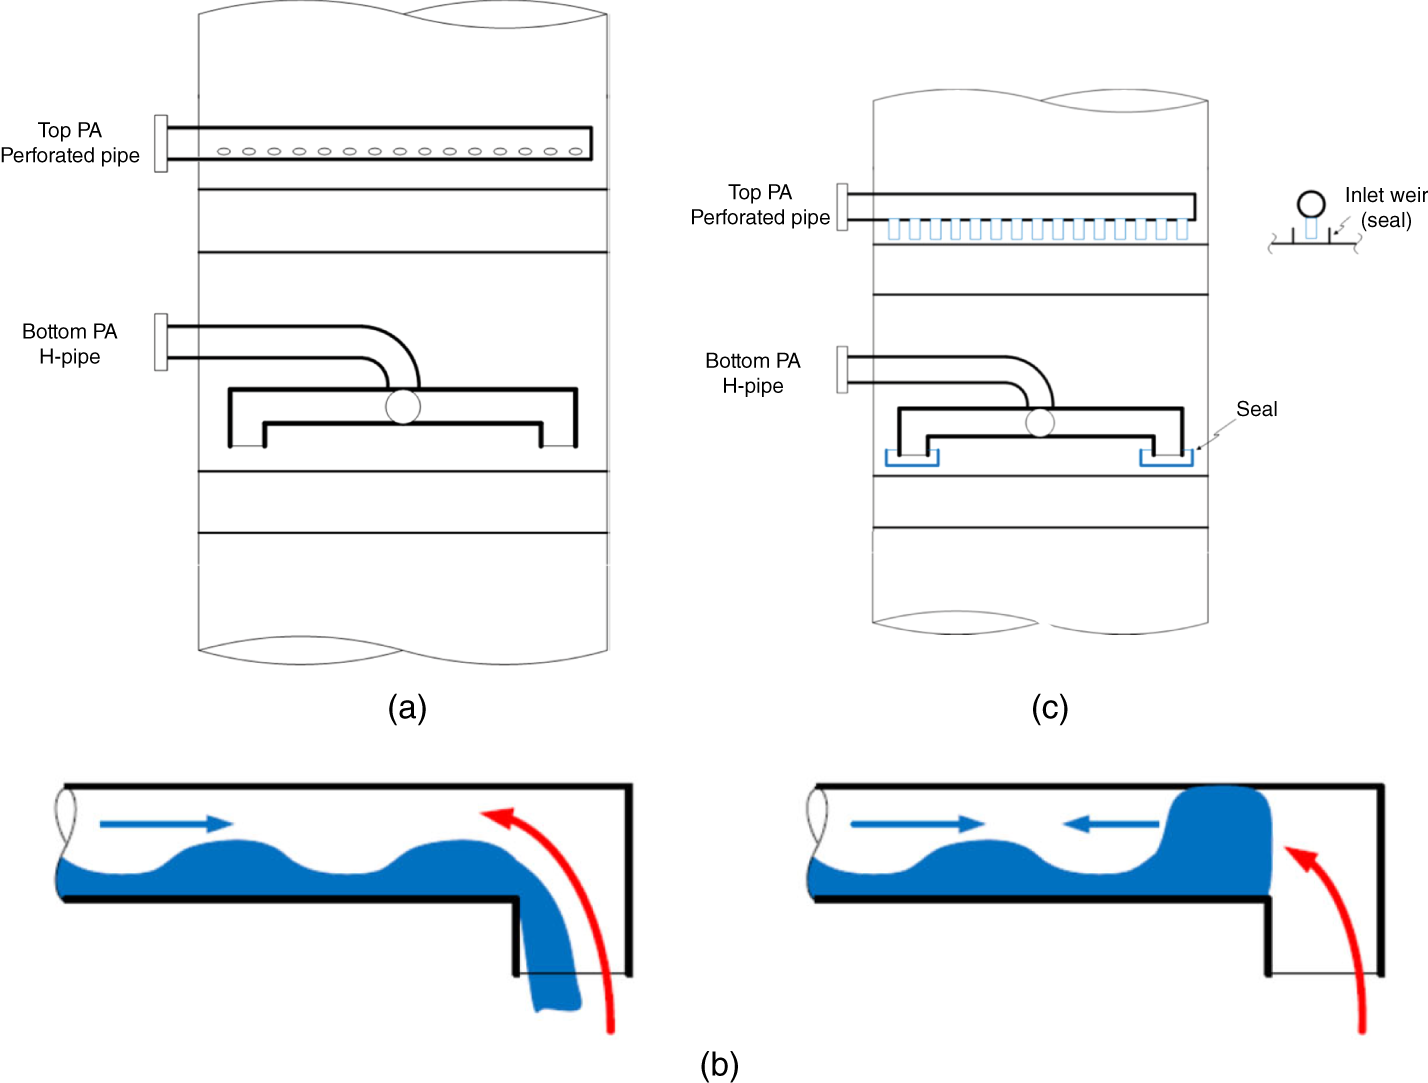
9.2.8 Lessons Learnt from Packed Tower History and Testing
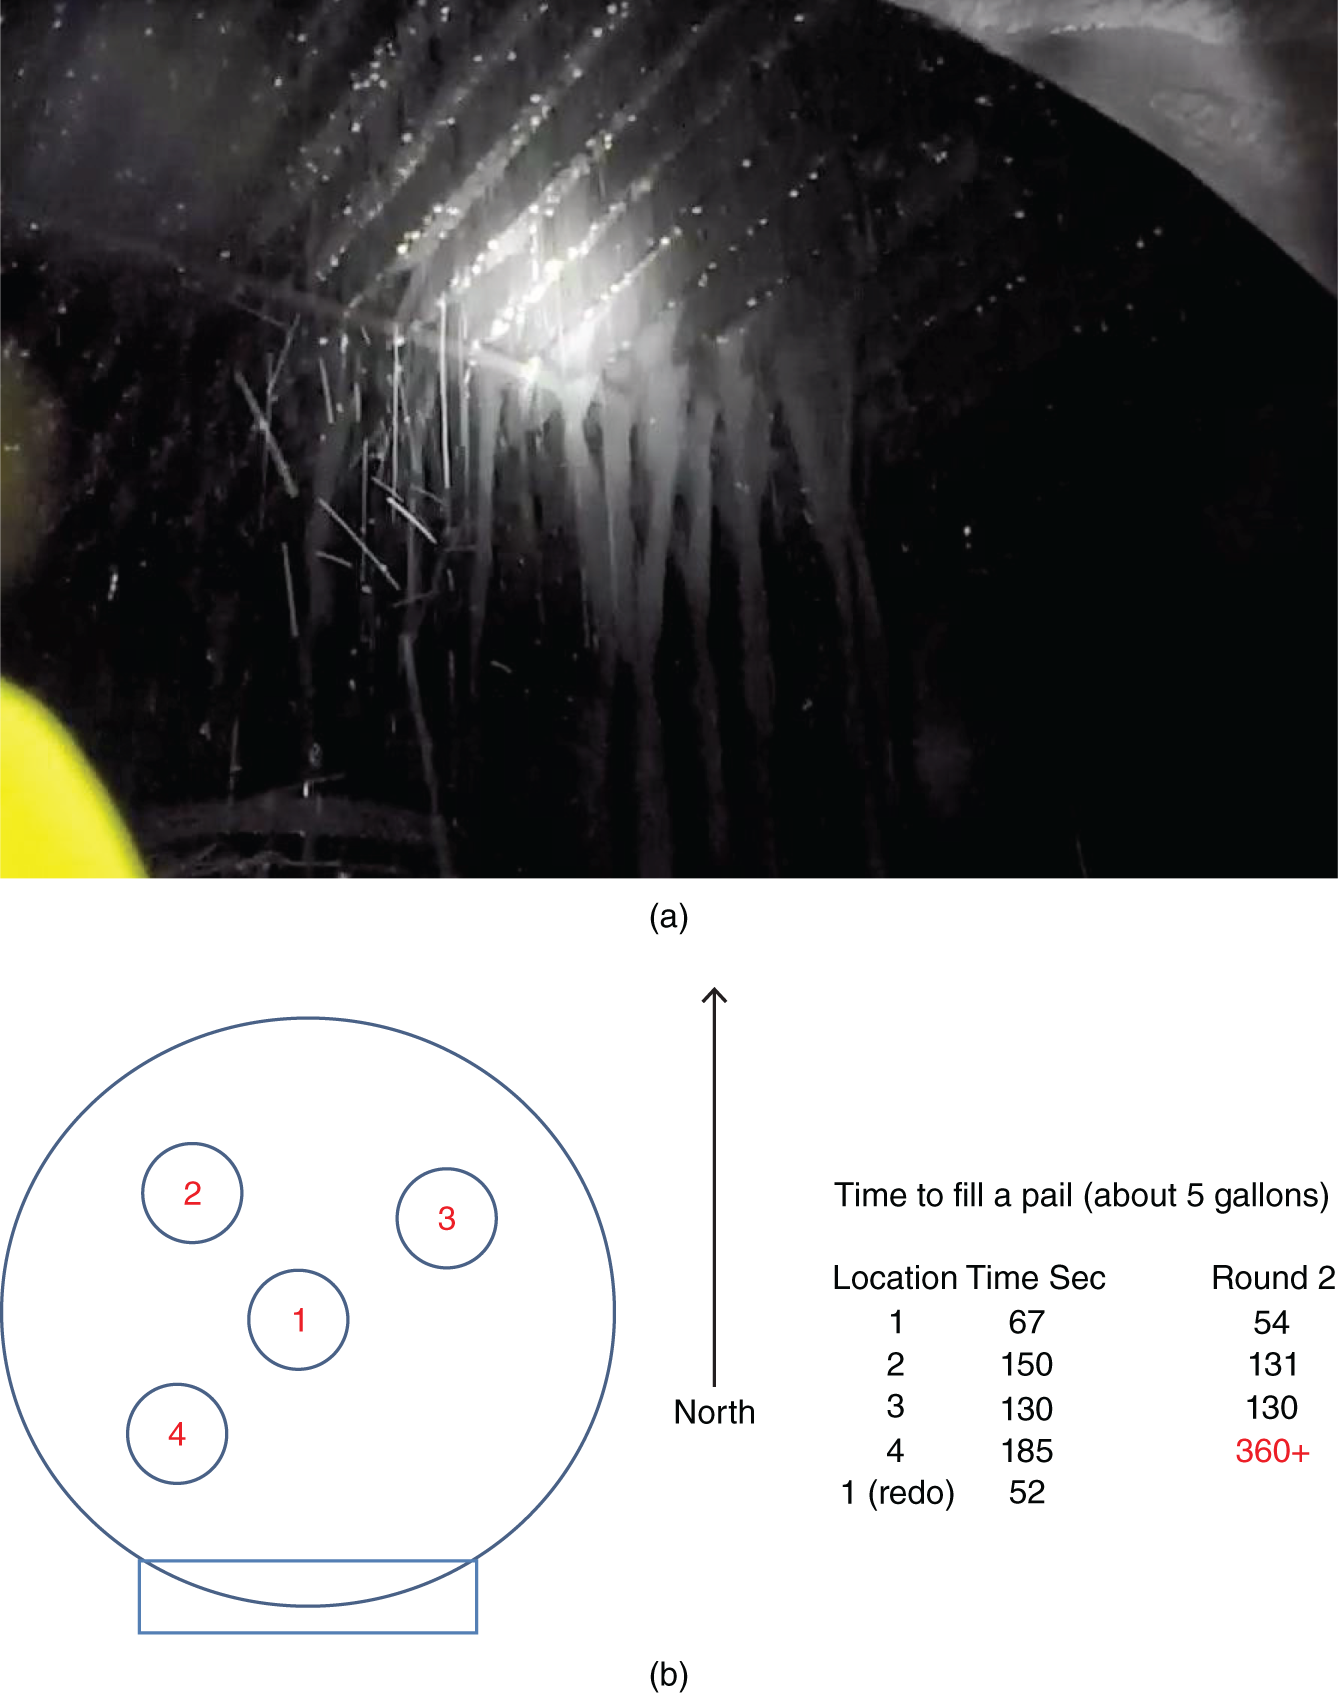
Making the Most of Field Data to Analyze Events and Test Theories
(9.1)