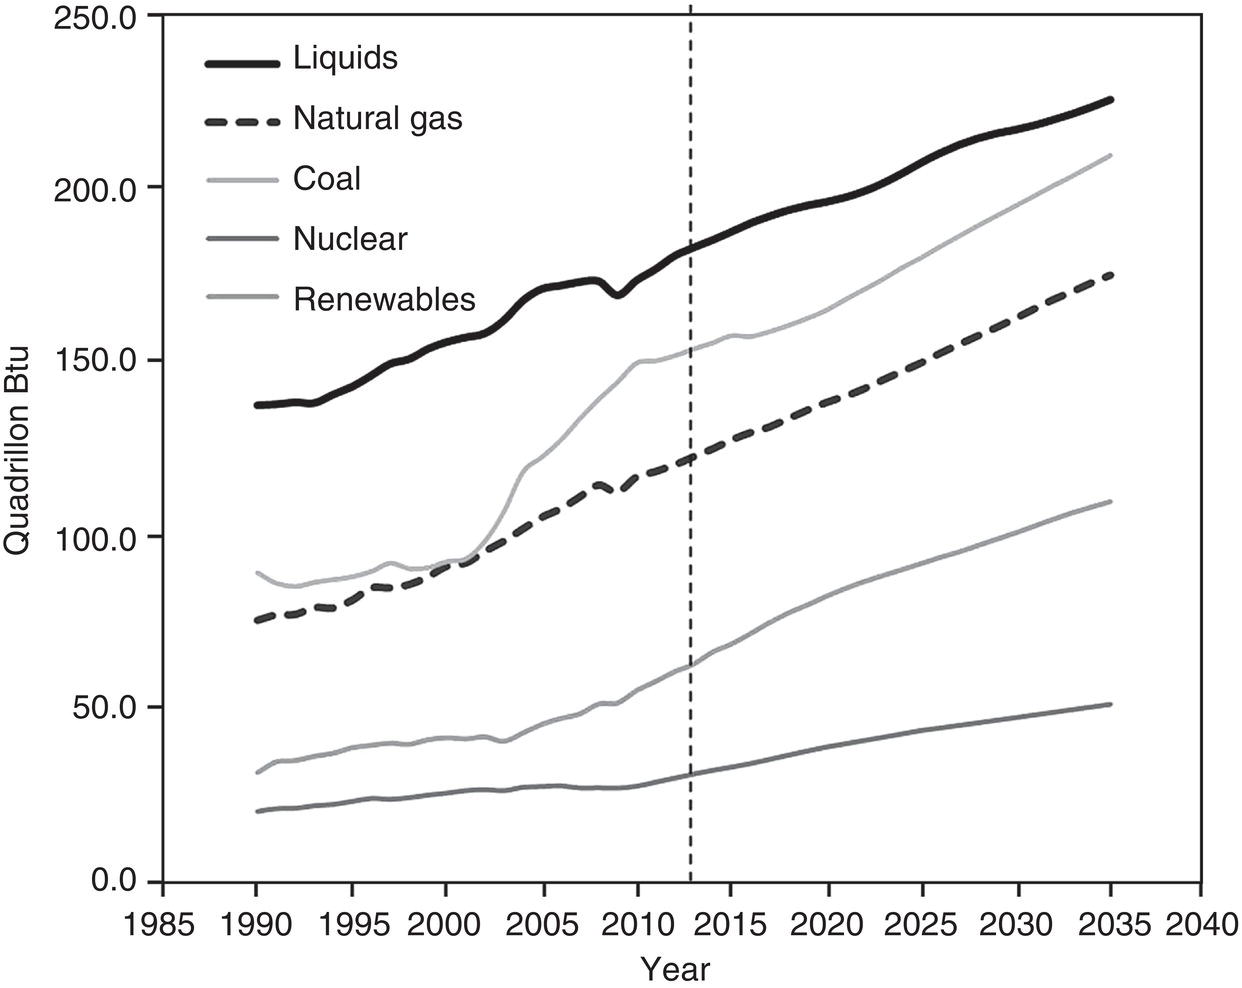
Roumen H. Petrov1,2, John J. Jonas*, Leo A.I. Kestens1,2 and J. Malcolm Gray4 1Department of Electromechanical, Systems and Metal Engineering, Ghent University, Ghent, Belgium 2Department of Materials Science and Engineering, Delft University of Technology, Delft, The Netherlands 3Department of Mining and Materials Engineering, McGill University, Montreal, Quebec, Canada 4Microalloyed Steel Institute Inc., Houston, TX, USA The predictions of the U.S. Energy Information Administration’s World Energy Outlook are that fossil fuels will remain the primary source of energy until 2035 and that primary gas consumption will almost double between 2006 and 2035, whereas oil demand will rise by 1.6% per year for the same period (Figure 16.1) [1]. Transportation of such amounts of gas and crude oil requires well-developed systems that operate under severe safety restrictions and varied environmental conditions. According to Ref. [2], the total length of high-pressure transmission pipelines around the world in 2006 has been estimated at 3,500,000 km, split as follows: ~64% carry natural gas, ~19% carry petroleum products, and ~17% carry crude oil. It is apparent that such transportation systems require special material properties and for many years the development of pipeline steel grades for pipelines has been a subject of exceptional interest for steel producers. The main challenges in the field are well known: pipeline grades should simultaneously fulfill a quite complex set of requirements. These include excellent weldability, very high toughness and strength over a wide temperature range, and exceptional crack arrestability. The specific sites of the largest gas and petroleum sources require the mechanical, chemical, and technological properties to be stable over a very large range. For example, pipelines should be able to operate at temperatures between +50 and −50 °C (and even lower). Increasing needs for the transportation of larger volumes also require pipelines to operate at higher pressures. This requirement is often solved by using pipes with thicker walls. However, the requirements for pipeline grades are more complex than the simplified description earlier, which refers mainly to weldability, strength, and toughness. In fact, in addition to excellent strength, toughness, and weldability, pipeline grades should have high corrosion resistance against sour hydrocarbons containing H2S and CO2, resistance to stress corrosion cracking, high fatigue strength, and resistance to collapse. Another important characteristic of pipeline steels is the anisotropy of the mechanical properties—strength and toughness. And last but not least, the abovementioned combination of properties should be achieved at an affordable price. The already mentioned set of mechanical (strength, toughness, and crack arrestability) and technological requirements (weldability) resulted in the development of the contemporary pipeline steel grades. The only way to control the mechanical properties of these grades is by the control of microstructure and crystallographic texture of the steel plates. This is possible (1) by the design of an appropriate chemical composition of the steel, and (2) by an appropriate thermomechanically controlled processing (TMCP). TMCP involves applying the appropriate rolling reduction at the appropriate temperature and employing the right cooling rate. Such an approach is known as thermomechanically controlled processing, and the exact parameters are dependent on steel chemistry, initial (before rolling) and final plate thicknesses, and of course the capacity of the rolling equipment. By this approach, metallurgical engineers are able to use effectively the various mechanisms contributing to the strength and toughness of the steel under the restrictions imposed by the thermophysical and geometrical parameters of the material. These include the thermal conductivity, quenchability, and plate thickness. Figure 16.1 World energy consumption by fuel, 1990–2035. ([1], 2011/Energy Information Administration/Public Domain.) The requirements for excellent weldability of the pipeline steels impose severe restrictions on their carbon content, which should be kept as low as possible. The low carbon content results in general in a decrease in the strengthening potential of the steel and in a decrease in the brittle-to-ductile transition temperature, which contributes to better low-temperature toughness. Under such circumstances, the most effective way of improving both strength and toughness is grain refinement. Grain refinement is in turn brought about via control of the recrystallization and transformation of the austenite to body-centered transformation product behavior. One of the prerequisites for such control is the microalloying strategy applied to pipeline steel grades. Microalloying of the pipeline steel has a multipurpose goal. On the one hand, microalloying is used to control the austenite grain size during hot rolling via pinning of the austenite grain boundaries and via the control (delay or even suppression) of austenite recrystallization, which results in finer transformation products at room temperature. On the other hand, the microalloying elements precipitate in the BCC phase and therefore contribute by precipitation hardening to the strength of the steel. A short historical overview of microalloyed steel grades shows that they were first introduced in the late 1930s [3], and initially the alloying elements V, Ti, and Nb were added separately in amounts between 0.005 and 0.01% (mass). Later on, with the advance in metallurgical understanding, they were added in combination with the intention of precipitating at different temperatures during rolling. Such a strategy extended the rolling mill function from merely being a tool for shape changing to a powerful tool for shape and property control. This change in approach has given rise to the development of the current generation of high-strength low-alloy (HSLA) steels. The first report of a hot rolled HSLA steel for a pipeline application came from Europe (Mannesmann) [3] in around 1952. This material was a normalized API Grade X52 microalloyed with vanadium. According to Refs [4, 5], it was later applied to API Grades X56 and X60 in 1953 and 1962, respectively. In North America, some hot rolled steels utilizing the microalloying concept were reported in 1959 [5–8] and these replaced normalized steels by 1972 [3–5]. By contrast, normalized medium carbon (0.17% C) steel grades were in use in the Soviet Union until the mid-1990s. Table 16.1 displays the chemical compositions of the niobium microalloyed steels proposed by Clarence L. Altenburger and Frederic A. Bourke [9]. Table 16.1 Chemical Composition Range of Niobium Microalloyed Steels, mass% Source: Adapted from Ref. [9]. The evolution of pipeline grades over the period 1949 to the present day and their associated yield strengths are discussed in detail in Ref. [3]. These developments are shown schematically in Figure 16.2. However, due to a number of reasons, the X70 and X80 grades are still the reference materials of today. The most important reason for restricting the application of the X100 and X120 pipeline grades despite their very high yield strengths is that these steels exhibit limited uniform elongations, that is, they cannot fulfill the requirements of strain-based design. This prevents their employment in earthquake regions. Nevertheless, X100 steel has already been used for demonstration and test purposes by the TransCanada Corporation in a pipeline [3].1 Currently, researchers are concentrating on enhancing the ductilities of these steels so that they can be considered for the construction of the next generation of pipelines [10]. In recent studies, Zhang et al. [11], Zhou et al. [12], and Nafisi et al. [13] have demonstrated that by appropriate combinations of alloying, TMCP, and heat treatment, significant improvements in the ductility and anisotropy of X120 can be achieved. Figure 16.2 Timescale of the development of different HSLA steel grades and the corresponding level of yield strength [3]. DSAW: double submerged arc welded; Q&T: quench and tempered; SMLS: seamless pipe. ([3], 2009/Elsevier.) The approximate chemical compositions of the most widely used steel grades are shown in Table 16.2. The combination of microalloying additions with TMCP allows the formation of a large range of microstructures varying from ferrite–pearlite to different types of bainite and bainite with islands of martensite and retained austenite (MA constituents). These approaches combine several simultaneously operating strengthening mechanisms, among which are solid solution strengthening, grain refinement, precipitation hardening, and work hardening (dislocation strengthening), all of which can be effectively controlled via the TMCP parameters. Finally, the specific steel composition and combination of microalloying additions to be used depends not only on the engineering requirements but also on the pipe wall thickness, alloy costs, and available processing equipment. An example of the progress in microstructure development, corresponding yield strength, and toughness, as well as the contributing strengthening mechanisms through the years, has been summarized by Vervynckt et al. [14]. This review surveys the general tendencies in microstructure formation as a tool to control the strength and toughness of pipeline steel grades. These developments can be expressed in general as follows: Table 16.2 Typical Compositions of most Frequently Used Pipeline Steel Grades [3, 11, 12] Source: Gray et al 2009; Zhang et al; Zhou etal. [3, 11, 12]. a Al: 0.02–0.05. A summary of the influence of the individual alloying elements on the microstructure and properties of contemporary pipeline steels according to Ref. [14] is given in Table 16.3 and more details can be found in Refs [4, 14], whereas an extensive review of the evolution of the strength of microalloyed pipeline steels can be found in Refs [3, 4, 15, 16]. The specific chemical composition of a steel is designed to ensure that the required combination of the functional and technological properties is satisfied. As already mentioned, the pipeline steels are in general low carbon grades alloyed with Mn and with well-balanced microalloying additions. The chemical composition aims to balance two conflicting criteria: (1) good weldability and (2) sufficient toughness, strain hardening capacity, and ductility. If the limiting criterion is only the strength, this can be readily achieved by quenching and tempering steels with sufficient carbon content to provide good hardenability. However, high carbon contents are in direct conflict with the requirements for good weldability, toughness, and ductility. To fulfill these complex and even conflicting criteria, the carbon content in the pipeline grades is kept as low as possible and a specific combination of the processing steps known as TMCP is utilized. TMCP was developed in the 1960s [15] as an advanced variant of HSLA steels. The general approach in TMCP is to use a relatively low carbon content (to provide good weldability) in combination with sufficient Mn to decrease the austenite-to-ferrite transformation temperature. In combination with a critical quench or cooling rate and minor additions of alloying elements such as Nb, V, Ti, Mo, and so on (Table 16.2), sufficient steel strengthening is produced via various mechanisms such as grain refinement, solid solution strengthening, precipitation hardening, the introduction of hard second phases, and increased dislocation density (Figure 16.3). Because of their extreme harmfulness with regard to embrittlement, it should be explicitly mentioned that extreme cleanliness of these steel grades is required with respect to sulfur (S) and phosphorus (P), which must be reduced to the part per million level [3]. TMCP additionally involves the controlled distribution of the rolling reductions in the regions above and below the austenite no-recrystallization temperature (Tnr) to create the required very fine-grained microstructure. More precisely, the final hot rolling passes must be applied below the Tnr temperature so that the heavily deformed austenite does not recrystallize. The microstructure of austenite that has been heavily deformed before the γ–α transformation consists of a large number of internal defects—dislocation tangles, slip bands, shear bands, high- and low-angle grain boundaries (HAGB and LAGB), which provide abundant potential nucleation sites for the BCC and BCT constituents (ferrite, bainite, or martensite). As a consequence, a very fine-grained microstructure is developed that contributes to both the high strength and high toughness of the TMCP grades. Table 16.3 Influence of Alloying Elements on Properties of Pipeline Steels Source: Adapted from [14]. Figure 16.3 Development of pipeline steels as example of HSLA steel research. TMCP: thermomechanically controlled processing; ACC: accelerated cooling; DQ: direct quench. ([14], 2012/with permission of Maney Publishing.) A general scheme of microstructure formation during TMCP is shown in Figure 16.4 [14]. In an integral processing schedule after slab casting, there are several important stages where microstructure formation can be intentionally controlled: (1) slab reheating, (2) rough rolling, (3) finish rolling, and (4) controlled cooling. The “classical” organization of a (sheet) strip rolling mill and its main ancillary equipment for the rolling of pipeline steel grades are shown in Figure 16.5. Only some of the pipeline steels are produced in the form of sheet, as a significant part is rolled into plate. The difference between plate and sheet involves the final thickness of the product. According to Dieter [17], plates generally have thicknesses greater than 6 mm, whereas sheet and strip are thinner than 6 mm. However, in pipeline steel production, the abovementioned thickness limits are not rigid and the term “sheet” is employed for final products that are coiled, whereas plates are flat products that are not coiled. Nowadays, coilers are so powerful that they can coil flat products with thicknesses up to 24 mm and so the boundary between plate and sheet involves the coiling or absence of coiling in the final processing stage. The final lengths of plates can extend to 24 m and widths to 4.5 m, but in general the dimensions selected depend on the target pipe dimensions and can vary significantly. Note that coils are used not only for spiral welded pipes but also (after flattening) for cut-to-length sheets for LSAW (longitudinal submerged arc welding) as well as for relatively small-diameter ERW/HFI welded pipes. An example of a typical plate rolling mill and its ancillary equipment is provided in Figure 16.6. The slab reheating stage is the first stage in the production line for conventional controlled rolling (CCR) and TMCP. Here the as-cast slabs are transferred to the reheat furnace next to the rolling line. The as-cast slab microstructure is formed under conditions of slow cooling with a very large temperature gradient between the surface and the central zone. It is characterized by the presence of large dendrites as well as of the segregation of the alloying elements in the interdendritic spaces (Figure 16.7a and b). This is generally accompanied by typical centerline segregation, which is a large-scale segregation phenomenon (Figure 16.8). Macrosegregation is an important microstructural parameter because it changes the through-thickness composition of the plate, which in turn creates different microstructures and properties through the plate thickness. Davis and Strangwood [18] provided a detailed analysis of macro- and microsegregation phenomena, but it is also well documented in a large number of studies [18–20]. Figure 16.4 Schematic diagram of thermomechanically controlled processing and the microstructures that result from this process. ([14]/with permission of Taylor & Francis Group.) Figure 16.5 A “classical” arrangement of a strip rolling mill for the hot rolling of steel slabs with ancillary equipment. Figure 16.6 An example of the arrangement of rolling mills for plate rolling with ancillary equipment. Currently, continuous casting is generally used in pipeline steel production. The solidification rate during continuous casting is higher than in the ingot casting method, which minimizes the secondary dendrite arm spacing (SDAS). The latter are preferential sites for local microscale segregation. However, macrosegregation is still present, which is manifested as a difference in composition between the core and the case. Macrosegregation in slabs appears not only across the slab thickness but also along the slab width. In summary, the local average composition depends on the macrosegregation behavior, and the spatial separation of solute-rich and solute-poor regions (i.e., the SDAS) depends on the casting characteristics (particularly heat and fluid flow), which are different for various casting methods and casting speeds. Such segregation effects can have an undesirable influence on the mechanical properties of the plate because they create prerequisites for variations in the grain size of the plates (i.e., they lead to bimodal grain size distributions) and even for the formation of different microstructures along the centerline of the plate [18, 20]. It is shown in the same work [18] that both centerline macrosegregation and microsegregation can in most cases be successfully predicted by the methods of equilibrium thermodynamics. Nevertheless, the equilibrium thermodynamics approach to centerline segregation is not successful when more than one solid phase is formed during final solidification. Figure 16.7 (a) Large eutectic Nb(C, N) particles observed at the centerline position of a slab. (b) EDS spectrum from one of these particles. ([18]/with permission of Taylor & Francis Group.) Figure 16.8 Optical micrographs showing (a) near-surface and (b) centerline segregation in a pipeline slab of composition: 0.03% C, 0.25% Si, 1.70% Mn, 0.008% P, 0.005% S, 0.052% Al, 0.082% V, and 0.063% Nb. ([18]/with permission of Taylor & Francis Group.) Slab reheating cannot completely remove segregation, but it creates conditions suitable for the further control of the microstructure by determining the austenite grain size and the level of dissolution of the alloying elements in the austenite. In fact, the austenite grain size and the level of dissolution of the elements are connected because the incomplete dissolution of the alloying elements suppresses austenite grain growth. Therefore, the selection of the slab reheating temperature is made considering two important restrictions: In their work, Zajac and Jansson [19] studied the thermodynamics of the Fe–Nb–C–N system and the solubility of niobium carbonitrides in austenite. They showed by thermodynamic calculations, well supported by experimental results, that the dissolution temperatures of the microalloying elements depend on the actual combination of alloying elements and presented a method for the accurate prediction of the solubility of niobium in the presence of titanium, aluminum, boron, and vanadium. It is also important to note that all the alloying elements are completely dissolved in the austenite only at temperatures above 1380 °C (Figure 16.9). However, such high reheat temperatures are not used in rolling practice, and reheat temperatures usually do not exceed 1250 °C. In this way, small amounts of Ti (CN) and Nb (CN) remain undissolved and prevent unwanted austenite grain growth (Figure 16.10) [21]. Figure 16.9 Calculated curves for the precipitation of TiN, Nb (C, N), and V(C, N) and experimental data for Nb(C, N) in a Nb–Ti microalloyed steel with 0.013% Nb and 0.007% Ti. ([19], 1998/with permission of Springer Nature.) In summary, the reheating parameters generally take into account the required dissolution temperatures of the various carbonitride types to promote appropriate control of the austenite grain size before rough rolling. Segregation of the elements through the slab thickness is an important microstructural parameter that is difficult to control but must be considered. After leaving the reheat furnace, the slabs enter the scale breaker where the thick oxide layer formed on the slab surface is removed by powerful water jets. Immediately after the scale breaker, the slab is moved to the first roughing mill where rough rolling begins. This is the stage of rolling applied above the austenite nonrecrystallization temperature (Tnr), also known as the recrystallization stop temperature. The latter is the temperature above which austenite completely recrystallizes between rolling passes. This temperature is not a physical constant of the material but an important technological parameter of the process. The austenite nonrecrystallization temperature for a specific steel grade in a given rolling process depends on the chemical composition of the steel (alloying with elements such as Mo, Nb, Ti, V, and Al) and on the rolling parameters (strain per pass, interpass time, and cooling rate). The nonrecrystallization temperature (Figure 16.11) increases with the concentration of Nb, Ti, Al, and V and, in particular, the level of Nb addition has the strongest effect [21–23]. TMCP steels with niobium additions above 0.10% are also referred to as HTP (high-temperature processing) steels. Figure 16.10 Change in the composition of the microalloy precipitates with increase in reheat temperature from (a) 1348 K (1075 °C) (Nb-rich (Nb, Ti, V) (C, N)) to (b) 1473 K (1200 °C) (Ti-rich (Nb, Ti)(C, N)), as indicated by EDS analysis. ([21]/with permission of Springer Nature.) Figure 16.11 Effect of different elements on the austenite recrystallization stop temperature for a 0.07 C–1.4 Mn–0.25 Si steel. ([22], 1982/with permission of Institute of Materials, Minerals & Mining.) An empirical correlation between the Tnr and the chemical composition was proposed by Boratto et al. [24], and Tnr values for microalloyed steels have frequently been reported in the literature [24–26]. In most cases, Tnr values are determined by measuring the mean flow stress (MFS) of the steel at different temperatures in the rolling mill or in laboratory tests (most often torsion tests). After plotting the MFS as a function of 1000/T, the Tnr is defined as the point at which there is a slope change in the experimental data [14, 24–26]. Recently, Gautam et al. [27] proposed a more accurate way of analyzing the temperature dependence by detecting changes in the rate of strain hardening at different temperatures instead of the MFS. An accepted practice in the rolling of pipeline grades is that rolling reductions accumulating to approximately 60% are given above the austenite nonrecrystallization temperature (Tnr) and rolling reductions accumulating to at least 70% are applied below the Tnr [28]. The main goal of rolling above the Tnr is to refine the austenite grain size by complete recrystallization of the austenite between passes. The high rolling temperatures and complete recrystallization allow high rolling reductions to be applied in a relatively low number of passes. However, there are no universal recipes for the reduction percentages. These depend on the capacities of the rolling mills, crop shear capabilities, desired transfer bar dimensions, final product thickness, and so on. Depending on the slab thickness and the requirements of the final product, there are two main possibilities: (1) the final product is the plate for longitudinally welded pipes; and (2) the final product is the plate for spiral welded pipes. In the case of longitudinally welded pipes with a diameter of 1.43 m, the width of the plate must be ~4.5 m, which requires the first passes of rough rolling to produce the required width dimension. Therefore, the slab is first cross-rolled to a width of ~4.5 m and then is rotated 90° and conventionally rolled above and below the Tnr to the final thickness. The change in rolling direction (RD) in the broadside passes not only leads to the exact width of the plate but also minimizes the segregation in the transverse direction (TD) of the slab. The exact lateral dimensions are obtained by rolling with vertical rolls in the first rolling passes. In cases where the slab is intended for spiral welded pipes, the width of the plate is close to the initial width of the slab and the rolling direction is maintained constant during rough rolling. Here again, vertical rolls are used for lateral dimension control (TD). These two approaches impose specific restrictions with regard to the interpass times between the rough rolling passes or between rough rolling and finish rolling, which can influence the austenite microstructure by causing grain growth after rough rolling. In Figure 16.12, the evolution of the austenite grain size after leaving the reheating furnace and cooling to the start temperature of finish rolling is illustrated for a steel containing 0.06% C, 1.6% Mn, 0.055% Nb, and (Mo + Ni + Cu + Cr) < 0.1%. The initial austenite grain size of 58.1 μm after reheating at 1250 °C for 1 h (Figure 16.12a) is reduced to an average grain diameter of 26.1 μm after three rough rolling passes at 1250, 1220, and 1180 °C subsequently (Figure 16.12b). However, during 1 min of cooling at the temperature interval from 1180 to 1060 °C, grain growth of the recrystallized austenite takes place and the average austenite grain diameter increases to 34.5 μm (Figure 16.12c) [29]. The austenite grain size during rough rolling is controlled by the chemical composition of the steel [31] and the distribution of the rolling reductions between the passes. Detailed studies of the recrystallization and strain accumulation behavior especially with regard to high Nb steels can be found in Refs [23, 28, 32, 33]. Figure 16.12 Pipeline steel microstructures showing the austenite grain size (a) after reheating at 1250 °C, 1 h, dav = 58.6 μm, (b) after three rough rolling passes at 1250, 1220, and 1180 °C, dav = 26.1 μm; and (c) at a temperature of 1060 °C, which was reached ~1 min after the last roughing pass at 1180 °C, dav = 34.5 μm [29]. All the samples were water quenched from the above temperatures and etched using the Bechet-Beaujard technique. Scale bar is 50 μm. ([30]/with permission of Trans Tech Publications Ltd.) Deformation, precipitation, solute drag, recovery, and recrystallization are the main metallurgical phenomena that control microstructure formation over the entire TMCP route. Their interactions are reviewed in detail in Ref. [23]. They can be successfully controlled by adjusting the chemical composition and the rolling parameters, including the reheat temperature, the temperatures at which the rolling passes are applied, the interpass time, the rolling reduction per pass, the strain rate, and so on, as already described. After rough rolling, the slabs are transferred to the finish rolling mill where the final plate thickness and length are established. The number of finish rolling passes depends on the final plate thickness and the available rolling equipment. As can be seen from Figure 16.13, the finish rolling passes are usually executed with decreasing reductions per pass accompanied by decreases in the rolling temperature. In most cases, the overall rolling reduction applied during finishing (i.e., below the Tnr) is ~70%. Because the individual rolling reduction is not additive (the plate finishing reductions in Figure 16.13 add up to more than 100%), it is common to add the reductions in the form of true strains. According to this measure, total von Mises strains of at least 1.4 should be applied below the Tnr (or at least 1.2 when specified in-plane strain units). Figure 16.13 Examples of the rolling reductions applied in different rolling schedules. I: Rolling of plates for spiral pipes (gray) without broadside passes. II: Rolling of plates for longitudinally welded pipes where the first six roughing passes are broadside passes. (Adapted from [28].) Figure 16.14 Schematic of classical TMCP and HTP. (Adapted from [28].) The temperature distribution between rolling passes, the reductions per pass, and finish rolling temperature play important roles in the microstructure formation of the plate. Selection of the rolling parameters depends on the specific steel grade; Figure 16.14 shows schematically an example of the distribution of the finish rolling passes in the case of classical TMCP and the so-called HTP method, which is applied to high Nb content (~0.1% Nb) pipeline grades [28]. As can be seen, the HTP rolling schedules are usually terminated at higher finish rolling temperatures of ~20–70 °C above the Ar3, whereas in the case of “classical” TMCP the finish rolling temperature is much closer to the Ar3 or in some cases the final rolling pass can even be slightly below the Ar3, that is, in the intercritical temperature region where some volume fraction of ferrite is formed before or during the last rolling pass. However, finish rolling in the intercritical region is not a common practice because, although it contributes to increasing the yield strength of the plates, it often decreases the impact toughness and can lead to delamination effects associated with the development of a bimodal grain structure and strengthening of the undesirable {001}(110) texture components [34, 35]. Microstructure formation during finish rolling is controlled by the pretransformation state of the deformed austenite—grain size, grain morphology, and distribution of in-grain defects (in-grain shear bands, deformation twins, dislocation in-grain substructures, etc.). All of the abovementioned defects have different effects, which depend on their efficiency as potential BCC nucleation sites during the γ–α phase transformation that takes place during the final cooling stage. In addition, precipitation of microalloying elements (Nb, V, and Ti) continues during finish rolling making the description of microstructure formation even more complex. Nevertheless, all the internal defects present in the deformed austenite before transformation contribute to grain refinement of the product BCC structure. The latter is the important microstructural parameter that determines the strength and toughness of the plate. Depending on the chemical composition of the steel, the start and finish temperatures of finish rolling, the distribution of the rolling reduction between passes, and the cooling rate, different types of microstructures can be obtained in the rolled plates. It is important to mention that often the final microstructures vary in the plate thickness due to local variations in chemistry and cooling rate and the through-thickness strain distribution. However, the design of an appropriate technological process primarily involves minimization or if possible the complete avoidance of heterogeneities in the through-thickness microstructure and properties. As pipeline steels are produced under conditions of continuous cooling, the microstructure is generally a mixture of constituents such as ferrite, bainite (upper, lower, and granular), degenerated pearlite (Figure 16.15a and b), martensite, martensite–austenite islands, and carbides (Figure 16.15). It is thus difficult to characterize the microstructural constituents exactly because sometimes they have similar morphologies, such as bainite and acicular ferrite, or lower bainite and martensite. Nevertheless, electron backscatter diffraction (EBSD) analysis provides the possibility of distinguishing more clearly between some of the constituents on the basis of crystallography or lattice misorientation. These approaches are discussed by Zajac et al. [37] and are illustrated in Figure 16.16. By analyzing the misorientation angles in different pipeline microstructures, Zajac et al. [37] concluded that lower bainite displays a misorientation spectrum with a well-pronounced maximum at ~60° (Figure 16.16c), whereas the spectrum of upper bainite displays a maximum at around 10° (Figure 16.16b). The misorientation spectrum of granular bainite is more blurred and contains peaks at around 10° as well as in the range between 45° and 60° (Figure 16.16a). However, the overlaps in the misorientation profiles of lower bainite and martensite, as well as of upper bainite and ferrite [38], prevent the application of this technique to mixed microstructures containing combinations of these constituents. A very important parameter of the finish rolling sequence is the cooling schedule that, together with the parent austenite microstructure, determines the final microstructure of the plate. As already mentioned (Figure 16.4), depending on the composition and processing parameters, various pipeline steel grades can form mixed microstructures of ferrite and pearlite, often denominated as “degenerate” pearlite (Figure 16.15a and b) [36], or of acicular ferrite and bainite in combination with small amounts of martensite and retained austenite (Figure 16.15c), or of bainite and martensite, as described in Refs [3, 14]. In all cases, the morphology of the BCC transformation products inherits the elongated shape of the hot-rolled and unrecrystallized austenite, creating a morphological (structural) shape anisotropy. In the undeformed austenite, the nucleation of the body-centered phases (or constituents) starts below the Ar3 temperature; however, in the strained austenite, the Ar3 temperature shifts to higher values and is often denominated as an Figure 16.15 (a) Microstructure of ferrite and pearlite (degenerated pearlite) in API X52 steel. ([36]/with permission from Elsevier.) (b) The microstructure of degenerated pearlite. ([36]/with permission from Elsevier.) (c) Microstructure of X80 pipeline grade with upper bainite (B) and zones with lower bainite and martensite–austenite islands (MA) (original research by Petrov). The white spots in the image were identified as carbides situated on the interlath spaces of the bainite. Nucleation of the body-centered phases in this case is controlled by the defects in the austenite, and the preferential nucleation sites are high-angle grain boundaries and in-grain shear bands (Figure 16.17a and b) [39]. In the latter case, it appears that the HAGBs are the preferential nucleation sites, whereas the in-grain defects are less effective. The body-centered transformation products have specific morphologies that are characterized by their pancaked shapes and orientations [40, 41]. These features are illustrated in Figure 16.18a and b and are characterized in more detail in Refs [40, 41]. In most cases, the product grains can be approximated by ellipsoids with long, short, and mid-length axes (Figure 16.18b). Figure 16.19 displays equal-area pole figure plots of the longest and shortest grain axes with respect to the plate coordinate system—rolling direction (RD), normal direction (ND), and transverse direction (TD). Here more than 200 individual grains (upper or lower bainite) have been sampled. The grain shape data were obtained by 3D EBSD analysis of the mid-thickness of an 18 mm steel plate of API X80 steel. The data in Figure 16.19 indicate that rolling followed by accelerated cooling contribute to the formation of a microstructure with an increased density of grains with their longest axes oriented along or close (~30–45°) to the plate RD and TD (Figure 16.19a). This observation can be associated with the elongated shapes of the parent austenite grains and the subsequent nucleation and growth of the BCC phase along the strain-generated structure [39]. More quantitative characterizations of the influence of temperature, cooling schedule, and the distribution of rolling strain between finishing passes can be found in Ref. [42]. Figure 16.16 EBSD-orientation maps and distributions of the misorientation angles of the ferritic grains in (a) granular bainite (GB), (b) upper bainite (UB), and (c) lower bainite (LB). ([37]/with permission of Trans Tech Publications Ltd.) Figure 16.17 Microstructure of steel with 0.082% C, 1.54% Mn, 0.35% Si, 0.055% Nb, and 0.078% V finish rolled at 850 °C and subsequently quenched at (a) 800 °C and at (b) 720 °C, respectively, to reveal the evolution of the BCC and BCT phases as a function of temperature. Ar3 = 790 °C; ([39]/with permission of Elsevier.) By the systematic study of grain size evolution as a function of the finish rolling parameters, namely, rolling reduction per pass, start finish rolling temperature, and the cooling rate in plates rolled to a final thickness of 12 mm, Carretero Olalla et al. [42] confirmed that accelerated cooling makes the most significant contribution to grain refinement. A summary of the results of this study is provided in Figures 16.20a and b and 16.21, where the microstructure of a pipeline grade steel is represented by EBSD maps displaying only the high-angle (>15°) and low-angle (2–15°) grain boundaries as a function of rolling reduction per pass, start finish rolling temperature, and cooling rate after the final rolling pass—accelerated cooling (ACC) (Figure 16.20) or air cooling (Figure 16.21). The rolling schedules were carried out under exactly the same rough rolling conditions but various finish rolling parameters, namely, high start finish rolling temperature and increasing reduction per pass (schedule I, Figures 16.20a and 16.21a), low finish rolling temperature and increasing reduction per pass (schedule II, Figures 16.20c and 16.21c), high start finish rolling temperature and decreasing reduction per pass (schedule III, Figures 16.20b and 16.21b), low finish rolling temperature and decreasing reduction per pass (schedule IV, Figures 16.20d and 16.21d), and accelerated cooling (ACC) (Figure 16.20a–d) or air cooling (air) (Figure 16.21a–d). It should be pointed out that the rolling schedule of the plate with the microstructure shown in Figure 16.21c began and finished at temperatures 20 °C higher than the rest of the low-temperature rolling experiments. This is the reason for the larger grain size in Figure 16.21c. Figure 16.18 (a) Three-dimensional EBSD reconstruction of a volume of 16.5 × 16.25 × 22.1 μm3 from the central part of an API X80 pipeline plate 18 mm thick, and (b) selected representative grains contained in a volume of 108 μm3 from the interior. The gray shades represent the crystallographic orientations of the grains with respect to the rolling plane (see the unit triangle). Another important finding is that significant grain refinement can be successfully achieved by starting finish rolling at low temperatures in both the accelerated and air-cooled conditions. Figure 16.22 shows that a combination of a low start finish rolling temperature and air cooling also results in significant grain refinement (Figures 16.21d and 16.22). Note that the finish rolling temperatures were higher for low FRT (air)-increasing reduction/pass than for low FRT (ACC)-increasing reduction/pass. Figure 16.19 Equal-area plots of the (a) longest and (b) shortest axes of ~200 individual BCC grains with respect to the sample coordinate system (ND, RD, TD) of an 18 mm thick TMCP plate of API X80 steel. (Adapted from [41], 2007.) Figure 16.20 Grain boundary maps of (a) schedule I, (b) schedule III, (c) schedule (II), and (d) schedule IV showing HAGB >15° misorientations (black) and LAGB >2–15° (gray). Accelerated cooling. Figure 16.21 Grain boundary maps of (a) schedule V, (b) schedule VII, (c) schedule (VI), and (d) schedule (VIII) showing HAGB >15° misorientations (black) and LAGB >2–15° (gray). Air cooling. Figure 16.22 Dependence of the average grain diameter on the TMCP parameters: start finish rolling temperature; accelerated cooling (ACC), air cooling (air), and increasing or decreasing reduction per pass. An interesting alternative for producing excellent combinations of strength and toughness was proposed recently in Refs [43, 44] and involves quenching and partitioning [45]. The quenching and partitioning heat treatment is applied after the final rolling pass and consists of interrupted quenching to a temperature below Ms but above Mf of the particular steel grade. This step is followed by subsequent reheating to temperatures slightly above Ms to stabilize the untransformed austenite by carbon diffusion. The resulting microstructure is a low carbon martensite with excellent strength in which fine retained austenite islands are spread homogeneously. These islands are expected to make significant contributions to the toughness by the so-called transformation-induced plasticity (TRIP) effect. In summary, the final microstructure in pipeline plates is characterized by a complex mixture of microstructural constituents produced under highly nonequilibrium conditions. The required grain refinement responsible for the high strength and toughness can be effectively produced in two stages of processing: (1) rough rolling for initial refinement of the austenite grains and (2) finish rolling for the creation of a high density of nucleation sites for the formation of the necessary BCC transformation products. Accelerated cooling controls the type of the transformation product formed, which depends in turn on the alloy composition. These products include mixtures of various morphologies, such as ferrite, pearlite, and a wide range of bainitic and martensitic structures. Crystallographic texture is one of the important microstructural parameters that control the mechanical behavior of pipeline steels. The two principal properties affected by the texture are (1) the overall fracture toughness and especially the tendency to form delaminations or splits and (2) the in-plane anisotropy of the fracture toughness. The texture of pipeline steel grades can be controlled successfully via TMCP, and the factors affecting the formation of desirable and undesirable texture components during processing are reviewed herein. Crystallographic texture is a statistical characteristic of a polycrystalline material, pertaining to the presence of preferred crystallographic orientations. The orientations of the individual crystals in a polycrystalline aggregate are represented commonly by specifying the crystallographic planes and directions with respect to the sample coordinate system. In the case of rolling, the sample coordinate system is associated with the rolling direction, the transverse direction, and normal direction (Figure 16.23). To uniquely characterize the orientation of an individual crystal, one needs to indicate the crystallographic plane, with Miller indices (hkl), that is parallel to the rolling plane and the crystallographic direction, with indices [uvw], that is parallel to the rolling direction. For example, the orientation of the crystal depicted in Figure 16.23 is (110) [001]. Figure 16.23 Schematic representation of a crystal of orientation (110) [001]. Alternatively, the orientation of a specific crystal can be specified in terms of Euler angles. The Euler angles represent three consecutive rotations, which bring the sample coordinate system into coincidence with the crystal coordinate system. There are several ways of defining such rotations, but the one most frequently used is that proposed by Bunge [46]. Euler angles can be represented in a 3D space, which is commonly referred to as Euler space. A set of three Euler angles (φ1, Φ, φ2) identifies the exact position of each orientation in Euler space. As Euler angles are of a cyclic nature, the boundaries of Euler space are determined by φ1 = 0–360°, Φ = 0–180°, and φ2 = 0–360°, but these boundaries are reduced to the limits φ1 = 0–90°, Φ = 0–90°, and φ2 = 0–90° for cubic crystal lattices and the orthorhombic symmetry of rolled samples. The distribution of individual crystallographic orientations in a polycrystalline material can be plotted in a pole figure or in an inverse pole figure. The pole figure represents the distribution of a specific crystal pole 〈uvw〉 with respect to the sample coordinate system (Figure 16.24a), whereas the inverse pole figure displays the distribution of a sample axis (e.g., the ND direction) with respect to the crystal coordinate system (Figure 16.24b). Figure 16.24a shows the (100) pole figure of a particular BCC grain with Miller indices ~(111) [11–2], which corresponds to Euler angles (φ1 = 34–35°, Φ = 51.5–52.7°, and φ2 = 44.6–45.3°); Figure 16.24b displays the orientation of the same grain in the ND-inverse pole figure, whereas Figure 16.23 shows the position of this orientation in the φ2 = 45° section of Euler space. The above methods of representation are semiqualitative and do not give a complete quantitative description of the texture. The orientation distribution function (ODF) f(g) is an orientation density function such that f(g) dg represents the volume fraction of crystallites with an orientation within an infinitesimal environment g ± dg around orientation g. Figure 16.25a shows a discrete plot of orientations in the φ2 = 45° section of Euler space, and Figure 16.25b displays the ODF calculated from the discrete orientations. Figure 16.24 Representation of the orientation of a particular BCC grain with (a) a pole figure, (b) an ND-inverse pole figure, and (c) in a φ2 = 45° of the Euler space as a discrete plot. The orientations are slightly scattered because there is an orientation gradient in the grain. Figure 16.25 (a) Discrete plot of orientations of a pipeline steel in the φ2 = 45° section of Euler space, and (b) ODF calculated from the discrete plot. The lines show the texture intensities in multiples of random distribution (MRD). The isointensity lines of Figure 16.25b exhibit the intensity of each texture component with respect to the random texture. For BCC metals, the most important texture components of rolled sheet (either in the deformed or annealed condition) can be found in the φ2 = 45° section of Euler space, whereas for FCC metals the dominant texture components of rolled sheet appear in the sections φ2 = 45°, φ2 = 65°, and φ2 = 90°(or 0°). Figure 16.26, which displays the ideal position of the most common BCC crystallographic orientations in the φ2 = 45° section, can be employed as a key to read the experimental ODFs discussed later in the text. The initiation of pipeline fractures can usually be attributed to corrosion, construction damage, or earth settlement and earthquakes and is therefore largely beyond the control of the process metallurgist. The extent of propagation of such failures, on the other hand, is clearly under the influence of the metallurgist, as it depends on the toughness and microstructure of the steel. This is particularly an issue in high-pressure gas pipelines, which operate at pressures in excess of 100 atm and in which, unlike in the case of oil pipelines, a rupture does not lead to the immediate release of the pressure. The texture and microstructure, in turn, are sensitively affected by the cycles of recrystallization and transformation that take place during steel processing. In what follows, the stages of controlled rolling during which recrystallization is to be promoted, or in turn avoided, will be examined closely, with particular focus on its effects on the texture and consequently on the toughness. Control of the microstructure [47] has already been discussed. Figure 16.26 Ideal positions of the most important BCC texture components in the φ2 = 45° section of Euler space. The positions of the main texture components of the austenite, cube, copper, brass, and Goss are represented as shaded semicircles. The arrows identify the parent FCC orientations from which specific BCC orientations originate. The toughness is critical because it determines the speed of propagation of a crack, once initiated. When a steel is sufficiently tough, the rate of propagation is low and, in particular, well below the speed at which the pressure drop due to the escaping gas travels down the pipe. As a result, the driving force for propagation decreases below that necessary for crack growth and, ideally, the fracture does not extend beyond a single length of pipe. Conversely, in a low toughness steel, cracks can propagate much more quickly than the drop in gas pressure and the fracture can extend for many kilometers before the pressure decreases sufficiently to arrest the crack [48, 49]. Microalloyed steels that exhibit low fracture toughness are also subject to the phenomenon of “splitting” or separation. Although splits are commonly observed in low-toughness test specimens [50], these separations do not in fact play a direct role in fracture. They are rather an indication of the presence of the {100} 〈011〉 texture component, which is in turn responsible, at least in part, for the poor fracture properties [47, 51]. Before considering how to reduce the intensity of this undesirable component, it will be useful to first consider why its presence should be avoided. A schematic representation of a {100} <011> crystal in a steel plate is provided in the central sketch of Figure 16.27. Here the grain is of cubic shape and its faces consist of {100} surfaces, which have low strengths in cleavage. These faces are inclined at 45° to the hoop stress of the pipe in the case of longitudinally welded products (LHS) and are approximately perpendicular to the hoop stress in the case of spiral welded pipe (RHS). Thus, the presence of grains in this orientation will promote brittle behavior during crack initiation and propagation and lower the fracture toughness in this way. Figure 16.27 Schematic diagrams of a {100}〈011〉-oriented grain in a rolled plate (center), a longitudinally welded pipe (LHS), and a spiral welded pipe (RHS). RD: rolling direction; LD: longitudinal direction; CD: circumferential (hoop) direction. Because of the cubic symmetry, the “top” and “bottom” faces of both the “longitudinal” and “spiral” {100} grains are parallel to the outer surfaces of the pipe and are therefore responsible for splitting when it occurs. However, during operation, stresses perpendicular to the surface cannot be generated and so there is no driving force for cleavage on these planes. It is instead the occurrence of necking and plate thinning during crack propagation that is responsible for the generation of the through-thickness triaxial stresses, which in turn produce the splits [52]. Thus, the separations are the result of fracture propagation and do not in fact play a direct role in advancing the crack. Another characteristic associated with the {100}〈011〉 component is its contribution to the local yield strength of the steel, which is illustrated in Figure 16.28. Here it can be seen that the cube and rotated cube components have the lowest yield strengths of all crystal orientations. At 2.2–2.4, their Taylor factors are almost half that of the Goss component in Figure 16.28a and only about 60% that of the {111} fiber in Figure 16.28b. (The yield strength of a given grain is obtained by multiplying the critical resolved shear stress for dislocation motion by the Taylor factor.) Thus, the presence of this component has a local weakening effect on the plastic properties of the plate and therefore on the fracture toughness. Two other undesirable features associated with the cube fiber (not illustrated here) are (1) that it has the lowest rate of work hardening (proportional to the Taylor factor) of all the texture components, an additional source of weakening, and (2) that it also has the lowest mean R-value of all texture components, which means that it provides the least resistance to thinning of the plate during tensile deformation and therefore during crack propagation. Figure 16.28 Taylor factor map for plane strain tension along the circumferential direction calculated using the “full constraint” theory of crystal plasticity and plotted in two 2D cross sections of Euler space. (a) Longitudinally welded pipe. (b) ±45° spiral welded pipe. Steel processing generally involves the operation of five texture change mechanisms [53]. These are the ones that are brought about by (1) austenite deformation, (2) austenite recrystallization, (3) the γ–α phase transformation, (4) ferrite deformation, and (5) ferrite recrystallization. In what follows, the conversion of the deformation and recrystallization austenite texture components into their ferrite or bainite counterparts is taken to occur largely following the Kurdjumov-Sachs (KS) and Nishiyama-Wassermann (NW) correspondence relations [54, 55]. In the first instance, this involves rotations of +/−90° about the 12 〈112〉 axes, leading to 24 possible variants. In the latter case, the rotations do not have simple descriptions, but lead to 12 variants, each of which is an average of two KS variants. The austenite texture components introduced by rolling will be described in the following, together with their transformation products. In a similar manner, the principal recrystallization component, the cube texture, will also be described, together with its main transformation products. When austenite is rolled above the nonrecrystallization temperature Tnr, the γ deformation textures introduced are converted, by recrystallization, into the cube or {100} 〈001〉. The presence of this component is illustrated in a φ2 = 45° Euler space cross section in Figure 16.29a [56], whereas the transformation texture products predicted to appear (by KS and NW) after cooling and phase transformation are identified in Figure 16.29b [56]. An example of the transformation products appearing in a 0.11% C TRIP steel after cooling is presented in Figure 16.29c, where it can be seen that the FCC cube component has been transformed into the rotated cube {100}〈011〉, the Goss {110}〈001〉, and the rotated Goss {110}〈110〉, with the rotated cube predominating at an intensity of 8+ [57]. (The TRIP steel has been chosen here to demonstrate the transformation behavior of microalloyed steels because the microstructure contains retained austenite, the presence of which enables determination of the recrystallization texture in the FCC phase. In contrast, in conventional microalloyed steels, there is no austenite present at room temperature from which to determine the FCC texture.) Figure 16.29 Transformation of the FCC texture into its BCC counterparts. (a) Hot rolled and recrystallized Fe–28% Ni alloy (X-ray diffraction), (b) the rotated cube, Goss, and rotated Goss components are formed from the FCC cube φ2 = 45° section, and (c) transformation texture in a laboratory hot rolled (FRT: 950 °C) and intercritically annealed TRIP steel (0.11% C–1.53% Mn–1.26% Si). An illustration of the grain orientations produced by transformation is provided in Figure 16.30, which shows an austenite grain of cube orientation as well as that of its twin in Figure 16.30a and those of the bainite and ferrite transformation products in Figure 16.30b [58]. Thus, it is clear that when the cube component predominates in hot rolling, something that is brought about by austenite recrystallization, the final texture after cooling and transformation will contain high-volume fractions of the undesirable {100} 〈011〉 component. For this reason, the occurrence of austenite recrystallization during the final stages of steel processing is very much to be avoided. This is accomplished by ensuring that the final stages of rolling are carried out well below the Tnr and that, in particular, the interiors of heavy plates are below this temperature. When austenite is rolled below the Tnr, the deformation texture components are not removed by recrystallization, but are retained during cooling down to the transformation temperature. These components are the copper {112}〈111〉, brass {110}〈112〉, S {123}〈643〉, and Goss {110}〈001〉, which, together with their intermediate neighbors, form the rolling tube or p fiber. The locations of the austenite rolling fiber components in 3D Euler space are illustrated in Figure 16.31a and in the φ2 = 45° 2D cross section of Euler space in Figure 16.31b [53, 58]. (The S component does not appear in this cross section.) The effect of phase transformation on these components is depicted in Figure 16.32 [53, 58]. The important points to note are the following: (1) The copper component transforms primarily into the (112}〈110〉, also known as the “transformed Cu,” with a much smaller fraction appearing in the vicinity of the rotated Goss. The remaining KS components do not appear in the φ2 = 45° cross section and are not relevant here. (2) The S component transforms in part into orientations near the (112}〈131〉; the rest are dispersed elsewhere in the 3D Euler space and are not implicated in the present discussion. (3) The Goss component (a minority component during rolling) transforms partly into the rotated Cu, contributing to the intensity of this component, and partly into the {111}〈110〉, with the balance located outside the φ2 = 45° cross section. (4) Finally, the brass or Br component transforms primarily into the “transformed Br” located in the vicinity of {111} 〈112〉 and {554}〈225〉, with minor amounts rotating to {112}〈131〉 and {100}〈011〉. Figure 16.30 (a) A recrystallized cube-oriented austenite grain (upper and lower extremities of the outlined grain) containing a twin in the central part, and (b) the bainite decomposition products of rotated cube, rotated Goss, and Goss orientation. EBSD inverse pole figures: as-hot rolled TRIP steel; composition: 0.22% C–1.50% Mn–1.56% Si–0.045% Nb. Figure 16.31 (a) The austenite rolling fiber represented in 3D Euler space showing the orientations of the Cu, S, Br, and Goss components, and (b) the locations of the Cu, Br, and Goss components on a φ2 = 45° cross section of Euler space. Figure 16.32 Transformation of the FCC rolling fiber into its BCC counterparts. (a) Locations of the Cu, Br, and Goss components; the RD fiber, containing the {100}〈011〉, is produced by rolling a BCC material (φ2 = 45° section), and (b) the BCC transformation products of the Cu and Br FCC orientations (φ2 = 45° section). The appearance of a deformed austenite grain of Br orientation in a TRIP steel is depicted in Figure 16.33, together with the ferrite/bainite orientations appearing after transformation [58]. Because of the retained austenite present in TRIP steels after transformation, it is possible to measure both the austenite and ferrite textures in the same sample. The FCC and BCC textures determined in this way are shown in Figure 16.34, where the presence of the Cu, Br, and Goss components in the austenite is clearly evident and the typical “transformation texture” that results from controlled rolling is also shown. In this example, the intensity of the rotated cube component (at 3+) is well below that of any of the components of the transformation fiber and the volume fraction of this component is appropriately low. With regard to the deleterious rotated cube orientation, the first point to note is that, whether rolling is completed above or below the Tnr, in both cases the rotated cube component will be present to some degree after transformation. However, it is of particular importance here that, when recrystallized material is transformed, the rotated cube is the most intense, that is, the highest volume fraction component. Conversely, when a “pancaked” plate is transformed, the {100}〈011〉 orientation is only a minor component, as it is a low-intensity by-product of just one of the four principal preferred orientations of the rolling fiber. Thus, transformation of a pancaked plate will generally lead to volume fractions of the rotated cube that are approximately an order of magnitude lower than that resulting from the transformation of a recrystallized plate. Figure 16.33 A pancaked austenite grain of Br orientation (a) (upper micrograph) with its orientation identified in the {001} pole figure (b); the bainite transformation products (c) consisting of components centered around {554}〈225〉, {112}〈131〉, and {100}〈011〉 represented in {001} pole figure (d). Key for orientations in the inverse pole figures (e). Figure 16.34 FCC and BCC textures determined by EBSD on the as-hot rolled, pancaked TRIP steel of Figure 16.26. (a) Retained austenite texture illustrating the presence of the Cu, Br, and Goss rolling components (φ2 = 45° section), and (b) bainite texture running from the transformed Cu (LH axis) transversely along the “transformation fiber” to the “transformed Br” (φ2 = 45° section). The much lower intensity of the rotated cube (upper left and upper right corners) can be seen. It remains to consider the effect of deformation and recrystallization of the ferrite phase on the final texture. This is because it is sometimes desirable to finish rolling in the intercritical region to increase the flow stress of the ferrite phase present under these conditions and also to increase the yield strength of the final product. It must be pointed out that the {100} 〈011〉 component is part of the ferrite rolling fiber, and so a certain amount will be introduced by rolling in that temperature domain (Figure 16.32a). Furthermore, when such rolled ferrite is able to recrystallize, the principal orientation produced is the rotated cube [59]. The presence of the rotated cube component in combination with a bimodal grain size distribution, as discussed earlier and reported in Refs [35, 47], is particularly undesirable as it leads to poor crack arrestability. For these reasons, when the fracture propagation properties are of importance, it is preferable to avoid finish rolling in the intercritical temperature range. In summary, the presence of the rotated cube component, {100}〈011〉, in pipeline steels is associated with low toughness values, which are in turn responsible for rapid crack propagation. This is why it is essential to minimize the volume fraction of this component in the plate. It should be added that the presence of the {100}〈011〉 texture component appears to be particularly injurious to the fracture properties when elevated volume fractions of this orientation are present in the outer layers of the plate [59]. The complete recrystallization of austenite during hot rolling leads to the formation of the cube texture. On transformation to ferrite and bainite, the cube is converted into the rotated cube, the Goss, and the rotated Goss, with the rotated cube predominating. For this reason, it is important to avoid austenite recrystallization during the finishing stages of the rolling of pipeline steels and to do all the final reductions below the Tnr. The pancaking of austenite during rolling below the Tnr leads to the presence of the Cu, S, Br, and Goss components. On transformation, these lead to the appearance of the well-known transformation (mostly {111}) fiber. Although this texture includes minor quantities of the {100}〈011〉, it is the preferred texture with respect to ensuring high toughness values in the steel. Rolling in the intercritical temperature range is to be avoided, as it leads to the introduction of additional quantities of the undesirable rotated cube component. The above principles are of particular importance during the rolling of plate for heavy-gauge pipelines. Due to the large thickness, appreciable temperature gradients can develop between the surface and the interior of the plate. As a result of the temperature difference, the external layers of the plate or bar may be below the Tnr during finishing, while the core is above the Tnr. An example of the textures formed in a plate rolled under these conditions is provided in Figure 16.35 [59]. The surface texture of such a plate is illustrated in Figure 16.35a, while the core texture is shown in Figure 16.35b. The layers close to the surface were finished below the Tnr, so that the resulting ferrite transformation texture originated from pancaked austenite. In contrast, the central layers of the bar were finished above the Tnr, so that the austenite was able to recrystallize prior to transformation. As a consequence, the main BCC texture component at this location was the {100}〈011〉, which forms from recrystallized austenite. These problems can be avoided by ensuring that sufficient cooling takes place before finishing. The Tnr temperature can also be raised, providing a wider pancaking temperature range, by employing higher concentrations of Nb (Figure 16.14). The anisotropy in Charpy impact energy of an X80 grade pipeline steel (Figure 16.36) was studied in detail in Ref. [38]. The Charpy tests were carried out at various temperatures, with the long axis of the sample enclosing different angles of inclination α (between 0° and 90°) with respect to the RD and the notch perpendicular to the plane of the sheet. It can be seen that at room temperature there is virtually no anisotropy, whereas at −60 and −100 °C a distinct reduction in toughness is observed at α = 45°, when the long axis of the Charpy sample is parallel to the diagonal axis of the sheet. The texture of this steel (Figure 16.37) is a typical hot band transformation texture originating from a pancaked austenite rolling texture, with characteristic components {112}〈110〉, {112}〈131〉, and {554}〈225〉, which are the transformation products of the austenite rolling components Cu ({112}〈111〉), S ({123}〈634〉), and Br ({110}〈112〉), respectively. Figure 16.35 φ 2 = 45° ODFs of heavy-gauge plate. (a) Close to the surface, and (b) close to the mid-thickness of the plate. The core texture contains high intensities of the {001} 〈011〉 BCC transformation component that originates from recrystallized austenite. ([59]/with permission of Taylor & Francis.) Figure 16.36 Planar anisotropy in Charpy V-notch energy. Figure 16.37 Texture (φ2 = 45° section) of an X80 grade pipeline steel exhibiting the toughness profile shown in Figure 16.36. ([38], 2010/with permission of Ghent University.) For any given texture, the volume fraction of grains for which the {001} crystal plane is parallel to the macroscopic fracture plane of the Charpy V-notch sample can be readily calculated. This volume fraction depends on the angle α along which the Charpy sample is loaded. As the {001} planes have the lowest strength in cleavage, variations in the {001} volume fraction can explain the observed toughness anisotropy. The dependence of the latter on crystallography is confirmed by the data shown in Figure 16.38, from which it can be seen that the rise in the ductile-to-brittle transition temperature (DBTT) at 45° (i.e., the vertical axis of the graph) increases with the difference in {001} volume fraction between the samples loaded along 45° and 90° (i.e., the horizontal axis of the graph). Figure 16.38 Percentage increase in DBTT as a function of the difference in {001} volume fraction parallel to the fracture plane between samples loaded at 45° and 90°. ([38], 2010/with permission of Ghent University. Descriptions are given of the microstructure and texture in the most commonly used pipeline steel grades. The composition ranges of these grades are summarized, together with a brief discussion of segregation effects. After a short historical review, the general principles of microstructure and texture formation during the TMCP of plate and sheet are discussed. These are illustrated with examples taken from the recent literature. Special attention is paid to texture formation, methods of texture control, and the influence of texture on the mechanical properties, anisotropy, and fracture behavior of these microalloyed steels. The authors thank Eng. Tuan Nguen Minh, Eng. Victor Carretero Olalla from Ghent University, Belgium, and Dr. Alexey Gervasyev from Rosniti, Russian Federation for interesting and fruitful discussions and help in the preparation of the figures. L.K. is grateful for financial support from the FWO-Odysseus Program under the project “Engineering of 3D microstructures in metals: bridging ten length scales of functionality.” J.J.J. acknowledges with gratitude funding received from the Natural Sciences and Engineering Research Council of Canada.
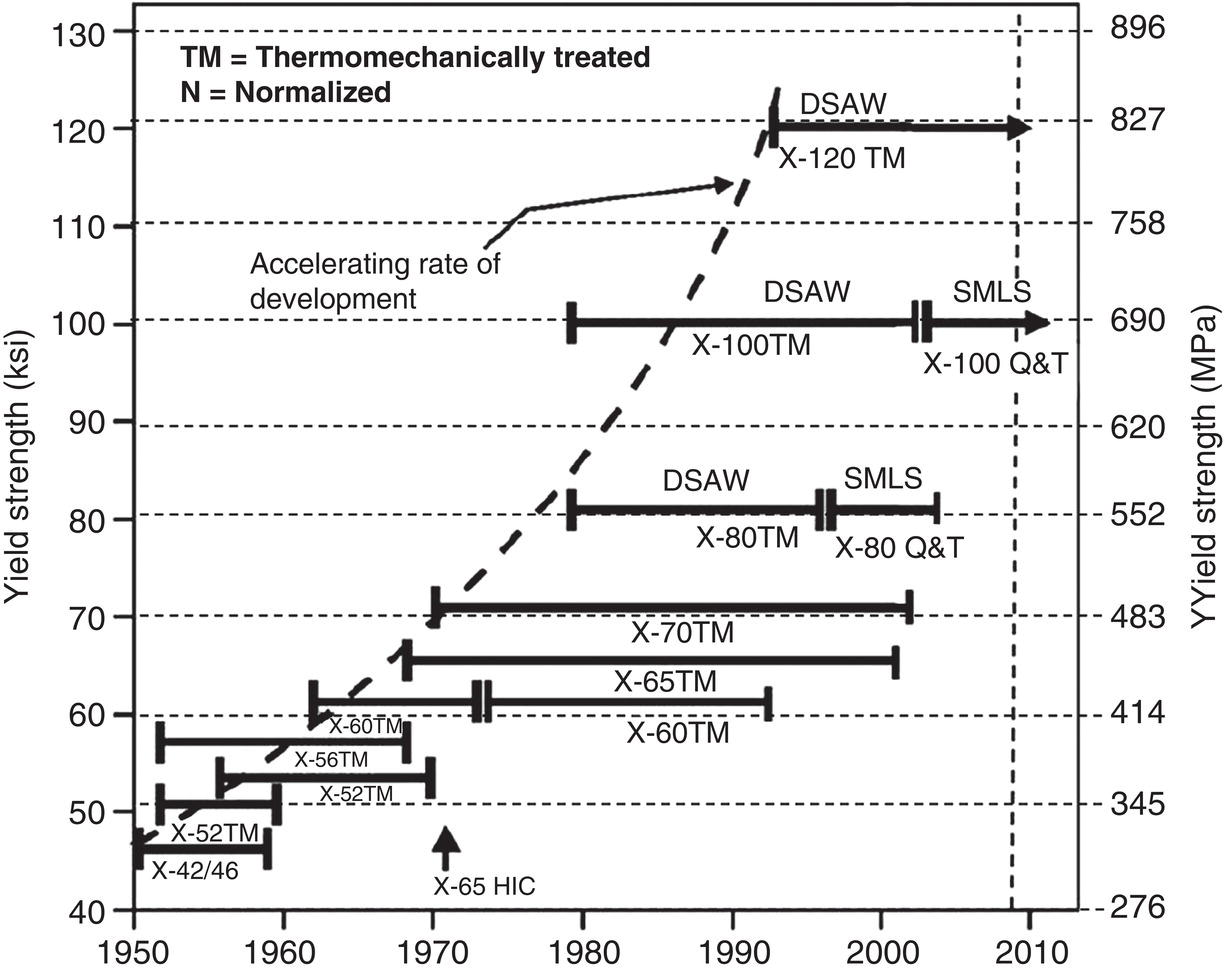
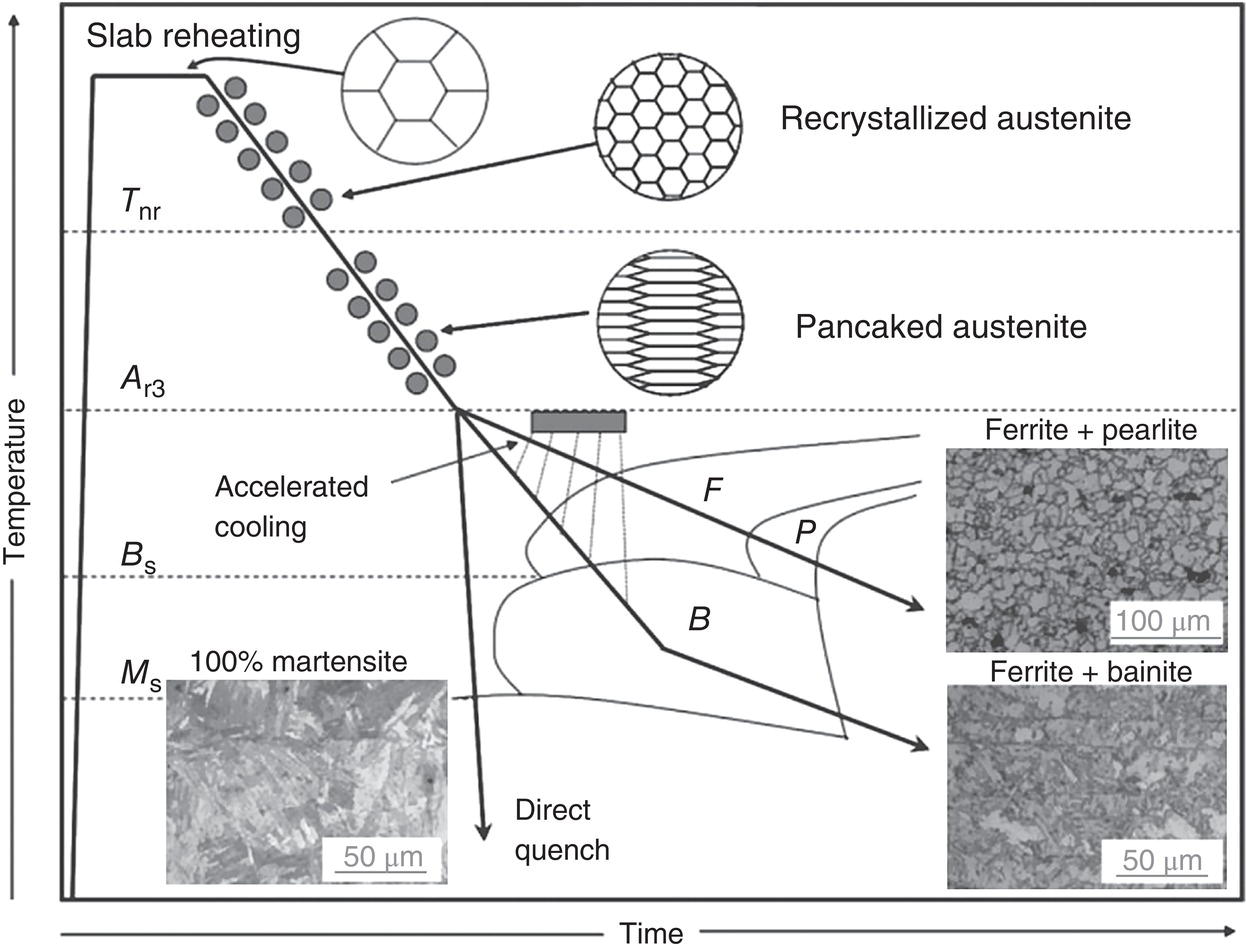
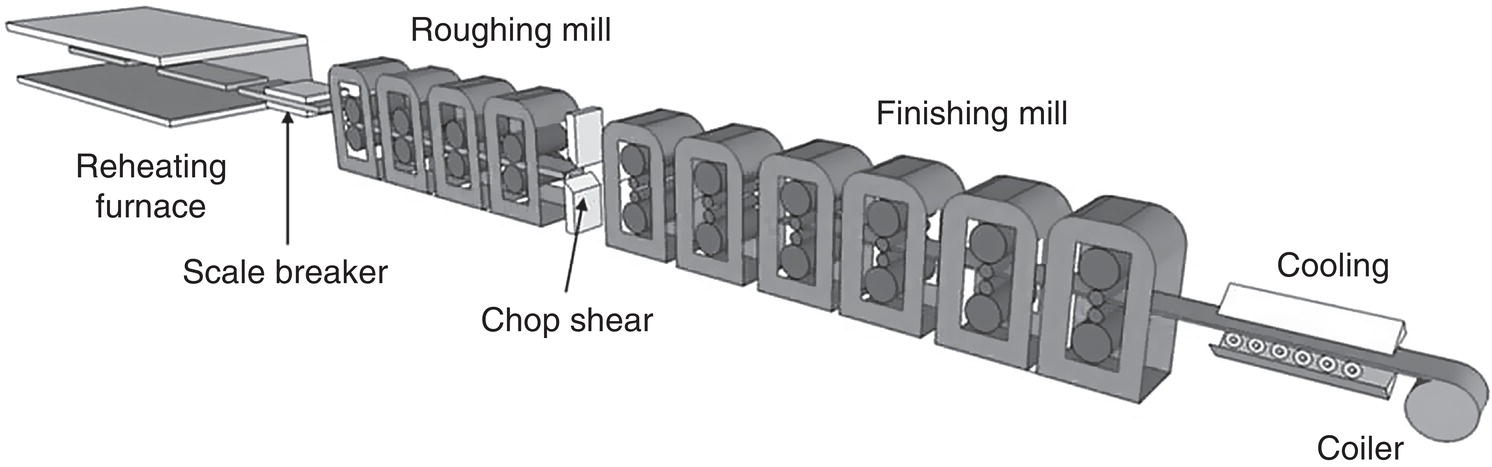
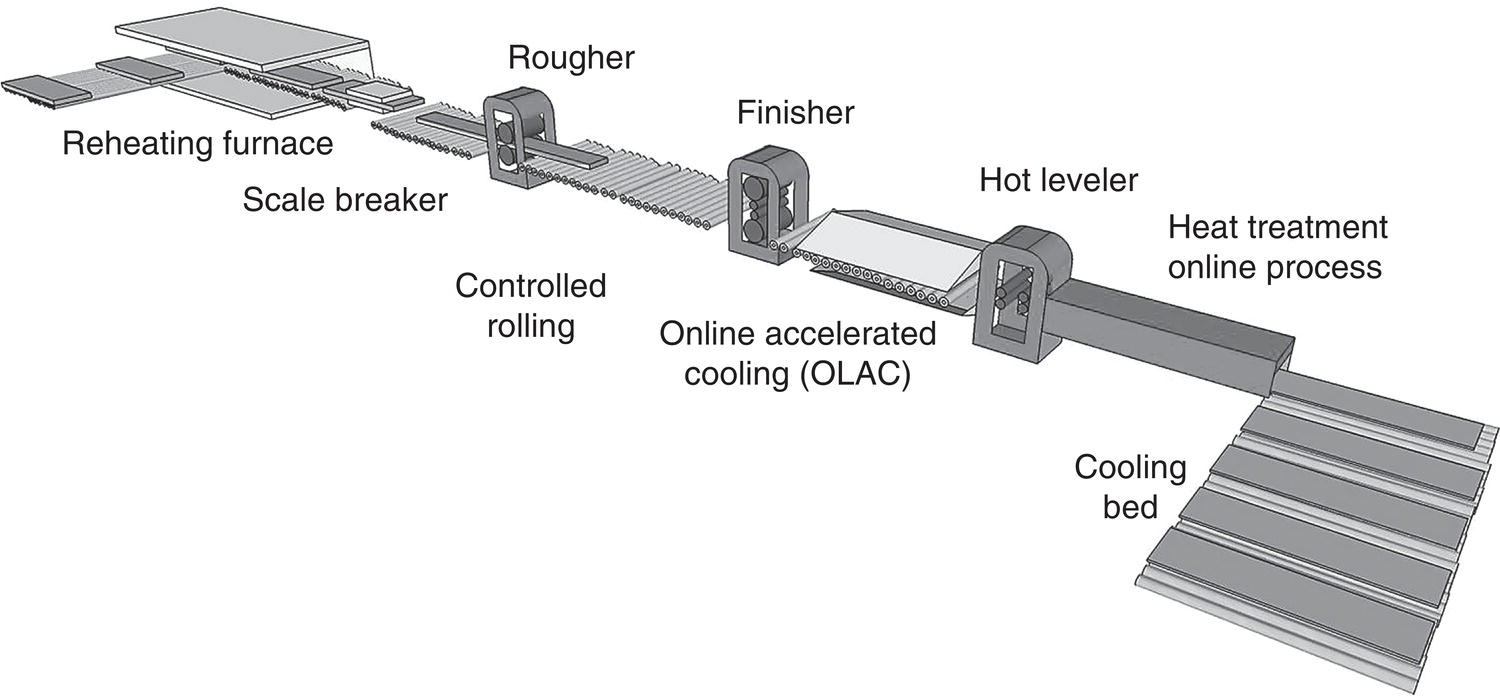
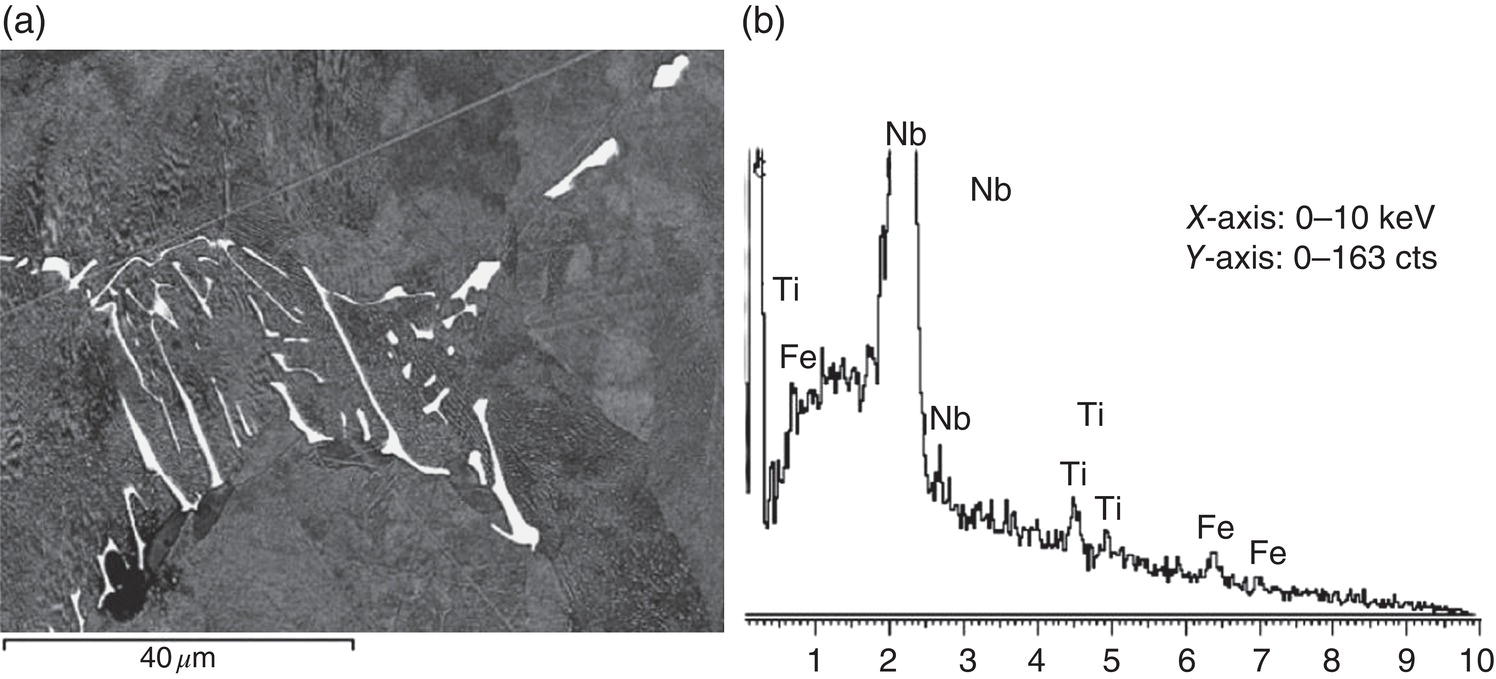
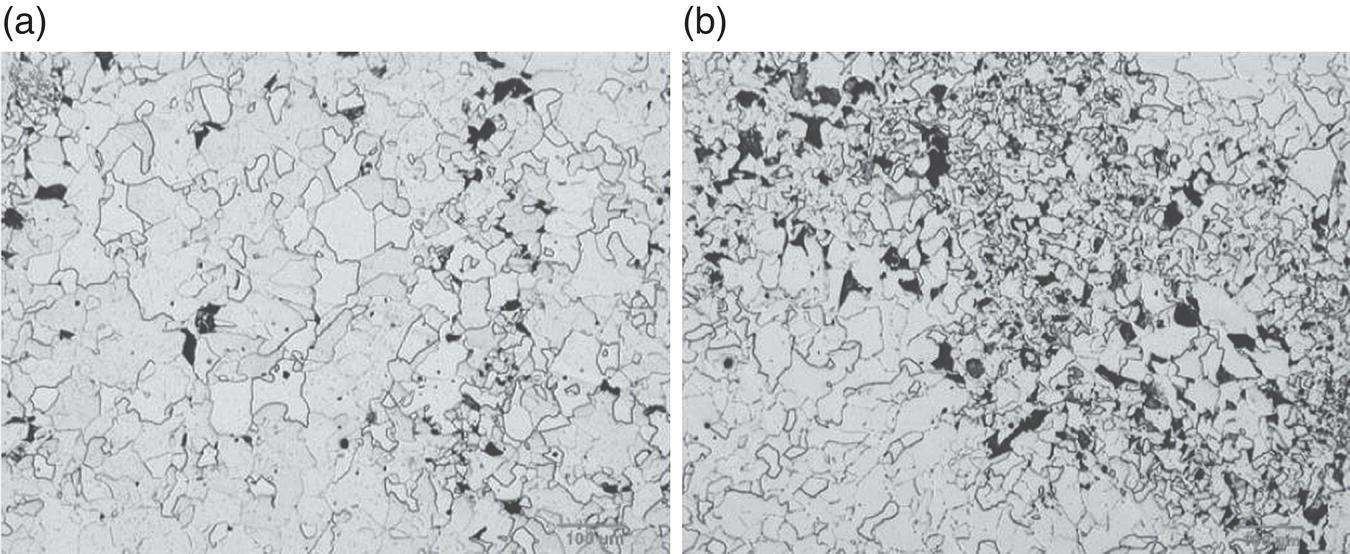
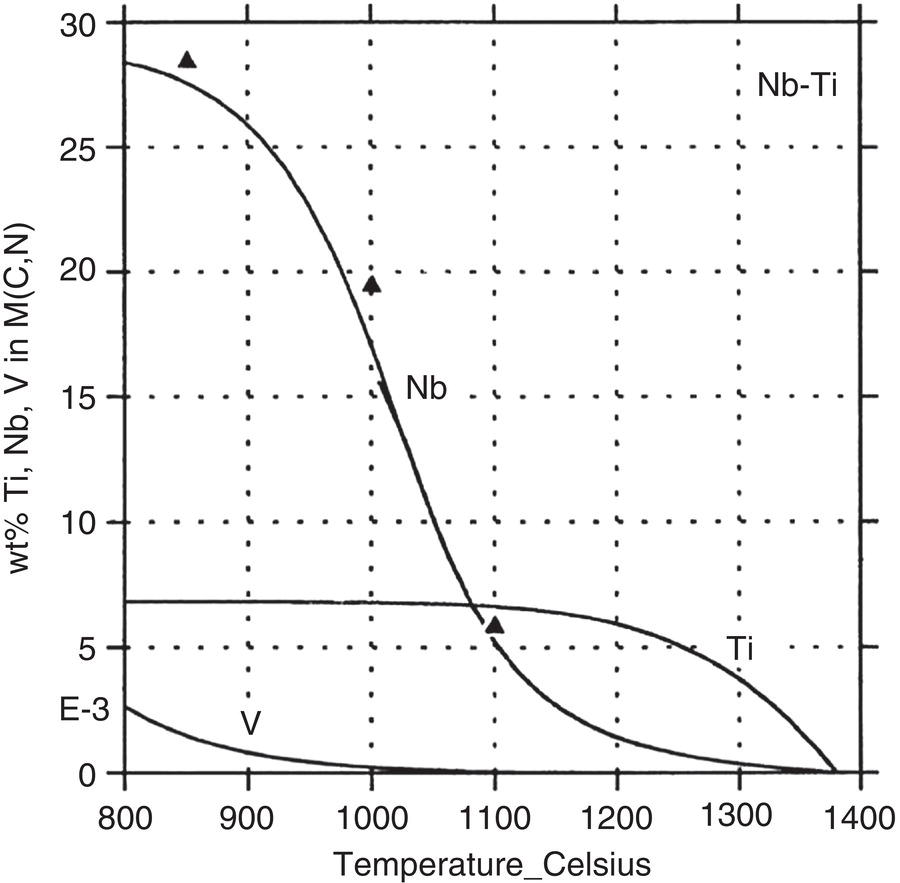
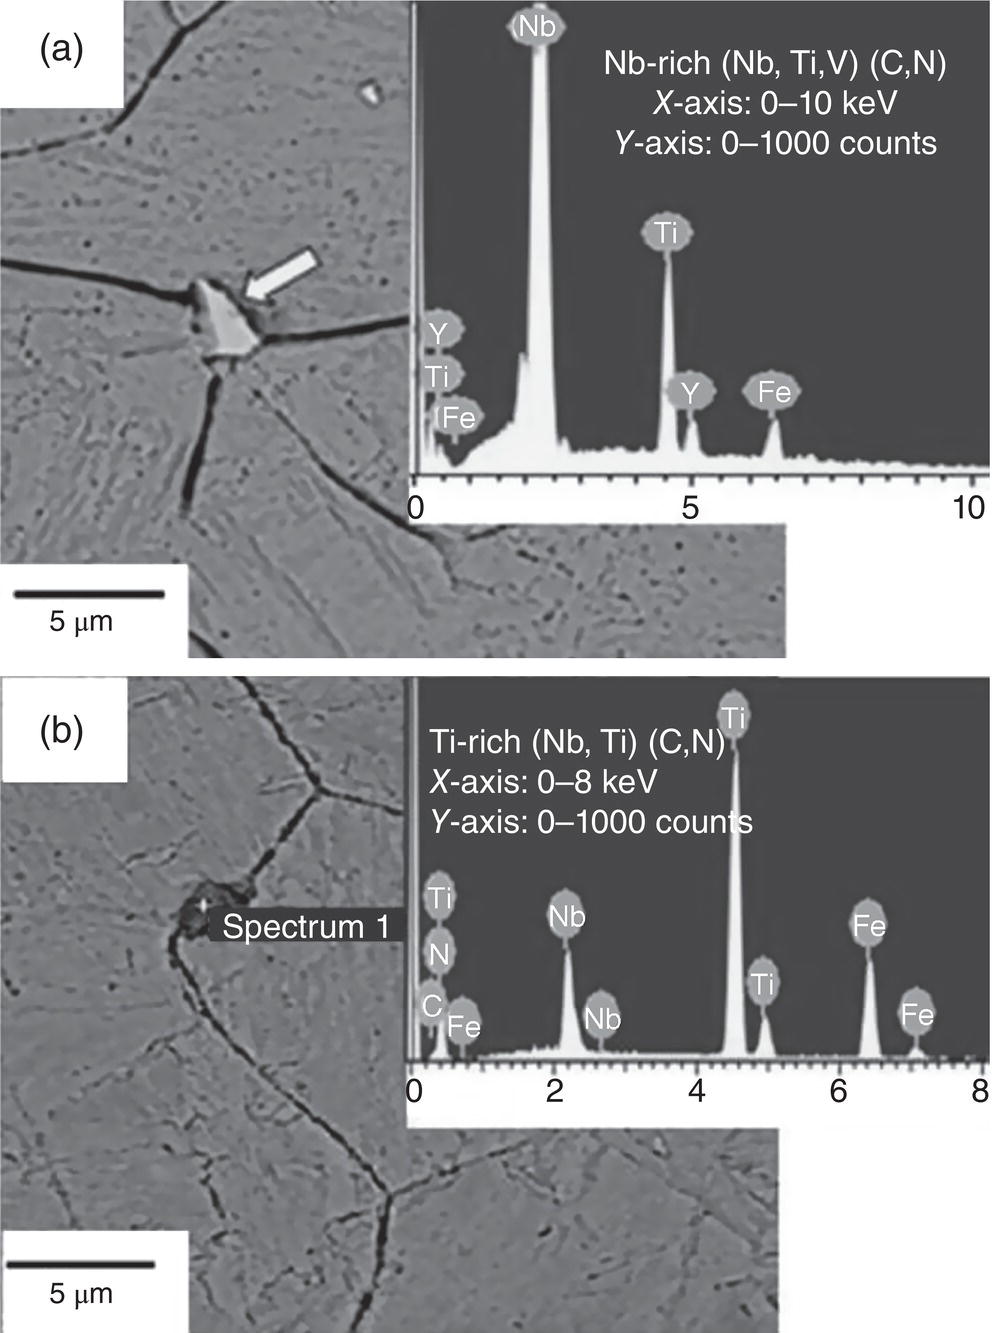
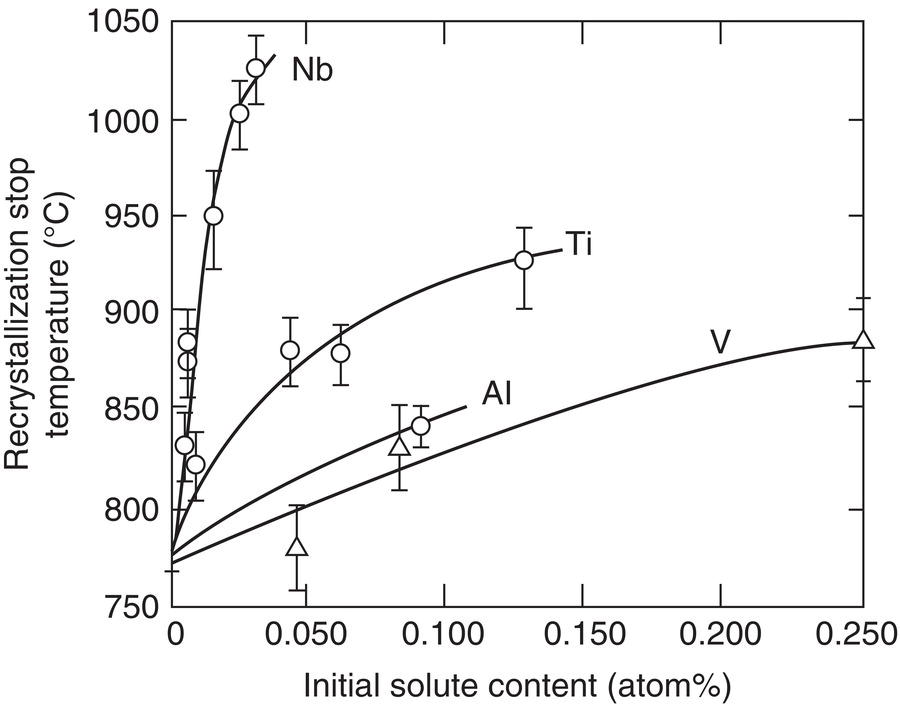
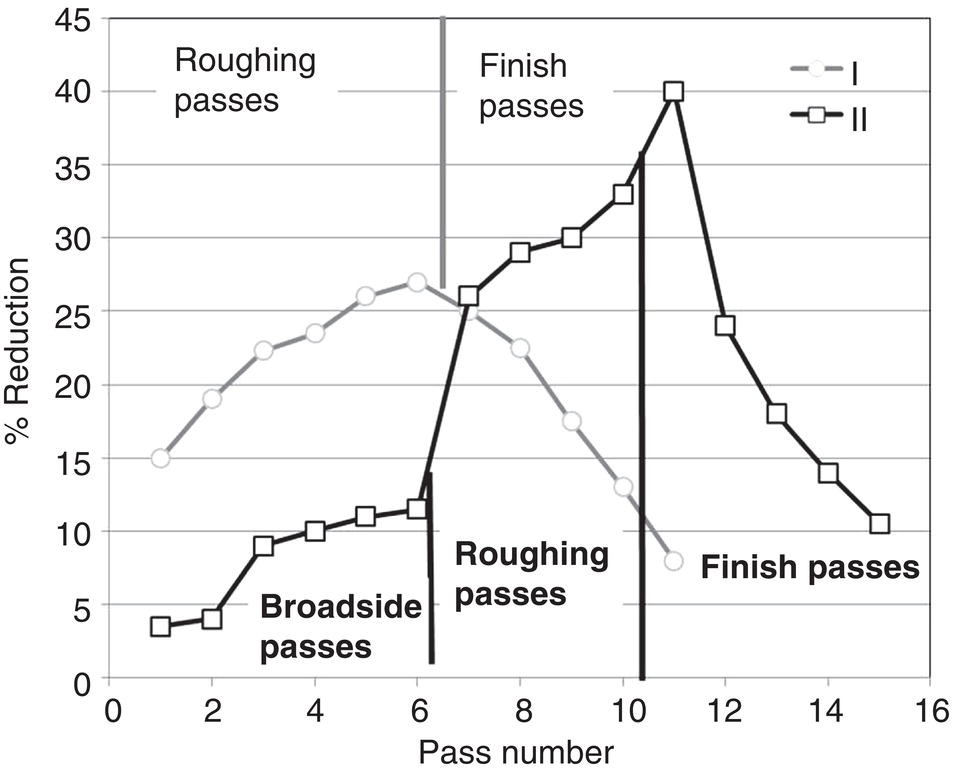
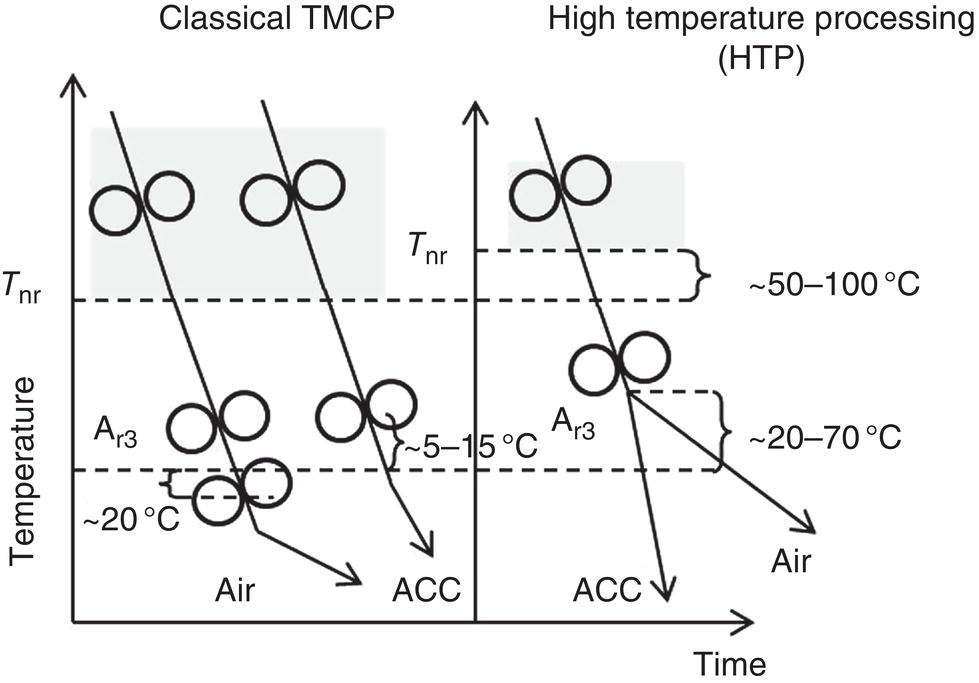
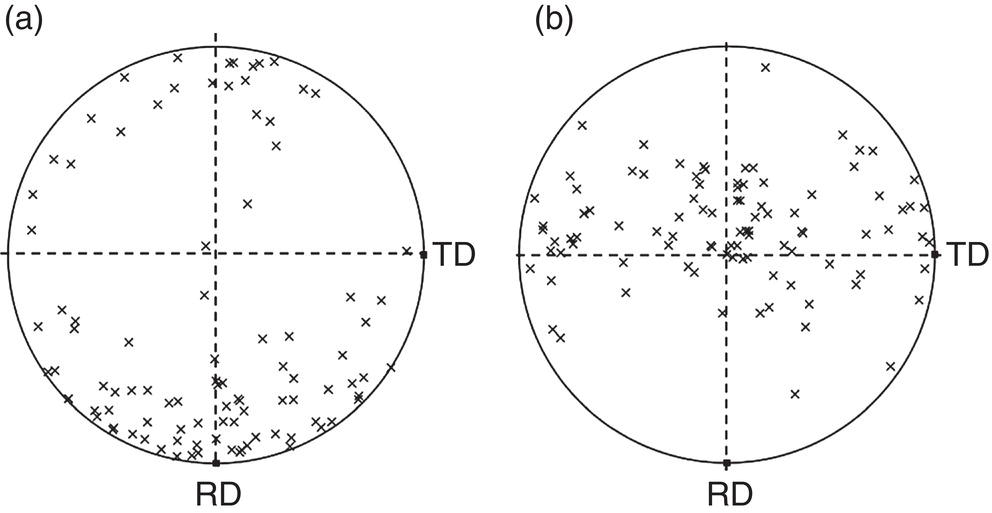
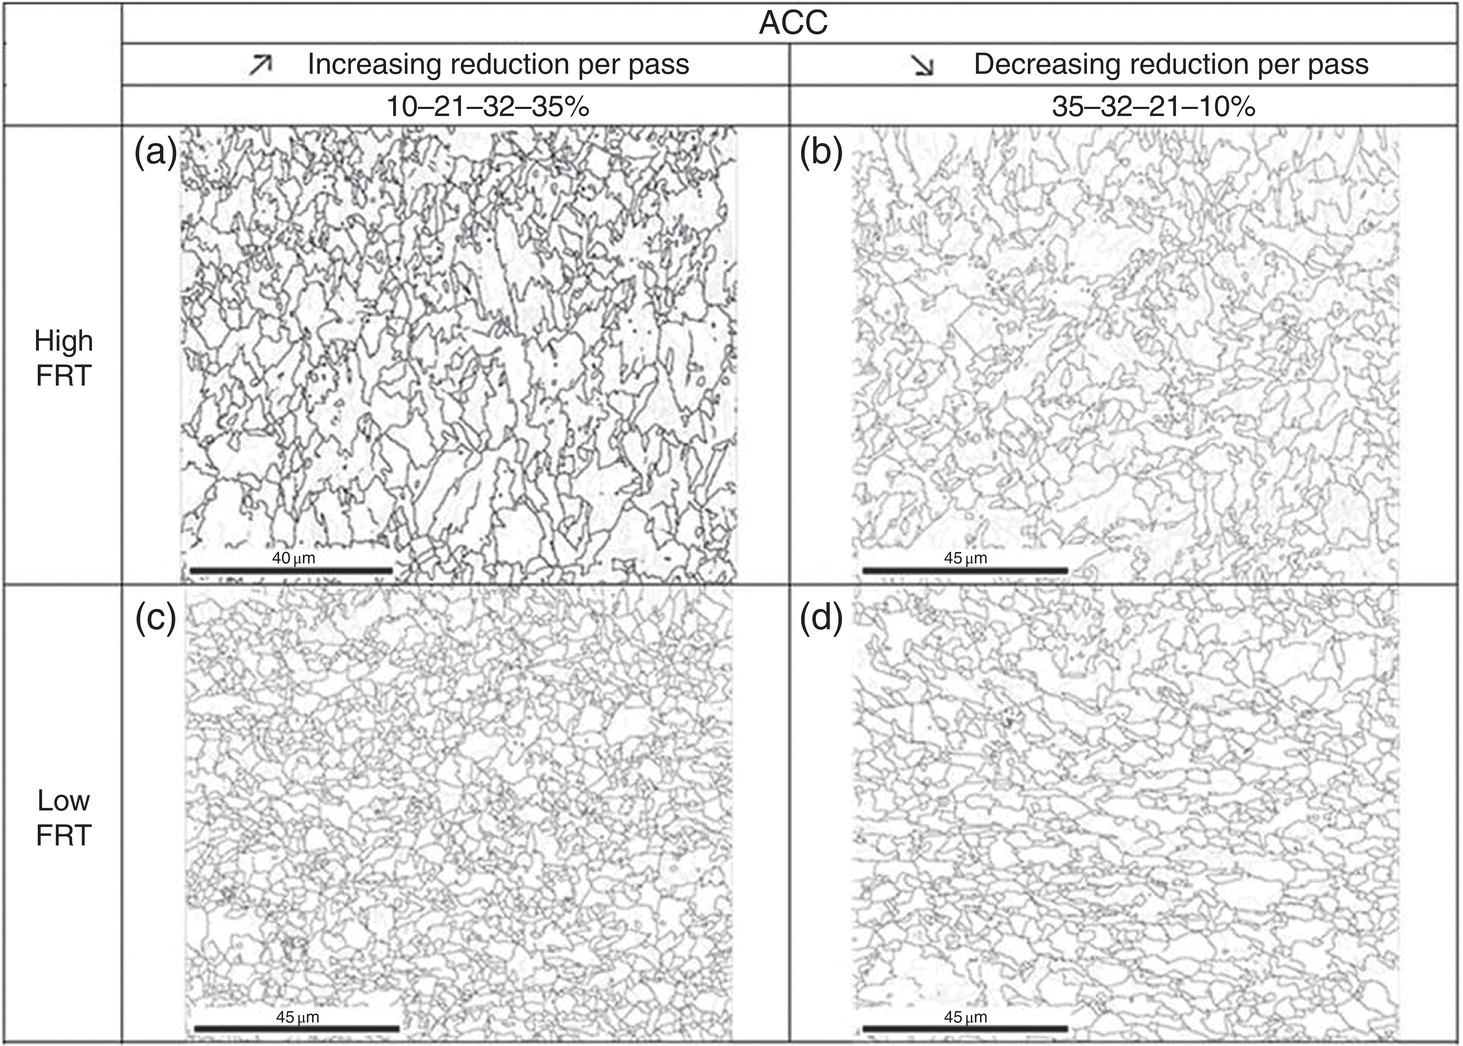
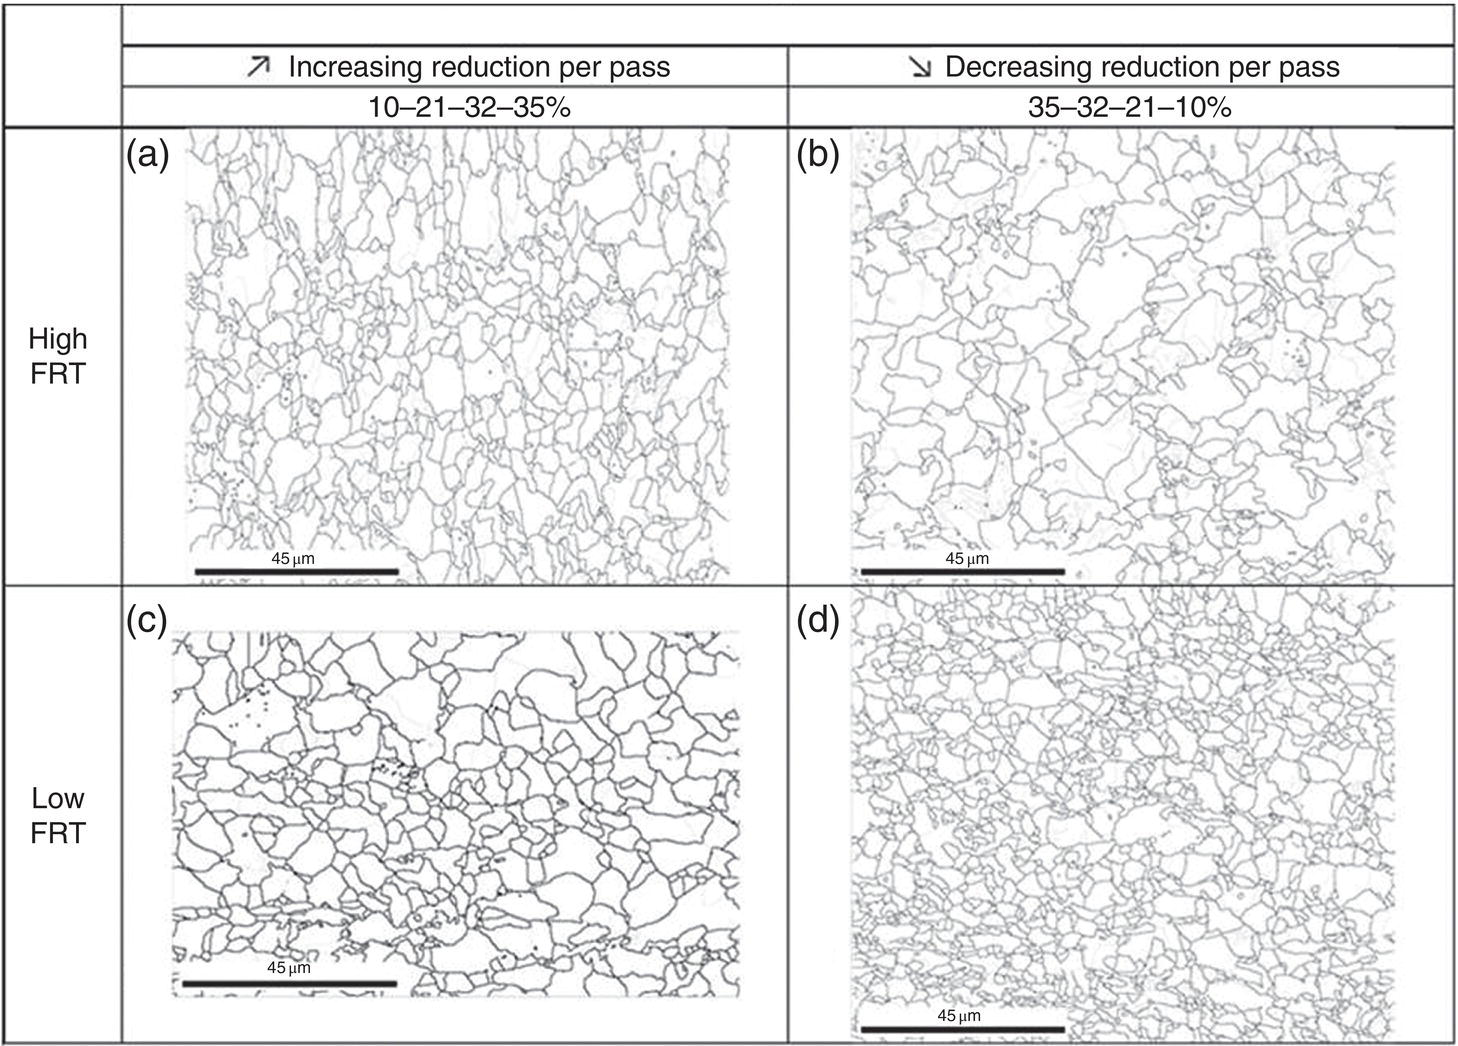
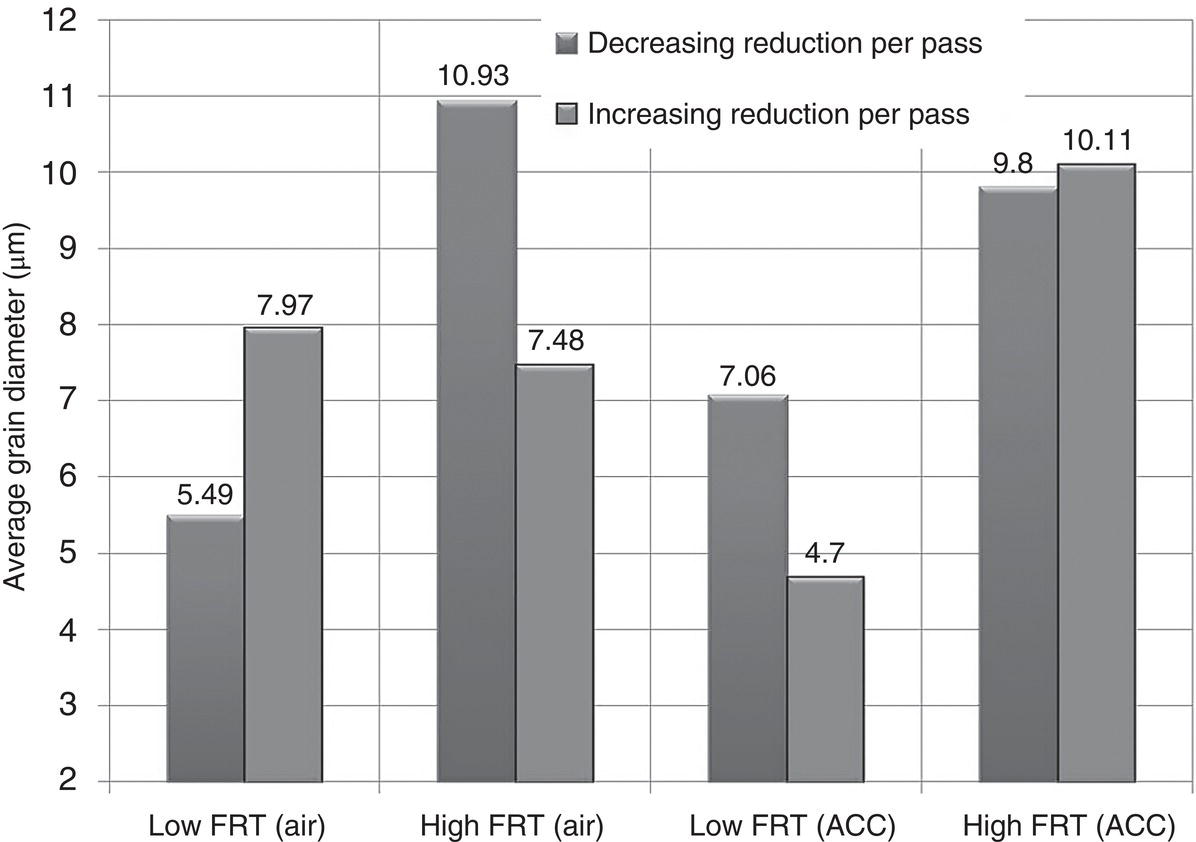
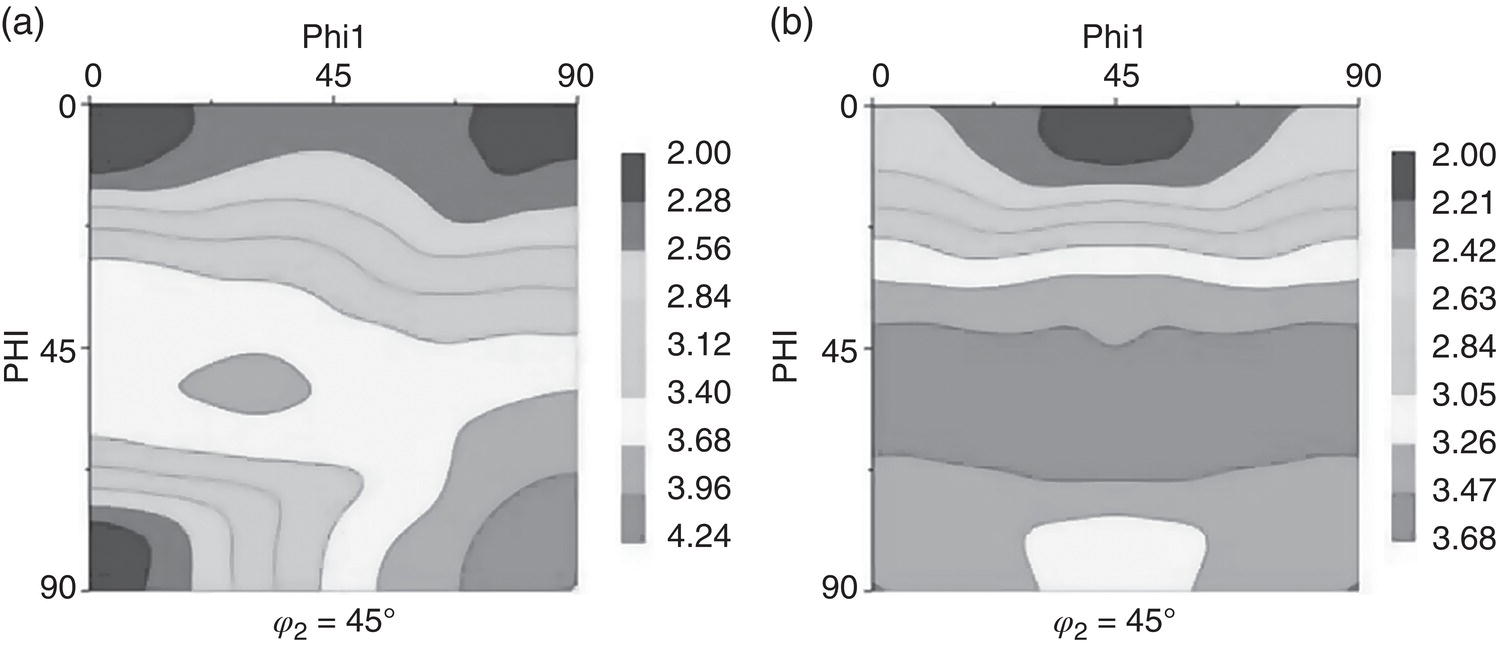
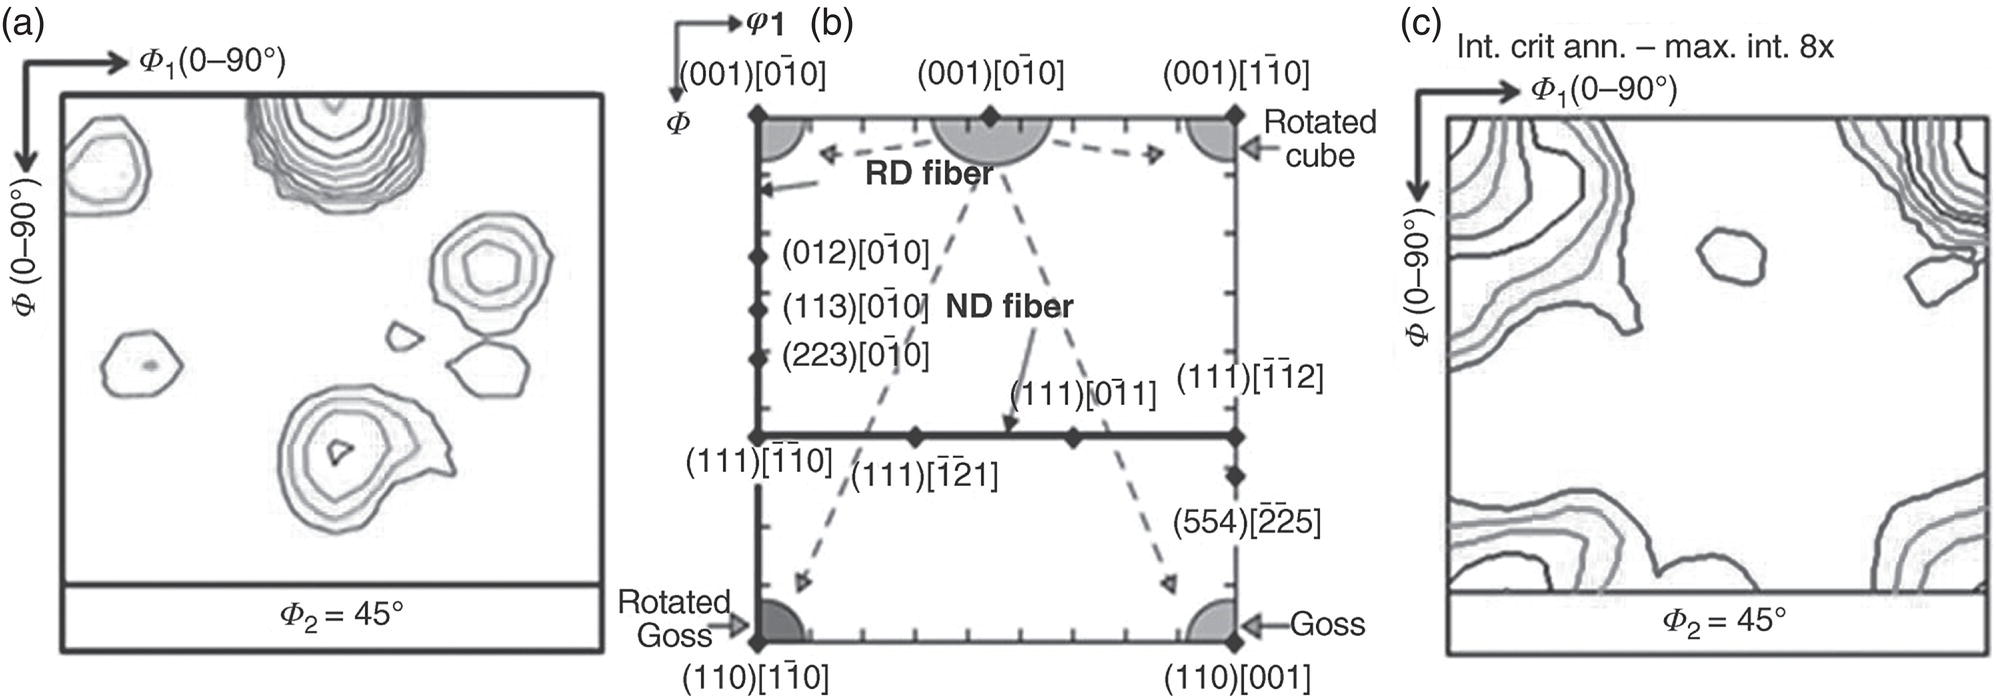
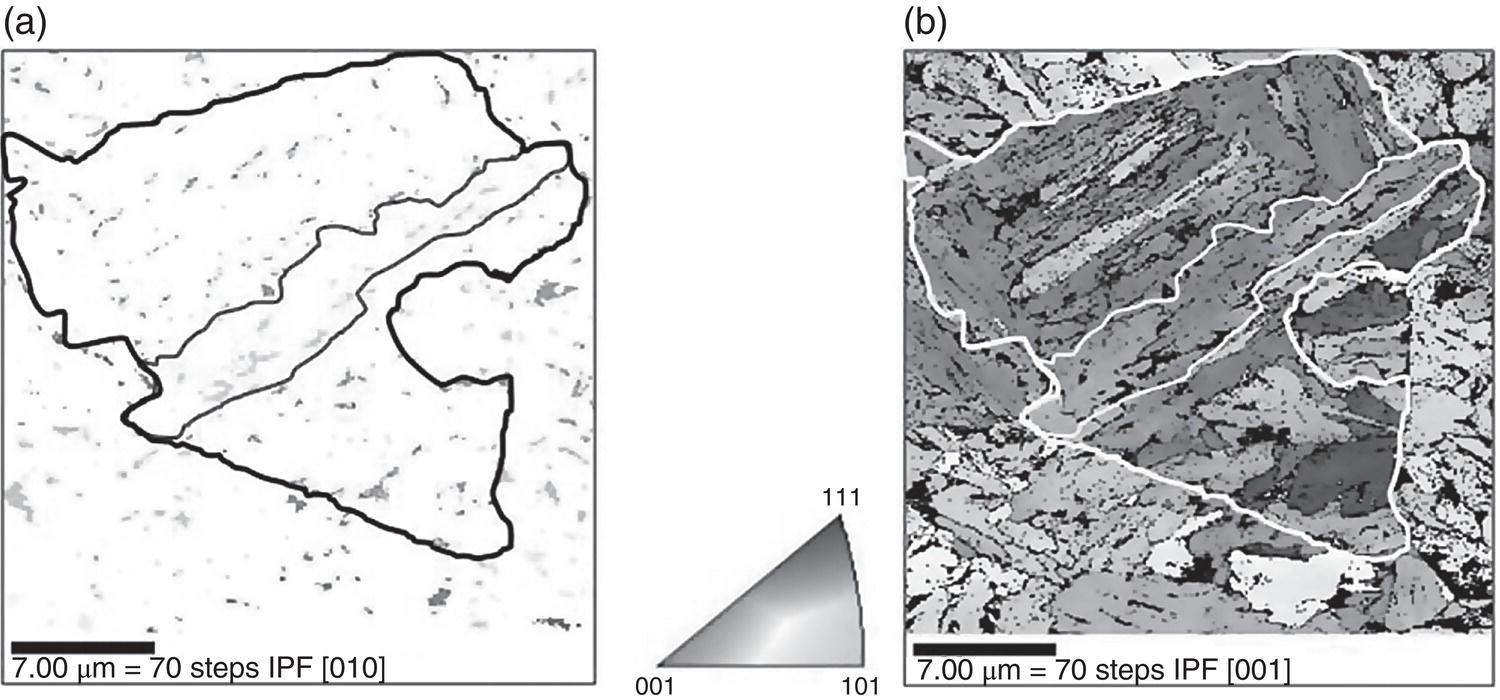
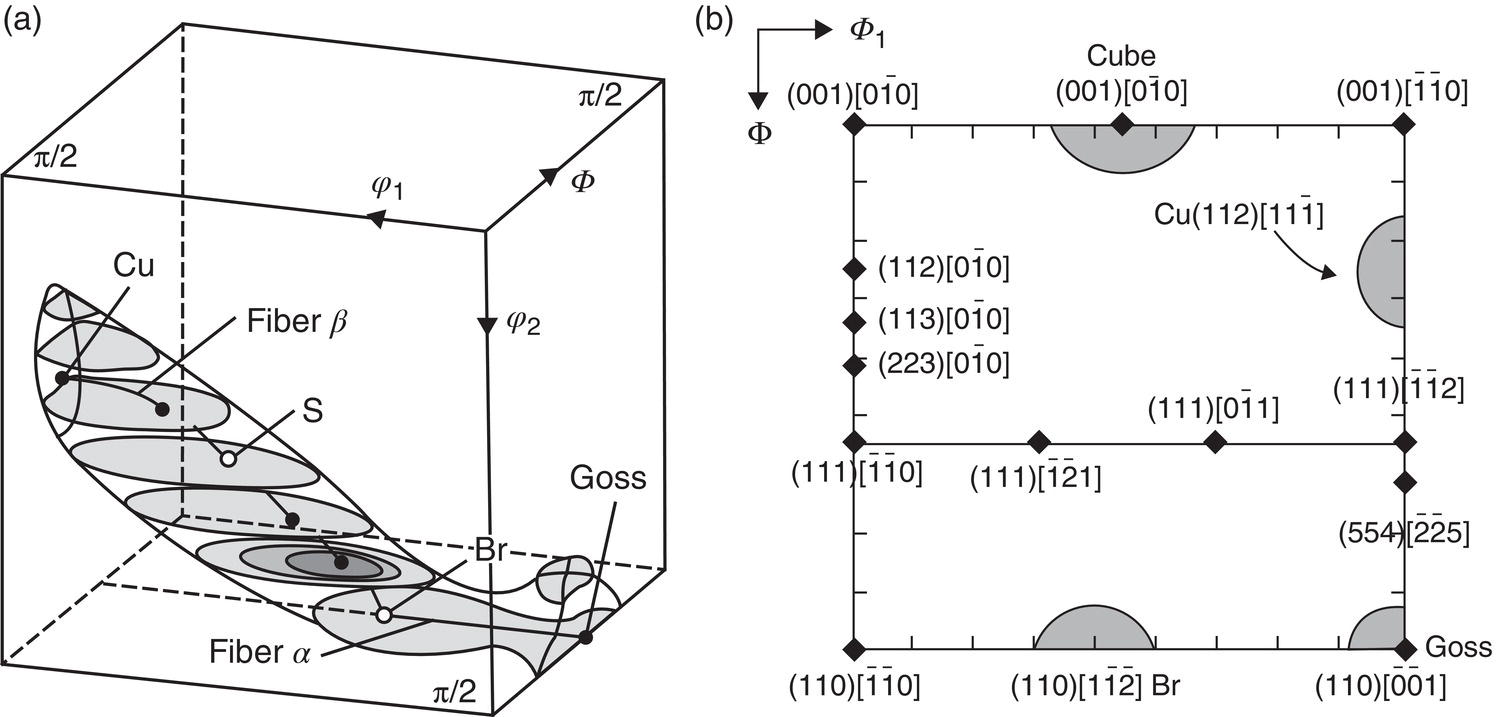
16
Microstructure and Texture Development in Pipeline Steels
16.1 Introduction
16.2 Short History of Pipeline Steel Development
Element
Range (%)
Preferred Range (%)
Carbon
0.05–0.30
0.15–0.20
Manganese
0.30–1.15
0.60–0.90
Silicon, maximum
0.10
0.10
Niobium (columbium)
0.005–0.2
0.005-0.2
Steel grade
Chemical composition in mass%
X60
C: 0.07
Mn: 0.95
Si: 0.20
S: 0.003
P: 0.015
Al: 0.03
Nb: 0.04
Ti: 0.012
N: 0.005
Other: nil
X70
C: 0.12
Mn: 1.5
Si: 0.25
S: 0.003
P: 0.015
Al: 0.025
Nb: 0.03
V: 0.08
N: 0.007
Other: nil
X80
Nb-V
C: 0.08
Mn: 1.63
Nb: 0.04
S: <0.003
V: 0.08
Mo: 0.10
Cr: nil
Ti: 0.013
N: <0.008
Othera: Cu, Ni
Nb-Mo
C: 0.04
Mn: 1.68
Nb: 0.08
S: <0.003
V: nil
Mo: 0.30
Cr: nil
Ti: 0.015
N: nil
Othera: 0.3 Cu, 0.2 Ni
Nb-Cr
C: 0.03
Mn: 1.70
Nb: 0.095
S: <0.003
V: nil
Mo: 0.10
Cr: 0.028
Ti: 0.013
N: nil
Othera: Ni
X100
C: 0.056
Mn: 1.97
Nb + Ti + V: <0.13
S: 0.002
B: nil
Mo: 0.41
Ni: nil
Cr: nil
P: 0.004
Othera:
X120
C: 0.05
Mn: 1.9
Nb: 0.048
S: 0.002
B: 0.0013
Mo: 0.30%
Cr: 0.22
Ti: 0.015
P: 0.004
Othera:
X120
C: 0.05
Mn: 1.99
Nb + Ti: 0.08
S: 0.002
B: 0.0017
Mo: 0.27
Ni: 0.62
Cr + Cu: 0.53
P: 0.008
Othera:
16.2.1 Thermomechanically Controlled Processing of Pipeline Steels
Element
Amount in mass%
Influence
C
Strengthener
Mn
0.5–2
Austenite stabilizer. Delays austenite decomposition during accelerated controlled cooling (ACC). Decreases ductile-to-brittle transition temperature (DBTT). Mild solid solution strengthener
Si
0.1–0.5
Deoxidizer. Solid solution strengthener. Suppresses carbide formation
Al
>0.02
Deoxidizer. Restricts austenite grain growth (AlN)
Nb
0.02–0.1
Strong ferrite strengthener. [Nb(CN)]. Suppresses austenite recrystallization. Grain size control. Delays γ–α transformation
Ti
0–0.06
Grain size control (TiN formation). Strong ferrite strengthener
V
0–0.1
Strong ferrite strengthener; (VN)
N
<0.012
Strengthener. Forms TiN, VN, and AlN
Mo
0–0.3
Promotes bainite formation; ferrite strengthener
Ni
0–0.5
Austenite stabilizer. Increases fracture toughness
Cu
0–0.55
Improves corrosion resistance; ferrite strengthener
Cr
0–1.25
Improves atmospheric corrosion resistance. Decreases critical quench rate 
16.2.1.1 Slab Reheating
16.2.1.2 Microstructure Formation During Rough Rolling

16.2.1.3 Microstructure Formation During Finish Rolling and Cooling
 temperature [39].
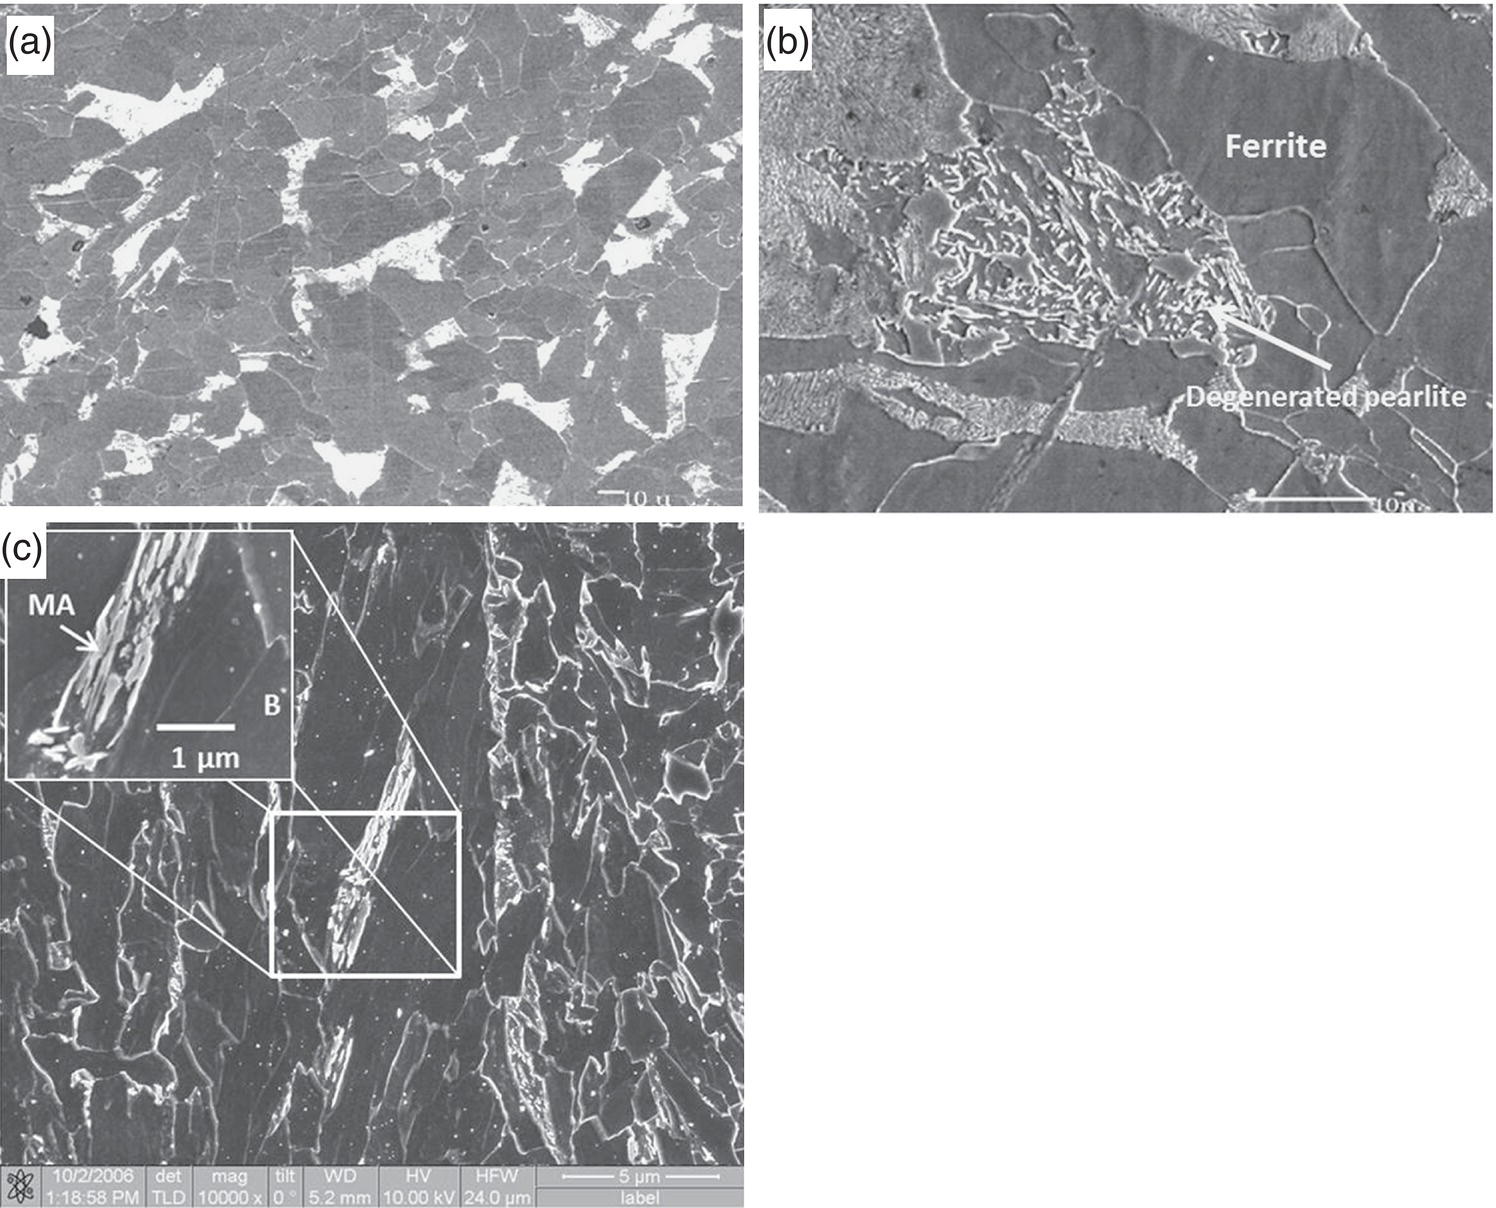
 = 840 °C. White zones are ferrite and gray zones are martensite.
16.3 Texture Control in Pipeline Steels
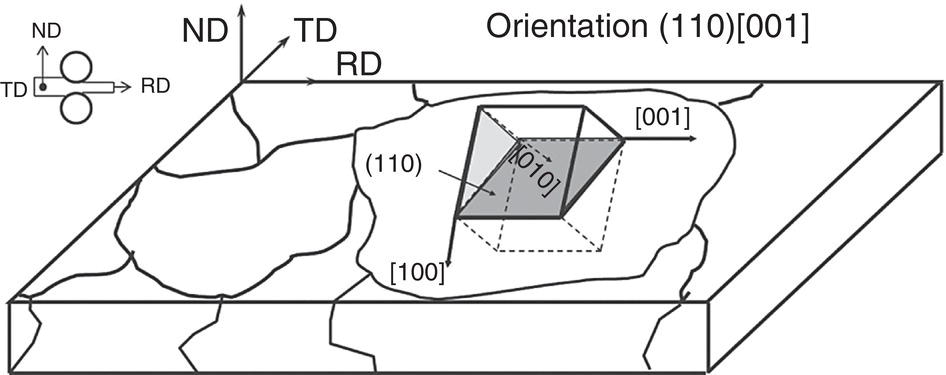
16.3.1 Fracture of Pipeline Steels

16.3.1.1 Properties of the {100}〈011〉 Component
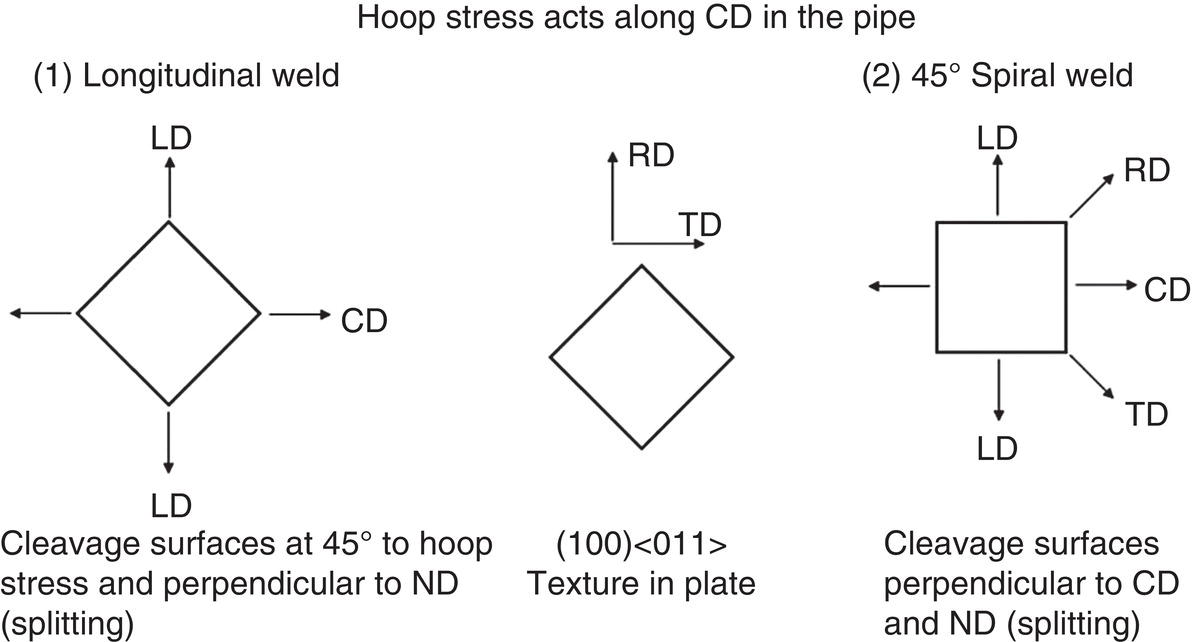
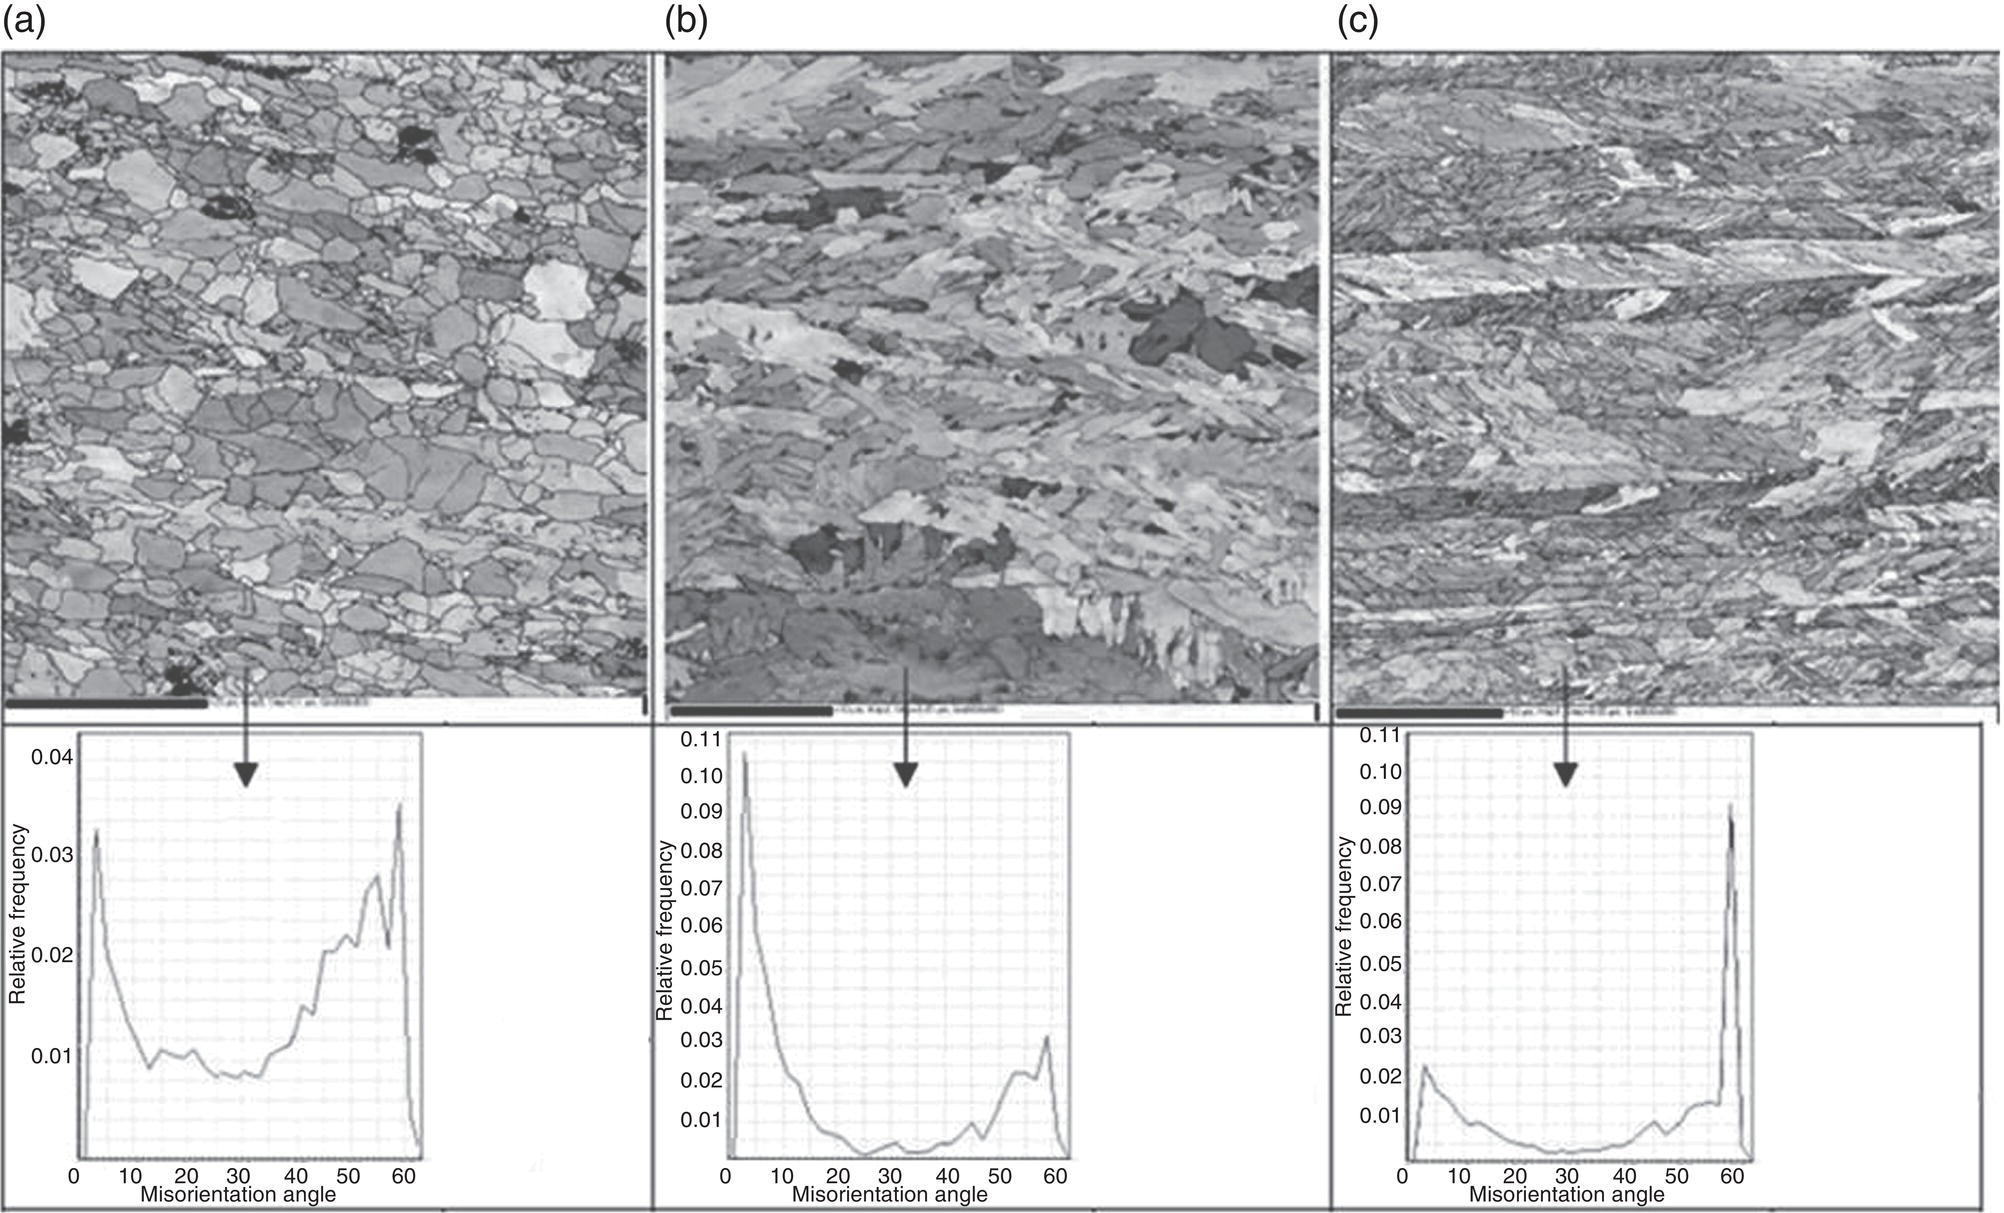
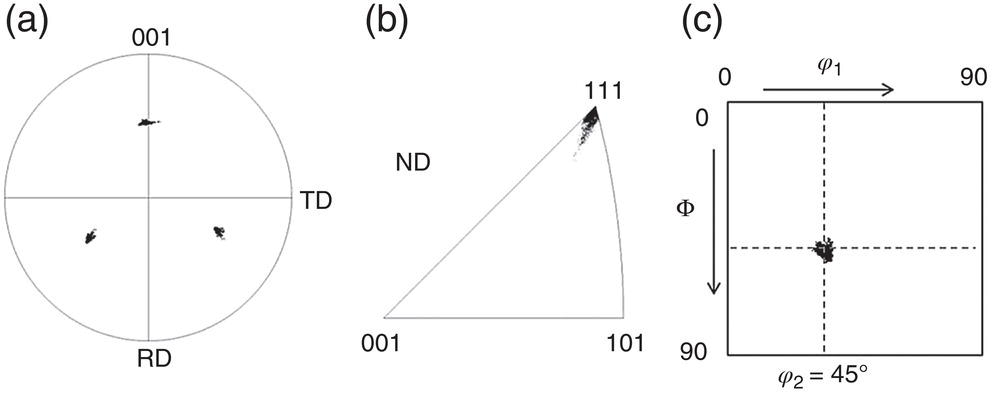
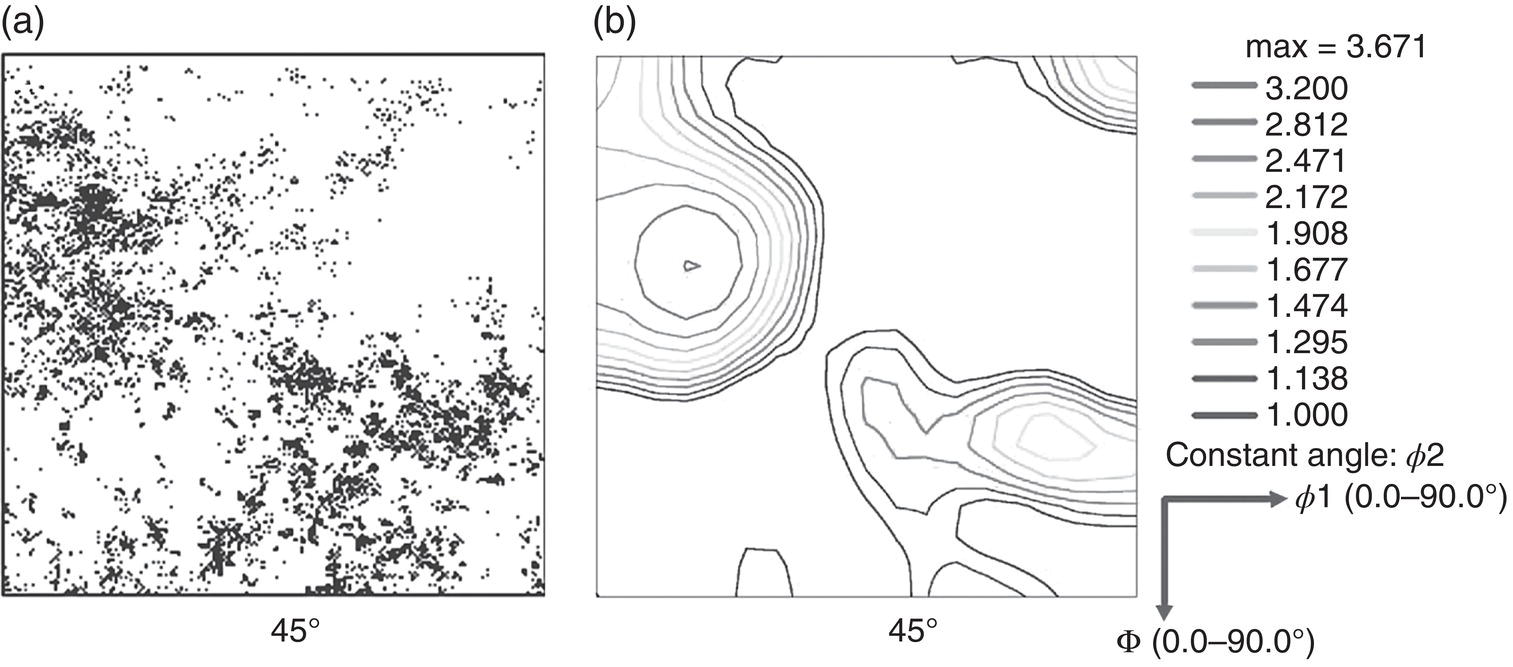
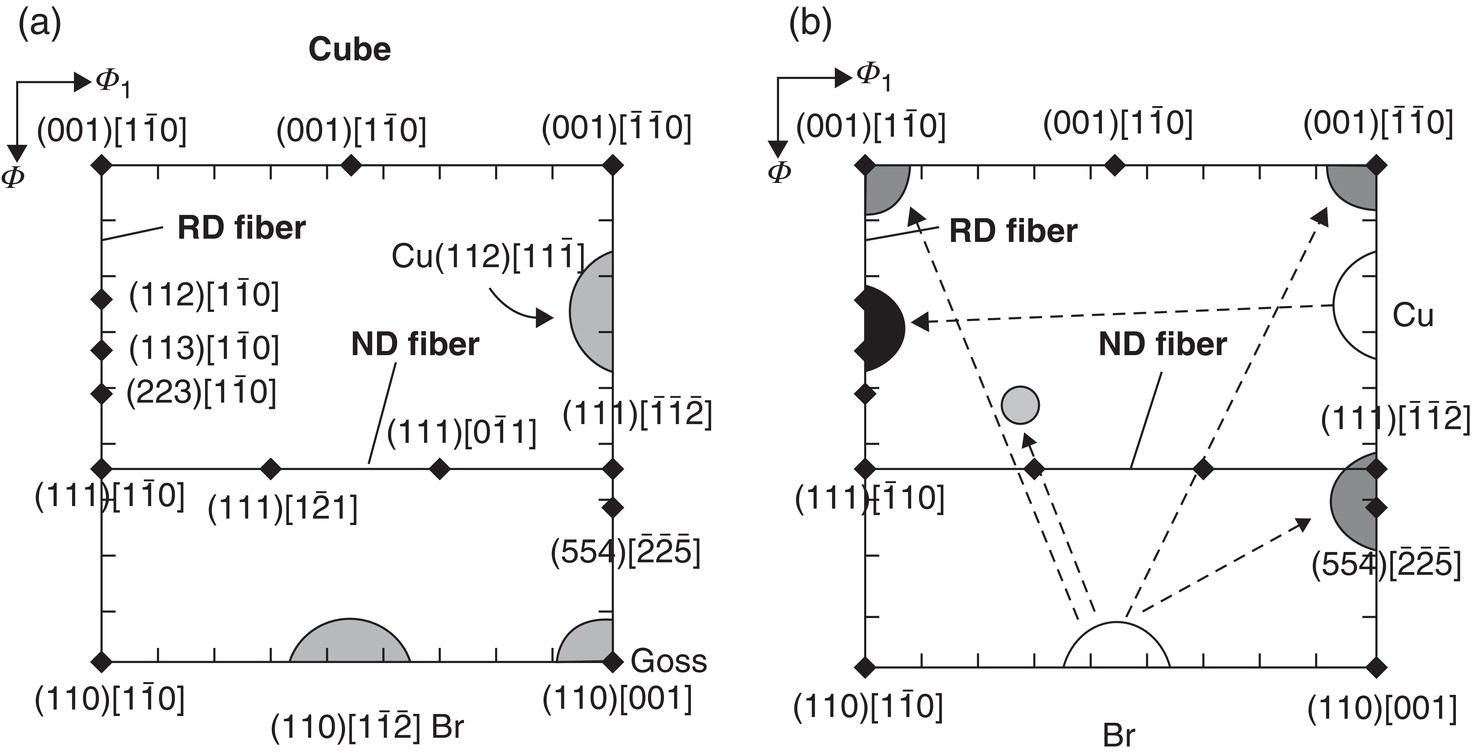
16.3.2 Effect of Phase Transformation on the Texture Components
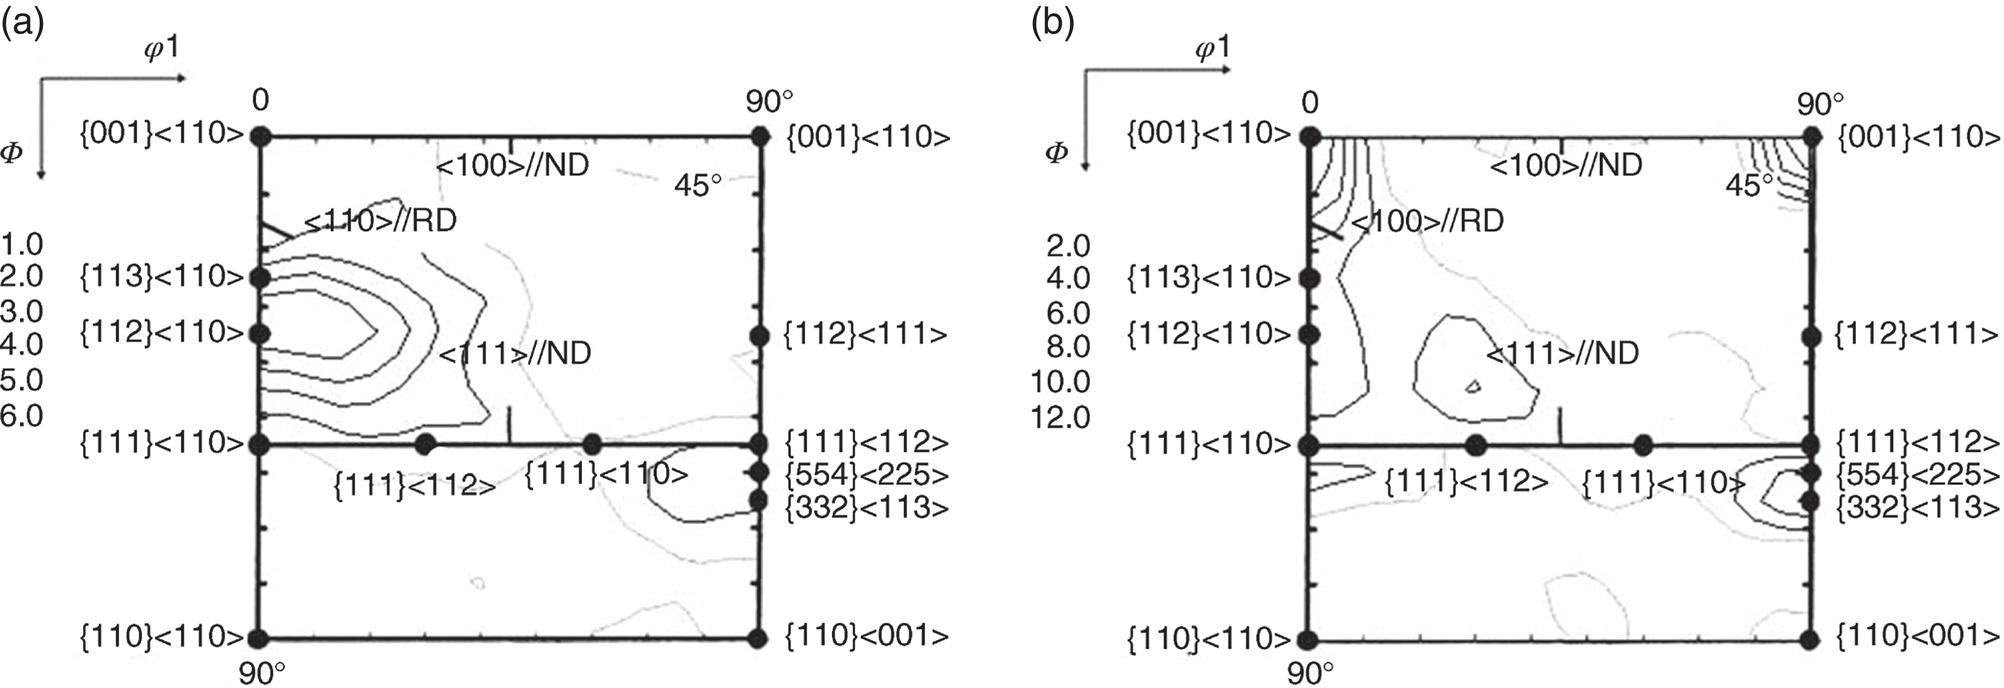
16.3.3 Effect of Austenite Recrystallization on Plate Texture
16.3.4 Effect of Austenite Pancaking on the Rolling Texture
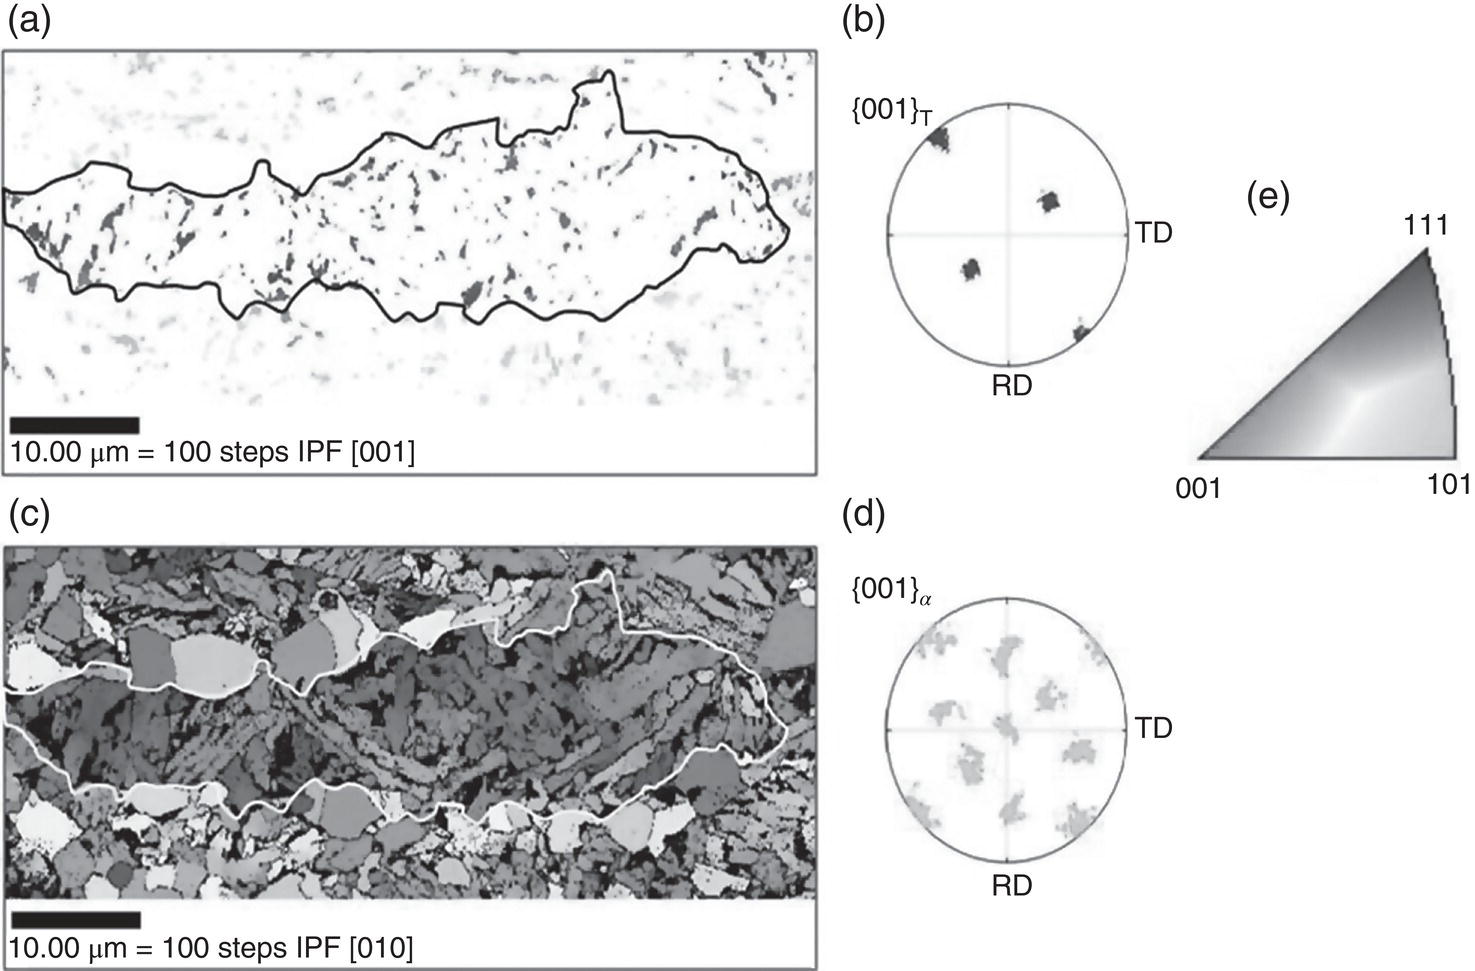
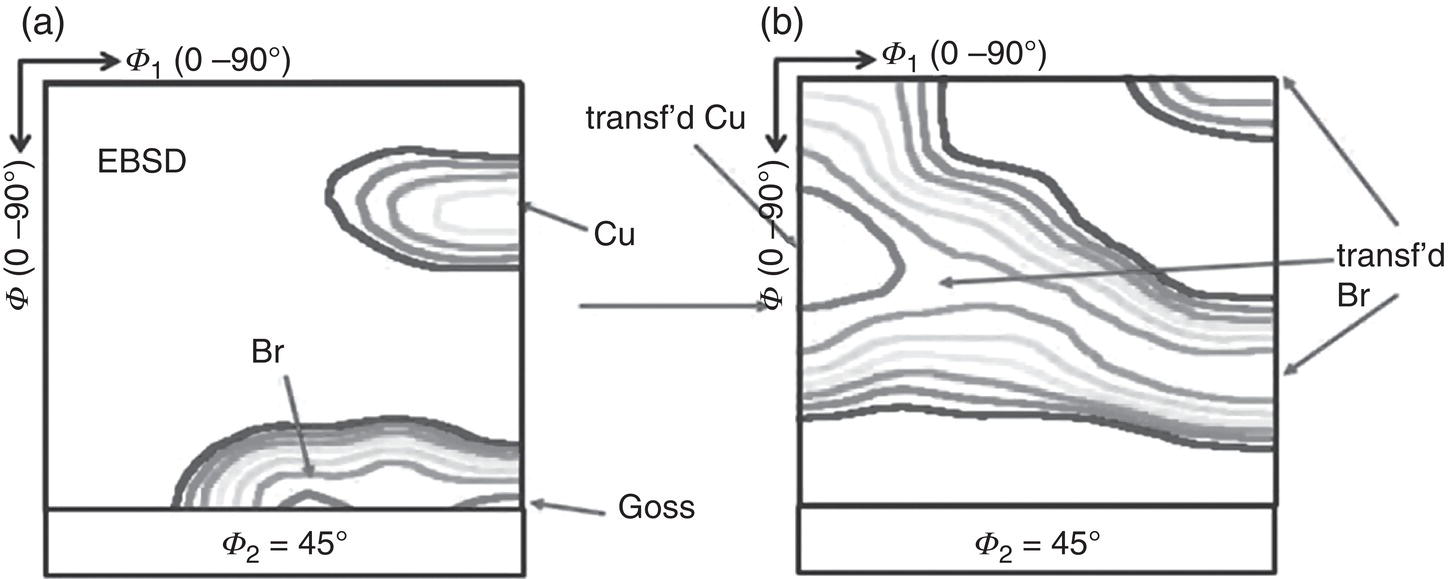
16.3.5 Effect of Finish Rolling in the Intercritical Region
16.4 Effect of Texture on In-Plane Anisotropy
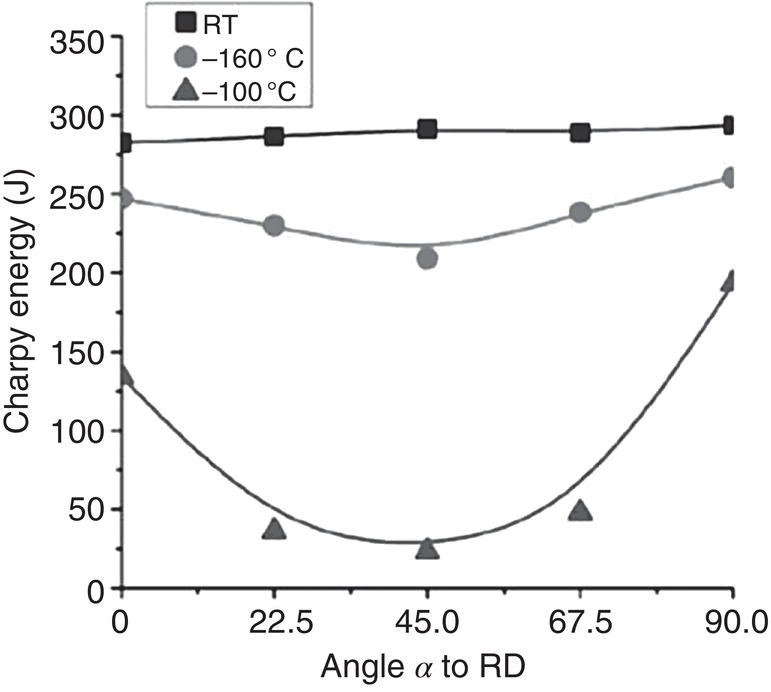

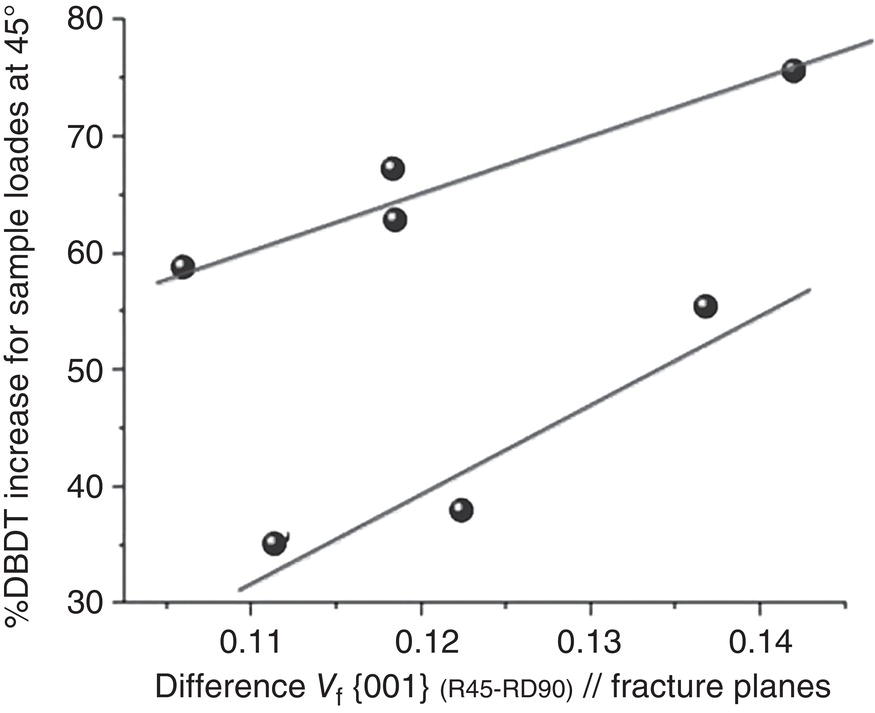
16.5 Summary
Acknowledgments
References
Notes