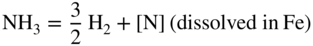
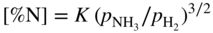
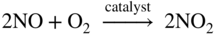
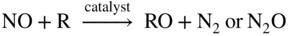
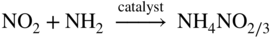
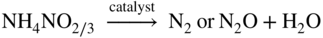
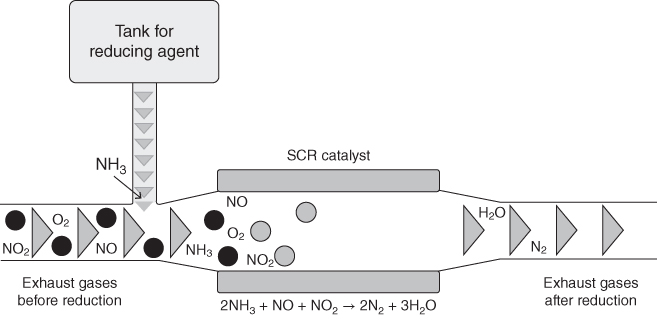
section epub:type=”chapter” role=”doc-chapter”> Nitridation is a process that results in the formation of nitrides in a material. It results from exposure to reducing high temperature environments with high nitrogen activity. These environments can be relatively simple, containing N2, NH3–H2O, and H2–N2–NH3, or can be very complex, originating mixed corrosion processes of nitridation, oxidation, and carburization. Since nitrides are inherently hard, brittle phases, nitridation can produce local or widespread loss of material strength and possible metal wastage. A beneficial form of this phenomenon, nitriding, is a controlled metallurgical process whereby the nitrides are formed on the surface of a material to increase hardness and improve wear resistance (Pye 2003). There have been a number of studies directed toward the effects of nitrogen on high temperature corrosion of metals (Aydin et al. 1980; Giggins and Pettit 1980; Grabke et al. 2003; Lai 2007; Pettit et al. 1969). Pettit et al. (1969) oxidized pure chromium in air at 1200 °C and found an external scale of chromia to be formed together with a layer of chromium nitride, Cr2N, which formed immediately on top of the metal. This structure is consistent if the nitrogen is transported through the chromia layer to form nitride at the metal surface. Perkins (1971) observed similar results for a series of chromium alloys oxidized in air at 1150 °C. Most of the alloys also showed internal nitridation. It was found that alloy surface preparation could influence the rate of transport of nitrogen through the chromia scales. When iron‐, nickel‐, and cobalt‐based alloys containing chromium were oxidized in air at 900 °C for 25 hours (Giggins and Pettit 1980), only oxide scales were formed, and nitride formation was observed only on a Co‐35 wt% Cr alloy. Presumably the inward diffusion of nitrogen through the chromia scale occurred in all cases, but only the Co‐35 wt% Cr alloy has a high enough Cr activity to form the nitride. The presence of nitrogen did not alter the isothermal behavior of the alloys, but extensive internal precipitation occurred on cyclic oxidation of Ni‐25 wt% Cr‐6 wt% Al and Co‐25 wt% Cr‐6 wt% Al alloys. It appears that the inclusion of nitrogen into the metal substrate, with resulting nitride precipitation and, perhaps, embrittlement, may be the main causes of a detrimental effect of nitrogen. Commercial processes where nitridation is encountered are those involving reducing process environments that contain ammonia or other reactive nitrogen‐containing species. Examples of these processes are found in the production of nitric acid and nylon. Since these environments are typically reducing and consequently do not have high oxygen activity, Cr content is not important. The most effective alloying element for resistance to nitridation is Ni. Up to 600 °C, it is common to use stabilized stainless steels such as AISI 347. However, for more severe conditions involving higher temperatures, Ni‐ and Co‐based alloys are employed. These include alloys B through B‐3 and N that use large additions of Ni, Mo, and/or W to promote resistance to nitride formation. In some cases, alloying with Al to over 4% has been reported to improve corrosion performance. In some chemical processes involving exposure to very high temperature and/or very severe nitriding conditions, nitrogen‐based ceramic material may be an attractive alternative. Such materials include silicon nitride and other highly stable nitrogen‐containing refractory materials. They are inherently more resistant to nitridation than metallic materials but are also less ductile and require special fabrication methods. These ceramic materials can also be applied as coatings to metal substrates in some cases to promote resistance to particular components (see also Chapter ). When a metal is exposed to nitrogen gas at high temperatures, nitridation proceeds according to where K is the equilibrium constant and Under oxidation/nitridation conditions, nitrogen molecules permeate through cracks and pores and reach the metal underneath the oxide scales when the oxide scale is no longer protective. Nitridation then proceeds by dissociation of nitrogen molecules and absorption of nitrogen atoms by the metal following reaction 10.1. Nitridation often takes place in the metal at the vicinity of cracks developed under creep conditions in air or N2‐containing combustion atmospheres. In this case, oxides are often associated with the crack deformation in air. Oxidation consumes the oxygen molecules from air, which penetrates into the crack, thus depleting oxygen and increasing nitrogen potential (or concentration) around the crack. As a result, nitridation takes place in the vicinity of the creep crack. At temperatures below 600 °C, and at high gas flow rates, the production of nitrogen is minimized, and the nitrogen solubility at the surface of iron is determined by where K is the equilibrium constant and The nitriding potential is proportional to Nitrogen solubility in the material is important in affecting the nitridation resistance of the material. The solubility of nitrogen in the material is also very affected by temperature. For example, the solubility of nitrogen in stainless steels largely increases with increasing temperature (e.g. for AISI 304, 0.125 wt% N2 at 538 °C and 0.281 wt% N2 at 981 °C). Alloys with higher nitrogen solubilities generally exhibit less resistance to nitridation attack. Thermodynamic and kinetic considerations on the mechanisms of nitridation, like the brief ones reported above, follow the avenues used to discuss the mechanisms for oxidation, sulfidation, halogenation, and carburization. The interested reader can find further information on these aspects in articles by Cao and Norell (2013), Christ et al. (2003), Douglass (1991), Han and Young (2001), Jack and Jack (1973), Parascandola and Möller (2000), Tjokro and Young (1995), Welker et al. (1989), and more recently in the book by Schütze and Grabke (2007). Many different alloys in industrial media are normally inclined to nitridation attack when subjected to environments containing nitrogen; when the temperature is below 500 °C, usually nitrogen attack (nitrogen diffusion) is nominal, but at higher temperatures surface nitrides or internal nitrides are produced, damaging the material. This is common with stainless steels when they are subjected to ammonia‐based conditions at high temperatures. Although nitridation attack is more common in reducing environments, oxidation dominating in air, or oxidizing combustion environments, under certain conditions, alloys can suffer internal nitridation attack along with oxidation. Internal nitridation attack, when it occurs, can penetrate farther into the metal interior than oxidation, thus significantly affecting the creep‐rupture behavior of the alloy by accelerating the creep crack growth. In an air oxidation study for two nickel‐based alloys, Litz et al. (1989) observed internal titanium nitrides (needle shape) formed in front of internal aluminum oxides that formed underneath the external oxide scales. Lai (2007) observed internal aluminum nitrides (needle shape) that formed underneath the external oxide scale and internal oxides in alloy 601 exposed to a furnace oxidizing atmosphere for about five years at about 800 °C. Several thermal cycling that causes cracking and spalling of oxide scales can also result in severe internal nitridation. Han and Young (2001) conducted cyclic oxidation tests by heating the specimens to 1100 °C (2010 °F) in still air for one hour, followed by cooling to room temperature for 15 minutes and then repeating the cycle again for 260 cycles. The alloys investigated were Ni‐24–38% Cr‐14–25% Al. The specimens suffered severe oxide scale spallation. The internal nitridation attack was found to be extensive, and the nitridation zone consisted of AlN beneath Cr2O3 and Al2O3, then AlN + Cr2N, and then AlN in the deepest region. During creep testing in air, extensive internal nitridation can develop in the vicinity of cracks. Brickner et al. (1965) found that types 302, 304, and 310 stainless steels showed significant nitridation after creep‐rupture testing in air at 870 °C in less than 1000 hours. Acicular nitrides (believed to be chromium nitrides) in a Widmanstätten pattern were found to form extensively in the vicinity of microcracks. Extensive nitridation was confirmed by the chemical analysis of the tested specimens for nitrogen, which showed that the nitrogen content was increased from about 0.058% before testing to 0.30–0.53% after creep‐rupture testing. Extensive internal nitrides were also observed in the vicinity of creep cracks in alloy 253MA (Fe–21Cr–11Ni) (Yu et al. 1987), alloy 800H (Guttmann and Burgel 1983; Welker et al. 1989), and alloy 800HT (Hoffman and Lai 2005). When creep cracks initially develop at the metal surface during creep testing in air, oxidation occurs at the crack surface including the crack tip. The oxide scales formed on the crack surface become non‐protective due to creep deformation, thus causing the oxygen potential to decrease significantly with concurrent increase in nitrogen potentials at the oxide–metal interface. As a result, nitrogen is absorbed by the metal and is diffused into the metal in the vicinity of cracks to form internal nitrides. High temperature alloys that are exposed to a high velocity oxidizing combustion gas stream at high temperatures are susceptible to internal nitridation attack (Hoffman and Lai 2005; Lai 1994, 1995; Swaminathan and Lukezich 1994). Figure 10.1 Schematic showing a model for internal nitridation attack in high temperature alloys in a simulated combustion environment (Lai 1994). A model for oxidation/nitridation reactions for chromia formers (Ni–Cr and Fe–Ni–Cr alloys) in oxidizing combustion atmospheres was proposed by Lai (1994). This model, as schematically illustrated in Figure 10.1, involves the following reaction steps: Table 10.1 Nitrogen absorbed (mg cm−2) and the average depth of internal nitridation for iron‐, nickel‐, and cobalt‐based alloys after exposure in 100% N2 at 1090 °C for 168 hours (Lai 1994) The N2 or N2–H2 atmosphere is commonly used as a protective atmosphere in heat treating and sintering operations, and these atmospheres can also originate nitridation corrosion. For example, in this context, Barnes and Lai (1993) conducted an extensive nitridation study in pure nitrogen atmosphere for iron‐, nickel‐, and cobalt‐based alloys at 1090 °C for 168 hours. Test results in terms of nitrogen absorption (mg cm−2) and the depth of nitridation are summarized in Table 10.1. As a result of rapid nitridation kinetics under the test condition, nitridation attack penetrated through the thickness of the test specimen for many alloys. Due to different thicknesses for different alloys, the ranking of alloy performance in terms of nitridation depths became difficult for most alloys tested. (The thickness of the test specimen varied from alloy to alloy, because of the use of whatever sheet products that were available for the preparation of test specimens.) Iron‐based alloys, the last group from RA330 to type 310SS, suffered the worst nitridation attack. Two cobalt‐based alloys, alloys 188 (Co–22Cr–22Ni–14W–La) and 150 (Co–27Cr–18Fe), exhibited poor resistance, with alloy 150 (high Cr and no Ni) showing extremely poor nitridation resistance similar to iron‐based alloys. Nickel‐based alloys were, in general, more resistant to nitridation attack than iron‐based alloys. Ammonia is a widely used nitriding gas for case hardening of steel material that is used at temperatures from 500 to 590 °C. The furnace units and components that are repeatedly subjected to such service conditions broadly receive brittle damages due to nitridation attack. Carbonitriding, another way of case hardening, develops a surface layer of carbides and nitrides. The process is conducted at 700–900 °C in ammonia with inclusions of carbonaceous gases, for example, methane. Hence, the heat treat retort, fixtures, and other furnace systems are subjected to nitridation and carburization. Engineering alloys in NH3–H2O environments were also found to suffer severe nitridation attack. For example, Grabke et al. (2003) investigated the corrosion behavior of a number of commercial alloys in the NH3‐30% H2O gas mixture at 500 °C. Several interesting results were obtained from this investigation. One of the most interesting observations was that significant nitridation attack and severe intergranular cracking were observed in alloy 600 (Ni–16Cr–8Fe) after only 200 hours of exposure. Alloy 600 has been known to be one of the most nitridation‐resistant alloys in ammonia environments, and the alloy has been widely used in ammonia plants. Alloy 800 (Fe–22Cr–32Ni–Al–Ti) was also found to suffer severe nitridation attack and intergranular cracking. For the ferritic stainless steel, Fe–18Cr (Sicromal), a combination of severe intergranular nitridation, cracking, and oxidation attack caused rapid disintegration of the alloy in 200 hours. An austenitic stainless steel (Fe–18Cr–9Ni) was also found to suffer severe nitridation attack. However, no cracking was observed in the austenitic stainless steel. They found formation of very fine CrN precipitates in these alloys. Grabke et al. (2003) pointed out that in these tests (low pressure), NH3 should decompose largely to N2 and H2, while under high pressures, such as in the Kalina process, decomposition of NH3 is considered to be negligible. The production of ammonia is another source of nitridation attack. Ammonia is developed by combining nitrogen and hydrogen over a catalyst, normally at temperatures of 500–650 °C and pressures of about 800–1000 atm. The “heart” of the process is the ammonia converter, where hydrogen and nitrogen combine. Significant corrosion issues are associated with the converter and the internal components inside the converter. Cihal (1962) discussed the major corrosion problems – hydrogen attack and nitridation – for the ammonia converter. The converter usually consists of a vessel with a catalyst basket and an interchanger inside the vessel. Because of high pressure, high temperature hydrogen in the converter, early converters were constructed out of a thick‐walled steel with an inner carbon steel lining and vent holes through the vessel wall. Thus, the inner carbon steel lining was the only part suffering hydrogen attack, while the main thick‐walled vessel was unaffected by high pressure, high temperature hydrogen. Hydrogen attack is the damage of steel by the reaction of hydrogen with cementite (Fe3C) in steel to form methane gas (CH4), resulting in the formation of microcracks and fissures as well as decarburization in steel. (Hydrogen attack is reviewed and discussed in Chapter 12.) Later designs of the converter allowed the cold inlet gas flowing along the vessel wall to keep the vessel cold, thus eliminating the potential hydrogen attack problem for the vessel. Cihal indicated that the internal components made of carbon steel exhibited a short life due to hydrogen attack. Alloy steels containing chromium were more resistant to hydrogen attack but had suffered severe embrittlement problems due to nitridation attack. An alloy steel containing a strong nitride former like titanium, such as alloy steel with 0.05% C, 2.9% W, and 0.54% Ti, exposed to the same converter environment under the same test conditions as 0.12C–5.6Cr–0.42Mo steel was found to show no cracking. The nitridation resistance of various alloys was examined in ammonia converter and preheater lines (Barnes and Lai 1989; Jack 1973; Moran et al. 1961; Rorbo 1980; Schenck et al. 1963). Average outcomes are described in Table 10.2. Table 10.2 Corrosion behavior of various alloys in an ammonia converter and ammonia line plant Table 10.3 Corrosion performance of various alloys/components in an ammonia converter Corrosion rates were observed to be firmly based on ammonia content. Stainless steel 304 is attacked at the rate of 0.02–2.5 mm yr−1 with a 5–6% to 99% increase in concentration of ammonia at 500 °C. In ammonia converter containing 5–6% ammonia at 490–550 °C, the stainless steel grades tested are 304, 316, 309, 310, 321, and 330; they showed nominal nitridation attack at the rate of 0.03 mm yr−1 or less. For an ammonia line plant that was subjected to 99% NH3, stainless steel grades 309 and 316 suffered from intense nitridation attack with corrosion rates about 2.54 mm yr−1 or above. SS 304 offered better performance than 316. Many components constructed from steel grade 304 subjected to temperatures of about 500 °C with ammonia concentrations of about 20% attained nominal nitridation attack at a rate of 0.01–0.1 mm yr−1. A grade 304 described nominally higher corrosion rate of 0.25 mm yr−1 or 10 mils yr−1 due to elevated temperature limits. Inconel 600 offered better corrosion resistance as compared with stainless steel grades, showing nominal attack rates as described in Table 10.3. McDowell Jr. (1962) reported field test results performed in a Casale converter (540 °C and 11 ksi) for one and three years. These results are summarized in Table 10.4. AISI 502 (5Cr steel) was extremely susceptible to nitridation attack, with more than 2.54 nm (0.1 in. or 100 mils) of nitridation depth in a year. Results showed a general trend of increased resistance to nitridation as nickel content in the alloy increased. One striking observation was that after three years of exposure, the alloys showed essentially similar depths of nitridation attack as they did after one year. Table 10.4 Depth of nitridation for various alloys after one and three years in a Casale ammonia converter (McDowell 1962) Verma et al. (1978) reported that an ammonia cracker unit used to develop nitrogen and hydrogen, failed after 100 hours of operation. The preheater tubes (operating at 350–400 °C) were made of Type 304SS, while the furnace tubes (operating at about 600 °C) were made of Type 310SS. Both suffered severe nitridation attack. To select an alternate alloy, nitriding tests were performed on various alloy samples at 600 °C in an environment consisting of 6–8% NH3, 75.77–77.5 wt% N2, and 16.25–16.5 wt% H2. Test results are summarized in Table 10.5. The alloys that performed well include types 347, 316, 321, SLX‐254, and HV‐9A. Type 347 was the best performer, having a linearly extrapolated penetration rate of about 0.13 mm yr−1 (5 mpy). Alloy 800, which contains more nickel than any of the above stainless steels, did not perform as well. Furthermore, type 304 was found to suffer attack of 2 orders of magnitude higher than that of type 316L. The results also showed that titanium suffered severe nitridation attack, which resulted in severe sample cracking. Both carbon steel and 1Cr–0.5Mo steel suffered decarburization after only 50 hours. Table 10.5 Nitridation attack of various alloys in an ammonia‐bearing environment at 600 °C for indicated exposure times (Verma et al. 1978) Decarb: decarburized. aNitridation through thickness. bSLX‐254: Fe–19.7Cr–24.5Ni–4.35Mo–1.43Cu. cHV‐9A: Fe–21.2Cr–24.6Ni–3.8Mo–1.5Cu. The pollution of the atmosphere by nitrogen oxides has been a subject of growing concern during the past decade. Photochemical smog, to which nitrogen oxides contribute and which causes respiratory and eye damage, was first recognized as a problem and characterized in Los Angeles and Tokyo and has led to control of emissions from motor vehicles in the United States, Japan, and Australia. Vehicle emissions legislation, requiring tight control of nitrogen oxides, has been proposed recently in all European countries. In the European context, the major perceived problem is that of “acid rain,” which has been implicated in vegetation damage, acidification of freshwater lakes and rivers, corrosion, and the weathering of buildings. Nitrogen oxides can also be a problem in the food industry where they are formed in direct fired drying and baking operations. The interaction of nitrogen oxides with proteins and foodstuffs can cause the formation of N‐nitrosamines that are hepatotoxic and carcinogenic. To avoid this, the food industry now widely uses indirect methods of heating even though it is generally accepted that these can increase the energy consumption by as much as 15%. Man‐made emissions of nitrogen oxides can be divided conveniently into those arising from stationary sources and those from mobile sources, where the primary noncombustion source is nitric acid manufacture. Various approaches to the problem of nitrogen oxide control may be envisaged; these are: Gas denitrification from a combustion or chemical process includes selective catalytic reduction (SCR), noncatalytic reduction, wet chemical scrubbing, adsorption on a solid, and electron beam irradiation (Siddiqi and Tenini 1981). Combustion modification is the first approach in controlling nitrogen oxides from combustion processes, in view of its low cost, this being put at only 20–33% of the cost of installing SCR equipment. Nevertheless, if high levels of nitrogen oxide reduction are required to meet stringent legislation, as existed in many countries, then it also becomes necessary to apply flue gas denitrification. SCR has been shown to be the most cost‐effective option available. For combined nitrogen oxide and sulfur oxide control in modern power plants, it is significantly cheaper to apply SCR combined with wet flue gas desulfurization than it is to use wet methods for controlling both pollutants simultaneously. Table 10.6 Reaction mechanisms of the catalytic reduction of nitrogen oxides R = hydrocarbon, hydrogen, carbon monoxide. Table 10.6 shows possible mechanisms for the catalytic control of nitrogen oxide emissions; these can be nonselective catalytic reduction (NSCR), using hydrogen, carbon monoxide, or hydrocarbons as the reducing agent, or SCR employing urea. A schematic of the SCR system is shown in Figure 10.2. Figure 10.2 Model of the SCR system. Urea is a solid compound for ammonia, which is the reducing agent that directly reacts with NOx on a catalyst surface. For applications in mobile diesel engines, the direct use of ammonia is not possible since storage and transport would be complicated and dangerous. The problem was solved by using an aqueous urea solution (32.5% by weight) stored in a tank on the outside of the truck beside the diesel tank. Firstly, the urea solution is pumped into a dosing unit and then sprayed through a nozzle into the exhaust flow, just before the muffler. The temperatures inside the exhaust flow can reach 250–600 °C depending on the engine workload. Below 250 °C the catalyst does not work. For this reason, no urea is used as the engine heats up. When the urea solution is sprayed into the exhaust flow, water is vaporized and the urea starts to decompose. It is generally accepted that urea decomposes in two different steps. Firstly, there is the thermolysis of the urea molecules into ammonia and isocyanic acid: which occurs within the exhaust pipe, before the catalyst, and then there is the hydrolysis of isocyanic acid, which occurs on the catalyst surface and leads to the formation of ammonia and carbon dioxide: According to the two reactions above, each mole of urea generates 2 mol of ammonia, which directly react with NO or NO2 on the catalytic surface. The main SCR reactions between ammonia and NOx are shown below (Fang and Da Costa, 2003): The presence of O2 molecules in the standard SCR reaction is needed to reoxidize the catalyst surface. The NO2 molecules play a similar role in the fast SCR reaction. The faster reaction suggests that NO2 can reoxidize the catalyst faster than O2. In addition to the desirable reactions that occur in a SCR system, there are several secondary reactions that are undesirable: These reactions do not lead to a lowering of the NOx content in the exhaust gases and are also detrimental for the system. For example, the oxidation of NH3 with oxygen should be removed, since it not only consumes the ammonia required for SCR process but also generates NOx. Other undesirable reactions are sulfation and nitration of NH3. Ammonia can react with SO2 or NO2 when there is water and the temperature is low. Anyway, the concentration of SO2 and NO2 in exhaust gases is much smaller than urea concentration, so the loss of ammonia due to the formation of NH4NO3 and (NH4)2SO4 can be ignored. The major losses of urea are due to the polymerization reactions that occur during urea decomposition and can lead to the formation of polymers such as polymeric melamine (Fang and Da Costa, 2003). The undesirable reaction for urea, instead of either anhydrous or aqueous ammonia, is Table 10.7 Chemical composition of AISI 304L and 904L austenitic stainless steels Table 10.8 Oxide thicknesses for as‐received and nitrided austenitic 304L and 904L oxidized for 24 hours in humid air containing 10% H2O Regarding the austenitic 304L, there is formation of both thin and thick oxide layers at 550 and 600 °C (Cao and Norell 2013). The ideal reaction has an optimal temperature range between 630 and 720 K but can operate from 500 to 720 K with longer residence times. The minimum effective temperature depends on the various fuels, gas constituents, and catalyst geometry. Other possible reductants include cyanuric acid and ammonium sulfate. Briefly, it can be said that, ideally, if the exhaust temperature is sufficiently high and the AdBlue injector (32.5% aqueous urea solution) and SCR system geometry have been well designed to have fast AdBlue evaporation rate and sufficiently long exhaust gas residence time between the AdBlue injector and the SCR catalyst, 100% urea to ammonia conversion can be expected at the very beginning part of the SCR catalyst. The use of urea within the diesel exhaust aftertreatment systems, in addition to the high temperatures reached, generates a particular detrimental environment from the corrosion point of view. Although the urea has been used for some years in stationary combustion plants, not many investigations regarding the influence of urea on corrosion in diesel exhaust system can be found. The majority of articles related with urea corrosion refer to the fertilizer production industry. Although the operating conditions in these plants are far from those in exhaust aftertreatment systems, a quick survey could be in any case useful to understand the corrosion behavior in these environments. Urea is produced at high pressure and at temperatures in the range of 200 °C (Demuzere, 1991). The two basic raw materials used are liquid ammonia (NH3) and gaseous carbon dioxide (CO2). The reaction takes place in two steps, since carbonic acid does not form a stable ammonium salt. The reaction between ammonia and CO2 has to be carried out under high temperature and pressure to form the intermediate product ammonium carbamate. The compound that is the most corrosive species is formed only at high pressures, so it is not present in the exhaust system. Nowadays, the main market that lies in fitting SCR units is becoming larger and larger, and the need to limit nitrogen oxide emissions is expected to become widespread in the future. Clearly, the high temperatures in the exhaust system, together with the products of the reduction reactions, produce a particularly corrosive environment, strongly detrimental for the corrosion resistance of the materials used. The demand for improved materials, capable of providing adequate resistance to nitridation and high temperature corrosion in general, has led to the examination of various stainless steels, namely, austenitic and ferritic stainless steels that have better engineering properties than austenitic grades and are typically less expensive because of the very low nickel content. In this context, we will be focused on the work of Cao and Norell (2013) that studied the role of the substitutional uptake of N in connection with corrosion of the 304L and 904L austenitic stainless steels at the urea injection in diesel exhaust systems. Four alloy coupons were nitrided, two of them with high N content and the other two with low N content; the nitrogen was induced in the steels by plasma nitriding (Fewell et al. 2000; Nii and Nishimoto 2012; Peng et al. 2010). Table 10.7 lists the chemical compositions of the two alloys studied. The samples nitrided with low N content were considered as‐received samples. The samples were then annealed and oxidized to see how the distribution of N develops in the structure and how this affects the oxidation. Cao and Norell found that plasma nitriding at about 400 °C deteriorates the oxidation resistance of both the austenitic steels studied in the temperature range 450–600 °C. As can be seen in Table 10.8, the deterioration was very marked for the 304L. The oxide scales were 70–100 times thicker than on the as‐received 304L. Also, the nitrided 904L was more oxidized than the as‐received 904L, but the oxide scales were only two to five times thicker. The X‐ray diffraction (XRD) results showed the formation of expanded austenite phase on the surface of both the as‐nitrided alloys. Precipitation of chromium nitrides was not detected on the as‐nitrided samples. X‐ray photoelectron spectroscopy (XPS) and Auger electron spectroscopy (AES) depth profiles showed the general formation of an outer Fe oxide layer and an inner (Fe, Cr) oxide layer on all as‐received and nitrided samples, oxidized for 24 hours, except for the 904L exposed at 500 °C. In this case, no clear enrichment of chromium was found. Enrichment in manganese was observed in the outer oxide layer for both the as‐received and nitrided samples of 304L oxidized for 24 hours at 600 °C. The XRD analyses of the nitrided 304L samples oxidized for 24 and 168 hours showed formation of mostly hematite and spinel phase (possibly as magnetite) at all temperatures. Only hematite was detected for the nitrided 904L samples exposed for 24 and 168 hours. Precipitation of CrN was detected on the 304L samples at all the exposure temperatures. The XRD patterns of the samples showed the presence of a weak and broad CrN peak at 450 °C. The CrN peaks became narrower and more intense by increasing temperature, consistent with the increase of nitride precipitation and grain size. Regarding the 904L, the most intense CrN peak was found at 500 °C, whereas no CrN peaks were detected at 450 and 600 °C. The decomposition of the S‐phase was observed for both 304L and 904L samples during oxidation at higher temperatures. At higher temperatures and longer times of exposure, the diffraction peaks of the S‐phase were shifted to higher 2θ angles and partially merged into the austenite peak. In 304L, formation of body‐centered cubic (BCC) phase during oxidation was observed. At 500–600 °C, the S‐phase was almost completely transformed to BCC phase, face‐centered cubic (FCC) phase, and CrN. For 904L, formation of BCC phase was not detected. It should be noted that plasma nitriding at low temperatures (about 400 °C) produces a single phase that is known as the S‐phase or expanded austenite supersaturated with N. The austenitic stainless steels are generally more used for applications at high temperatures since they are characterized by superior oxidation resistance. The addition of nickel in these grades transforms the iron from a ferritic to an austenitic phase, which has FCC structure and is more stable at high temperatures. It has also been suggested that nickel influences the adhesion and mechanical properties of the scale and retards the breakaway transformation (Sedriks 1979). Looking at the chemical composition of the two alloys (Table 10.7), it can be seen that the alloying element content is higher for the 904L. Particularly, chromium, nickel, and molybdenum contents are higher in this alloy. Consequently, the 904L shows an improved oxidation resistance compared with the other alloy analyzed. Also, the detrimental effect of the nitridation on oxidation is less serious for 904L than for 304L. Both nickel and molybdenum contents stabilize the S‐phase and decrease the Cr nitride precipitation during the exposures. Although the 904L shows the best oxidation resistance in the temperature range 450–600 °C, the high cost limits its use. The lower alloying element content in austenitic 304L stainless steel compared with 904L austenitic grade makes this alloy cheaper and more interesting for the application in exhaust aftertreatment systems. The oxide scales formed on the 304L are about 70–100 times thicker than on as‐received 304L. The strong effect of nitridation on the oxidation of austenitic 304L can be explained considering both the formation of expanded phases supersaturated of nitrogen and the further precipitation of Cr nitrides during the exposures. These two factors reduce the activity of chromium, preventing its diffusion from the alloy toward the surface and consequently the formation and maintenance of protective oxides (Gontijo et al. 2010a, b; Sung et al. 2007; Yun‐tao et al. 2008). For 304L grade, the oxides formed are less homogeneous in thickness, and areas of thin and thick oxides are observed in this alloy. AES/XPS depth profiles on nitride 304L show a general deterioration of the oxidation resistance at low temperatures. The thickest oxide scale is observed for the 304L alloy after exposure at 500 °C, which is about 4.5 μm. For the 304L, the improved oxidation resistance is observed at the highest exposure temperature. At this temperature, the values obtained for thin and thick oxides are 0.56 and 2.6 μm, respectively (AES depth profiles). It is then concluded by Cao and Norell (2013) that: Most studies regarding the nitriding of stainless steels have been carried out with austenitic stainless steel (Gil et al. 2006; Liang 2003; Samandi et al. 1993). But also a few have focused on ferritic and austenitic stainless steels, as briefly reviewed here. Gontijo et al. (2010a,b) studied the S‐phases formed on plasma‐nitrided AISI 304L and AISI 316L austenitic stainless steels and AISI 409L ferritic stainless steel. The alloys were plasma nitrided between 350 and 500 °C. The presence of similar S‐phase layers was observed in both the austenitic (BCC) and ferritic (FCC) stainless steels. The 409L series showed the formation of a layer with high amount of nitrogen, designed in the study as expended ferrite or ferritic Sα‐phase. The strain state was higher for the expanded ferritic phase in comparison with the expanded austenitic phases. Sung et al. (2007) studied the phase changes of the AISI 430 ferritic stainless steel after high temperature gas nitriding. The gas nitriding was performed at 1050–1100 °C. The relatively high chromium content of the ferritic 430 stainless steel enables the nitrogen to permeate into the interior. This effect is due to strong affinity between nitrogen and chromium. The surface layer was changed into martensite plus ferrite and Cr2N at 1050 °C, while martensite plus a rectangular‐type retained austenite appeared at 1100 °C by high temperature gas nitriding. The high temperature gas nitriding improved the wet corrosion resistance, while the precipitation of Cr2N at the outmost surface area deteriorated the corrosion resistance. Corengia et al. (2007) investigated the microstructure and corrosion behavior of DC‐pulsed plasma‐nitrided AISI 410 martensitic stainless steel. The DC‐pulsed plasma nitriding was carried out at 350 and 500 °C. At the lower nitriding temperatures, α‐Fe and a small amount of γ′‐Fe4N are detected on the surface. CrN nitrides were not detected since the CrN precipitation takes place at higher temperature. The shift and broadening of α‐Fe peaks, observed on the XRD patterns, were associated with the formation of a nitrogen oversaturated phase, called expanded martensite. The presence of these expanded phases, in addition to the small Fe4N nitride precipitates, produces the high surface hardness observed. At higher DC‐pulsed plasma nitriding temperatures, the nitrogen solid solution decomposed into α and CrN. The precipitation of CrN depletes chromium of the expanded phase and deteriorates the corrosion resistance of the alloy. The plasma‐nitrided AISI 410 was also investigated by Li and Bell (2007). After plasma nitriding at 450 °C for 20 hours, the surface consisted of mainly γ′‐Fe4N and ε‐Fe2–3N iron nitrides. CrN precipitation was observed on the XRD spectrum. The formation of expanded martensitic nitrogen solid solution into the surface was also suggested in this study. However, it could not be confirmed since the outmost nitrided layer was too thick to allow the penetration of the X‐ray through to the substrate. The cross‐sectional microstructure of the plasma treated 410 showed the formation of two distinct layers. The outer layer was considered to be a “nitrided” case rich in nitrogen and the inner one a “carburized” layer rich in carbon. In summary, nitridation behavior of metals and alloys in nitrogen environments is analyzed. Internal and surface nitridation attack can occur in air and oxidizing combustion environments. In NH3 and N2 environments, alloys behave slightly differently under nitridation attack. Industrial cases as those concerning nitriding of stainless steels and nitridation/oxidation in urea SCR systems are presented.
Chapter 10
Nitridation
10.1 Introduction
10.2 Nitridation Mechanisms
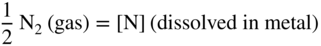
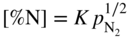
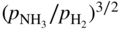
 is the partial pressure in the atmosphere. Increasing the nitrogen partial pressure (or nitrogen concentration) increases the thermodynamic potential for nitridation.
 and
and  are partial pressures of NH3 (ammonia) and H2, respectively.
 . Increasing ammonia partial pressure (or concentration) in the atmosphere increases the thermodynamic potential for nitridation. When nitrogen in the metal exceeds its solubility limit, nitrides will then precipitate out.
10.3 Nitridation in Industrial Media
 ; the concentration of nitrogen absorbed in the metal is then proportional to the nitrogen potential (
 ) (Eq. 10.2).
Alloy
Nitrogen absorbed (mg cm−2)
Depth of internal nitridation (mm)
214
0.2
0.0
600
1.1
0.41
230
2.7
0.46
HR160
3.9
1.19
X
6.0
0.63
617
5.1
>0.58
601
7.2
>0.59
188
3.7
>0.51
150
9.0
>0.80
RA330
6.6
>1.52
RA85H
8.5
>1.44
556
9.0
>1.52
HR120
9.6
>0.86
253MA
10.0
>1.50
800H
10.3
>1.50
800HT
11.4
>1.46
Type 310 SS
12.3
>0.79
Corrosion rate (mm yr−1)
Alloy
Ammonia converter
Ammonia line plant
SS 304
0.015 (0.59)
2.53 (99.5)
SS 316
0.012 (0.47)
>13.21 (520)
SS 321
0.012 (0.47)
—
SS 309
0.006 (0.23)
2.41 (95)
SS 310
0.004 (0.14)
—
SS 330
0.002 (0.02)
0.43 (17.1)
Inconel 600
—
—
Nichrome 80
—
—
Nickel
—
2.01 (79)
Component
Alloy
Temperature (°C)
Ammonia (%)
Operation times (yr)
Thickness of nitrides (μm [mils])
Average nitriding (μm yr−1 [mils yr−1])
Lining
SS 304
525
15–20
4
1000 (39.4)
250 (9.8)
Plate, second bed
SS 304
475
15–20
7
100 (3.9)
14 (0.6)
Bolt
302
—
—
7
375 (14.8)
54 (2.1)
Wire mesh, second bed
Inconel 600
520
—
7
8 (0.3)
1 (0.04)
Perforated plate, first bed
SS 304
500
13
5
270 (10.6)
54 (2.1)
Inner shell, second bed
SS 304
440
8–10
5
45 (1.8)
9 (0.4)
Perforated plate, second bed
SS 304
440
8–10
5
60 (2.4)
12 (0.5)
Center tube, second bed
SS 304
485
16
5
440 (17.3)
88 (3.5)
Nuts, bottom
SS 304
480
16
5
260 (10.2)
52 (2)
Bolt, bottom
403
480
16
5
540 (21.3)
108 (4.3)
Wire mesh
Inconel 600
500
—
4
6 (0.2)
1.5 (0.06)
Thermowell
304
500
3.5
8
200 (7.9)
25 (1)
Nitridation depth (mm [mils])
Alloy
1 yr
3 yr
502 (5Cr steel)
2.88 (113.2)
Completely nitrided
446
1.06 (41.7)
1.15 (45.3)
304
1.08 (42.7)
1.12 (44.0)
316
0.46 (18.2)
0.48 (18.7)
321
0.46 (18.3)
0.60 (23.6)
347
0.49 (19.2)
0.45 (17.6)
309
0.24 (9.5)
0.24 (9.6)
310
0.22 (8.8)
0.23 (9.2)
800
0.14 (5.4)
0.13 (5.3)
804 (30Cr–42Ni)
0.03 (1.2)
0.03 (1.2)
600
0.16 (6.4)
0.16 (6.4)
Nickel 200
None
None
Penetration depth of nitridation attack (mm [mils])
Alloy
50 h
100 h
300 h
600 h
1000 h
1500 h
Carbon steel
Decarb.
Decarb.
Decarb.
Decarb.
Decarb.
Decarb.
1Cr–0.5Mo steel
Decarb.
Decarb.
0.033 (1.3)
0.033 (1.3)
0.033 (1.3)
0.3 (11.8)
Titanium
0.0066 (0.3)
0.0133 (0.5)
0.233 (9.2)
0.266 (10.5)
Crackeda
Cracked a
304
—
0.013 (0.5)
0.013 (0.5)
0.03 (1.2)
0.06 (2.4)
4.2 (165)
316L
0.02 (0.8)
0.02 (0.8)
0.02 (0.8)
0.03 (1.2)
0.04 (1.6)
0.04 (1.6)
329
—
0.066 (2.6)
0.10 (3.9)
0.10 (3.9)
0.20 (7.9)
0.40 (15.7)
310
—
0.03 (1.2)
0.13 (5.1)
0.16 (6.3)
0.33 (13.0)
0.40 (15.7)
321
0.013 (0.5)
0.013 (0.5)
0.013 (0.5)
0.016 (0.6)
0.06 (2.4)
0.06 (2.4)
347
—
0.013 (0.5)
0.013 (0.5)
0.013 (0.5)
0.02 (0.8)
0.02 (0.8)
SLX‐254b
0.013 (0.5)
0.013 (0.5)
0.026 (1.0)
0.026 (1.0)
0.06 (2.4)
0.06 (2.4)
HV‐9Ac
0.01 (0.4)
0.10 (3.9)
0.10 (3.9)
0.10 (3.9)
0.10 (3.9)
0.10 (3.9)
800
0.02 (0.8)
0.10 (3.9)
0.20 (7.9)
—
0.20 (7.9)
0.20 (7.9)


Fe
C
Mn
Cr
Ni
Mo
Si
S
P
N
Cu
Ti
304L
Balance
0.019
1.63
18.25
8.05
0.43
0.28
0.001
0.028
0.072
0.33
0
904L
Balance
0.011
1.62
20.3
24.26
4.37
0.33
0.001
0.023
0.054
1.41
0.007
Temperature
450 °C
600 °C
450 °C
500 °C
550 °C
600 °C
Time (h)
Nitriding
None
None
X
X
X
X
24
304L
XPS/AES (nm)
28
37
2500
4500
470/4000
560/2600
904L
XPS/AES (nm)
32
50
150
210
135
110
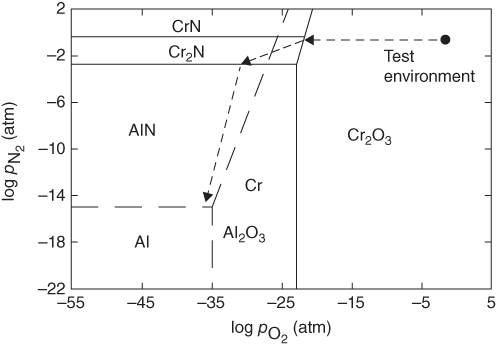
10.4 Questions and Problems
 for the nitridation of aluminum at 1100 °C.
References
Further Reading
Nitridation
10.1
10.2
10.3
10.4
10.5
10.6
10.7
10.8
10.9
10.10
10.11
10.12
10.13