section epub:type=”chapter” role=”doc-chapter”> Oxidation is an important high temperature corrosion phenomenon. Metals or alloys are oxidized when heated to elevated temperatures in air or in highly oxidizing environments, such as combustion atmospheres with excess air or oxygen. Many metallic components are subject to oxidation in engineering applications. The first paper that expressly addressed high temperature oxidation was written by Gustav Tammann in 1920. He articulated the “parabolic law,” i.e. the rate of oxidation of metal decreases as oxide layer thickness increases. In 1922 he established the logarithmic law of oxidation of metals. However, the first paper that laid out the basics of the problem as we know it was that by N.B. Pilling and R.E. Bedworth in 1923. They defined “high temperature” as that at which the transport of the reactive components through the protective layer was the principal determinant of the reaction rate (as opposed to the situation in aqueous corrosion processes at close to ambient temperatures). They showed that under these circumstances it could be expected that the rate of reaction would diminish as the protective scale thickened, leading to a “parabolic rate law.” They also highlighted the problems associated with forming an adherent crack‐free protective oxide layer on the oxidizing surface because of the volume changes associated with the oxidation process. The discussion to this seminal paper shows that others were thinking along similar lines at the time. Six years later, Leonard B. Pfeil introduced the concept of movement of metal outward rather than oxygen inward into the oxide layer, and in 1934 Portevin, Prétet, and Jolivet carried out extensive studies on the oxidation of iron and its alloys. At the same time, the discovery that oxides contained lattice defects and that the transport processes within them are determined by the motion of these defects allowed a more quantitative approach. This was recognized by Carl Wagner, who produced an important body of work over the course of the next 20 years largely defining how we now look at the basic theory of the bulk transport processes in oxides. Of significance was the derivation of Wagner’s equation by Hoar and Price in 1938. In recent years, however, the recognition that in many cases the transport processes involve short‐circuit paths, such as grain boundaries, has introduced further complications into this elegant picture. The problem of the integrity of the protective oxide was not part of Wagner’s contribution, and its practical solution for the high temperature alloys that were developed for applications mentioned above was discovered essentially by accident in the early 1940s. It was found that very small amounts of what are now called “reactive elements” added to the alloys introduced a remarkable improvement in the apparent integrity of the protective oxide, particularly in its resistance to thermal cycling. The reasons for this effect are still a matter of considerable debate. Other important contributions in the 1939–1948 period were those of Cabrera and Mott (1948), postulating that oxide film growth is controlled by ions jumping from site to site over intervening energy barriers. Mott’s theory was then highly criticized by Hauffe, who studied the oxidation of alloys (Mott 1940). During the 1920–1940 period, other relevant studies on oxidation at high temperature deserve reference: these are the interference method of obtaining thickness of oxide films (Tammann 1920–1926), the spectroscopic method to obtain thickness of oxide film (Constable 1927), and the X‐ray and electron diffraction methods to study oxide films (Finch Quarrell 1933). The earliest treatments of oxidation problems considered simple systems, with a single oxidant (usually oxygen) and a pure metal, although in practice high temperature‐resistant materials were always alloys. More recently, approaches such as in multicomponent diffusion theory have been applied, and the growth of oxides on polyphase materials have been analyzed. These approaches have been greatly assisted by the development of modern characterization techniques. The oxidation of metals is usually a reaction between a gas and a solid that produces a solid reaction product. At a first glance, this would seem to be a very simple process, but, actually, it is considerably more complex. The metal is usually not pure but contains, in addition to metallic impurities, O, N, H, C, S, etc. The gas atmosphere is also usually complex, containing (in addition to O2), N2, H2, CO2, H2O, etc. One would think that the reaction product, i.e. the scale that formed on the metal, acts as a physical barrier between the reactants, and thus the reaction should cease after the barrier is established. We know that this is not the case, because transport of matter through the scale causes the reaction to continue. We also know that the scale may not be dense and adherent to the substrate, but it may be cracked, partially spalled, partially detached (wrinkled), or even very porous. In some extreme cases, the scale may be a liquid that simply drips from the surface, or it may volatilize at very high temperatures. Indeed, the reaction between a gas and a metal is very complicated. Our interest in this multidisciplinary field of physical chemistry, solid‐state chemistry, metallurgy, materials science, and engineering arises from the fact that the chemical activity of a metal in various environments is an important factor in the winning, processing, and use of the metal. Demands are pressing from aerospace/gas turbine, chemical processing, refining and petrochemical, fossil‐fired power generation, coal gasification, waste‐to‐energy industry, pulp and paper, heat treating, mineral and metallurgical processing, nuclear power, space exploration, molecular electronics, and other sides for better metals and alloys for high temperature service in special reactive atmospheres and for metals with special physical properties. The science of gas–solid reactions, oxidation referred to in the generic sense, can involve reactions with, for example, sulfur, nitrogen, carbon dioxide, and water vapor and has greatly evolved in the past 60 years. Numerous symposia and colloquia (Steinmetz et al. 2004; Taniguchi et al. 2006) have been held on the subject and have been widely attended by researchers from all over the world. One of the many factors enabling advancement of our understanding of the field is the creation and evolution of new, sophisticated instruments and techniques that allow a much better analysis of scale compositions and structures. Details regarding this subject have led to thousands of publications and the writing of several books. Of the more recent books on oxidation, those indicated in references (Birks et al. 2006; Fromm 1998; Khanna 2002; Kofstad 1988, Lai 2007; Sarrazin et al. 2008) have been very useful. The present chapter summarizes the main factors for determining the nature and extent of gas–metal reactions, which are of paramount importance to understand the subject. An important tool in the analysis of oxidation problems is equilibrium thermodynamics, which, although not predictive of kinetics, allows one to ascertain which reaction products are possible, whether or not significant evaporation or condensation of a given species is possible, the conditions under which a given reaction product can react with a condensed deposit, and so on. The complexity of the oxidation phenomena usually dictates that the thermodynamic analysis be represented in graphical form. The types of thermodynamic diagrams most often used in oxidation research are listed in Section 3.2 on high temperature equilibria. The basic concepts pertinent to the construction and analysis of those thermodynamic diagrams are described in numerous thermodynamics books (Gaskell 1995; Kubaschewski and Alcock 1979). Determination of the conditions under which a given corrosion product is likely to form is often required, e.g. in selective oxidation of alloys. In this regard, Ellingham diagrams, i.e. plots of the standard free energy of formation (ΔG°) versus temperature for the compounds of a type, e.g. oxides, sulfides, carbides, etc., are useful in that they allow comparison of the relative stabilities of each compound. In Section 3.2.1 these free energy/temperature diagrams are properly discussed; here our considerations on the thermodynamics of high temperature oxidation will finish with a brief reference to the volatility of oxides. Some oxides exhibit high vapor pressures at very high temperatures (e.g. above 1000 °C). Oxide scales become less protective when their vapor pressures are high. Chromium, molybdenum, tungsten, vanadium, platinum, rhodium, and silicon are metals for which volatile species are important at high temperature. Vanadium is typically used in small quantities as a carbide former in alloy steels. Thus, the volatility of VO2 is generally of no concern in oxidation of alloys. The oxidation of Pt, and Pt‐group metals, at high temperatures is influenced by oxide volatility in that the only stable oxides are volatile. This results in a continuous mass loss. Alcock and Hooper (1960) studied the mass loss of Pt and Rh at 1400 °C as a function of oxygen pressure. The gaseous species were identified as PtO2 and RhO2. These results have an extra significance because Pt and Pt–Rh wires are often used to support specimens during high temperature oxidation experiments. If these experiments involve mass change measurements, it must be recognized that there will be a mass loss associated with volatilization of oxides from the support wires. The oxidation of pure Cr is, in principle, a simple process since a single oxide, Cr2O3, is observed to form. However, under uncertain exposure conditions, several complications arise, which are important both for the oxidation of pure Cr and for many important engineering alloys that rely in a protective Cr2O3 layer for oxidation protection. The two most important features are scale thinning by CrO3 evaporation and scale buckling as a result of compressive stress development (Asteman et al. 1999). The formation of CrO3 by the reaction becomes significant at high temperatures and high oxygen partial pressures. The evaporation of CrO3, shown schematically in Figure 7.1, results in the continuous thinning of the protective Cr2O3 scale, so the diffusive transport through it is rapid. The effect of the volatilization on the oxidation kinetics has been analyzed by Tedmon (1966). Figure 7.1 Schematic diagram of combined scale growth and oxide volatilization from Cr (Birks et al. 2006). Caplan and Cohen (1961) also observed that resistance promoted volatilization of Cr2O3. Asteman et al. (1999) indicated that high vapor pressure of CrO2(OH)2 can form by reacting Cr2O3 with H2O in O2‐containing environments. The volatilization of oxides is particularly important in the oxidation of Mo and W at high temperatures and high oxygen pressures. Unlike Cr, which develops a limiting scale thickness, complete oxide volatilization can occur in these systems. The condensed and vapor species for the Mo–O and W–O systems have been reviewed by Gulbransen and Meier (1979a, b), and the vapor species diagrams for a temperature of 1250 K are presented in Figures 7.2 and 7.3. The effects of oxide volatility on the oxidation of Mo have been observed by Gulbransen and Wysong (1948) at temperatures as low as 475 °C, and the rate of oxide evaporation above 725 °C was such that gas‐phase diffusion became the rate‐controlling process (Gulbransen et al. 1963). Naturally, under these conditions, the rate of oxidation is catastrophic. Similar behavior is observed for the oxidation of tungsten, but at higher temperatures because of the lower vapor pressures of the tungsten oxides. The oxidation behavior of tungsten has been reviewed in detail by Kofstad (1966). Figure 7.2 The Mo–O system volatile species diagram for 1250 K (Birks et al. 2006). Figure 7.3 The W–O system volatile species diagram for 1250 K (Birks et al. 2006). The formation of SiO2 on silicon‐containing alloys and Si‐based ceramics results in very low oxidation rates. However, this system is also one that can be influenced markedly by oxide vapor species. Whereas the oxidation of Cr is influenced by such species at high oxygen pressures, the effects for Si are important at low oxygen partial pressures. The reason for this may be seen from the volatile species diagram for the Si–O system (Rocabois et al. 1966). A significant pressure of SiO is seen to be in equilibrium with SiO2 (s) and Si (s) at oxygen pressures near the dissociation pressure of SiO2. This can result in a rapid flux of SiO away from the specimen surface and the subsequent formation of a non‐protective SiO2 smoke. This formation of the SiO2 as a smoke, rather than as a continuous layer, allows continued rapid reaction (Wagner 1958, 1965). Consider the oxidation reaction A similar reaction involving a metal phase and a gas phase was used in Section 6.8 to demonstrate the electrochemical nature of metal oxidation. Simple expressions for the growth of the MO oxide scale were also associated to support the transport of ionic and electronic species through the oxide layer. In this section, the kinetics of reaction 7.2 is discussed in more detail than it was possible in that overview chapter on high temperature electrochemistry. The progress, W, of this reaction can be characterized using several definitions of the reaction rate. It can, for example, be defined as the rate of oxygen pickup, dno/Adt, where dno corresponds to the number of moles of oxygen consumed during time dt and A the sample area. From an experimental point of view, though, it is easier to use the sample weight gain Δm. The reaction rate can then be expressed as dΔm/Adt, where dΔm is the weight change occurring during time dt. These expressions are linked by the equation Integration of the rate equation leads to the rate law corresponding to the corrosion process and defines the progress, W, of the reaction with time. We obtain either an implicit form: where k is the rate constant for the reaction process, or an explicit form: In any fundamental study of the oxidation mechanism of a metal or an alloy, one of the main factors that needs to be determined is the variation of the oxidation rate with temperature and with the pressure of the oxidizing gas. This type of investigation has sometimes been neglected because of difficulties controlling precisely the gas pressure in thermobalances. However, for some years, it has been possible to couple such thermogravimetric equipment to devices capable of controlling and monitoring the oxygen partial pressure in a gas (e.g. an electrochemical oxygen pump, oxygen sensor). The oxygen pressure then can be precisely controlled between 1 and 10−25 bar in gas mixtures, e.g. inert gas–oxygen, CO–CO2, or H2–H2O mixtures (ASM 2003). The rate constants of the kinetic laws often obey, under constant pressure, an Arrhenius‐type equation: where Ea is the apparent activation energy of the process, R the gas constant, and T the absolute temperature. The apparent activation energy can be easily determined by plotting k as a function of 1/T. The slope of the straight line obtained is equal to −Ea/2.303R. A change in the activation energy could indicate a corresponding change in the limiting process for the corrosion reaction. The main kinetic laws are of linear, parabolic, logarithmic, or cubic types, but it should be noted these are limiting cases and deviations from them are often encountered. In some cases, it is difficult, or even impossible, to obtain such simple kinetic laws from the experimental results (Evans 1960; Hauffe 1965; Kofstad 1988). At high temperatures, the oxidation kinetics of numerous metals obey a parabolic law: where kp is the parabolic constant. Such a law corresponds, as will be shown later, to a corrosion rate limited by diffusion through the compact scale that is formed. The reaction rate constant may be expressed in different units depending on the actual parameter used to define the progress of the reaction. For example, if the extent of reaction is characterized by the mass gain per unit surface area of the metal during the exposure period, t, the kinetic law is given by (Δm/A)2 = kp × t, and the rate constant is expressed in kg2 m−4 s−1. If the reaction rate is defined by the increase in thickness, y, of the scale, the kinetic law has the form where Ω is the molar volume of compound MX and Mx is the atomic weight of the nonmetallic element (oxygen, sulfur, etc.). In some cases, the oxidation rate is constant, which means that the kinetic law is linear: As will be shown later, the oxidation rate is then governed by an interfacial process such as sorption, reaction at the metal–oxide interface, etc. Using similar nomenclature as for the parabolic rate constants, kl characterizes the reaction measured by the mass gain per unit surface area during time t and The cubic law (W3 = kct) has been observed during the oxidation of several metals, for example, copper, nickel, and zirconium. Logarithmic laws are observed typically in the case of many metals at low temperatures (generally below 673 K). The initial oxidation rate, corresponding to the growth of oxide layers of thickness generally less than a few tens of nanometers, is quite rapid and then drops off to low or negligible values. This behavior can be described by a direct logarithmic law: or by an inverse logarithmic law: The evaluation of the kinetic parameters in the case of the logarithmic law is, generally, not very precise, and this makes it difficult to validate experimentally proposed mechanisms. The oxidation rate is frequently found to follow a combination of rate laws. As an example, at low temperatures, a logarithmic law followed by a parabolic rate equation can be observed. At high temperature, oxidation reactions are often described by a parabolic rate equation followed by a linear law (“paralinear” regime) or a linear rate equation followed by a parabolic law (Pettit and Wagner 1964). Typical kinetic laws characteristic of the oxidation of a large number of metals as a function of temperature were fully analyzed by Kubaschewski and Hopkins (1967), Kofstad (1988), and others. Table 7.1 gives some examples. Table 7.1 Kinetic laws characteristic of the oxidation of several metals as a function of temperature (from Kubaschewski and Hopkins 1967) As an example, the kinetic laws characteristic of chromium oxidation are shown in Figure 7.4. It can be seen that at 1000 °C, a parabolic law is observed but that at 1075 °C the experimental curve is characteristic of the formation of compact scales that crack at a critical thickness due to high mechanical stresses between the metal and the growing scale; at 1200 °C, a linear rate equation is observed, with a noticeable increase in corrosion rate. Figure 7.4 Chromium oxidation, between 1000 and 1200 °C, under 1 bar of oxygen (Kofstad 1966). Besides the variation of the kinetic laws with temperature, a change of these rate equations with time can sometimes occur. A typical example, characteristic of the changes that may be observed as functions of temperature and time, is given in Figure 7.5. At 800 °C, for example, the following rate equations are successively observed: parabolic, paralinear, and finally linear after extended oxidation. Figure 7.5 Successive kinetic laws observed for the oxidation of a given metal as function of temperature and time. In many cases, it may be difficult to fit experimental data to simple rate equations, but a first approach can be to plot the W = f(t) curve using double logarithmic coordinates. In the case of a law of type Wn = kt, the slope of the straight line then gives the value of n, i.e. 1, 2, and 3 for linear, parabolic, and cubic laws, respectively. Some authors, using computer software, fit the data to a third‐degree polynomial in W: Difficulties in evaluating the proper kinetic law are particularly important in the case of changes in the oxidation behavior during the corrosion process. An elegant method consists of continuously monitoring the kinetic curves with exposure time and calculating, for each experimental point, the rate constant appropriate to the expected model. Deviations from this model can be readily identified (Monceau and Pieraggi 1998). The formation of an oxide scale starts with the adsorption of oxygen gas on the metal surface. During adsorption, oxygen molecules of other gaseous species in the environment dissociate and are adsorbed as atoms. These atoms initially adsorb at sites where the atom is in contact with the maximum number of surface atoms in the metal substrate. Therefore, in polycrystalline materials, grains of preferential orientation exist where the number of adsorbed atoms from the gaseous atmosphere is highest. The result of this process is a two‐dimensional adsorption layer. The presence of adsorbed layers may increase the rates of surface diffusion by orders of magnitude compared with those for surfaces with none or small amounts of adsorbate. When the metal surface that is saturated with adsorbed oxygen atoms or atoms from other gaseous species is further exposed to the gas, the gaseous species may dissolve in the metal, and nuclei of the corrosion product are formed on the surface. These nuclei grow laterally and form a continuous film on the surface. Generally nucleation and growth of the nuclei are dependent on the composition of the substrate, the grain orientation, the temperature, and the gas partial pressure. The nuclei grow in thickness and lateral direction and the reaction rate increases with time. As soon as the nuclei impinge on each other, the growth rate decreases. Therefore, the general reaction kinetics can be described by an S‐shaped curve (Kofstad 1988). Nuclei of all potential corrosion products can be formed on alloys initially, i.e. those that are possible from thermodynamic stability considerations. After the initial stage of oxidation, which is determined by the behavior of the nuclei, growth of the continuous scale occurs in the thickness direction. In dense oxide scales, the growth is determined by solid‐state diffusion through the scale. Corrosion products, which include the oxide scales, are ionic structures, and diffusion in such structures requires lattice disorder, i.e. the corrosion products need to be nonstoichiometric compounds. Therefore, an understanding of reaction mechanisms in high temperature conditions requires a precise knowledge of defect structures in solids. Extensive studies of defect theory have been provided by Kröger et al. (1956), Kröger (1975), Philibert (1985), Kofstad (1972), Mrowec (1980), and others, but here only an oversimplified discussion will be presented. It should also be noted that Chapter of this book gives a general treatment of lattice defects in metal compounds and includes descriptions of point defects, defect reactions, defect equilibria, and equilibrium constants. It was considered desirable to include these more general aspects so that the book could be read as a self‐contained text without the need for repeatedly consulting other books or publications. Various types of defects may affect scale growth, but we shall only consider the crystalline defects that determine the growth of a compact layer and the three‐dimensional defects, such as cracks and pores, that determine the growth of a porous scale. The crystalline defects represent departures from the perfect crystalline array and include point defects (imperfections in the distribution of ions within the lattice), line defects (displacements in the periodic structure of the crystal in certain directions or dislocations), and planar defects or grain boundaries (regions of lattice mismatch). The point defects comprise either empty crystallographic sites (vacancies) or atoms occupying the interstices between the regular lattice sites (interstitial atoms). Their mole fraction in each sublattice, i.e. either the cation or anion sublattice, generally does not exceed 10−3–10−2 and is frequently much less. For point defect mole fractions sufficiently high, the defects may associate or cluster to form complex defects such as extended defects or aggregates of point defects (clusters). Point defects strongly influence the growth of compact scales and will be briefly treated hereafter. A complete development of defect chemistry of inorganic compounds requires a system of notation to describe all the elements of the crystal or “structural elements,” that is, not only regular crystallographic sites but also lattice imperfections. The Kröger and Vink notation (Kröger et al. 1956), recommended by IUPAC because of its great simplicity, will be used here. Thus, in a crystal MO, a structural element of the cation sublattice has a normal charge of +2 and, consequently, an effective charge equal to zero. The electronic defects may be considered as structural elements. The electronic defect with positive charge will be written h• (h with a superscript dot). This defect corresponds to the removal of an electron from a regular site of the cation sublattice and can also be written as Following these rules, it is possible to write equilibrium reactions that occur internally without involving the external environment and external equilibria involving mass exchange with the environment. The equilibrium constants will then be evaluated assuming that the activities of atoms on their normal lattice positions can be considered as unity and the activities of point defects will be approximated by their concentration, usually indicated by a double bracket [ ], and expressed as the number of moles per mole of compound. Alkali halides, silver halides, and several oxides (Al2O3, MgO, etc.) are stoichiometric compounds. Some of them are characterized by vacancies and interstitials in one sublattice (e.g. AgBr, with Frenkel disorder); others possess defects in both sublattices (e.g. NaCl, with Schottky disorder). However, it is apparent that neither of these defects can be used to explain material transport during oxidation reactions, because neither defect structure provides a mechanism by which electrons may migrate. Considering a diagrammatic representation of the oxidation process shown in Figure 7.6, it is seen that either neutral atoms or ions and electrons must migrate in order for the reaction to proceed. In these cases, the transport step of the reaction mechanism links the two phase‐boundary reactions as indicated. There is an important distinction between scale growth by cation migration and scale growth by anion migration in that cation migration leads to scale formation at the scale/gas interface, whereas anion migration leads to scale formation at the metal/scale interface. Figure 7.6 Interfacial reactions and transport processes for high temperature oxidation mechanisms: (a) cation mobile and (b) anion mobile (Birks et al. 2006). In order to explain simultaneous migration of ions and electrons, it is necessary to assume that the oxides that are formed during oxidation are nonstoichiometric compounds. From a macroscopic viewpoint, two alternative classes of nonstoichiometric compounds can be considered: In order to allow extra metal in ZnO, it is necessary to postulate the existence of interstitial cations with an equivalent number of electrons in the conduction band. The structure may be represented as shown in Figure 7.7. Here, both Zn+ and Zn2+ are represented as possible occupiers of interstitial sites. Cation conduction occurs over interstitial sites, and electrical conductance occurs by virtue of having the “excess” electrons excited into the conduction band. These, therefore, are called “excess” or “quasi‐free” electrons. Figure 7.7 Interstitial cations and excess electrons in ZnO – an n‐type metal excess semiconductor (Birks et al. 2006). The formation of this defect may be visualized, conveniently, as being formed from a perfect ZnO crystal by losing oxygen: the remaining unpartnered Zn2+ leaving the cation lattice and entering interstitial sites and the two negative charges of the oxygen ion entering the conduction band. In this way, one unit of ZnO crystals is destroyed, and the formation of the defect may be represented by for the formation of for the formation of The two equilibria shown above will yield to thermodynamic treatment, giving Eq. 7.15 for the equilibrium in Eq. 7.13: or, since the defects are in very dilute solution, we may assume that they are in the range obeying Henry’s law, when the equilibrium may be written in terms of concentrations If Eq. 7.13 represents the only mechanism by which defects are created in ZnO, then Eq. 7.17 follows: Hence, putting Eq. 7.17 into Eq. 7.16, we obtain Eq. 7.18, or Eq. 7.19, and therefore we obtain Eq. 7.20: Similarly, applying the same analysis to the reaction shown in Eq. 7.14, the result shown in Eq. 7.21 is obtained: Measurement of electrical conductivity as a function of oxygen partial pressure carried out between 500 and 700 °C (von Baumbach and Wagner 1933) indicated that the conductivity of ZnO varied with oxygen partial pressure having exponents between 1/4.5 and 1/5. This result indicates that neither defect mechanism predominates and the actual structure could involve both singly and doubly charged interstitial cations (Kofstad 1972). Similar approaches can be applied to nonstoichiometric compounds with cation vacancies (Cu2−δO‐type oxide), oxygen interstitials (UO2+δ‐type oxide), etc. (Farhi and Petot‐Ervas 1978; Pope and Birks 1977). Intragranular or volume diffusion in crystalline compounds takes place through crystal imperfections and mainly through the movement of point defects. Several types of mechanisms may be considered, as shown schematically in Figure 7.8, but mass transport generally occurs by hopping mechanisms from a well‐defined site of the crystal into another adjacent site. Figure 7.8 Schematic illustration of transport mechanisms in crystalline solids (Sequeira and Santos 2006). Consider a one‐dimensional flux of particles (atoms, ions, point defects, or electrons) in the Ox direction. Let C (x, t) be the defect concentrations (number of particles per unit volume) at the coordinate x and at time t. In a chemical potential gradient and without an electrical potential gradient or other type of driving force, a flux, J, of particles occurs in the Ox direction: where D is the diffusion coefficient of the particle. Under an additional electrical potential gradient, the particle flux would obey the following general equation: where where z is the particle charge number, F the Faraday constant, φ the electrical potential, and ±zF the electrical charge. If the ion movements within one sublattice of the binary compound MaXb produce displacements of ions only in that sublattice, M or X diffusion is termed self‐diffusion, and the self‐diffusion coefficient Dj of component j will obey the following equation: where Cj is the concentration of component j. Let Jδ be the flux of the defect, δ, in the j sublattice at the coordinate x and in the absence of an electric field. The diffusion coefficient Dδ of the defect δ is defined by equation where Cδ is the concentration of the defect δ. As a general rule, the relationship between Dj and Dδ may be written as If Nδ is the mole fraction of defects δ in the j sublattice, we may write This relationship shows that the self‐diffusion of component j is proportional to the mole fraction of defect δ contained in the j sublattice. A comparison of the self‐diffusion coefficients of anions and of cations may allow identification of the component that provides the majority of mass transport within the crystal. Thus, nonstoichiometric oxides such as NiO, FeO, and Cu2O contain metal vacancies; this observation is in agreement with the order of magnitude of the diffusion coefficients, i.e. DM > DO (DM/DO ≈ 102–104). In contrast, in some oxides such as TiO2 that have an oxygen deficit, it has been observed that DO ≈ DTi. This result is not in contradiction with the assumption of several authors who postulate that both oxygen vacancies and titanium interstitials are simultaneously present in this oxide. Electrical transport in ionic compounds does not necessarily occur by means of point defects. Electrical conductivity due to a charge carrier is given by where C is the molar concentration of charge carriers per unit volume and U is the electrical mobility (expressed in m2 s−1 V−1). The mobility U corresponds to the velocity of the charged particles under an electric field equal to unity. In ionic crystals, the total conductivity σt is generally written in terms of ionic and electronic conductivities as Let σδ be the partial conductivity relevant to the defect δ, and considering the definition of the electrical mobility Uδ, we obtain If σj is the contribution to the total conductivity of the charged species j, we can write Since we obtain the Nernst–Einstein equation: In this equation, σj is the ionic contribution of species of type j to the total conductivity, Dj is the self‐diffusion coefficient of particles j, and Cj is the volume concentration of regular sites in the sublattice that contain species j. Since the mobility of electronic defects is much higher than that of point defects (Uε > Uδ), it can be said that the total electrical conductivity is essentially electronic. Also, it is easy to show that the conductivity varies with oxygen pressure in the same way as does the concentration of the predominant ionized defect (although the current is carried by electronic defects). The temperature dependence of the conductivity is determined by both the charge carrier mobility and concentration terms. When ion movements involve jumps between definite sites of the crystal, an energy barrier ΔGm has to be overcome. The defect mobility then increases strongly with temperature according to an exponential law (activated process): where ΔGm is the free energy of migration of the defect. The temperature dependence of electron mobility is a function of the electronic structure of the crystal. The electron movement is an activated process, and the electronic mobility obeys the following equation: where Eε is the overall activation energy for polaron migration in the periodic field within the crystal or, in other words, for polaron (electron and distortion field) scattering by lattice vibrations and/or imperfections, also known as polaron hopping and usually treated as a diffusion process. The determination of the variation of the electronic mobility with temperature may allow us to identify the migration mechanism of electrons in the lattice. Whatever the nature of the charge carrier (ionic or electronic defects), the concentration increases with temperature according to where ΔGf is the free energy of formation of defects. Whatever the nature of the conduction mechanism, the electrical conductivity is proportional to the product of the drift mobility and the charge carrier concentration, which varies exponentially with temperature. The crystal conductivity always increases with increasing temperature due to the exponential increase in the number of charge carriers. This characteristic differentiates covalent/ionic compounds from metallic conductors, which exhibit a decrease of the electrical conductivity with increasing temperature (Kröger 1975; Mrowec 1980; Philibert 1985). As diffusion along line and surface defects, including dislocations, grain boundaries, internal and external surfaces, etc., is generally more rapid than lattice diffusion, they are termed high‐diffusivity or easy diffusion paths. This type of diffusion is often called short‐circuit diffusion. The contribution of grain boundary diffusion to the total diffusion flux decreases as the temperature increases for two main reasons: The effective diffusion coefficient may be defined by the Hart equation: where f is the volume fraction of short‐circuit paths, Dv the lattice diffusion coefficient, and Dgb the short‐circuit diffusion coefficient. Deff may be identified with Dv, the intracrystalline diffusion coefficient, at high temperatures, but at low temperatures, the short‐circuit contribution to diffusion can become significant. In general, in accordance with Tamann’s empirical law, grain boundary diffusion would be expected to dominate at lower temperatures, say, below a transition temperature of between 1/2 and 2/3 of the absolute melting temperature of the crystal. Conversely, the contribution made by short‐circuit diffusion processes will be negligible at higher temperatures. Grain boundary diffusion in growing oxide scales has been reported for NiO (Atkinson et al. 1986), Cr2O3 (Hussey and Graham 1996), Al2O3 (Prescott and Graham 1992), and other product films. Stress generation in the oxide layer and the underlying metal may cause through‐scale cracking, spalling of the oxide, stratification phenomena, or even detachment of the scale. These phenomena lead to loss of protective properties and faster degradation of metals and alloys. The sources of stress may be either internal (scale growth) or external (mechanical and/or thermal stresses). Often, due to mechanical stresses, a porous layer may develop after the oxide scale has reached a critical thickness. The two main sources of stress are growth stresses, which develop during isothermal formation of the scale, and thermal stresses, which arise from differential thermal expansion between the oxide scale and the metal or alloy during temperature changes. Observed stresses depend on the oxidation mechanism and on the physicochemical properties of the alloy and of the oxide. The most important causes of growth stresses are (Béranger et al. 1987) the volume difference between the oxide and the metal (Pilling and Bedworth rule), the oxidation mechanism (for example, internal or external oxidation of alloys), oxygen dissolution in alloys, epitaxial constraints, physicochemical changes in the alloy or scale during the growth, specimen geometry, etc. Two different types of growth stresses can be distinguished: geometrically induced growth stresses caused by the surface curvature of components and the intrinsic growth stresses. As can often be seen in oxidation experiments, the oxide scales crack at the edges of the specimens, initially leading to a locally increased attack at these sites. Such cracking is usually due to geometrically induced growth stresses that arise at edges and corners due to the small surface curvature radius. This situation has been dealt with quantitatively by Manning (1981). With the help of models, the tangential and radial stresses can be calculated for the ideal case of curved surfaces with a constant radius of curvature. Introduction of the oxide displacement vector M is helpful here; M lies perpendicular to the oxide–metal interface and describes the displacement of a reference point in the film resulting from the oxidation. The magnitude and sign of M are incorporated in M, which is calculated as follows: where a is the fraction of oxide formed on the scale surface, (1 − a) is the fraction of oxide formed at the metal–oxide interface, V is the volume fraction of metal consumed in the oxidation by injecting vacancies into the metal, (1 − V) is the volume fraction of metal consumed in the oxidation that originates directly from the metal surface, and PBR is the Pilling–Bedworth ratio (see later in this section). Oxidation leads to an increase in the strain in the circumferential direction (tangential strain where Rs is the radius of curvature of the surface (concave Rs < O, convex Rs > O) and h is the metal recession (increase in oxide film thickness dx = PBR dh). Equation 7.40 allows the tangential stresses The relationship between the signs of the tangential and radial strains and stresses in the scale and at the metal–oxide interface, respectively, are A plus sign indicates tensile stress, and a minus sign means compressive stress. The sign and level of the stresses in the scale depend on its growth direction and on the radius of service curvature, as well as the PBR. The latter was introduced in 1925 in order to explain the formation of growth stresses during oxidation and describes the volume change that is involved in the transition from the metal lattice to the cation lattice of the oxide when only the oxygen anions are diffusing. In other words, the PBR corresponds to the ratio of the volume per metal ion in the oxide to the volume per metal atom in the metal (Fromm 1998): It was argued that if the PBR was less than 1, the growth stresses would be tensile and the oxide would crack and not cover the entire metal surface. As indicated in Table 7.2, alkali and alkaline earth metals belong to this class of materials. On the other hand, if the PBR was higher than 1, compressive stresses would develop and the oxide could be protective, at least during the early stages of oxidation. The majority of metals fall into this category. Table 7.2 Pilling–Bedworth ratios for some metal–oxygen systems We now know that the Pilling–Bedworth rule regarding protective behavior exhibits several exceptions. Important examples are tantalum or niobium where, even though the PBR is substantially larger than unity, cracks develop in the oxide scale after extended exposure and these produce non‐protective conditions. Whereas the Pilling–Bedworth paper (1923) was a significant advance at the time, it is now recognized that the approach was incomplete and that the influence of the difference between the molar volume of metal and oxide depends on the oxide growth mechanism. However, the Pilling–Bedworth approach may be of great help for the assessment of the geometrically induced growth stresses, as shown earlier. In most applications, high temperature alloys are subjected to temperature fluctuations even under nominally isothermal conditions. In this case, though, the resultant stresses in the oxide layer, resulting from the difference in the coefficient of thermal expansion (CTE) of the metal and oxide (see Table 7.3), are small and may be neglected. This will not be the case, however, for large thermal cycles or during cooling to room temperature when large stresses, perhaps of 1 GPa order, are produced in the oxide layer. Metals have, generally, a higher CTE than oxides (Table 7.3), and consequently, tensile stresses are induced in the oxide scale on heating and compressive stresses during cooling. Table 7.3 Linear coefficients of thermal expansion of metals and oxides, 1/°C (Schütze 1997) The thermally induced stresses can be calculated from the CTE according to the following equation (Cathcart 1975): where α is the CTE for the metal and the oxide, E is Young’s modulus for the metal and the oxide, d is the thickness for the metal and the oxide, and υ is Poisson’s ratio. ΔT stands for the temperature change. The CTEs for technical materials can be found in many of the materials producers’ brochures, and those for corrosion products are given in the literature (Schütze 1997). In most cases, the CTEs can be approximated by linear behavior in the temperature range concerned, but in some cases, where phase changes occur in the scale during the temperature change, nonlinear temperature dependence is found for the CTE. This is, for example, the case for several sulfide layers (Schulte and Schütze 1999) and is particularly important for magnetite and some iron‐based spinels (Armilt et al. 1978), affecting stresses in oxide scales on low‐alloy steels. This naturally decisively affects the stress situation in the oxide scales on low‐alloy steels (Christl et al. 1989). In the temperature range between about 600 and 450 °C, the magnetite partial layer is under tensile stress when cooling from 600 °C. At lower temperatures, this oxide partial layer may come under compressive stresses, depending on the metallic substrate and its CTE. In the hematite layer, the stresses are always compressive, as the CTE always lies below that of the low‐alloy steel (the exception is 9% chromium steel at temperatures below 150 °C). Growth stresses and thermal stresses may be relieved through various mechanisms that could operate simultaneously: When plastic deformation is not sufficient for stress relief, cracking may develop in the scale. It is the more efficient relaxation mechanism but will result in a sudden increase in corrosion rate. The metal oxidation may exhibit repeated regular sequences of cracking and healing of the scale. Under tensile stresses (heating to temperatures higher than the oxidation temperature or over convex regions of a nonplanar surface), cracks appear as soon as the elastic fracture strain is reached. This critical value will be significantly less than 1% even at high temperatures. Under compressive stresses, the degradation leads to spallation and the mechanisms are more complex. Two processes are necessary to produce spalling: transverse cracking through the oxide and decohesion along the metal–oxide interface. Two routes of spallation have been identified: the case corresponding to a low cohesive strength of the oxide and a high adhesive strength of the scale on the substrate surface (route 1: cracking of the oxide before decohesion) and the case corresponding to a high cohesive strength of the oxide and poor adhesion of the oxide to the metal (route 2: decohesion before metal cracking). Figure 7.9 illustrates these two distinct mechanisms. Figure 7.9 Cracking and spallation by compressive oxide stresses (Evans 1995). The overall oxidation reaction of a metal M may be written as shown in Eq. (6.41) (Section 6.8). The reaction can proceed only if diffusion of matter (oxygen or metal) occurs through the solid scale MaOb. If the scale is porous, mass transport occurs by oxygen diffusion; if the scale is compact, mass transport occurs by means of solid‐state diffusion. In the latter case, the oxidation mechanism consists of at least four steps (Barret 1975; Mrowec and Stoklosa 1971; Yang et al. 1998): Of course, mass transport by migration of ionized point defects is accompanied by simultaneous electrical transport, which complicates the process. In this section, the kinetics of the oxidation process leading to the growth of a compact scale are analyzed. Let a chemical elementary step be a local reversible reaction that occurs without the formation of a distinct intermediate product, i.e. the reaction proceeds in a single step, and let an interphase elementary step be a chemical process involving matter exchange between two distinct phases. The main difficulty encountered for the formulation of these steps relates to the conditions required for the application of classical theories (Eyring theory) for the calculation of the step rates (Glasstone et al. 1941). We will have to choose, for the adsorbed phase as well as for the oxide, structural models that exhibit ideal behavior for the reacting species in their own phase. Moreover, we will assume that the theory of absolute rates can, under these conditions, be extended to heterogeneous elementary steps involving matter exchange between two different phases. On a solid surface, the atomic environment is modified in comparison with that in the bulk. The resulting imbalance of the forces in the surface of solids produces attractive forces for gas molecules or atoms. The phenomenon of adsorption can then produce an excess of gas atoms or molecules on the surface compared with the concentration in the adjacent gas phase. For adsorption to occur spontaneously, the process must produce a decrease in free energy, but since that is also a decrease in system entropy, adsorption is always an exothermic process. Consequently, the amount of adsorbed gas at equilibrium at constant pressure (the adsorption isobar) decreases with increasing temperature. Depending on the nature of the forces involved, adsorption processes may be classified as physical adsorption (also termed van der Waals adsorption or physisorption) or chemical adsorption, usually abbreviated to chemisorption (Brunauer et al. 1938; Langmuir 1918). Physisorption is generally quasi‐instantaneous, while chemisorption often proceeds slowly, involving an activation energy Ea. Thus, the chemical adsorption rate becomes appreciable only at sufficiently high temperature. Many theories and models have been proposed to explain the shape of adsorption isotherms that represent the variation of adsorbed volume as a function of gas pressure or of the p/p0 ratio (p0 is the saturation vapor pressure at the experimental temperature). The description of monolayer adsorption can be made using as variable the fraction of the available adsorption sites that are occupied by adsorbed atoms or molecules, θ = s/s0, where s0 is the number of adsorption sites that are initially available per unit surface area and s the number of occupied surface sites per surface area unit (thus, θ is the fraction of occupied sites). Chemisorption involves partial electronic transfer between adsorbed molecules and the substrate. The solid surface appears inhomogeneous and exhibits specific “active” sites on which chemisorption takes place preferentially. When temperature is increased, the amount of adsorbed gas by chemisorption increases because it is an activated process; then the adsorption isobar passes through a maximum because chemisorption is an exothermic process. Since the establishment of high temperature oxidation requires at least the presence of one monolayer on the surface, it can be assumed that a chemisorbed phase is produced as a surface step. In this discussion, this adsorbed phase is considered as a two‐dimensional solution (i.e. sorption of a monolayer) of free surface sites, s, and of occupied sites, leading to the formation of a superficial compound referred to as O‐s (atomically chemisorbed oxygen) where O is a particle of the gas phase (O2). Such a solution may be considered as ideal since it is assumed that no interaction occurs between the free and occupied sites. The sorption process may then be described by an equation representing the balance between two opposite reactions with rate constants with Under these conditions, if p denotes the partial pressure of the indicating that the sorption is governed by the Langmuir equation (dissociation occurs on chemisorption, which is likely at high temperature). If dnO‐s is the number of O‐s particles formed by adsorption per unit area during the time dt, the rate of the sorption process can be given by the equations or with The proposed model to account for the external and internal steps uses the concept of point defects, and, for simplicity, it can be assumed that only one defect is predominant in the lattice, that is, either the metal vacancy Then, in the case of an n‐type semiconductor with metal vacancies, the external step can be described by with Under equilibrium conditions, for a given value of θ, we have with Again for a p‐type semiconductor with metal vacancies, we have for the internal step with In a thick, growing oxide scale, a positive space charge can appear in contact with the metal balanced by a negative space charge localized near the external interphase. This charge distribution induces, at any point within the scale, an electric field that both accelerates the positively charged ionic defects and slows down the negatively charged electronic defects until no net electrical current flows through the scale. Consequently, stationary concentration profiles are established in the MO scale, the electrically neutral zone extending over practically all of the scale thickness (Wagner 1933a,b). Taking into account the possible electrical potential gradient through the scale, the particle fluxes are given by In these expressions, Cδ (Cε) is the volume concentration of point (electronic) defects with z degree of ionization, Dδ (Dε) is the diffusion coefficient, Uδ (Uε) is the electric mobility of these charge carriers, and φ is the electric potential at the coordinate x. Cδ and [δ] are linked by the relationship Cδ = [δ]/Ω, Ω being the volume of one mole of oxide. A positive sign (+) has to be used if the defects are positively charged and a negative sign (−) for negatively charged defects. A brief kinetic analysis of the four elementary steps for reaction (6.41) has been presented in this section. The rate expressions of the elementary steps were expressed in a form involving the deviation from equilibrium, i.e. within the framework of the thermodynamics of irreversible processes. The general system of equations relating to the growth of an oxide scale MO can then be established by expressing the mass balance at both sides of each interphase in the adsorbed phase and within the scale. These equations being differential cannot be solved analytically. However, it is possible to make the simplifying assumption that the concentrations tend to become time independent, i.e. a quasi‐steady state develops. On this basis, the system of differential equations allowing calculation of the reaction rate can be solved analytically, leading to considerable simplifications. It should be recalled that if one of the rate constants or the diffusion coefficient has a finite value, all the other constants having very large values, we deal with what is called a pure regime (Gesmundo and Viani 1981; Graham et al. 1972). In all other cases, it is called a mixed regime (Deal and Grove 1965; Pettit and Wagner 1964). Hereinafter, we describe pure diffusional regimes. Assuming that cationic transport across the growing oxide layer controls the rate of scaling and that thermodynamic equilibrium is established at each interphase, the outward cation flux, where y is the oxide thickness, Since there is thermodynamic equilibrium at each interphase, the volume of where Integrating and noting that y = 0 at t = 0, we obtain which is the common parabolic rate law. Furthermore, since it has been shown that the cation vacancy concentration is related to the oxygen partial pressure by the equation the variation of the parabolic rate constant with oxygen partial pressure can be predicted by and since Clearly, the concentration gradient in the scale never equals zero, and, therefore, scale growth never stops. Originally, Eq. 7.63 was derived by Wagner in a theoretical detailed analysis of the electrochemical potential situation and the transport conditions in the scale. Figure 7.10 gives a summary of the conditions for which the theory is valid. Figure 7.10 Diagram of scale forming according to Wagner’s model (Birks et al. 2006). Assumptions are as follows: This model led to the final equation of the parabolic rate constant, which is (Kofstad 1988; Wagner 1975) where The parabolic rate law that was derived for thickness growth can also be modified for weight gain by oxidation. In this case, Values of ∫z are given in Table 7.4 for several oxides. These values are, however, based on the assumption that the scale is free of pores and cavities and consists of only one phase. Under practical conditions, this is not usually the case, and therefore these values should only be used as estimations. Table 7.4 Calculation factor ∫z for the conversion of mass gain data into scale thickness data using Eq. 7.68 for several oxides and sulfides (Rahmel and Schwenk 1977) The oxidation rate constant Kp is the most important parameter for describing oxidation resistance. If Kp is low, the overall oxidation rate is low and metal consumption occurs at a very low rate. This is typical for protective oxidation. If Kp is high, metal consumption occurs at a high rate and the case of non‐protective oxidation exists. From Kp the metal consumption rate can also be calculated (Heitz et al. 1992). This requires knowledge of the stoichiometry of the oxide and the specific weight values, as well as the molar weights of the reactants. Then the metal consumption can be calculated. The real value of Wagner’s analysis lies in providing a complete mechanistic understanding of the process of high temperature oxidation under the conditions set out. The predictions of Wagner’s theory for n‐type and p‐type oxides have been extensively examined by several workers (Heitz et al. 1992; Mrowec and Przybylski 1977a, b; Sarrazin and Besson 1973). For many systems, the obtained rate constants are generally several orders of magnitude larger than those that one would calculate from lattice diffusion data from Eq. 7.67. This discrepancy indicates that “short‐circuit transport” is contributing to growth of the oxide film. Lattice diffusion is the dominant process of mass transport at high temperature, provided there is a sufficiently high defect concentration, but mass transport can also occur along dislocations or grain boundaries. Thus, the overall transport in polycrystalline oxide scales generally results from two fluxes of matter in parallel: an intragranular flux JV and a flux along grain boundaries Jgb. The oxidation rate may be expressed as a function of the effective diffusion coefficient defined by Eq. 7.38 (see Section 7.4.1). The scale growth rate obeys the differential equation where ΔC is the defect concentration difference through the oxide scale and Ω the molar volume of the oxide. Integration of Eq. 7.69 leads to where Assuming that the oxide is dense and pure and the grains are spherical, the following rate equation can be obtained (Caplan et al. 1972; Graham et al. 1972; Khoi et al. 1975): where R0 is the initial grain radius and K is a constant, which is a function of, among others, the surface energy of grain boundaries and their thickness and of the diffusion coefficient of matter across the grain boundaries. Further numerical development of this simple model has allowed a grain size distribution, different grain boundary widths, or different laws of grain growth to be taken into consideration. The formation of several corrosion scales on metals or alloys is often observed. In order to understand clearly the growth mechanisms of these scales, it is of major importance to know whether they form concurrently or sequentially. The theory of multilayered scale growth on pure metals has been treated by Yurek et al. (1974). The hypothetical system treated is shown in Figure 7.11. It is assumed that the growth of both scales is diffusion controlled with the outward migration of cations large relative to the inward migration of anions. The flux of cations in each oxide is assumed to be independent of distance. Each oxide exhibits predominantly electronic conductivity, and local equilibrium exists at the phase boundaries. The total oxidation reaction is Figure 7.11 Schematic diagram of hypothetical two‐layered scale. The cation vacancies are assumed to be neutral. The cation flux in subscale (1) is and the amounts, Q, of metal consumed per unit area to form layers (1) and (2) are, respectively, The fractions of the cation flux involved in the growth of subscales (1) and (2) are, respectively. with With this model, it is not possible to express simply the ratio of the thickness of both subscales. However, the ratio of parabolic rate constants can be obtained as When one of the layers is much larger than the other, this expression simplifies to for example, if y2 ≪ y1. It appears that this ratio is directly proportional to the ratio of parabolic rate constants for the growth of each layer alone, i.e. roughly proportional to the ratio of the self‐diffusion coefficients of the mobile species. This theory has been shown by Garnaud (1977) to describe the growth of CuO and Cu2O on Cu, by Garnaud and Rapp (1977) to describe the growth of Fe3O4 and FeO on Fe, and by Hsu and Yurek (1982) to describe the growth of Co3O4 and CoO on Co. Generally, experience shows that the oxidation of a metal is often protective during the early stages but that the protective properties of the scale can be partially or totally lost during later stages. For example, according to the Haycock–Loriers model (Haycock 1959; Loriers 1950), the oxidation process involves the concurrent growth of an inner compact layer of MO, controlled by a diffusion mechanism, and its progressive transformation at its outer interface into an external porous layer MO′. The rate of growth of the inner compact layer controlled by diffusional transport is given by where Δm1 is the mass of oxygen in the compact scale, Kp is the parabolic rate constant for growth of the layer, and K1 is the rate constant for its transformation. The growth rate of the outer porous layer controlled by the reaction at its interface with the inner compact layer is given by where f is the ratio of the oxygen content in the oxide MO′ to that in the oxide MO. If the scale consists of two layers of the same oxide, f = 1, and the weight gain Δm is given by the rate equation where the rate constant K1 is characteristic of a transformation in the solid state that does not depend on the oxygen pressure. The function Δm = Δm1 + Δm2 = F(t) can be approximated by the equation which describes paralinear oxidation for which parabolic kinetics predominate during the early stages of oxidation becoming linear at longer times. This is illustrated in Figure 7.12. Paralinear oxidation is observed during the oxidation of a wide range of metals, especially if mechanical damage occurs to the scale during thermal cycling (Chang et al. 1990; Rapp and Colson 1966). This is more likely to be the case if the CTE of the oxide is much less or greater than unity. The simultaneous oxidation and evaporation leads to the formation of porous and partially porous scales (Tedmon 1966). Figure 7.12 Schematic representation of total weight gain Δm illustrating paralinear rate equation. Several metals, particularly in columns IV and V (Ti, Zr, Nb, Ta) of the periodic table, form stratified scales during their oxidation at high temperatures as a result of periodic cracking of the growing oxide. From a kinetic point of view, such cracking leads to two types of rate laws (Figure 7.13): the first one is described by successive parabolic or cubic periods (type 1), and the second one by an initial parabolic or cubic period followed by a near‐linear period. Figure 7.13 Schematic rate laws associated with formation of stratified scales. Examination of the scale formed on such specimens, either on fractured or polished cross sections, shows that for both type 1 and type 2 rate laws, Mass transport through the oxide occurs by oxygen, mainly by vacancies V0 (diffusing from the internal to the external interface). Since the scale grows in a confined space at the internal interface, the increase in volume on oxide formation, associated with a PBR greater than unity, may generate large compressive stresses in the oxide (several gigapascals have been measured). The metal is concurrently submitted to tensile stresses of smaller magnitude (several tens of megapascals) due to its larger thickness. The high compressive stresses in the oxide are probably responsible for the observed tendency for the kinetics to approach a cubic rate law due to an associated reduction in the oxygen diffusion flux. In all cases, oxygen pressure has no influence on the rate constants. As oxide thickness increases, compressive stresses may also increase and result in localized spallation and/or cracking (Stringer 1960a, b). Then, free access of the gas to a bare metal surface occurs and reoxidation results. Two cases can be envisaged. In the first, the bare metal is unchanged compared with that at the beginning of oxidation, in terms of composition, microstructure, or mechanical properties. Reoxidation occurs exactly as in the initial period, and the rate law is the exact repetition of the first pre‐transition curve. Kinetics of type 1 (Figure 7.13) are then observed with a succession of parabolic‐type periods. In the second example, the bare metal differs from the initial state, for example, dissolution of oxygen may have occurred, leading to increased hardness and lower creep relaxation rates. The second oxide layer that forms does not then reach the thickness of the first since stress increases at a higher rate and early separation occurs from the metal. In the case of TiO2 growth on titanium at 850 °C, for example, the second and all subsequent layers have a thickness of 1–2 µm, whereas the first attains 10–15 μm. The spallation or cracking of these scales does not occur at the same time for all locations on the specimen surface, and the resulting law is approximately linear with an increased rate compared with that in the pre‐transition period. The system can be described as a metal covered by an oxide of statistically constant thickness (Munir and Cubicciotti 1983; Newcomb and Bennett 1993). The oxidation of alloys and other metallic materials is a complex process consisting of a large number of phenomena that may, themselves, depend on material composition and environment, i.e. temperature, mechanical stress, gas composition, etc. To obtain effective protection of a metallic material, the oxide formed must lead to a continuous scale (external oxidation) and not to precipitates within the alloy (internal oxidation). Although numerous studies have been devoted to oxidation of alloys, the oxidation mechanisms are often still not fully understood. In fact, the models have usually been developed for the oxidation of the relatively simple example of pure metals and are inadequate to describe alloy oxidation. In order to do this, additional factors have to be taken into account, e.g. the different affinity for oxygen of each of the alloy’s constituents, dissolution of oxygen into the alloy, solid solubility between the oxides formed, formation of complex oxides, different mobilities of the various metal ions in the oxide phases, etc. Moreover, alloy oxidation involves complex processes for which the equilibrium state is reached very slowly or may never be reached. It is unrealistic to try to classify all the various types of alloy oxidation using simple criteria. However, several classification systems have been proposed (Bénard 1962; Gesmundo and Niu 1998) to account for the diverse morphologies of oxidation scales. They use thermodynamic diagrams and kinetic considerations, and, for simplicity, we can consider that three methods are available to protect metals and alloys from high temperature oxidation: (i) control of the atmosphere, (ii) alloying addition of species more easily oxidized than the base metal (chromium, aluminum) and which form a protective scale during oxidation, and (iii) use of protective coatings deposited by various methods (cementation, plasma spraying, ion bombardment, etc.). Some considerations of these three approaches are presented in the following paragraphs. When a process is considered for use in industry, it must be effective, reliable, and economical. For most applications these requirements rule out systems based on high vacuum, and the general practice is to use atmospheres derived from fuels. The gases used are therefore mixtures of N2, CO, CO2, H2, H2O, and CH4, which make up the products of combustion of fuels. More recently, atmospheres based on nitrogen have been increasingly used. Starting from the fuel and air, various types of atmospheres can be produced. The main, or common, differentiation is between “exothermic” and “endothermic” atmospheres. The nomenclature is ambiguous and it is as well to be clear about its meaning. An exothermic atmosphere is produced exothermically by burning the fuel with measured amounts of air. This type of atmosphere has the highest oxygen potential. An endothermic atmosphere is produced by heating, by external means, a mixture of fuel gas with air over a catalyst to provide a gas containing reducing species. This atmosphere has a low oxygen potential, and heat is absorbed during its preparation; hence the atmosphere is described as endothermic. A glance at the analysis of dried, stripped, exothermic atmospheres will confirm that they are predominantly pure nitrogen. Basically, the fuel has been used to remove oxygen from the air. The economics of using nitrogen as a controlled‐atmosphere source become more attractive when such factors as safety, reliability, and productivity are considered. Furthermore, the present tendency is to move away from oil toward electricity, in which case nitrogen atmospheres will be particularly attractive. Modern techniques are currently available using carburizing and nitriding systems under vacuum. In these processes of vacuum carburizing and plasma carburizing, the components are heated under vacuum to around 950 °C. Methane is leaked into the chamber to a pressure of between 3 and 30 mbar to add carbon to the system. In the absence of a plasma, the methane will only decompose to the extent of about 3%, probably on the surface of the components according to a sequence such as that shown in the following equation: These reactions may be stimulated to provide 80% decomposition by using a plasma process to excite the methane molecule. In this case, the molecular breakdown may occur in the plasma to produce charged species. Hydrocarbons other than methane may be used as the feedstock. The usual operating sequence involves flushing and evacuation, heating to a temperature under the inert atmosphere, and carburizing for a predetermined time followed by a diffusion anneal in a carbon‐free atmosphere. This cycle is designed to provide optimum surface carbon content and carburized depth (Birks et al. 2006; Fromm 1998; Grabke and Meadowcroft 1995). The main application of controlled atmospheres is in the area of heat treatment of finished machined components or of articles of complex shape, which cannot easily be treated subsequently for the removal of surface damage. In this context, the atmosphere is controlled for one of two reasons: to prevent surface reaction or to cause a surface reaction, such as carburizing or nitriding. Prevention or control of oxide layer formation is primarily a matter of controlling the oxygen partial pressure of the atmosphere at a value low enough to prevent oxidation, as described in Section 7.2.1. For a metal that undergoes oxidation according to the reaction shown in Eq. 7.2 (Section 7.3), where MO is the lowest oxide of M, the oxygen partial pressure must be controlled so as not to exceed a value where ΔG° is the standard free energy of reaction 7.2. Unfortunately, For alloys, the most critical reaction must be considered when deciding on the composition of the atmosphere to be used. For this purpose, the activities of the alloy components must be known since, if the metal M in Eq. 7.2 exists at an activity aM, the corresponding equilibrium oxygen partial pressure will be given by If the metal activities in the alloy are not known, then, by assuming the solution to be ideal, mole fractions may be used instead of activities to give a value of the oxygen partial pressure at which experiments must be performed to establish the correct atmosphere composition. Low oxygen partial pressures can be provided and, more importantly, controlled by using “redox” gas mixtures. These mixtures consist of an oxidized and a reduced species, which equilibrate with oxygen, e.g. from which Thus, from Eq. 7.87, the ratio of carbon dioxide to carbon monoxide may be calculated for any oxygen partial pressure and temperature. Further discussion of protective atmospheres can be found in references by Jansson and Foroulis (1973) and Kofstad (1966, 1988). For engineering applications, metals are strengthened and their environmental resistance improved by appropriate alloying. The basic mechanisms operating in pure metal oxidation are also operative in the oxidation of alloys with added complications. These complications include the formation of multiple oxides, mixed oxides, internal oxides, and diffusion interactions within the metals. The effect of alloying on oxidation behavior can be understood first by considering binary and ternary alloy systems, upon which so many commercial high temperature materials are based. Alloy components have different affinities for oxygen and do not diffuse at the same rate in the oxide or the alloy. Consequently, the simple kinetic rate equations are often not followed, and the scale and the alloy compositions change in a complex way with time. The second component may enter the scale, affecting its lattice defect structure, or may accumulate as metal or as oxide beneath the main scale. Also, if oxygen diffuses into the alloy in atomic form, precipitation of the oxide of the less noble metal may occur as internal oxide. When it is considered that scales can crack, contain voids, spall, sinter, and give multiple layers of irregular thickness, it is clear that the general situation is complex. It is important to attempt to break alloy oxidation down into certain limiting cases, applicable specifically to binary alloys but in a more general way to commercial alloys, which can be treated quantitatively or at least semiquantitatively. Thermodynamics, usually in the form of ternary equilibrium diagrams involving two alloying components and oxygen (or sulfur, etc.), are useful in predicting the alloying element likely to be preferentially oxidized and sometimes the likely steady‐state scale. They can also provide information on subsequent reactions, such as the changes occurring when internal oxide is incorporated into the main scale. The application of thermodynamic concepts is exemplified here for a binary alloy AB, based on metal A, which is less reactive than the alloying element B. The oxides formed will be referred to as AOa and BOb. Let AB be an alloy for which, at temperature T, A and B form an ideal solid solution but two immiscible oxides, AOa and BOb. Let For a binary alloy AB in which NB is the mole fraction of the solute B, the equilibrium oxygen pressure obeys the following relationship: The variation of the oxygen pressure of the alloy composition, at a given temperature, is plotted in Figure 7.14 (curve (1)) (Gesmundo and Niu 1998). Likewise, the variation of the oxygen pressure of the following equilibrium ( Figure 7.14 Diagram of condensed phases in the case of the oxidation of a binary alloy for which solute B is much more reactive with oxygen than component A, i.e. obeys the equation The corresponding variation of the oxygen pressure with the alloy composition is also drawn in Figure 7.14 (curve (2)). The point of intersection between curves (1) and (2) (point E in Figure 7.14) corresponds to equilibrium between both oxides AOa, BOb and the alloy (at an equilibrium pressure termed Pt). The mole fraction Figure 7.14 was drawn assuming that the solute B is much more reactive with oxygen than the base component A. In that case, It is necessary to plot the diagrams of condensed phases to check the compatibility of the proposed models with the experimental results. When an alloy is oxidized, the oxides of the components may be completely miscible, producing an oxide solid solution, or they may be completely or partly immiscible, producing multiphase scales. In the case of partially or completely immiscible oxides, a crude categorization for a range of alloys AB, in which A is the more noble metal and B the less noble metal, is as follows: In composition ranges (1) and (3), it is often possible to get doping of the major oxides. For example, if AO is produced almost exclusively, small concentrations of B may dissolve in the oxide, even if B is of a different valency to A and BO of different crystallographic type to AO, thereby changing its defect structure and growth rate. Furthermore, in the intermediate composition range, AO and BO may combine to give partial or complete layers of a more complex oxide compound. There are two distinct possibilities of binary alloy oxidation. Initially, the special case of the exclusive oxidation of one alloy component is considered before procedure to the more general case where both components oxidize (Figure 7.15). Group I Only one of the following elements oxidizes under the prevailing conditions, giving BO. Group II Both alloying elements oxidize simultaneously to give AO and BO, the oxygen pressure in the atmosphere being greater than the equilibrium dissociation pressures of both oxides. Figure 7.15 Schematic representation of modes of oxidation of alloy AB of variable composition, where B is the less noble metal. (a) Minor element B only oxidizes, giving internal oxide BO in a matrix of A. (b) Minor element B only oxidizes, giving external oxide BO above alloy depleted in B. (c) Major element B only oxidizes giving particles of A in a matrix of BO. (d) Major element B only oxidizes, giving external oxide BO above alloy depleted in B. (e) A and B oxidize to give single solid solution or compound of variable composition, (A, B)O. (f) A and B oxidize to give compound ABO2 dispersed in a matrix of AO. (g) A and minor component B oxidize to give insoluble oxides, with BO in a matrix of AO. (h) A and major component B oxidize to give insoluble oxides, with AO in a matrix of BO. It is therefore apparent that there is not, and never can be, a single comprehensive theory of alloy oxidation. Rather, there is a sequence of special cases. Furthermore, it must be recognized that in certain alloy systems several classifications of behavior are possible, depending on the composition and oxidation atmosphere, temperature, pressure, time, etc. Changes from one type of behavior to another may occur on a single specimen. The case of alloys AB, such as Ag–In or Ag–Si, in which only one of the components can be oxidized at elevated temperature, is considered first. The component B on the alloy surface produces nuclei of BO in a matrix of A. If B can diffuse up to the alloy surface sufficiently rapidly, a complete surface layer of BO is produced, but if this condition is not met, atomic oxygen diffuses into the alloy, precipitating BO internal oxide particles at appropriate locations. So, the formation of BO internally or externally depends on the balance between the outward flux of B and the inward flux of oxygen in the alloy. The process of internal oxidation occurs in the following manner. Oxygen dissolves in the base metal (either at the external surface of the specimen or at the alloy–scale interface if an external scale is present) and diffuses inward through the metal matrix containing previously precipitated oxide particles. The critical activity product, aBaO, for the nucleation of precipitates is established at a reaction front (parallel to the specimen surface) by the inward‐diffusing oxygen and the outward diffusion of solute (reaction B + O = BO). Nucleation of the oxide precipitate occurs, and a given precipitate grows until the reaction front moves forward and depletes the supply of solute B arriving at the precipitate. Subsequent precipitate growth occurs only by capillarity‐driven coarsening (Ostwald ripening). In summary, the main conditions that favor internal oxidation are as follows: In this model of internal oxidation and under steady‐state conditions, with a stable BO oxide formed, the number of moles of element B that react under unit area of the specimen surface is equal to the number of moles of diffusing oxygen: where which shows that the depth of oxidation zone at a given time is inversely proportional to the square root of the concentration of element B in the alloy. The penetration rate of the oxidation zone decreases with increasing concentration of element B and decreasing oxygen concentration, Wagner has proposed a criterion based on the comparison of both the diffusion coefficients and the equilibrium concentrations of B and O in the alloy. For an oxide BO the criterion is expressed, in a simplified form, as the ratio between the depths of the B‐depleted zone (external oxidation) and the internally oxidized zone: γ > 1 leads to external oxidation, whereas internal oxidation occurs when γ < 1. The transition is the basis for the design of alloys based on iron, nickel, and cobalt and containing elements such as Cr, Al, and Si, which give highly stable oxides, e.g. Cr2O3, Al2O3, and SiO2. With a sufficiently high content of alloying component, a complete external scale of oxide is formed, which protects the alloy from further oxidation. It should be pointed out that with alloying concentrations around the critical value, mechanical damage of the protective scale may result in transient non‐protective oxidation of the solute‐depleted zone. The process described above in which a solute oxidizes preferentially to the parent element and forms a continuous layer on the surface is referred to as selective oxidation. The selective oxidation of elements that form a slowly growing protective layer is the basis for the oxidation protection of all alloys and coatings used at high temperature. The only elements that consistently result in protective scales are Cr (chromia scale), Al (alumina scale), and Si (silica scale). However, SiO2 is not stable at low pressures. It decomposes to gaseous species such as SiO. It also reacts with water vapor at high temperatures, forming Si(OH)4 gas. The use of Cr2O3 scale‐forming alloys as well as Al2O3 scale‐forming alloys requires a further analysis. There are three composition (in weight %) regimes, with distinct oxidation characteristics for each family of Ni–Cr forming a chromia scale: The oxidation of Fe–Cr and Co–Cr alloys is similar to the Ni–Cr oxidation, leading to chromia scales, apart from Fe2O3, Fe3O4, and other oxides (Gesmundo and Viani 1986; Wood and Chattopadhyay 1970; Wood and Stott 1987; Wood et al. 1970). There are also three composition regimes, with distinct oxidation characteristics for each family of Ni–Cr forming an alumina scale: The oxidation of Fe–Al, Fe–Cr–Al, Ni–Cr–Al–Y, Co–Cr–Al–Y, and Fe–Cr–Al–Y alloys is similar to the Ni–Al oxidation, leading to alumina scales, apart from other Fe2O3, Fe3O4, Y2O3, and other oxides (Pint and Hobbs 1994; Pint et al. 1997; Westbrook and Fleischer 1994). Alumina, Al2O3, exhibits a very low deviation from stoichiometry, much lower than chromia, Cr2O3, therefore ensuring more protective behavior (Table 7.5). Table 7.5 A comparison of the deviation from stoichiometry, self‐diffusion coefficients, and parabolic rate constants for the growth of alumina and chromia scales The addition of Cr to Ni–Al alloys results in a remarkable synergistic effect that is of great technological interest. For example, chromium additions of about 10 wt% can enable external Al2O3 formation on alloys having aluminum levels as low as 5 wt%. This phenomenon has allowed the design of more ductile alloys and coatings. The oxidation resistance of high temperature materials is so dependent on the formation of a chromia or alumina layer that it seems appropriate to further discuss the characteristics of these protective oxides. Cr2O3 has the corundum crystal structure (Figure 7.16) consisting of a hexagonal lattice, close packed with oxygen anions with 2/3 of the octahedral holes occupied by Cr. It is the only relevant oxide stable at high temperatures and is protective against both corrosion and oxidation at elevated temperatures. The Cr(III) oxide is an intrinsic semiconductor above 1250 °C that, depending on the temperature, can be p‐ or n‐type. Figure 7.16 Crystal structure of Cr2O3 – the bigger atoms are Cr3+ and the smaller are O2−. Lillerud and Kofstad (1980) showed that the oxide has an equal concentration of holes and electrons at temperatures above 1000 °C, depending on the oxygen partial pressure, whereas at lower temperature chromia is p‐type or n‐type (at low partial pressures). Cr2O3 is cation deficient, and it increases at a(O2)1/8 rate (Stott 1987). Cr interstitials are the predominant ionic defect at low Aluminum oxide exists in various modifications, depending on the temperature and the exposure time. These phases (γ‐Al2O3, θ‐Al2O3, and δ‐Al2O3) are mostly metastable and are called transition oxides, as they are all transformed to the stable α‐alumina after prolonged exposure. α‐Al2O3 is also known as corundum, as its crystal structure is corundum, such as chromia (Figure 7.16). In this case, the Cr ions are replaced by Al cations located in octahedrally coordinated interstitial sites in the anion sublattice and fill 2/3 of the interstices in order to maintain electrical neutrality. The resistance of materials at high temperature is defined by the diffusion of the species through the oxide as the kinetics depends on the mobility of the ions. It has been shown that alumina grows from both outward diffusion of Al3+ and inward diffusion of oxygen with a similar diffusion rate. The protection given by α‐Al2O3 scales at high temperatures is due to the low concentrations and mobility of ionic and electronic defects. The concentrations of intrinsic point defects are probably so low that all reported properties relating to point defects and transport have been dominated by impurity dopants. It is believed that ionic defects are the major species, with electrons and holes as minorities. The concentrations of all defects depend on doping and oxygen pressure, but the nature of the dominant native ionic defects is not well established (Kröger 1981). The diffusion of aluminum occurs through bulk lattice and oxide at the grain boundaries, which represents the major short‐circuit path (Reddy et al. 1982), whereas the oxygen diffusion in the scale is less prominent. The scale formed has a dual morphology, whereby the outer region usually consists of small and equiaxed grains, while the grains are columnar and coarser in the inner region (Felton and Pettit 1976; Smialek 1978). The scale morphology changes with temperature: at 900 °C whiskers are observed on the grown oxide at the oxide–gas interface extending from the substrate surface, which may be due to the formation of the unstable θ‐Al2O3, whereas an almost flat layer (α‐Al2O3) is observed at 1200 °C (Prescott and Graham 1992). The scale growth mechanisms depend strongly on the exposure temperature. One of the major concerns for protective oxides at high temperatures is their adhesion to the alloy. The adhesion is mostly lost due to stresses induced during scale growth. Generally, the thermal expansion between metal and oxide is large enough to cause compressive stresses (Hindam and Whittle 1983) at room temperature, causing an interfacial shear stress and subsequent scale buckling (Hindam and Whittle 1982; Sadique et al. 2000). In the case of chromia, the addition of reactive elements (≤0.01%) improves the oxidation behavior and scale adhesion of alumina (Anderson et al. 1985). The effects of rare earth elements on the oxidation resistance at high temperature are various. Reactive elements react with sulfur and form stable sulfide (Smeggil 1987), and sulfur tends to weaken the surface (Sigler 1988). They also promote faster formation of alumina. From the above considerations, it is clear that native and doped ionic defects in compact and multilayered scales represent important factors controlling the oxidation rate of binary and multicomponent alloys at high temperature. In particular, there is now evidence that doping is the most likely rate‐controlling factor in many complex oxidation processes. Therefore, a short reference is now given to doping and the Wagner–Hauffe rules. The various types of defects in oxides have been well described by Kofstad (1966) and neglecting rare oxides; it can be said that the commonly found nonstoichiometric, semiconducting oxides are normally divided into two general classes: In actuality, the defect structures are often more complex, the oxides containing several types of defects, sometimes linked with impurities. When a foreign on or dopant is added to a nonstoichiometric oxide, electroneutrality must be maintained by a redistribution of electronic and ionic defects. For example, with a metal‐deficient p‐type oxide like NiO, addition of trivalent ions such as Cr3+ increases the concentration or activity of cation vacancies but decreases the concentration of electron holes. Since transport of cations through the cation vacancies is rate determining in scale growth, there is an observed increase in oxidation rate. Additions of monovalent ions such as Li+ have the reverse effect and reduce the oxidation rate. Comparable rules would apply to oxygen‐excess p‐type semiconductors. For n‐type oxides of either type, additions of cations of a higher valency than those of the parent oxide decrease the respective concentrations or activities of anion vacancies or cation interstitials, thereby generally reducing the oxidation rate. Lower valency additions increase the oxidation rate. Addition of ions of the same valency should have little effect at such low levels. The Wagner–Hauffe rules should, in principle, apply to individual matrix and precipitate phases in multiphase oxides as well as to single‐phase oxides, as long as blocking effects of precipitates and certain other general rules regarding the nature of the solution of the dissolving ions are obeyed. The overoptimistic application of the rules has led to disappointment in their lack of generality, but closer scrutiny often shows that obedience could not reasonably be expected in real oxidation situations. For the rules to be obeyed, the true defect structure of the parent oxide must be fully understood (many oxides really contain several defects, possibly in association), the foreign cations are assumed to enter normal cation positions in the parent oxide at their anticipated valency, and a Wagner‐type parabolic growth relationship must hold rather than a mechanism involving, say, grain boundary diffusion. Ions often have only limited solubility in the parent oxide, so the rules would not necessarily hold progressively at high addition levels. The ionic radius is a pertinent parameter in such considerations. In ideal cases, it is assumed that the dopant is homogeneously distributed through the scale, i.e. the parent and dopant oxidize at the same rate, and the rates of diffusion of the two cations in the scale are equal. In practice this probably rarely, if ever, occurs, and, except in special circumstances, concentrations of ions at the alloy–oxide and oxide–oxygen interfaces may change with time. Recently several cases of obedience and disobedience to the rules are being summarized. Recent examples that were once considered classical cases of such doping, including the increase in oxidation rate of nickel and cobalt by additions of chromium, are now known to be much more complex. The increase in oxidation rate is a result of a very soluble interplay of doping, or other alloying effects in the semiconducting oxide, possibly electric field effects, internal and external oxidation, effects on vacancy consumption by the alloy and hence the activity gradient across the scale, pore formation in the inner and possibly the outer regions of the scale, and finally the reduction of cross‐sectional area within the scale and at the alloy–oxide interface caused by Cr2O3 or NiCr2O4 or CoCr2O4 spinel particles (Kofstad and Hed 1969; Wood and Hodgkiess 1966). Commercial superalloys contain many alloying elements of significance over and above chromium and aluminum. The oxidation behavior of these alloys is very complex, and oxidation resistance varies widely, although the general mechanisms described earlier still apply. The complexities arise from significant influence of the individual elemental constituents. Nickel‐based superalloys containing elements such as Co, Cr, Al, Ti, W, and Ta exhibit general behavior similar to simple NiCrAl alloys. These superalloys are the most common materials used for high temperature applications. NiCrAlY‐type superalloy coatings also exhibit two interesting properties: they can be adjusted to have compositions near that of the substrate, avoiding differential strain problems and possible loss of adhesion, and they provide high resistance to oxidation due to the combined effects of Al and Y. This subsection on alloying finishes by reporting basic aspects of nickel‐based superalloys, taking into account their increasing importance as industrial alloys for high temperature applications. Superalloys belong to the category of high temperature materials with excellent mechanical properties and oxidation resistance at room and elevated temperatures. They also possess a structural stability at high temperature. In 1973, a superalloy was defined as “an alloy developed for elevated temperature service, usually based on group VIIIA elements, where relatively severe mechanical stressing is encountered, and where high surface stability is frequently required” (Sims and Hagel 1972). This definition is still applicable. Superalloys are widely used in aerospace, power generation, aircraft, marine, petrochemical processing, gas and oil extraction as rocket engines, nuclear reactors, and steam power plants, just to name a few of their applications. The main superalloys are Fe‐, Ni‐, and Co‐based alloys. At temperatures up to around 700 °C, ferritic Fe‐based superalloys are used. With the highest strength, Co‐based superalloys can be used at very high temperatures but have poor corrosion resistance at high temperatures. Ni‐based superalloys can be applied at higher temperatures, whereas single crystalline materials can be used at 0.8Tm (slightly below the melting point) and for durations of up to 100 000 hours (Sims et al. 1987) and even for 200 000 hours for special alloys (Reed 2006) at somewhat lower temperatures. These materials are generally used in the hottest areas, such as the hottest part of turbines, due to their very high strength. Their metallurgy is very complex as they can be fabricated as either wrought alloys, cast alloys, or directionally solidified alloys. The chemical composition of Ni‐based superalloys is very complex as up to 12 elements can be alloyed to Ni, owing to its high alloying tolerance. Furthermore, the “tramp” elements – such as sulfur, phosphorus, oxygen, and nitrogen – can be carefully controlled through appropriate melting practice. Trace elements, such as selenium, bismuth, thallium, tellurium, and lead, should be held at very low levels. With the addition of chromium and aluminum, these alloys can form continuous and adherent scales – alumina at very high temperatures and chromia at somewhat lower temperatures. Cr2O3 is also very effective against hot corrosion. The former polycrystalline alloys have very high Cr content (10–20% Cr), which has been decreased with the increasing use of alloys at higher temperatures. In contrast, Al content has been maintained at around 6%. The quantity of elements, such as molybdenum, tungsten, tantalum, columbium, and hafnium, depends on the strength that might be reached. With the advent of single crystalline materials, the grain boundary strengtheners – boron, zirconium, and carbon – have been removed, or their content has been reduced, carbon in particular, as is the case in, for example, the single crystalline superalloy PWA 1483. Boron and zirconium are known to retard the generation of boundary cracking, as they segregate at the grain boundaries. Zr is also a “getter” center for trace and tramp elements. Hafnium has taken the role of Zr in the new generation of alloys. Superalloys have a close‐packed FCC (face‐centered cubic) austenite lattice. The lattice consists generally of a γ′‐phase (strengthening phase Ni3Al or Ni3Ti with Al or Ti positioned at the corners and Ni on the faces), which are represented in Figure 7.17. Figure 7.17 Lattice structures of the matrix y and the intermetallic phase y′ (AG 2011). Other phases such as γ″, carbides, borides, TCP (topologically closed packed phases) should also be mentioned. The alloying elements are selectively distributed in the crystal. The γ‐matrix usually contains a high percentage of solid solution elements, such as Co, Cr, Mo, W, Ta, Ti, and Al, strengthening the matrix. The γ′ phase usually consists of (Ni, Co)3(Al, Ti) with a higher amount of Al or Ti. The superlattice of Ni3Al is the Cu3Au (L12)‐type structure. This phase precipitates coherently with gamma. This intermetallic phase has the particular characteristic of increasing its creep with increasing temperature, whereby its ductility prevents cracks. A small misfit between γ/γ′ is of importance, as it lowers the total surface energy, therefore stabilizing the microstructure at high temperatures. Carbides are more important for polycrystalline materials (low content 0.05–0.2% carbon) as they precipitate at grain boundaries and react with refractory elements (Ti, Ta, and Hf) to form strong carbides (MC, M is the metal), which strengthen the grain boundary, prevent or retard grain boundary sliding, or allow stress relaxation. They may also tightly bind some elements that favor phase instability. Borides may also have a similar role as carbides. Boron (50–500 ppm) is located at grain boundaries and provides enhancement of the grain boundary cohesion, thus reducing grain boundary tearing under creep‐rupture loading. TCP phases, which are platelike phases, including σ, μ, and Laves forms, result from excessive alloying of elements, such as Mo, W, Re, and Cr. They are undesirable in Ni‐based superalloys as they detrimentally affect the properties of the alloys. Due to their morphology, they are an excellent source for crack initiation and propagation, leading to low temperature brittle failure, especially sigma, which contains a high amount of refractory metals sapped from the γ‐matrix, causing the loss of solution strengthening. The development of new metallurgical processes (directional solidification and single‐crystal formation) has improved the performances of gas turbines. Single crystals, which are widely used in the hottest part of turbine (e.g. in aircraft turbines), are based on the γ/γ′ constituent. The volume fraction of γ′ is generally in the range of 40–70%. This phase is either distributed in spherical shape, if the lattice mismatch is around 0–0.2%, or cubical, occurring at 0.5–1.0% lattice mismatch (Sims and Hagel 1972), or plates become perpendicular to the load at mismatch about 1.25% (Fedelich 1999). Needles aligned with the load, as well as plates, have also been observed by Bressers (1996) as a consequence of anisotropic coalescence due to extreme temperatures and loading conditions. Some elements, such as the grain boundary strengtheners – boron, zirconium, and carbon – are removed in single crystalline materials, as these do not have grain boundaries. Both Zr and Hf tend to lower the solidus temperature of the alloy, preventing the complete dissolution of γ′ during solution heat treatment. Hf is, however, added in very low quantities (0.01–0.05%), as it reacts with sulfur (the presence of which is undesirable) to form stable sulfides, therefore improving the scale adhesion of the oxides. In addition, it prevents cracking during the solidification cool‐down cycle in cored columnar‐grained alloys. After service, some elements accumulate at the dendritic core or in interdendritic regions during cooling. Al, Ti, and Ta tend to segregate in the interdendritic parts, whereas Re and W, for example, join the dendritic core (Fuchs 2001, 2002), which can be reduced by an appropriate solution treatment. The amount of refractory metals in superalloys, such as W, Ta, and Re, has been steadily increasing in the past few years, as they increase the creep resistance as well as strength due to solid solution strengthening, strengthening of γ′, and slower diffusion rate. The new generation of superalloys also contains rhenium, which not only increases the mechanical properties of the alloy (Pollock 2000) but also leads to the formation of TCP phases (Feng et al. 2003). Superalloys, just as most of high temperature alloys, owe their good oxidation resistance to the formation of a protective scale, which is slow growing, has a low defect concentration, and is adherent. This is achieved by the selective oxidation of either Cr or Al, depending on the service temperature. Therefore, a minimum amount of these elements is required to ensure the growth of this external scale. Due to its volatility at around 1000 °C, Cr2O3 is replaced by α‐Al2O3, which is stable from about 950 °C. On the other hand, the presence of Cr decreases the amount of Al needed to form alumina rapidly (Prescott and Graham 1992). The oxides formed separate the substrate with the corrosive medium, therefore preventing the formation of fast‐growing oxides, such as Ni, Co, or Fe oxides. A better adherence of the scales is mostly achieved by addition of reactive elements, such as hafnium, yttrium, and zirconium, as alumina tends to be very brittle. The selective oxidation of Cr and Al lead to their depletion under the alloys, causing the degradation of the mechanical properties especially if the substrate is very thin. The focus on the development of substrate alloys discussed in this chapter is generally to achieve high strength, high ductility, and efficient production. Oxidation resistance may not be consistent with achieving these goals. For example, increased Al and Cr result in improved oxidation resistance; however, beyond a certain level, these elements reduce creep strength of the resulting alloys. To achieve both strength and resistance to environmental degradation, the two functions are separated. The load capability is provided by the application of thin coatings with adequate Al and Cr. The thickness of the coating is controlled so that it does not carry any significant load. Depending on the temperature of use, many high temperature alloys require coatings compatible with its composition and structural (modulus) and thermal (CTE) properties. Diffusion, overlay, and thermal barrier coatings were described a few years ago in a chapter on high temperature oxidation that we have published in Uhlig’s Corrosion Handbook, 3rd ed., edited by R. Winston Revie. Recently, surface coatings are gaining high potential industrial applications in the field of high temperature corrosion protection, Therefore, it was felt that protective coatings should be discussed in more detail deserving a chapter on the subject, as it is done in Chapter of this book. Here, surface coatings are considered in terms of coating systems, coating processes, and coating degradation and are extended for cyclic oxidation, hot corrosion, sulfidation, carburization, erosion–corrosion, etc. There is a large spectrum of engineering materials available for applications subject to oxidation in different temperature ranges. This section focuses on laboratory and field experience of many materials that are being considered for applications in various temperature regimes. They range from carbon and Cr–Mo steels to advanced superalloys. At temperatures below 550 °C, carbon steel in air shows very little weight gain after exposure for nearly one month. As the temperature is increased to 700 °C, the oxidation rate is significantly increased, exhibiting a linear rate of oxidation attack. Test results by John (1999) showed that carbon steel exhibited about 0.25 mm/year (10 mpy) of oxidation at 604 °C; at 650 °C, carbon steel exhibited oxidation rates of the order of 1.25 mm/year (50 mpy). The beneficial effects of chromium and silicon additions to carbon steel were reported by Zeuthen (1970). Cr–Mo steels are used at higher temperatures than carbon steel because of higher tensile and creep‐rupture strengths as well as better microstructural stability. Molybdenum and chromium provide not only solid solution strengthening but also carbide strengthening. Silicon is very effective in improving the oxidation resistance of Cr–Mo steels, but the most important alloying element for improving oxidation resistance is chromium. The superior oxidation resistance of martensitic and ferritic stainless steels to that of carbon and Cr–Mo steels is well illustrated in the open literature (McGarrow 1971). The 25Cr steel (Type 446 = S44600) is the most oxidation resistant among the 400 series stainless steels due to the development of a continuous Cr2O3 scale on the metal surface. In Fe–Cr alloys, a minimum of approximately 18 wt% Cr is needed to develop a continuous Cr2O3 scale against further oxidation attack (Wright 1987). Cyclic oxidation studies conducted by Grodner (1956) also revealed that Type 446 was the best performer in the 400 series stainless steels, followed by Type 430 (S43000; 14–18Cr), 416 (S41000; 12–14Cr), and 410 (S41000; 11.5–13.5Cr). The growth of a thin, adherent (Fe,Cr)2O3 scale as a function of the accumulated isothermal hold time up to 1000 hours was observed by Walter et al. (1993) at 650 °C in air, during cycling from 650 to 300 °C. The 300 series austenitic stainless steels have been widely used for high temperature components because they exhibit higher elevated temperature strength than ferritic stainless steels. Furthermore, they do not suffer 475 °C embrittlement or ductility‐loss problems in thick sections and in heat‐affected zones as do ferritic stainless steels. Nevertheless, some austenitic stainless steels can suffer some ductility loss upon long‐term exposure to intermediate temperatures (e.g. 540–800 °C) due to sigma‐phase formation (Sherby 1962). Moccari and Ali (1979) observed the beneficial effects of nickel in improving the oxidation resistance of austenitic stainless steels. In evaluating materials for automobile emission‐control devices, such as thermal reactors and catalytic converters, Kado et al. (1978) carried out cyclic oxidation tests on various stainless steels. In cyclic oxidation tests performed in still air at 1000 °C for 400 cycles (30 minutes in the furnace and 30 minutes out of the furnace), types 409 (S40900; 12Cr), 420 (S42000, 13Cr), and 304 (S30400; 18Cr–8Ni) suffered severe attack. Type 420 (S42000; 13Cr) was completely oxidized after only 100 cycles, although the sample did not show any weight changes. Alloys that performed well under these conditions were types 405 (S40500; 14Cr), 430 (S43000; 17Cr), 446 (S44600; 25Cr), 310 (S31000; 25Cr–20Ni), and DIN 4828 (19Cr–12Ni–2Si). When cycled to 1200 °C for 400 cycles (30 minutes in the furnace and 30 minutes out of the furnace), all alloys tested except F‐1 alloy (Fe–15Cr–4Al) suffered severe oxidation attack. This illustrates the superior oxidation resistance of alumina formers (i.e. alloys that form Al2O3 scales when oxidized at elevated temperatures). Their data also illustrate that for temperatures as high as 1200 °C, Cr2O3 oxide scales can no longer provide adequate oxidation resistance. Oxidation data generated in combustion atmospheres is relatively limited. No systematic studies have been reported that varied combustion conditions, such as air‐to‐fuel ratios. In combustion atmospheres, the oxidation of metals or alloys is not controlled by oxygen only. Other combustion products, such as H2O, CO, CO2, N2, hydrocarbon, and others, are expected to influence oxidation behavior. When air is used for combustion, nitride formation in conjunction with oxidation can occur in combustion atmospheres under certain conditions. The presence of water vapor can also be an important factor in affecting oxidation behavior of alloys, as discussed later in this section. Manufacturing processes can greatly influence the surface chemistry of an alloy product. Stainless steels can be finished into the final product by bright annealing (i.e. annealing is performed in a protective atmosphere, such as hydrogen environment or dissociated ammonia environment). This process generally produces a product with minimal depletion of chromium at or near the surface. On the other hand, when the alloy product is finished by black annealing (i.e. annealing is performed in air or combustion atmosphere in the furnace) and followed by acid pickling, there is a good chance that the alloy product may exhibit surface depletion of chromium. This is particularly important for thin‐gage sheet products or thin tubular products (Ruther and Grunberg 1964). Some stainless steel producers may manufacture stainless steels at the bottom of the specification range for key alloying elements, such as chromium, to reduce material cost. Accordingly, the chromium content can be insufficient to maintain a continuous chromium oxide scale during prolonged service or when subjected to thermal cycling or overheating conditions, thus promoting breakaway oxidation. The oxidation resistance of these “lean” stainless steels can be further degraded by the surface depletion of chromium resulting from manufacturing processes that may involve excessive pickling after “black” annealing (annealing in air or combustion atmosphere), during successive reductions in cold rolling in flat product manufacturing, or pilgering in tubular manufacturing. The chromium concentration at the surface of such a product, particularly a thin‐gage sheet or tube, may be too low to form or maintain a continuous chromium oxide scale during service. As a result, iron oxides and isolated non‐protective Fe–Cr oxide nodules can develop on the metal surface, thus resulting in breakaway oxidation, as discussed later. Some commercial electrical resistance heating elements are made of Fe–Cr–Al alloys, such as Kanthal® alloys, which rely on the formation of the Al2O3 scale for applications up to 1400 °C (Kanthal 1995). For example, some of the Kanthal alloys that are available in wire, strip, and ribbon product forms are Kanthal A‐I (K92500; Fe–22Cr–5.8Al), AF (Fe–22Cr–5.3Al), and D (Fe–22Cr–4.8Al). Since these wrought alloy products are essentially ferritic alloys, they exhibit low creep‐rupture strengths when the temperature exceeds 650 °C and cannot be used for high temperature structural components. Thus, the electrical resistance heating elements made of these alloys must be properly supported to avoid creep deformation, such as sagging. These Kanthal wires can be used in arc or flame spraying to produce an oxidation‐resistant coating or in weld overlay cladding by using a gas metal arc welding (GMAW) process. A powder metallurgy (P/M) process was used to produce a new alloy product, Kanthal APM, reported to exhibit improved creep‐rupture strength (Berglund and Jonsson 1989). Other commercial Fe–Cr–Al alloys include ALFA‐I™ (Fe–13Cr–3Al), ALFA‐II™ (Fe–13Cr–4Al), and ALFA‐IV™ (Fe–20Cr–5Al–Ce) developed by Allegheny Ludlum (1990) and Fecralloy® (Fe–16Cr–4Al–0.3Y) developed by Atomic Energy Authority (Moseley et al. 1984). As the nickel content in the Fe–Ni–Cr system increases from austenitic stainless steels to a group of iron‐based alloys with 20–25Cr and 30–40Ni, the alloys become more stable in terms of metallurgical structure and more resistant to creep deformation (i.e. higher creep‐rupture strengths). In general, this group of alloys also exhibits better oxidation resistance. Some of the wrought alloys in this group are 800H/800HT (Fe–21Cr–32Ni–Al–Ti), RA330 (NO8330; Fe–19Cr–35Ni–1.2Si), HR120 (Fe–25Cr–37Ni–0.7Nb–N), AC66 (N53228; Fe–27Cr–32Ni–0.8Nb–Ce), 353MA (Fe–25Cr–35Ni–1.5Si–Ce), and 803 (Fe–26Cr–35Ni–Al–Ti) (Smith et al. 1997). In many Ni–Cr alloys, many alloying elements, such as those for solid solution strengthening (e.g. Mo, W) and precipitation strengthening (e.g. Al, Ti, Nb), are added to the alloys to provide strengthening of the alloy at elevated temperatures. Many of these alloys are commonly referred to as “superalloys.” The superalloys also include oxide dispersion strengthened (ODS) alloys, which are briefly discussed later. Similar to Fe–Cr–Al alloys, aluminum is also used as an alloying element in Ni–Cr alloys to improve the oxidation resistance. Although a Ni–Cr alloy generally requires a minimum of 4% Al to form a protective Al2O3 scale, the addition of less than 4% Al can significantly improve the oxidation resistance of the alloy. Alloy 601 (NO6601), with only about 1.3% Al, shows excellent oxidation resistance (Ganesan et al. 1993). Ni–Cr alloys containing about 4% Al or higher form a very protective Al2O3 scale when heated to very high temperatures; for example, Lai (1985) compared Alloy 214 (Ni–16Cr–4.5Al–Y) with Alloy 601 and Alloy 800H in cyclic oxidation tests performed in still air at 1150 °C with specimens cycling to room temperature once a day except weekends. Alloy 214 showed essentially no weight loss after 42 days of testing, whereas Alloy 601 showed a linear weight loss. For applications at high temperatures, many superalloys contain numerous alloying elements for increasing the elevated temperature strength of the alloy. Molybdenum and tungsten are common alloying elements for providing solid solution strengthening for increasing the creep‐rupture strength of the alloy. Two iron‐based superalloys, Multimet alloy (R30155; Fe–20Ni–20Co–21Cr–3Mo–2.5W–1.0Nb+Ta) and Alloy 556 (R30556; Fe–20Ni–18Co–22Cr–3Mo–2.5W–0.6Ta–0.02La–0.02Zr), are good examples. However, the oxides of both molybdenum and tungsten (MoO3 and WO3) exhibit high vapor pressures at very high temperatures. Multimet alloy showed rapid oxidation attack at 1150 and 1200 °C, with specimens completely consumed at both temperatures. However, formation of the volatile oxides of MoO3 and WO3 can be minimized by modification of some key alloying elements in Multimet alloy. The development of Alloy 556 was aimed at improving the oxidation resistance of Multimet alloy without losing the elevated temperature strength by modifying the Multimet alloy composition. The modification involved a slight increase in chromium, a decrease in cobalt, replacement of niobium with tantalum, and addition of a rare earth element, lanthanum, and a reactive element, zirconium, but the concentrations of molybdenum and tungsten were not changed. The result was a much more oxidation‐resistant alloy, Alloy 556, at 1095 and 1150 °C, although rapid oxidation nevertheless occurred at 1200 °C. Cobalt‐based alloys with tungsten, such as Alloy 188 (R30188; Co–22Cr–22Ni–14W–0.04La), Alloy 25 (R30605; Co–20Cr–10Ni–15W), and Alloy 6B (Co–30Cr–4.5W–1.2C), showed rapid oxidation at 1205 °C. A cobalt‐based alloy, Alloy 150 (Co–27Cr–18Fe), containing no tungsten, also showed rapid oxidation attack at 1205 °C. Again, the oxidation of a cobalt‐based alloy can be significantly improved with some modification of alloying elements. Alloy 25 with 15% W exhibits excellent creep‐rupture strength at high temperatures. However, because of the high level of tungsten, the alloy shows high oxidation rates at very high temperatures, such as 1095 and 1150 °C. With a slight increase in chromium and nickel along with the addition of lanthanum, the result of the modification was Alloy 188, which has significantly better oxidation resistance than Alloy 25 at 1095 and 1150 °C. ODS alloys use very fine oxide particles that are uniformly distributed throughout the matrix to provide excessive strengthening at very high temperatures. These oxide particles, typically yttrium oxide, do not react with the alloy matrix, and so no coarsening or dissolution occurs during exposure to very high temperatures, thus maintaining the strength of the alloy. This group of superalloys is produced using specialty powders that are manufactured by the mechanical alloying process. These powders are essentially composite powders with each particle containing a uniform distribution of submicron oxide particles in an alloy matrix. The process of producing these ODS powders involves repeated fracturing and rewelding of a mixture of powder particles in vertical attritors or horizontal ball mills (Lowell et al. 1982). A vertical attritor is a high‐energy ball mill (like the conventional horizontal ball mill), in which the balls and the metal powders are charged into a stationary vertical tank and are agitated by impellers rotating from a central rotating shaft. The shaft turns, but the jar stays put. As the balls are stirred, they fall on the contents and grind whatever is between the balls. Alloy powders are then canned, degassed, and hot extruded, followed by hot working and annealing to produce a textured microstructure. Alloys are available in mill products, such as bar, plate, sheet, and so forth, or custom forgings. Oxidation of alloys can significantly increase under high velocity gas streams, as in, for example, combustors and transition ducts in gas turbines. These components are also subject to severe thermal cycling, particularly gas turbines in airplane engines. Laboratory burner rigs have been developed to evaluate the type of oxidation, often referred to as “dynamic oxidation,” under conditions of very high gas velocities. Some of these dynamic oxidation burner rigs are described elsewhere (Lai 1988; Lowell et al. 1982, Schütze 2000). Hicks (1987) performed dynamic oxidation tests with 170 m s−1 gas velocity, at 1100 °C with 30 minutes cycles for several wrought chromia‐forming superalloys and an ODS alumina former (MA956). Alumina former MA956 was found to be considerably better than chromium formers, such as alloys 191, 86, 617, 188, and 263. MA956, along with some ODS alloys, was studied by Lowell et al. (1981) with 0.3 Mach gas velocity at 1100 °C with 60 minutes cycles. ODS alloys included in the study were MA956 (Fe–19Cr–4.4Al–0.6Y2O3), HDA8077 (Ni–16Cr–4.2Al–1.6Y2O3), TD‐NiCr (Ni–20Cr–2.2ThO2), and STCA264 (Ni–16Cr–4.5Al–1Co–1.5Y2O3). Also included in the study was a physical vapor deposition (PVD) coating of Ni–15Cr–17Al–0.2Y on MAR‐M200 alloy (Ni–9Cr–10Co–12W–1Nb–5Al–2Ti). MA956 and HDA8077 as well as PVD Ni–Cr–Al–Y coating were found to perform well. No explanation was offered for STCA264, which did not perform as well as HDA8077 although both alloys had similar chemical compositions. In Fe–Cr, Fe–Ni–Cr, Ni–Cr, and Co–Cr alloy systems, the formation of an external Cr2O3 oxide scale provides the oxidation resistance for the alloy. The growth of the Cr2O3 oxide scale follows a parabolic rate law as the exposure time increases. As the temperature increases, the oxide scale growth rate also increases. The growth of the Cr2O3 scale requires that a continuous supply of chromium from the alloy interior diffuses to the oxide–metal interface. Continued oxidation can eventually deplete chromium in the alloy matrix immediately under the oxide scale. When the chromium concentration in the alloy matrix immediately beneath the oxide scale is reduced to below a critical concentration, the alloy matrix no longer has adequate chromium to reform a protective Cr2O3 oxide scale when the scale cracks or spalls due to oxide growth stresses or thermal cycling. Once this occurs, fast‐growing, non‐protective iron oxides, or nickel oxides, or cobalt oxides (i.e. oxides of base metal) form and grow on the alloy surface. Breakaway oxidation initiates, and the alloy begins to undergo oxidation at a rapid rate. The alloy thus requires the level of chromium immediately under the chromium oxide scale to reheal (Evans et al. 1980; Gleeson and Harper 1998; Hicks 1987; Quadakkers and Bongartz 1994; Schütze 2000). To prolong the time for initiation of breakaway oxidation, it is necessary to have an adequate reservoir of chromium immediately below the oxide scale to provide adequate chromium to maintain a protective chromium oxide scale or to reheal the oxide scale after local cracking or failure. For alumina formers, such as Fe–Cr–Al alloys, and Fe–Cr–Al‐based and Ni–Cr–Al‐based ODS alloys, breakaway oxidation occurs when aluminum concentration under the Al2O3 scale has been reduced to a critical level such that healing of the Al2O3 is no longer possible, thus resulting in the formation of non‐protective, fast‐growing oxides of base metals (e.g. iron oxides or nickel oxides). The breakaway oxidation due to rapid growth of iron oxides or nickel oxides becomes essentially a life‐limiting factor. This critical aluminum concentration was found to be about 1.0–1.3% for Fe–Cr–Al‐based ODS alloys (e.g. MA956, ODM751) at 1100–1200 °C (Gurrappa et al. 2000; Quadakkers and Bongartz 1994). These values were obtained from foil specimens (0.2–2 mm thick) tested in still air at 1100–1200 °C. For the non‐ODS Fe–20Cr–5Al alloy, this critical aluminum concentration was found to be higher (about 2.5%) at 1200 °C (Quadakkers and Bongartz 1994). Since breakaway oxidation is related to the aluminum reservoir in the alloy, this reservoir is a critical issue when the component is made of thin sheet or foil. Because of excellent oxidation resistance at very high temperatures, there is increasing interest in considering alumina formers for products that require thin foils, such as honeycomb seals in gas turbines, metallic substrates for automobile catalyst converters, and recuperators in microturbines. For alumina formers to improve their resistance to breakaway oxidation, yttrium is frequently used to increase the adhesion of the aluminum oxide scale. Other alloying elements that are known to increase the adhesion of the aluminum oxide scale include zirconium and hafnium. Quadakkers (1990) shows that both MA956 (Fe–20Cr–4.5Al–0.5Y2O3) and Aluchrom (Fe–20Cr–5Al–0.01Y) exhibited much more cyclic oxidation resistance than Fe–20Cr–5Al when tested at 1100 °C in synthetic air with an hourly cycle to room temperature. Addition of Y2O3 to an alumina former has a similar beneficial effect as yttrium added as an alloying element. Klower and Li (1996) studied the oxidation resistance of Fe–20Cr–5Al alloys in 10 different compositions containing various amounts of yttrium ranging from 0.045% to 0.28%. All 10 compositions contained 0.002% S, and eight compositions contained 0.04–0.06% Zr with two compositions containing no zirconium. The cyclic oxidation tests were performed at 1100 and 1200 °C, respectively, with each cycle consisting of 96 hours at temperature and rapid air cooling to room temperature. These authors concluded that the yttrium addition of about 0.045% was sufficient to prevent the oxide scales from spalling, and when the yttrium concentration was increased to more than 0.08%, substantial internal oxidation could occur, resulting in rapid metal wastage (Klower and Li 1996). Sulfur in the alloy is known to play a very significant role in adhesion of the aluminum oxide scale to the alloy substrate for alumina formers. The role of yttrium is believed to prevent the preferential segregation of sulfur in the alloy to the scale/metal interface to weaken the adhesion of the oxide scale (Funkenbusch et al. 1985; Smeggil et al. 1985, 1986). Reducing the concentration of sulfur in a Ni–Cr–Al alloy can significantly improve the oxidation resistance of the alloy. Smeggil (1987) compared cyclic oxidation resistance between the normal purity Ni–Cr–Al alloys (approximately 30–40 ppm S) with the high purity Ni–Cr–Al alloys (approximately 1–2 ppm S), showing a significant improvement in cyclic oxidation resistance when sulfur in the alloy was significantly reduced. Also demonstrated was the beneficial effect of yttrium addition to the normal purity Ni–20Cr–12Al alloy, showing significant improvement in the cyclic oxidation resistance of the alloy without reducing the sulfur content in the alloy. Sulfur was found to segregate to the oxide–alloy interface during oxidation in Fe–Cr–Al alloys (Hou 2000; Hou and Stringer 1992). Yttrium is believed to tie up sulfur at the oxide–metal interface, thus improving the oxide scale adhesion (Smeggil 1987). There are some industrial applications that require thin‐gage sheet materials or thin foils for construction of critical components. As the component thickness decreases, oxidation becomes a major factor that limits service life. When the component is made of thin foil, prolonging the incubation time before initiation of breakaway oxidation is the controlling factor for extending the service life of the component. Thus, as applications are being pushed toward higher and higher temperatures, alloys that form aluminum oxide scales can offer significant advantages in performance over those alloys that form chromium oxide scales (Klower 1998; Pint 2006; Simms et al. 2003). In high temperature combustion atmospheres, water vapor is invariably present in the environment. The effect of water vapor on the oxidation of alloys is an important factor in the alloy selection process. Most oxidation data are generated in laboratory air, which generally contains low levels of water vapor (Segerdahl et al. 2002a,b; Tuck et al. 1966). The effect of water on oxidation, and its detrimental effect, has been established by Onal et al. (2003) and many others (Béranger et al. 1987; Birks et al. 2006; Fleming et al. 1987; Streiff et al. 1989, 1997; Thoma 1986; Zeuthen 1970). As temperature increases, metals and alloys generally suffer increasingly higher rates of oxidation. When the temperature is excessively high, metals and alloys can suffer rapid oxidation. There is, however, another mode of rapid oxidation that takes place at relatively low temperatures, often referred to as “catastrophic oxidation,” associated with the formation of a liquid oxide that disrupts and dissolves the protective oxide scale, causing the alloy to suffer rapid oxidation at relatively low temperatures. This phenomenon has been observed by, for example, Meijering and Rathenau (1950), Brennor (1955), Sawyer (1961), Brasunas and Grant (1950), and Sequeira (2003). The most effective way to alleviate the potential catastrophic oxidation problem is to avoid a stagnant condition of the gaseous atmosphere. This chapter is a summary of the main factors for determining the nature and extent of gas–metal reactions, the comprehension of which is of paramount importance to understand the subject. Some of these factors are metal structure, oxide structure, metal diffusion, oxygen or metal diffusion at grain boundaries or on the surface, metal and oxide volatility, oxygen solution in metal, cracking, spalling, blistering, sintering, oxide nucleation, electronic conductance, oxide adhesion, and oxide plasticity. It starts with the basics of thermodynamics, followed by the usual topics, such as defect structures, growth of compact scales, formation of multilayered scales, oxidation studies of metals and engineering alloys, and corrosion protection, and ending with pertinent references on the subject.
Chapter 7
Oxidation
7.1 Introduction
7.1.1 Historical Perspective
7.1.2 Purpose of the Chapter
7.2 Thermodynamic Considerations
7.2.1 Volatility of Oxides
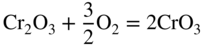
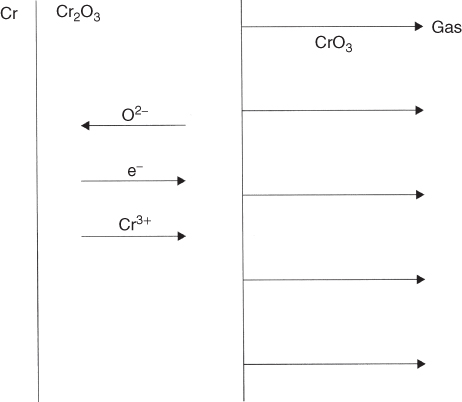
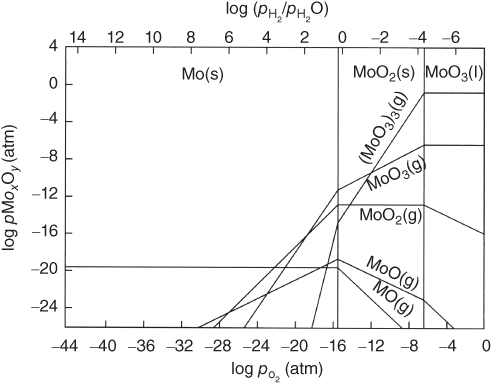
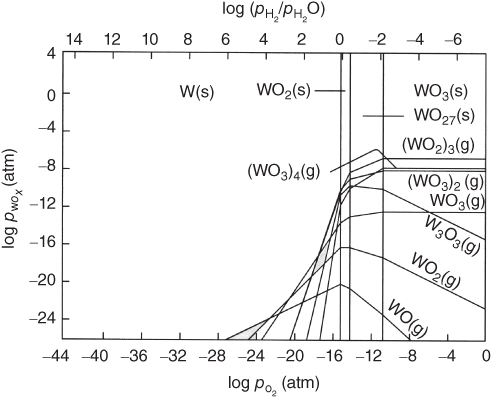
7.3 Kinetic Considerations
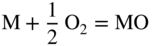
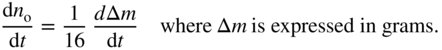
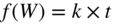

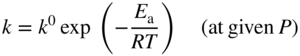

 , and the parabolic rate constant
  is expressed in m2 s−1. On the other hand, if the reaction rate is defined by the number of moles of the compound MX formed per unit area during the exposure period, t, the kinetic law has the form
  . In this case, the rate constant
  is expressed in mol2 m−4 s−1. There is a simple relationship between the rate constants kp,
  , and
, and  :
:

 if the rate is defined by the increase in thickness of the growing scale.
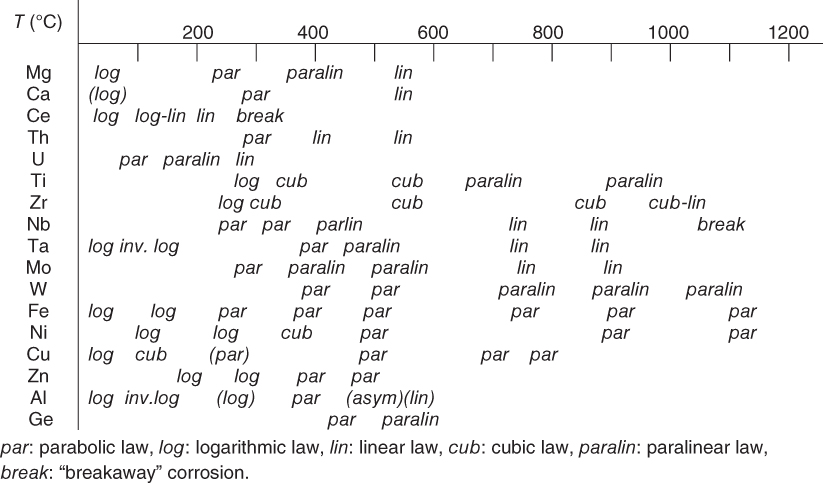
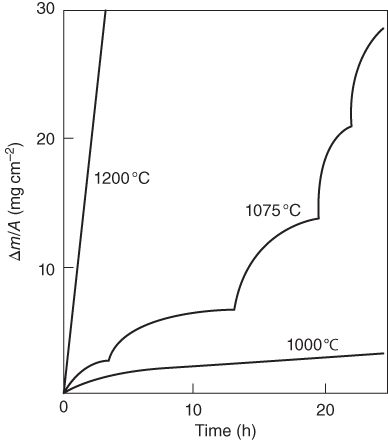
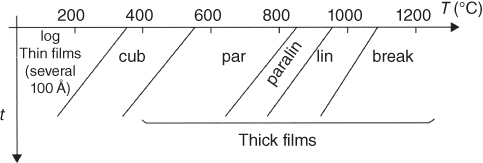

7.4 Defect Structures
7.4.1 Point Defects
7.4.1.1 Real Oxide Structures
 (a superscript prime (′) is used for a negative charge). These rules must be followed in writing defects in equilibrium reactions:
7.4.1.2 Stoichiometry
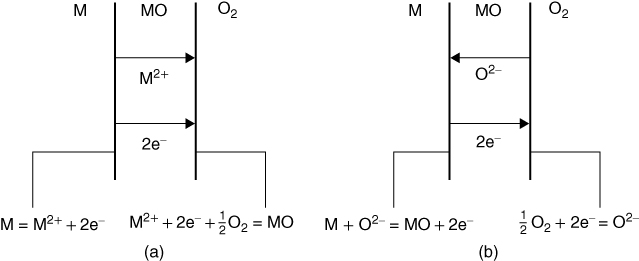
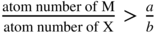 . These compounds are ionic semiconductors with metal excess (Ma+δXb, where δ is the deviation from stoichiometry in comparison with the stoichiometric composition MaXb) or with nonmetal deficit (MaXb−δ). ZnO is a typical n‐type semiconductor with a metal excess; TiO2, Nb2O5, MoO3, and WO3 are typical n‐type semiconductors with nonmetal deficit.
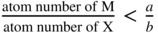 . These include the p‐type semiconductors with metal deficit (FeO, NiO, Cr2O3, Al2O3) or with an excess of nonmetal (UO2).
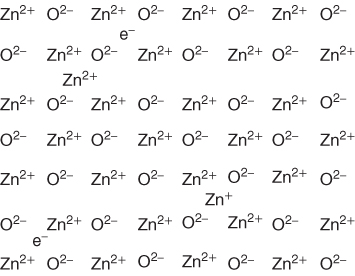
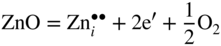
 , doubly charged Zn interstitials, or
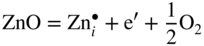
 , singly charged Zn interstitials.
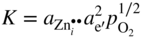
 and [e′] as in Eq. 7.16:
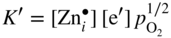
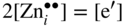
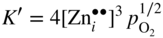
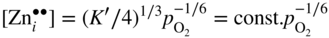

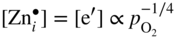
7.4.1.3 Mass and Electrical Transport
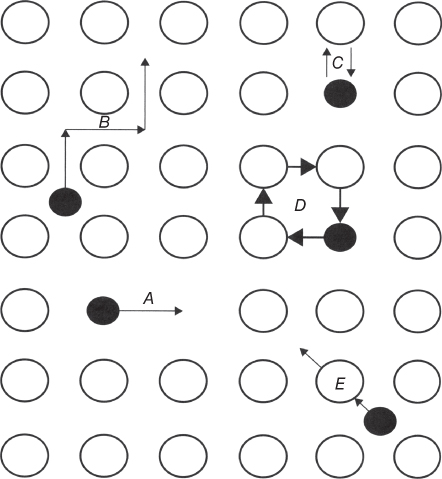
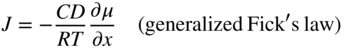
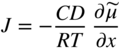
 , termed the electrochemical potential, is related to the chemical potential μ by the equation
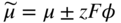
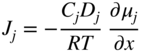
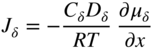

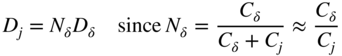
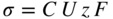
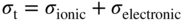
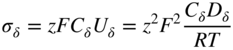

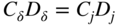
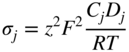
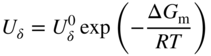
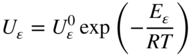
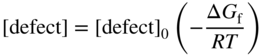
7.4.2 Line and Planar Defects
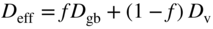
7.4.3 Three‐Dimensional Defects
7.4.3.1 Growth Stresses

 ) with a rate of
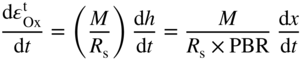
 to be calculated assuming linear elastic behavior. The magnitude of the maximum radial stresses,
  , is given by
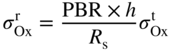
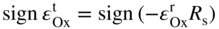
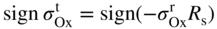
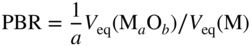
Oxide
K2O
CaO
MgO
CeO2
Na2O
CdO
Al2O3
ZnO
ZrO2
PBR
0.45
0.64
0.8
0.90
0.97
1.21
1.28
1.55
1.56
Oxide
Cu2O
NiO
FeO
TiO2
CoO
SiO2
Cr2O3
Ta2O5
Nb2O5
PBR
1.64
1.65
1.7
1.73
1.86
1.9
2.07
2.5
2.7
7.4.3.2 Thermal Stresses
System
Oxide: 106·αox
Metal: 106·αM
Ratio: αM/αox
Fe/FeO
12.2
15.3
1.25
Fe/Fe2O3
14.9
15.3
1.03
Ni/NiO
17.1
17.3
1.03
Co/CoO
15.0
14.0
0.93
Cr/Cr2O3
7.3
9.5
1.30
Cu/Cu2O
4.3
18.6
4.32
Cu/CuO
9.3
18.6
2.0
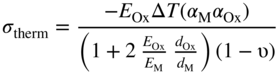
7.4.3.3 Mechanical Scale Failure
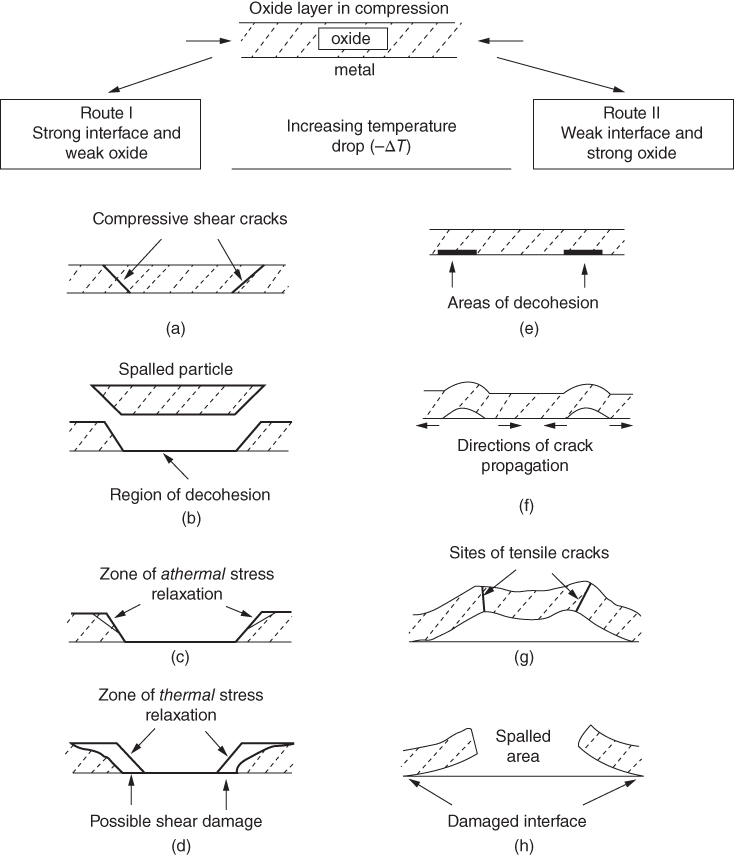
7.5 Compact Scale Growth
7.5.1 Elementary Chemical Steps
 and
and  , respectively:
 denoting the equilibrium constant of the elementary step of sorption.
 species, θeq the fractional surface coverage, the law of mass action applied to the equilibrium leads to
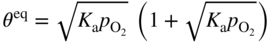
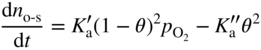
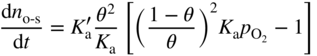
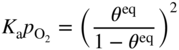
 or the oxygen interstitial
  for the case of a p‐type semiconductor and either the oxygen vacancy
  or the metal interstitial
  for the case of an n‐type semiconductor. The defects are then generated at the external interphase (cationic diffusion, p‐type semiconductor) or at the internal interphase (anionic diffusion, n‐type semiconductor) (see Figure 7.6).
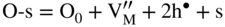
 denoting the equilibrium constant of the external step of matter exchange. The external reaction rate is given by
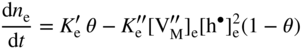
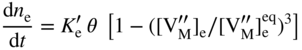
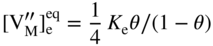
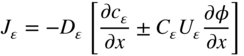
7.5.2 Diffusion‐Controlled Oxidation
 , is equal and opposite to the inward flux of cation vacancies, and we can write
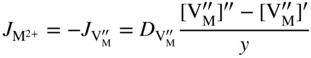
 is the diffusion coefficient for cation vacancies, and
  and
and  are the vacancy concentrations at the scale/metal and scale/gas interphases, respectively.
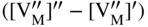 is constant, and we have
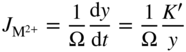
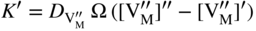

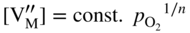
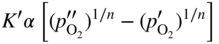
 is usually negligible compared with
  , we have
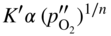
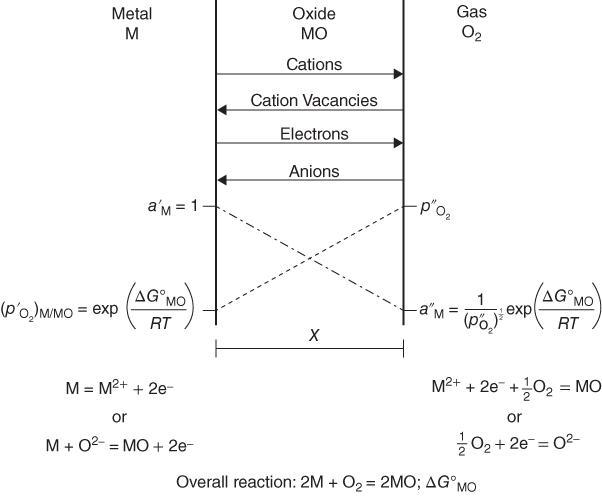
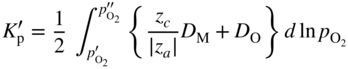
 , DM, and DO are given in units of cm2 s−1, with DM and DO the self‐diffusion coefficients for random diffusion of the respective ions (metal and oxygen) and z the valence of the respective ion (anion and cation).
 has to be replaced by
  according to the equation
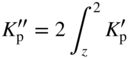
Corrosion product
∫z(g cm−3)
FeO
1.28
Fe3O4
1.43
Fe2O3
1.57
Cr2O3
1.64
FeCr2O4
1.45
FeS
1.76
FeS2
2.60
7.5.3 Short‐Circuit Diffusion
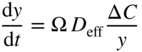
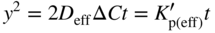
 is the effective parabolic constant.
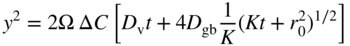
7.6 Multilayered Scale Growth
7.6.1 Compact Subscales

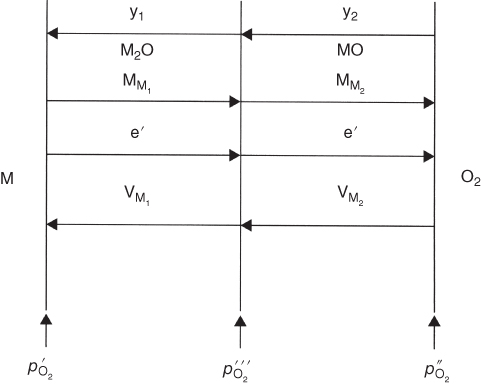
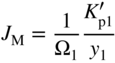

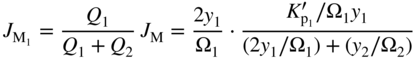
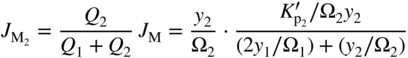
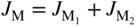 .
.
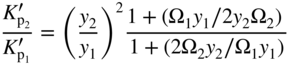
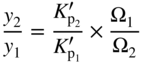
7.6.2 Paralinear Oxidation
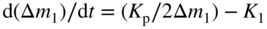
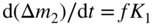
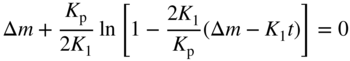
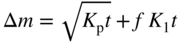
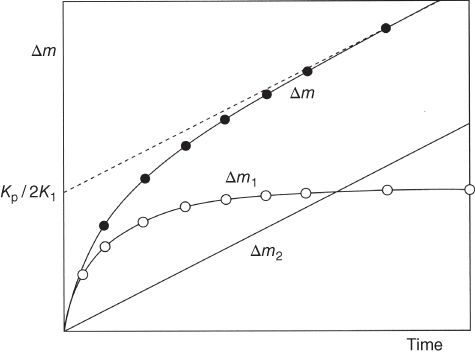
7.6.3 Stratified Scales
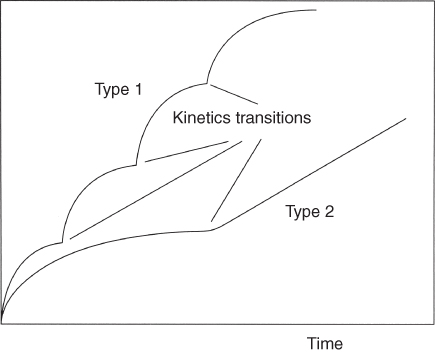
7.7 Oxidation Resistance
7.7.1 Atmosphere Control

 :
:
 is a function of temperature and has lower values at lower temperatures. Thus, if an atmosphere is designed to be effective at high temperatures, it may become oxidizing as the temperature is reduced during cooling. A surface oxide layer may, therefore, form as the metal is cooled. Although the metallurgical damage to the surface will be negligible, the surface may be discolored, i.e. not bright. This condition can be overcome to some extent by rapid cooling or by changing the atmosphere to a lower oxygen partial pressure just before or during cooling.
 :
:
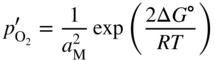
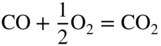

 or, more importantly,
  can be obtained:
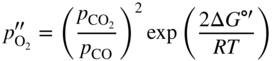
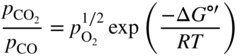
7.7.2 Alloying
7.7.2.1 Basic Thermodynamic Approach
 be the standard Gibbs free energy, at this temperature, of the following reaction:
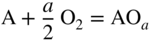
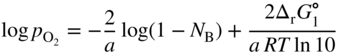
 is the standard Gibbs free energy of the reaction)
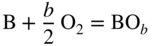
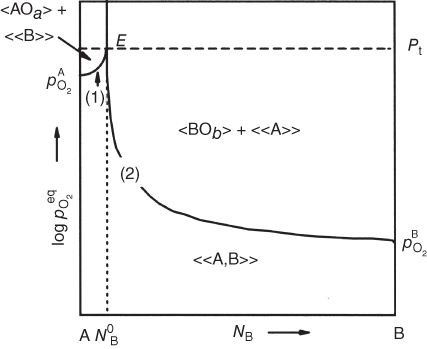
 .
.
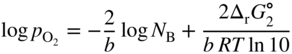
 of component B, corresponding to point E, depends on the standard Gibbs free energy of reactions 7.89 and 7.90, according to
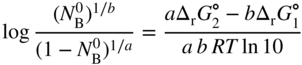
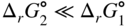 and the mole fraction
  corresponding to point E is very much less than 0.5.
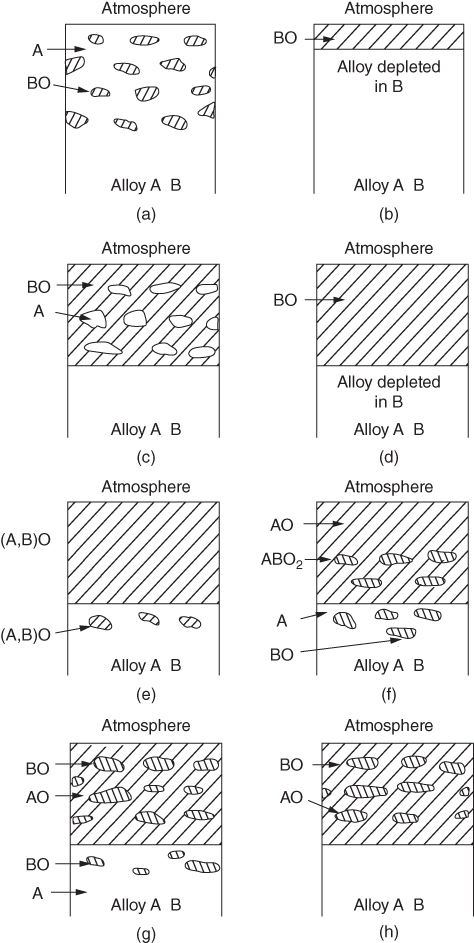
 , which is the oxygen permeability within the alloy. Here,
  is the oxygen concentration (moles/unit volume) at the alloy surface in equilibrium with the gaseous atmosphere (
 at t = 0), and DO is the oxygen diffusion coefficient.
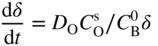
 is the value of CB for x ≥ 0 (at t = 0) and x → ∞ (for whatever t). By integration, a parabolic law for the depth, δ, of oxidation is obtained:
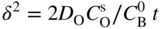
 , at the alloy surface produced, for example, by decrease in the oxygen partial pressure of the oxidizing gas. It can be appreciated that there is a limiting concentration of element B above which a continuous blocking oxide scale is formed. This corresponds to the transition from internal to external oxidation and a consequent decrease in the oxidation rate. The main conditions that favor external oxidation are as follows:
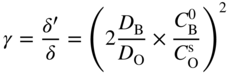
7.7.2.1.1 Chromia‐Forming Alloys
7.7.2.1.2 Alumina‐Forming Alloys
Al2O3
Cr2O3
Deviation from stoichiometry
10−4 (at 1000 °C)
10−3 (at 600 °C)
Cation self‐diffusion coefficient in oxide at 1000 °C (cm2 s−1)
10−15
10−12
Parabolic rate constant at 1000 °C (on Fe–25Cr–5Al for Al2O3, on Fe–20Cr for Cr2O3) (g2 cm−4 s−1)
2.7 × 10⁻¹³
2.0 × 10⁻¹¹
7.7.2.1.3 Chromia and Alumina Characteristics
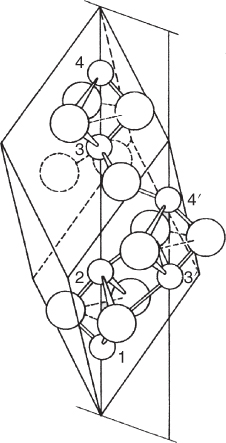
 (Young et al. 1985), whereas Cr vacancies are predominant (Stott 1987). Certainly, most studies of chromium oxidation indicate that the scale grows largely by chromium diffusion outward, as confirmed by oxygen tracer studies in the growing scale. However, oxygen isotrope exchange measurements (Lees and Calvert 1976) have inferred that anion transport by mechanisms other than lattice diffusion does not occur during growth of Cr2O3 scales on alloys at high temperature. Rapid‐diffusion paths, such as grain boundaries, have a significant influence on the oxidation behavior of chromium at high temperature, as they enhance the transport of cations and perhaps anions (Caplan and Sproule 1975). The scale microstructure is also determined for the chromia oxidation rate, as the fine‐grained structure increases the number of short diffusion paths, therefore allowing higher oxidation rate to be achieved. The addition of reactive elements, such as yttrium, hafnium, cerium, zirconium, etc., improves the oxidation behavior as well as scale adhesion of Cr2O3 (Ecer and Meier 1979) and their oxides, present as fine dispersed particles in the alloy prior to oxidation (Hindam and Whittle 1982). At very high temperatures, chromia reacts with oxygen to form the volatile species CrO3, which induces oxide thinning and a metal recession, when the diffusion through the scale is low. This effect becomes significant at 1000 °C. Therefore, alumina is a suitable candidate, as there is no vapor in the Al–O2 system with significant vapor pressures.
7.7.2.1.4 Doping on Oxide Defect Structure
7.7.2.1.5 Ni‐Based Superalloys
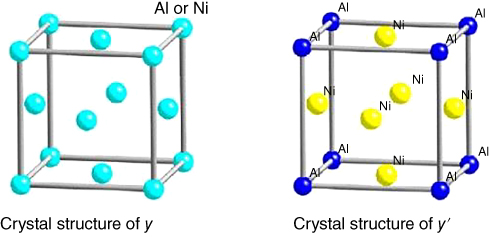
7.7.3 Protection by Coatings
7.8 Oxidation of Engineering Materials
7.9 Conclusions
7.10 Questions
References
Further Reading
Oxidation
7.1
7.2
7.3
7.4
7.5
7.6
7.7
7.8
7.9
7.10
7.11
7.12
7.13
7.14
7.15
7.16
7.17
7.18
7.19
7.20
7.21
7.22
7.23
7.24
7.25
7.26
7.27
7.28
7.29
7.30
7.31
7.32
7.33
7.34
7.35
7.36
7.37
7.38
7.39
7.40
7.41
7.42
7.43
7.44
7.45
7.46
7.47
7.48
7.49
7.50
7.51
7.52
7.53
7.54
7.55
7.56
7.57
7.58
7.59
7.60
7.61
7.62
7.63
7.64
7.65
7.66
7.67
7.68
7.69
7.70
7.71
7.72
7.73
7.74
7.75
7.76
7.77
7.78
7.79
7.80
7.81
7.82
7.83
7.84
7.85
7.86
7.87
7.88
7.89
7.90
7.91
7.92
7.93
7.94
7.95
7.96