Brian N. Leis B N Leis Consultant, Inc., Worthington, OH, USA Stress-corrosion cracking (SCC) has been a threat to pipeline integrity that has been recognized by the industry for almost six decades. While over that time we have learned much about this cracking process, it remains a challenge to manage. This is evident in the occasional failures that SCC causes and in the investment made in pipeline inspection and maintenance programs to manage it. Yet, in spite of improvements in the inspection tools designed to detect and size it, and in the technology that has been developed to assess and manage it, such failures persist. The chapter prior to this served two purposes relative to managing the threat posed by SCC. First, it provided a historical perspective for external SCC on pipelines from the early years through the present and presented aspects of the related laboratory and field work that have been developed to understand and quantify it. Second, the prior chapter adapted this historical insight as the foundation to quantify the cracking response for in-service pipelines, as an input to a pipeline-specific SCC management strategy. Archival and more recent work was outlined and discussed to reaffirm and quantify the factors controlling high-pH SCC. Cracking thresholds and speeds were developed based on laboratory data during crack initiation and early SCC growth, and during macrocrack growth, and then quantified in light of a pipeline’s operational parameters (e.g., potential and temperature), and the conditions along its right-of-way. Thereafter, “bathtub life curves” were developed to characterize SCC in field applications. Next, critical differences among the factors controlling near-neutral (NN) versus high-pH SCC were identified as the basis to begin to generalize the bathtub concepts for applications involving NN-pH SCC. Finally, physically measured field crack depths and their corresponding times in service were gathered and trended, and shown to correspond closely to the simulated cracking speeds along the bathtub curve. That correspondence established a confident basis to both utilize and/or generalize those cracking speeds and model concepts. This chapter builds on the outcomes of the prior, with a view to address the major differences between NN-pH and high-pH SCC as they affect the concepts and structure that emerged in the prior chapter in the context of high-pH cracking. As indicated at the outset of the prior chapter, comprehensive reporting concerning SCC would require a book with chapters devoted to the many factors controlling SCC. Related chapters would then present empirical characterization of their effects, along with related modeling. In contrast to the broad scope of such a book, this chapter focuses on aspects of SCC response to loading, from initiation and growth through failure. Clearly, the mechanisms and controlling factors differ for the above-noted two forms of SCC. Yet, in spite of this or other important differences, if thresholds for the initiation and growth, and average cracking speed (ACS) can be quantified for NN cracking in analogy to that developed for the high-pH process, then the framework developed for high-pH cracking in the prior chapter could be generalized to address NN-pH cracking. It follows that this chapter must establish a similitude between the outcomes and traits of the cracking that forms in both the high-pH and the NN-pH environments. In addition, criteria that have been used to discriminate between these cracking processes must be broadly validated, and the effects of aspects like the microstructure and hydrotesting must be characterized and shown to be independent of the cracking environment. Accordingly, this chapter begins by comparing the physical traits of NN-pH and high-pH SCC as they appear on the pipe’s surface, on transverse cross sections, and on axial fracture surfaces. Aspects associated with interaction and coalescence follow next, thereafter the nature of the cracking processes for both cracking environments is reviewed to assess their similarities and differences, if any—from initiation through the occurrence of leaks or ruptures. It is then shown that the phenomenology of SCC is broadly consistent with the concepts that underlie the bathtub curve, which builds confidence in its practical utility. Where relevant, each subsection trends laboratory and field data to assess the practical viability of the approach developed. To this end, this chapter presents images and trends data concerning the initiation and growth of external SCC on pipelines, with a view to acquaint its readers with its physical appearance and details concerning crack interaction and coalescence, the effects of hydrotesting, and other aspects. Typical imaging practices are introduced as background to the traits they capture, after which a compendium of images is presented to illustrate the range of cracking as it appears in clusters1 and colonies on the pipe surface, and in cross sections, and on fracture surfaces—for both near-neutral (NN)-pH and high-pH SCC. The intent is to determine if the outcomes of these differing cracking mechanisms are comparable—relative to the rational premise that the mechanics of cracking in clusters have a similar overarching influence for both. Crack initiation is illustrated from the scale of the microstructure up through its transition to growth at the scale of the pipe wall. Initiation at oxide cracking is illustrated in complement to the already extensive work on pitting. Imaging is used to illustrate why cracks have been found to grow faster along the surface as compared to into and through the thickness. It is shown that the traits of these cracking processes are similar for cracking at the scale of the microstructure, up through sizes that cause SCC leaks and ruptures. Throughout, this chapter builds on the content of the prior chapter. The intent is to establish that the predictive framework for the bathtub curves advanced in the prior chapter is broadly consistent with the phenomenology of SCC from initiation through failure. Practical observations and takeaways are presented in the conclusion to each of the chapter’s subsections, with a view to develop better crack-management practices. While to this point, it has been expedient to associate high-pH SCC with intergranular (IG) crack paths and NN-pH SCC with transgranular (TG) crack paths,2 suffice it for the present to state that laboratory research has shown that such is not always the case. Prior work has shown that cracking in the high-pH environment can occur in a TG mode [1] in typical carbon–manganese (C–Mn) steels. Likewise, very shallow cracking in NN-pH environments has on occasion shown traits comparable to cracking in high-pH environments, as becomes evident later in this chapter. Reference [2] and others have shown TG cracking from smooth surfaces in the high-pH cracking environment at potentials above and below the usual range of potentials that maximize the ACS in that environment. Reference [3] and others also have shown a shift to TG paths for macrocrack growth under cyclic loading for certain combinations of the range of the stress intensity factor, ΔK, and the mean value of K. In spite of this, IG cracking has been broadly associated with what was termed a high-pH environment in field failure analysis reporting (e.g., Ref. [2]). The environments associated with the “distinctly different cracking” noted among the early failures, as illustrated in Figure 53.2 (in Chapter 53), involved groundwater pH values that when reported were less than 5 (e.g., Ref. [4]). In contrast, when measured and reported, the pH under disbonds where IG cracking was present on coated pipelines averaged 10.5, but ran as high as 12.3 [2]. It follows that the morphology of the cracking and its dependence on the environment merit further consideration, which follows later in this chapter. Hereafter, the imaging presented will be identified in terms of its morphology as IG or TG, with the cracking environment noted in cases where appropriate and the provenance supports it. Consider now imaging that characterizes the physical traits of SCC first in regard to the fracture surface, then in regard to transverse cross sections, and finally on the outside diameter (OD) surface of the pipeline. SCC has been imaged over the years from three perspectives, each of which captures a two-dimensional (2D) image of a three-dimensional (3D) cracking process and its cracking paths. It is instructive to open this chapter evaluating whether this 3D process and its cracking paths can be captured effectively using 2D imaging. Figure 54.1 shows the features of SCC captured with optical imaging practices typical of that used to characterize the fracture surface of a failure, which in this case was an in-service leak. The report dealing with this failure stated that: (1) all cracks lay perpendicular to the direction of the hoop stress, (2) the cracking along the leak path was branched, and (3) the cracking was intergranular. In addition, based on X-ray diffraction, the report noted that a black-colored mixture of iron oxide (Fe3O4 or magnetite) and iron carbonate (FeCO3 or siderite) was found on the surfaces of the cracks, to which it can be added that in places the cracking was filled with corrosion debris. This cracking occurred beneath a coal-tar coating on a pipeline that had operated and been protected under conditions typical of the 1950s and 1960s. Figure 54.1 View of overlapped crack segments typical of SCC fracture surfaces. Figure 54.1 shows cracking adjacent to the leak path in what was intact cracking that was opened in the laboratory. Optical microscopy (OM) done on a cross (x) section cut adjacent to this image showed that this SCC had grown stably through-wall (TW) a short distance from the cracking imaged here, such that a deep thumbnail-shaped TW crack lay across the leak path centered at the site of the leak. While this image reflects IG cracking, the adjacent sometimes overlapped crack segments are likewise evident on fracture surfaces typical of TG cracking had it initiated and grown under comparable circumstances. Whereas differences in the appearance of IG versus TG cracking could be observed on the OD surface, or in x sections, visual traits that have been used to discriminate macroscopically between mechanisms cannot be discerned on images of fracture surfaces. Differences in cracking morphology can, however, be discriminated on fracture surfaces at much higher magnifications, but this requires scanning electron microscopy (SEM) to achieve the resolution needed, along with the depth of field required for such analysis. Further imaging of fracture surfaces follows shortly, examples of which include TG and IG cracking as well as high-resolution SEM imaging. Images of fracture surfaces like that shown in Figure 54.1 can be instructive concerning (1) the profiles and so depths of the crack segments potentially contributory to a rupture origin; (2) the plausible combinations of crack segments and sequences of their coalescence if the cracking grows beyond its origins; and (3) the nature of initiation and early growth. That said, 2D imaging of fracture surfaces generally must be supplemented by views of the features on the pipe’s OD surface to develop insight into how the crack segments combined to trigger failure. While depth of field is not an issue for stereo OM perspective imaging of fracture surfaces at lower magnification, it becomes an issue as the magnification increases. For this reason, perspective imaging of fracture surfaces to resolve the cracking morphology requires the use of SEM to discriminate between the physical traits of IG versus TG cracking. Where SEM is not available or perhaps considered too costly or otherwise unnecessary, SCC has been imaged via OM on x sections from near full size, up through higher resolution. While OM suffices to image x sections, the field of view is very small, and only the cracking intersecting that cross section can be examined. It follows that unless multiple sections are prepared and examined, the use of OM provides limited insight into the nature of the cracking. Against this background, Figures 54.2 and 54.3, respectively, show low- and higher-power images of x sections typical of IG and TG SCC. Recall that the “Introduction” to the prior chapter noted that the x sections of some early SCC field failures involving bare pipe showed traits that were distinctly different from those for coated pipelines. Even so, the cracking then imaged was considered IG and was generally associated with a high-pH cracking environment. That said, the differences evident in images of the x sections between those bare versus coated pipes coincided with several of the traits that today are often accepted (without caveat) as discriminators between IG and TG cracking. The often-cited traits evident as just noted have included the following: Figure 54.2 Metallographic sections through IG cracking—OD surface is up. (a) As-polished, slightly magnified; (b) at high magnification, as-polished, and beside it etched. Figure 54.3 Metallographic sections through TG cracking—OD surface is up. (a) As-polished, at near full size; (b) at higher magnification, lightly etched (see Footnote 5). Many aspects among this set of traits have been invoked from time to time to discriminate between the high-pH and NN-pH cracking environments and mechanisms. That said, as becomes apparent as this chapter unfolds, only the last of these has broad applicability throughout the cracking considered. Determining either the environment and/or mechanism based on this set of traits is problematic for two important reasons. First, as discussed in the prior chapter, the cracking environment can be subject to seasonal swings; the same, therefore, being the case for the cracking mechanism. Accordingly, what is observed in cross sections of field cracking can change over time and across the surface of a crack, as the circumstances driving that cracking change. Second, x sections through a crack capture very little information concerning the cracking that is active elsewhere along the length and depth of the crack, or over the lengths and depths of its neighboring cracks. In contrast to a snapshot taken at a point along the crack’s length via OM, SEM imaging provides comprehensive coverage over the fracture surface. While not as broadly available, and potentially more costly to use than OM, SEM imaging quickly becomes competitive in cases where the cracking morphology is not simply resolved, as often occurs for field cracking. As such, SEM is recommended as the basis to characterize field cracking morphology. That said, it can take much more than morphology to determine the cracking environment(s). The disbond fluid pH (sampled under the disbond as it is exposed) is important, as are details concerning the cathodic protection (CP), the soil, and the terrain.3 The slightly magnified image in Figure 54.2a shows the main fracture plane of an in-service rupture. In addition to the main crack, similar but shallow parallel cracks are evident, which as they were not causative or contributory to failure would be termed “secondary cracking.” One among the shallower of these secondary cracks is shown in Figure 54.2b. Resized here, the original imaging was captured at 250X. This cracking, which continues beyond the lower edge of this image, shows local branching, but as it is very tight it appears faint in this image. Careful inspection indicated that this cracking followed an IG path over most of its depth. The etched view shows that while this cracking remained IG within the straight segments (highlighted by the arrows) in this image, crack-split grains also are evident. Finally, note that this IG secondary cracking intersects pitting (albeit shallow), as did others among the more visible secondary cracking, and that in places the pipe surface shows evidence of localized corrosion. As becomes evident later, IG features are more commonly found absent evidence of pitting but have been documented with evidence of corrosion well down the crack, which in places has partially filled the crack. Figure 54.3a, which characterizes some typical TG cracking, is similar in format to that shown for the IG SCC. When TG cracking occurs on tape-coated pipelines, this form of SCC tends to develop under disbonds traversing a weld seam or local to the overlap gap that runs helically around the pipe between adjacent layers of tape. But, it also occurs under disbonds in the body of the pipe. Imaging follows later that shows TG cracking in the body as well as focused along overlap gaps, like that along the lower side of a longitudinal double-submerged-arc weld (DSAW) seam. Such cracking also can be “focused” along the seam due to the locally higher stresses or metallurgical differences that occur local to weld seams. Differences in the causative factors specific to TG versus IG cracking also can be evident on the OD surface in regard to the frequency and spacing of the cracking. Thus, whereas IG cracking occurs most frequently in the body of the pipe, TG cracking can be commonly found in association with weld seams and coating overlaps. For this reason, Figure 54.3a has included three slightly magnified x sections, the aspects of which are characteristic of TG cracking. Because TG cracking tends to occur in association with corrosion and shows corroded crack flanks, TG cracking tends to be open and so is more readily evident in metallographic sections. Corrosion and pitting are typically present on the OD surface, as can be seen in the upper and middle views of Figure 54.3a, whereas the lower view shows little to no evidence of it. Deeper often unbranched secondary cracking is evident in the upper and lower images. Bifurcated cracking is evident for the two deeper secondary cracks upper image and along the fracture path for the middle image (highlighted by arrows in both views). Macroscopic branching like this is often found at crack tips following a step increase in stress, as occurs due to hydrotest conditions that activate localized stable tearing4 at the crack tip. The secondary cracking imaged in Figure 54.3b5 was captured at each of 75X and 500X, then resized here to show features typical of TG growth. Comparing this imaging with that in Figure 54.2b, after accounting for the minor differences in resolution, it is evident that their microstructural sizes are comparable. While not evident in this comparison, microstructural differences can be evident that trace to different compositions and changes in the processing of the steels involved. In this case, the IG cracking lies in an early 1950s X52, whereas the TG cracking lies in an early1970s X65. Whereas the microstructure can affect changes in the cracking morphology, as becomes evident later, suffice it here to note that TG cracking also has been found in coarser microstructures and/or lower-strength grades. Likewise, IG cracking has been evident across a range of grades including X65 and above. Figure 54.4 Image typical of SCC as viewed on the pipe’s OD surface. The TG cracking in Figure 54.3b is somewhat open as compared to IG cracking in Figure 54.2b, and in places, the flanks show corrosion and a layer of oxide, and also evidence of compacted corrosion debris. Figure 54.3b indicates that this TG cracking tracks a rather straight path. Careful inspection of the etched view shows that toward the crack’s tip, it cuts across the grains—clearly indicative of TG growth. As implied in regard to Figure 54.3a, this TG cracking shows some evidence of local corrosion; although such is not always the case—as becomes evident later. While a 2D x section can be instructive regarding the cracking path, it reflects the response specific to that section and the effects of its immediately adjacent grains on cracking. As such, serial sections are needed at tight spacings to quantify crack shape and establish that the crack morphology seen on one slice is typical throughout the fracture surface. Serial sectioning and imaging can be expensive: worse yet it destroys the evidence. Taken together with the imaging of the fracture surfaces, 2D imaging of x sections provides essential details concerning the cracking paths and profiles (and so the lengths and depths), but it fails to provide insight into how that cracking first interacted with adjacent cracking, and then coalesced to cause a leak or a rupture.6 That process benefits from 2D imaging of the cracking viewed on the pipe’s OD surface. Figure 54.4 images SCC that contained the origin of an in-service rupture. As evident in this view, SCC imaged on the OD surface characterizes the lengths of the cracking, and the current spatial axial and circumferential locations of the tips of the adjacent cracking, which in this case were local to the rupture plane. Inspection of Figure 54.4 indicates that OD imaging also provides insight into which of the larger cracks have coalesced. Coalescence is evident between cracks whose tips were not coplanar as circumferential offsets that formed as the crack’s path stepped between adjacent crack segments along the length of the fracture path. The relative tip-to-tip spacing, coupled with the hoop stress and other details, are useful to determine which among the many cracks might interact or might coalesce (see Footnote 6) at their current lengths and depths, thereby producing a much longer crack, potentially exceeding the critical length for rupture (i.e., axial crack growth and its instability). To effectively support the sizing of all aspects of the SCC evident on the OD of a pipe, the imaging should be done perpendicular to the pipe’s surface. However, due to the curvature of the pipe and the 3D distortion that can develop under the dynamic loading as ruptures ensue, it can be difficult to capture all aspects of interest within a single image. Because of the curvature and distortion, most such images lead to a perspective view within portions of the image, as is the case for Figure 54.4. In contrast, to help understand the failure sequence and crack coalescence, the fracture surfaces are intentionally captured at oblique angles. Because this complicates sizing, where perspective views are used, they should be supported by imaging that facilitates direct measurements on the OD, as well as the fracture surface. Although the image in Figure 54.4 characterizes cracking that in cross section was IG, traits such as overlapping or adjacent crack segments are similarly evident for TG cracking that has initiated and grown under comparable circumstances. That said, because the circumstances that underlie some aspects of TG cracking are unique, it might be possible to infer the morphology of the cracking based on the appearance of the cracking; for example, where its occurrence is focused along weld seams or along the tape-overlap-gap. Recurrent traits of field failures involving both forms of SCC are highlighted in Figure 54.4. One such trait is highlighted in the inset of Figure 54.4—the presence of secondary cracking. Secondary cracking appears similar to that causing failure, except that they tend to be shorter and correspondingly shallower, and so must be imaged at higher magnification as compared to that for the origin. Inspection of this secondary cracking shows that where SCC occurs many cracks initiate and grow, leading to an array of cracks that is more or less aligned perpendicular to the maximum principal stress (here it is axially aligned). Because the stress field driving SCC can develop in directions other than axial, SCC can be found other than axially aligned. Aside from its directionality and the causes of that directionality, such cracking is otherwise comparable to the axial cracking that is the focus of this chapter. While the array of cracking within a cluster often leads to cracks on planes that tend to be offset circumferentially, such cracks also could lie on the same axial plane. As the origin extends axially, it seeks its axial path of least resistance, with coalescence occurring between adjacent cracking as the crack runs axially. Thus, this path of least resistance develops as the propagating crack shifts circumferentially to intersect other nearby deeper part-through-wall (PTW) cracks, as evident along the rupture path in Figure 54.4. Each circumferential shift leads to the sequential failure of the cracks encountered, which as they fail give rise to the offsets apparent along the fracture path. As this behavior is a consequence of crack coalescence within clusters of SCC, such offsets appear recurrent along field failures. As both forms of SCC lead to clusters of cracks, both forms of SCC show this recurrent trait. A few offsets are indicated by arrows in Figure 54.4, the largest of which is about 0.2 in. (~5 mm). Much larger offsets have been evident along ruptures, whose size depends on the crack locations and factors like the steel’s toughness. Each offset reflects the failure of the ligament between a pair of cracks as they coalesce. Because SCC grows with a PTW profile,7 whereas the deeper portion of the crack grows through-wall, its shallower tips resist failure, which leads to an undercut crack tip as each ligament fails. Undercut offsets are likewise recurrent along axial rupture paths or local to leak paths. If the ligament fails centrally, opposed undercut offsets are evident along either of the fracture surfaces. In contrast, if the ligament fails at either crack tip, then the undercut offset will be evident along one of the opposing fracture surfaces. The larger among the undercuts in Figure 54.4 lie highlighted within ellipses. These offsets and the undercuts, as well as the overall lengths of the cracking, can be sized from imaging of the OD pipe surface, but images of both the OD surface and of the cracking profile are needed to determine which crack segments have coalesced to cause a leak path or a rupture. Perspective imaging done after a failure can facilitate this, whereas quantitative sizing is needed for purposes of crack assessment. To that end, a high-resolution 2D view of the OD cracking imaged in a field dig after some form of magnetic-particle inspection (MPI) could be coupled with depth sizing using advanced UT methods to infer the crack’s profile (as illustrated in Figure 53.19, in Chapter 53). Although perspective imaging cannot be used to directly size features, it provides useful insight into which cracking segments comprise the leak path. Likewise, it can be key to understanding crack interaction and the sequence of coalescence that triggers rupture (see Footnote 6). This subsection uses OM as well as SEM imaging to illustrate the offset steps and the undercuts encountered along a fracture surface, and supplements that with a schematic useful regarding crack coalescence. The image in Figure 54.5a shows a close-up SEM perspective of the coalescence that had occurred between a series of smaller SCC, the origin for which (a hydrotest rupture) lies just beyond the left margin of this image. As this rupture sought its path of least resistance, it sensed a path to weakness through cracking that lay on a parallel plane somewhat below the plane of its origin. Figure 54.5a indicates that the axial propagation of this rupture between these parallel crack planes tracked a path that stepped sequentially between adjacent circumferentially offset preexisting cracks. Each step reflects coalescence and the failure of the ligaments that lay between the tips of several adjacent circumferentially offset cracks, leading to rupture along the crack plane that continues toward the right margin of this image. The largest of these steps was about 2 mm (0.08 in.). The opening of the pipe due to pressure and the dynamic loading associated with ruptures caused the rotation of the ligaments prior to failure, leading to the undercut ligaments evident along this side of the rupture. Figure 54.5 Illustrating small offset steps and undercuts along rupture paths. (a) Small steps and undercuts local to an origin; (b) pairs of undercuts for three adjacent cracks. Figure 54.5b shows the cracking response local to the axial failure of three adjacent cracks. As the inset to this image shows, the intact ligaments evident in this image remain attached to the lower side of this crack path, whereas the failure of the opposed ligaments allowed the middle of this threesome of cracks to remain attached to the upper side of this crack path. It is clear from this inset image that the fracture surfaces along either side of a SCC rupture can show very different fracture features. Figure 54.6a illustrates the formation of offsets and the associated undercuts specific to a crack that lay offset from the main fracture that was located further to the right of the image shown in Figure 54.5. While rather short at just 12 mm (0.472 in.), this crack was deep at 47% of the pipe wall (4.8 mm or 0.188 in.), leading to a low aspect ratio of ~2.5. Figure 54.6b images a slightly shorter but still-intact 7 mm (0.27 in.) long crack that lay near to that in Figure 54.5. Although it was opened somewhat, it was bypassed as the main fracture continued to propagate away from the origin. Because of the semielliptic thumbnail shape of such cracks, the shallower surface-breaking ends of such cracks are more resistant to opening, such that the ligaments tend to fail away from their tips as discussed earlier. Consequently, the central portion of the crack typically breaks free and remains fixed to the adjacent fracture surface, as illustrated in Figure 54.5b. SEM study indicates that the flat vertical surfaces formed as the ligament imaged in Figure 54.6a failed to show evidence of shear and mechanical sliding. The image in Figure 54.6b illustrates the differential resistance to opening along the length of a PTW crack, wherein the crack tips were clearly more resistant to opening as compared to the deeper central portion of the crack. The crack-mouth opening displacement (CMOD) reflects the local stiffness of the remaining pipe wall. Figure 54.6 Effects of crack size on CMOD and the formation of undercuts. (a) Symmetric undercuts local to the origin; (b) crack opening of a shorter shallower crack. Figure 54.7 Illustrating the effect of length and depth on CMOD and undercut formation. The intent of the schematic in Figure 54.7 is to illustrate that for geometrically similar cracking (comparable aspect ratios), the relative dimensions of the undercuts tend to be similar, whereas for cracking with much different aspect ratios, the relative size of the undercuts will differ. Experience has shown that the response of these ligaments due to their loading coupled with evidence of coalescence can be instructive in locating origins and in identifying the crack segments that triggered it. The imaging practices used to characterize SCC were illustrated for typical cracking, to highlight the scope of cracking that can be encountered with this cracking process. A review of those practices indicated that a combination of the usual 2D imaging was needed to suitably document the cracking for purposes of a failure analysis or as input to severity assessment and integrity management. Intergranular and transgranular cracking were contrasted and discussed as background to later consideration of their potential use in identifying the cracking environment. Recurrent traits that arise as a consequence of the multiple arrays of cracking typical of SCC were documented for use later in assessing crack interaction and coalescence. Finally, perspective imaging was used to illustrate those traits and their role in crack coalescence. Experience based on trending the cracking response associated with the early in-service failures indicated that local to their origins, the circumferential spacing between cracks tended to be larger, and the frequency of the occurrence of the cracking tended to be reduced as compared to areas well remote to those failures. Plausible reasons for these trends were identified then and quantified based on fracture mechanics (FM) concepts shortly after those trends emerged [5–7]. On that basis, it was anticipated that cracks closely spaced circumferentially within a cluster would be shielded from the remote stress by their neighbors around the periphery of the cluster—such that they tended to go dormant. Such behavior was indeed evident in field cracking, as becomes evident shortly in Figures 54.8 and 54.9. This same tendency also has been found along the test section of tapered-tension (TT) test specimens [8]. Because stress shielding reflects the role of fracture mechanics, such a response can be anticipated to occur similarly for both IG and TG cracking. Figure 54.8 Axial cracking on OD surfaces in systems experiencing NN-pH environments. (a) Around a leak—through the circled area; (b) remote to an origin—fine, dense cracking; (c) adjacent to a rupture along a weld seam; (d) pipe body remote to an origin—with pitting. Figure 54.8a illustrates the effects of stress shielding for cracking that has formed on pipelines where related sampling under disbonds has shown a NN-pH environment. As evident in that image, the area containing the leak path, which is encircled in the image, shows longer and deeper cracking relative to that around it, which on one flank is rather free of secondary cracking. Selected imaging follows in Figure 54.8—all for cracking where related sampling has shown a NN-pH disbond environment. Thereafter, Figure 54.9 presents select imaging follows for systems where sampling has indicated high-pH disbond environments. While not comprehensive, these images are typical and so provide broader insight into the traits of axial SCC evident on the pipe’s OD surface. Figure 54.9 Cracking on the OD of pipes in systems experiencing high-pH environments. (a) Hydroleak (circled)—few upper-flank cracks; (b) in-service leak (circled)—crack-free flanks; (c) remote to origin in the pipe body—sparse; (d) remote to an origin in the pipe body—dense. The traits evident in Figure 54.8a can be found to some extent in each of the images in Figures 54.8 and 54.9. Areas where deeper, longer cracking forms tend to develop independent of areas where the frequency of the cracking and its circumferential spacing of the cracks is higher. Empirical trending as well as the FM analysis indicated that the closer-spaced more frequent cracking—termed “dense” cracking—formed at circumferential spacings less than ~20% of the wall thickness on either or both sides of a crack cluster [5–7]. Subsequent work involving failure analyses of thinner-wall pipelines suggested that the original criterion should be amended with an upper bound on the spacing set at about 0.1 in. (2.5 mm). Clusters with larger circumferential spacings were termed “sparse” cracking. The imaging in Figures 54.8 and 54.9 involves clusters of cracking under a common disbond. While not broadly illustrated in this imaging, areas are found that are crack-free between the clusters within a colony of SCC. Such areas when found under larger common disbonds associated with weld seams, like that shown in Figure 54.8c, indicate the influence of tenting and the locally increased stress, which when it exceeds the thresholds for crack initiation and then crack propagation selectively promotes SCC. Stress raisers such as dents, bends, offset welds, and deeper scratches (gouges) thus become favored sites for SCC. Crack-free areas found between clusters under larger disbonds remote to stress raisers reflect the subtle differences in the composition, the microstructure, and the surface condition, which made those areas more resistant to SCC. Figure 54.10 trends the depths of cracking normalized by the wall thickness across a range of cracking whose scope is representative of that shown in Figures 54.8 and 54.9. That range of crack depths has been broadened to include depths that could threaten rupture, which for purposes of Figure 54.10 includes data for hydrotest breaks, as well as for in-service leaks and ruptures. Data representative of the cracking illustrated in Figures 54.8 and 54.9 are represented in Figure 54.10 by results gathered from crack sampling on pipe joints cutout in a series of eight digs done during rehabilitation to manage threats other than SCC. In total, the lengths of many hundreds of cracks were physically sized based on digitally expanded optical images of their OD surfaces, which had been captured during wet-contrast MPI. The lengths for these were based on through-wall serial sectioning done to quantify the depth profile as a function of their length. From that, average crack depths were determined within clusters of cracking as a function of their contiguous lengths as sized on the OD prior to sectioning. Those results were supplemented by data gathered from 19 hydrotest breaks and from sparse secondary cracking local to in-service failures. The depths for the field failures were digitally profiled based on quality optical imaging of their fracture surfaces, doing so as a function of position along the crack front. As for the digs, length was defined as the tip-to-tip distance across the contiguous crack segments measured on imaging of their fracture surfaces. Figure 54.10a presents the normalized cumulative frequency of cracking for these datasets after parsing them as dense or sparse based on their circumferential spacings. This figure indicates that the hydrobreaks developed the deepest of the cracking sizes (as expected), which in all cases showed sparse spacings. In contrast, the vast majority of cracking sized for the field digs exhibited very shallow depths. All of the very shallow cracking showed dense circumferential spacings. In the format of Figure 54.10a, dense spacings are anticipated to trend close to the x-axis, whereas the crack segments associated with leaks are anticipated to trend at or toward a/t = 1, with the ruptures falling close to them. Sparse cracking not associated with the leak path or the hydrotest breaks (ruptures) is anticipated to trend between the ruptures and the dense cracking. Seven clusters that developed sparse circumferential spacings were found among the many colonies sized for these field digs. As expected, their depths fell along a trend that lies above the very shallow dense spacings and below the deeper cracking evident for the hydrotest breaks. Figure 54.10b parses these datasets further in regard to their crack aspect ratios (crack length, 2c, divided by its depth, a) as a function of their normalized average crack depths, a/t. Recognizing that an aspect ratio of 2 reflects a point-source growth (PSG) process developing from the OD surface, and that scatter is inherent in SCC processes [9], aspect ratios greater than 1 and less than or equal to 3 have been considered representative of point-source cracking and are flagged in the symbol key accordingly. This symbol key first indicates the crack spacing as dense or sparse, followed by the data source, and finally, whether the cracking showed PSG or nonpoint-source (NPS) response. The lowest aspect ratio among the sparse cracking was 1.79, whereas the lowest for the dense cracking was 1.49. As no aspect ratios close to 1 or less were found for this cracking, the symbol key is absent a lower-bound symbol for PSG. Aspect ratios for the dense PSG cracking as defined above clustered near 2, whereas dense NPS growth led to values much larger than 3, the highest being 14. The range of values for sparse cracking was comparable to that for the hydrotest breaks, the highest being a little larger than 9. Figure 54.10 Trending normalized crack depths and the crack’s aspect ratios for IG cracking. (a) Normalized crack depth cumulative frequency; (b) aspect ratio as a function of crack depth. It is apparent in Figure 54.10b that the deepest of the dense cracking for these datasets grew to just 6.9% of the pipe’s thickness, and that the dense and sparse cracking both lead to some quite large aspect ratios, the highest occurring for dense cracking as noted above. Likewise, it is apparent that dense cracking in a system that has experienced high-pH ruptures remained quite shallow as it grew along the surface to lengths that for this cracking reached 0.62 in. (~16 mm). Similar behavior has been observed for field cracking on pipelines experiencing NN-pH failures [10], with that work concluding that the “cracks tend to be long and shallow…” The initiation and growth of cracking along the pipe OD surface, as evident in the high aspect ratios for shallow cracking in Figure 54.10b, is anticipated for cracking processes that are reliant on microplastic flow, like SCC. This follows from the observation that at the surface, there are grains favorably oriented for slip, with their flow process enhanced by the effect of the free surface—as was elaborated in the prior chapter. Initiation is thus favored around or across such grains, motivated by their locally incompatible displacements. Growth across the free surface is likewise favored. In contrast, as the depth below the surface increases, confinement develops due to the presence of adjacent grains, which rapidly constrain flow as the depth increases. For this reason, the free-surface effect and related driving force for initiation and growth reduce as the crack deepens. Figure 54.10b also shows that the frequency of occurrence of the dense cracking drops sharply at a normalized depth of just 6.9% of the pipe wall. Whether or not this sharp drop in occurrence corresponds with the transition to crack growth into the depth direction is explored later based on a detailed fractographic study of the crack initiation and growth process. A portion of the ACS data introduced for field cracking regarding Figure 53.17 (in Chapter 53) has been parsed and reformatted here to assess potential differences in the cracking speeds between dense and sparse clusters. Sparse cracking could be sourced from clusters of secondary cracking that lay close to an origin, whereas dense cracking could be sourced from sites well remote to origins. While these differing sites could effectively parse dense and sparse cracking, their cracking environments, microstructures, and stress histories would differ. Such differences preclude their pooling to isolate and contrast values of the ACS specific to crack spacing. Accordingly, to minimize those differences, data were sought for cracking that had developed within colonies that contained adjacent clusters that showed dense and sparse spacings based on MPI imaging. Five suitable areas of cracking were found that were located under common disbonds whose overall area each was 1650 cm2 (~264 in.2) or more. Each showed adjacent clusters representative of dense versus sparse cracking, with each such data pair being identified by site, then numbered 1, 2, 3A, 3B, and 4. All cracks were sized and processed as in Figure 54.10. The exception to this was that the crack profiles for several clusters were sized using serial sections obtained from sequential grinds that targeted a cut depth of 0.005-in. (0.127 mm). While tedious, this process produced profiles smooth enough to more reliably determine the maximum depth, as well as the average crack depth across contiguous crack segments. As for Figure 54.10, these measured sizes reflect accurate repeatable practices, leading to physically measured sizes—which some refer to as “truth” data. Values of the ACS were determined as the average of the measured maximum crack depths within a cluster, and the time interval between the date that the cracking was removed from service and the construction or in-service date. Figures 54.8 and 54.9 have shown that clusters of field cracking typically contain a wide range of crack lengths (and also depths based on Figure 54.10). The variability introduced by this behavior has been limited for present purposes by representing the response within each cluster by its average crack speed. In a related vein, the prior chapter has shown that the cracking speed in the field decreased rapidly early in the growth process, whereafter the rate of decrease slowed sharply. The variability introduced by this behavior has been minimized for present purposes by considering cracking sourced from pipelines whose first in-service failure had occurred more than 30 years ago. Against this background, Figure 54.11 trends the normalized cumulative frequency or cumulative distribution function (CDF) of the ACS for field cracking. Figure 54.11 CDFs of crack depth and speed for dense and sparse field datasets. (a) Dense and sparse field data; (b) detail in part (a) with the y-scale expanded. Figure 54.11a presents the CDFs developed for the five sets of co-located dense and sparse clusters. Cracking whose circumferential spacing was sparse has been shown as open symbols and denoted in the symbol key by the suffix S adjacent to the shared cluster number. Data grouped as dense spacings have been shown as the solid symbols and denoted by the suffix D adjacent to its shared cluster number. In total, these CDFs represent more than 200 cracks that were pooled within each cluster and represented by their average depths. Figure 54.11b presents the same data as in part (a), except that the y-axis scale has been expanded to clarify the response at lower speeds (equally shallower average crack depths). Inspection of Figure 54.11, which reflects dense and sparse cracking under a common disbond, shows that such cracking occurs at speeds from near zero, up to ~3.41 × 10⁻⁹ mm/sec (~1.34 × 10⁻¹⁰ in/sec). This is slower than that evident for much of the longer-term field cracking that was considered in Chapter 53. Observe that for each of the clusters represented in Figure 54.11, the dense cracking grows at speeds less than that for the sparse cracking. Note too that for these data, the ACS begins to increase at a normalized depth of ~10% of the wall thickness. Inspection of Figure 54.11 indicates that each of the five clusters of cracking represents a range of cracking depths—the deepest being that for Cluster 4, whereas Clusters 1 and 2 were the shallowest. Such differences in depth for cracking under what were common disbonds could be due to their initiation at different times. It also could be due to their initiation under a common disbond in areas of locally different susceptibility—which underlies the occurrence of large uncracked areas as evident, for example, in Figure 54.8a. Finally, it might trace to disbonds that formed at different times, which over time merged into the disbond found as the pipe was daylighted. Yet another plausibility is that each of these clusters experienced differing periods of dormancy. While all these are plausible, it is thought probable that these differences trace to differences in susceptibility that affect different initiation times and thus differing average crack speeds. While forensic analysis cannot discriminate between the just-noted plausible scenarios, these results suffice to demonstrate that the ACS is greatest for sparse cracking and that the average speed can be very slow for field cracking. As indicated earlier, similar trends are anticipated for pipelines operating in NN-pH environments, in that such cracking reflects the same overarching effects of stress and stress shielding. As indicated earlier, such behavior has been evident on pipelines operating in NN-pH environments, in that such cracking has been reported to grow faster along the surface for shallow cracking [10]. Empirical trending of large populations of cracks has considered cracking frequency, crack-tip spacings, crack aspect ratios, and average cracking speeds. These results indicated that populations of IG and TG cracking behaved similarly. Those crack populations when parsed as dense versus sparse relative to their circumferential spacings were found to behave very differently. The dense cracking tended to grow along the surface but failed to grow into the depth to more than 10% of the wall thickness, beyond which the ACS showed a steep increase. Sparse populations initiated fewer cracks, but those that did showed the potential to continue to grow into the pipe wall and so could threaten integrity. Finally, it was observed that dense cracking consistently grew at lower ACSs as compared to their sparse counterparts. Key takeaways from the data considered include Figures 54.12 and 54.13 supplement the OD pipe-surface imaging shown to this point, respectively, for systems typically experiencing NN-pH and high-pH SCC. These images complement those already discussed, providing a broader perspective on the traits of axial SCC as seen in service. Inspection of the images in Figures 54.12 and 54.13 shows that both forms of SCC (i.e., high-pH and NN-pH) exhibit similar tendencies. This reflects the observation that initiation for both tends to favor areas of microplastic flow, with continued growth likewise dependent on stress and the tenants of fracture mechanics. All images show areas of the pipe surface that are crack-free scattered between clusters of cracking that have formed within a colony of cracks, which lay under a common disbond. Whereas the stressing conditions and the cracking environment are nominally similar—crack-free areas have been found in the midst of disbonds. On that basis, it can be concluded that over quite small distances, the microscale factors that affect susceptibility differ. As such, the field evidence just reported supports the conclusion since the 1970s that metallurgy can be a major factor controlling pipeline SCC—locally, as well as globally. It follows that the stress and environmental factors discussed in regard to Figure 53.12 (in Chapter 53) operate at a very local scale on a backdrop of the steel’s composition and processing. It also follows that the ACS varies from crack to crack within a cluster, as well as cluster to cluster within a colony. It is for this reason that the ACS was quantified in Figure 54.11 using the average speed for a cluster, which was determined relative to more than 200 cracks found within adjacent sets of dense and sparse clusters. Consistent with the just outlined role of stress, inspection of the above-noted figures indicates that the occurrence of SCC favors stress raisers, like that around welds, and/or within metal loss due to local corrosion and also pitting. While it is clear from Figure 54.12e that a long-seam weld toe has been an origin for field ruptures, the presence or absence and extent of such cracking are conditional on many factors. For example, in contrast to Figure 54.12e, the image in Figure 54.8c showed widespread cracking with little dependence on the distance from the toe—with the location of the cracking, in this case, being conditional on environmental access and its containment below the weld reinforcement. Yet, this same scenario led to sparse cracking as evident below the weld toe shown in Figure 54.13d—where just a few cracks have grown. Given that the local presence of the stressing conditions and cracking environment can support extensive cracking below weld toes (cf. Figures 54.8a and 54.12e), sparse cracking like that apparent in Figure 54.13d apparently reflects steel that is resistant to cracking. Such also is a factor in the case for the girth weld (GW) shown in Figure 54.13c and for the low-frequency (LF) electric-resistance weld (ERW) seam shown in Figure 54.13d. Regarding the GW, SCC was resisted except very close to two sites around the weld—where local differences in the cap-pass geometry and stresses likely were contributory factors. The intact ERW seam exhibits localized evidence of cracking focused over a short distance within the upset—but here too the microstructural gradient across the seam and the stress field induced in making this autogenous seam can differ. That said, given the length of weld seams that have remained crack-free, locally increased stress only becomes a factor when it raises the local stress above the threshold for initiation. SCC appears to be more prevalent along seams for NN-pH cracking—but this might be more dependent on the prevalence of tenting of the tape coating, than on the cracking environment. It follows that stress raisers favor the occurrence of SCC.8 Figure 54.12 Additional OD surface imaging typical of systems experiencing NN-pH SCC. (a) Fine, dense axial cracking remote to an origin; (b) similar, but tending to sparse; (c) mixed axial cracking parallel to the fracture; (d) sparse axial cracking below a DSAW seam; (e) axial cracking at and nearby a DSAW toe origin; (f) axial body cracking in localized general/pitting corrosion; (g) similar, but within a tape overlap. SCC in the presence of localized general or pitting metal loss also reflects the role of stress, which, as for the welds, becomes a focal point for cracking when it elevates the local stress above the threshold for cracking within the locally thinned area (LTA). Figure 54.12f and g are typical of SCC associated with general corrosion that has thinned the pipe wall, with SCC likely in clusters throughout that thinning. Although the images shown are typical of NN-pH SCC, both forms of cracking have been found associated with external corrosion. That said, wall thinning due to the many forms of internal corrosion known to occur in pipelines likewise has caused leaks and ruptures due to both forms of external SCC that had initiated local to the internal LTA. Figure 54.13 Additional OD surface imaging typical of systems experiencing high-pH SCC. (a) Sparse/dense mix of axial cracking remote to an origin; (b) similar, but tending to sparse; (c) axial cracking origin centered at a GW; (d) axial cracking in a LF-ERW upset and adjacent to it; (e) axial cracking that locally caused a bulge to form; (f) axial cracking at an origin. Finally, SCC can be anticipated local to bulges. For the cases known to the author involving a bulge, each has formed due to the presence of a deep cluster of cracks, which weakens the OD surface of the pipe wall. As the bulge grows due to the increasing size of the SCC the local stress increases, tending to make the bulging process autocatalytic. The depths of the cracking for the bulging shown in Figure 54.13e ran to a maximum depth of 51% of the wall thickness. Given the lengths of the crack segments in Figure 54.13e, it is not a surprise that a bulge formed. Regardless of the circumstances that promote SCC, if it grows to a critical length at its current depth then rupture ensues. Several images illustrate the range of features that can form along a rupture path, notably Figures 54.4, 54.12c, e, and g, and Figure 54.13c and f. Each of the recurrent traits of both forms of SCC earlier noted—secondary cracking, offset steps, and undercut ligaments—can be identified in these images as the rupture sought its axial crack path of least resistance. For example, as the axially extending crack intersects prior-existent thumbnail cracks, its axial path shifts laterally, creating offsets along its path (see Figure 54.4). These offsets provide bridges to adjacent crack tips, which, as Figure 54.5 shows, create undercuts as the ligaments between their crack tips fail. While the fracture paths created by a rupture can appear very different (cf. Figure 54.4 with Figure 54.13f), these crack paths are essentially the same—as they differ only in the relative initial distance between the crack tips and how they coalesced. While Figures 54.1 through 54.4, 54.8, and 54.9 were effective for the purposes they were introduced, they presented a very limited view of IG and TG cracking as it presents in service. The imaging in this subsection extended their scope. As expected, this imaging documented the selective field occurrence of SCC in regard to higher local stresses, the selective presence of a cracking environment, and a steel whose surface condition and microstructure favor cracking in that environment. Although not elaborated, the role of the coating type and condition was a factor in many of the cases illustrated, particularly so for the cracking local to weld seams. As indicated earlier, the proximity between initiated cracking also is a major factor influencing the initiation and growth of SCC under a common disbond, and so its appearance on the OD surface of the pipeline. Interaction occurs when adjacent cracks “sense” the presence of their neighbors in regard to their stress-strain/crack-tip fields. As the stress intensity factor K is quantified in terms of remote stress and crack size, its value is nonzero everywhere—provided that the values of the remote stress and crack size are finite. On that basis, the K-fields of any two cracks interact regardless of their spacing, such that understanding interaction does not discriminate what cracks might combine to fail. Thus, interaction is a nondiscriminating precursor to the crack growth that bridges the gap between any pair of adjacent crack tips. That growth affects the merging or coalescence of the adjacent tips into one crack, whose depth then grows commensurate with its current length and its loading. Such growth via SCC requires an imposed K that exceeds the threshold for macrocrack crack growth by SCC. Likewise, such growth via ductile fracture requires an imposed K that exceeds the threshold for macrocrack crack growth by stable tearing. It follows that interaction and coalescence reflect very different physical processes: interaction sets the stage for coalescence, whereas coalescence involves the growth that bridges the gap between adjacent cracks—but only when the local circumstances support that growth. In other words, interaction simply indicates that adjacent cracks sense each other and that their coupled effect exceeds their individual effect. Interaction does not quantify if adjacent interacting cracks would or could cause failure. Their failure requires coalescence—by SCC, or by stable tearing, or some other mechanism, which physically bridges the gap between adjacent crack tips. As noted earlier, imaging on the OD and the fracture surface is needed to assess which crack segments combined to trigger failure, and the relative proximity between their tips. In contrast, from a fracture mechanics perspective what is best imaged on the OD is characterized in terms of the full 3D nature of the cracking, the strength and fracture properties of the pipe, and its dimensions. That said, provided the pipe is thin-walled and has a large-diameter, flat-plate solutions can be reasonably adapted to quantify such aspects (e.g., Ref. [11]). As indicated earlier, coalescence can occur only if the crack-tip fields between adjacent cracks exceed the threshold for growth between their adjacent tips. That growth can occur by different mechanisms, and develop stably over time, or the cracking could become axially unstable as it grows. Stable growth can occur by SCC (or similar cycle and/or time-dependent mechanisms like fatigue), which traverses the gap between the adjacent tips driven by the in-service loadings. For SCC, this requires that K ≥ KIscc at a d ≥ dTH at one or both of the adjacent crack tips. Stable growth also can occur by ductile tearing, either in service or during a pressure test, which locally requires J ≥ Jc at one or both of the tips. As for stable growth by SCC, growth following the onset of stable tearing is required to bridge the gap between the adjacent crack tips. That growth can occur very slowly at near-constant pressure in service, whereas it develops more rapidly as the crack-tip field becomes increasingly intense as the pressure rises and the crack grows [12]. Unstable failures can be triggered either in service or during a pressure test by growth due to either SCC and/or stable tearing, which occurs if the growth of the coalesced crack length exceeds the critical length for that pipeline at the current pressure and crack depth. Based on fracture mechanics concepts, until the onset of coalescence between a pair of adjacent cracks, they exist and grow as independent features subject to the locally elevated complex crack-tip field that develops between their interacting tips (e.g., Refs. [7, 13]). Figure 54.14 identifies the symbols involved relative to the crack geometry and illustrates the symbols used to characterize the locations between and along adjacent pairs of cracks. The notation here is usual for fracture mechanics analysis. The error that develops in approximating an adjacent pair of cracks by a single crack varies with their spacings and the angular position around the crack fronts of the adjacent cracks. That error can be inferred relative to the results of Ref. [7], wherein the normalized crack-driving force, F, was quantified for the three modes of cracking, over a wide range of adjacent crack-tip spacings for the case of geometrically similar crack pairs. As Ref. [7] presents the details, suffice it here to outline the situations considered and to illustrate the outcome in terms of the resulting error for Mode I cracking. Prior work has established that until their crack tips coalesce to become one crack, they continue to grow as independent features [7, 13]. Their locally elevated crack-tip fields evolve as the cracking grows to eventually develop a common semielliptic crack front across their tip-to-tip length (e.g., Ref. [13]). Once coalesced, the complex crack-tip field developed can be approximated using fracture mechanics, or where collapse controls failure it can be represented by an isolated area-equivalent crack. The latter approximation approaches physically realistic, and tends to be exact, as the shape of their complex crack front achieves its final semielliptic shape. Prior to coalescing and developing a common crack front any pair of interacting cracks exist in fracture mechanics concepts as independent cracks with a decreasing spacing between their tips (e.g., Ref. [13]). The error that develops in approximating an adjacent pair of cracks by a single crack from the onset of coalescence varies with their spacings and the position around their crack fronts, as outlined in Figure 54.15. The extent of that error can be inferred by reference to the results of Ref. [7], which presented the background and related details, and quantified a normalized crack-driving force, F, for cases involving geometrically similar crack pairs. Suffice it here to outline the situations considered, and to illustrate the outcome in regard to Mode I cracking. Figure 54.15a illustrates the scope of the analysis scenarios considered for the case of coplanar cracking, while Figure 54.15b presents values of the Mode I driving force, FI, across that set of geometries. Results for other combinations of crack pairs can be found in Ref. [7]. Inspection of the trends in Figure 54.15b indicates that that the error made by immediately assuming that the cracks have coalesced ranges from their isolated to their fully coalesced states. The numerical modeling of Ref. [7] indicates the resulting crack-driving force is overly conservative for coplanar pairs by the order of 27%. It follows that it is much more realistic to characterize the growth response during this process in numerically quantified incremental stages. This is particularly so for cases where SCC affects coalescence, as it can lead to differences in failure times on the order of years. Tracking coalescence via SEM indicates that coalescence occurs slowly when the growth occurs stably by SCC, with “islands” of the pipe wall forming as a consequence of the bridging that develops between the tips of adjacent overlapping crack tips. Figure 54.16a illustrates one such island that will fully form once the adjacent pair of crack tips coalesce completely. For this pair of adjacent crack tips, the value of 2b/t was small, at just 0.053. Trending of finite-element analysis (FEA) results in Refs. [5, 7] indicates that the growth of this almost coplanar crack pair could be idealized sequentially as coplanar cracks, as was illustrated in Figure 54.15a. In contrast, where the driving force suffices to support stable tearing between offset crack paths, their coalescence can be slow, or instantaneous, depending on the fracture and mechanical properties, and other circumstances [12]. As illustrated by the large crack offset shown in Figure 54.16b, large gaps can be bridged between offset cracks depending on the steel’s toughness. It follows that quantifying crack coalescence and the rate that it progresses requires thresholds and crack growth data that are specific to the mechanisms that drive the cracking. Figure 54.14 Schematics that characterize the analysis of adjacent crack pairs. (a) Symbols specific to an isolated crack; (b) symbols relevant to adjacent pairs of cracks. Figure 54.15 Characterizing the interaction analysis of adjacent crack pairs. (a) Crack positions during coalescence; (b) crack-driving force versus spacing. It is apparent from the split image shown in Figure 54.16a that the bridge between adjacent crack tips is not yet complete—although it is nearly so. The scale in Figure 54.16a is roughly one-tenth that of the stable than unstable tearing that underlies the image shown in Figure 54.16b. This difference in relative scale does not infer that coalescence occurs at a smaller scale for SCC than for stable tearing. Rather, because the threshold for growth via SCC is small in comparison to that for growth via stable tearing, the onset of coalescence by SCC can be triggered over large distances. Because the ACS for SCC is very low, the crack path has time to respond to the evolving crack-tip fields as the crack advances, which is evident in Figure 54.16a in the gradual changes in the direction of the crack path. The larger threshold for stable tearing means that coalescence by stable tearing will develop between less distant crack tips. In the case of Figure 54.16b, coalescence has occurred over a distance on the order of 1-in. (25 mm). That said, this and related imaging indicate that its coalescence began via SCC, then transitioned to stable tearing as the initial tips of this crack pair grew closer, which once at a critical length triggered unstable tearing and this in-service rupture. Industry guidance indicates that SCC progresses slowly toward failure at an average speed of the order 0.3 mm/year (0.012 in./year). In contrast, stable tearing can grow much faster [12], at speeds that tend to be instantaneous as rupture ensues and shear bridges the gap between the crack tips. Figure 54.16c trends coalescence as a function of the final or the interim crack sizes for a range of circumstances, which includes the results for Figure 54.16a and b. The term “coalesced” means that the crack tips between adjacent cracks have merged (i.e., fully coalesced, as evident in Figure 54.16b). The term “not coalesced” involved cases where coalescence was underway, but the tips had not yet closed onto the other crack (partially coalesced, as evident in Figure 54.16a). Thus, the crack sizes noted for partially coalesced cracking are interim indicators of fully coalesced cracking. Whereas the smallest of these cracks reflect the complete bridging between adjacent crack tips by SCC, as the crack sizes become larger there is a gradual shift away from growth (coalescence) by SCC toward stable and then unstable growth by ductile tearing. Given that the results plotted in Figure 54.16c tend to be dominated by the early SCC failures, which for the most part occurred in pipelines that were built from the late 1940s into and through the 1950s, the data shown reflect lower- to moderate-toughness steels (i.e., 15–35 ft-lb (20–47 J) full-size equivalent (FSE) Charpy-Vee plateau (CVP) energy. If data for much higher-toughness steels had been included, then the plot’s length scales would continue through somewhat longer interim and coalesced crack sizes. Figure 54.16 Crack coalescence between adjacent crack pairs. (a) Nearly coalesced by SCC (two different cracks); (b) coalescence by SCC then unstable tearing; (c) coalescence trends as a function of crack size. (Adapted from Ref. [11].) Observations, technical issues, and useful takeaways based on the analysis, trending, and imaging of coalescence include To this point, only one fracture surface—associated with a leak—has been imaged and discussed (see Figure 54.1). As noted in that discussion, 2D images of the 3D cracking process could be instructive concerning (1) the depths of the crack segments potentially contributory to a rupture origin; (2) the plausible combinations of crack segments and sequences of their coalescence as the cracking grows beyond its origins; and (3) the nature of initiation and early growth. Many images could be shown to illustrate SCC on the pipe’s OD surface, on fracture surfaces, and in x sections. That said, the sizes of the crack segments that would be evident, and their combinations that could promote a leak or a rupture, or remain stable, are circumstance-specific—independent of whether they fail as a TW leak through an axially stable crack, or as a rupture via axial coalescence and unstable cracking. The relative stress in the pipe wall (reflects the pressure, Grade, and wall thickness) and the toughness of the pipe steel coupled with the wall thickness are important discriminators in this context. For example, long deep cracks can survive high-pressure hydrotests in tough steels or in pipelines operated at low hoop stress (e.g., Ref. [16]). Heavier-wall designs (for a corrosion allowance, or to manage the risk profile, etc.) can rupture before they leak; but this can’t be generalized given the coupled role of factors like toughness. It follows that while instructive, the crack segment sizes and their coalescence apparent in such images provide little practical insight into how or why a cluster or a colony of SCC failed. Accordingly, this subsection presents a select few illustrative images: first for cracking local to origins leading to rupture, then for origins leading to leaks, and finally for still-stable cracking, leading to useful insights into SCC nucleation and growth, and some trends. Figure 54.17 presents four views of fracture surfaces typical of the axially coalesced cracking that develop within SCC in the body of the pipe, remote to stress raisers or other factors that affect the in-plane locations of the cracks. Independent of such factors, as noted earlier, the axial coalescence of cracking is controlled by fracture mechanics and the associated thresholds for crack growth. Because mechanics controls for a given crack configuration, the traits evident on fracture surfaces are similar for NN-pH and high-pH environments—all else being equal. With one exception the images that follow are shown at about the same scale. All are shown with the OD surface up, and all represent failures in steels produced in the late 1940s into the early 1960s. On that basis, their toughness could be considered comparable, with FSE CVN energies typical of lower- to moderate-toughness steels. As expected, an inspection of the images in Figure 54.17 shows adjacent often coalesced crack segments along the rupture path. Because remote to stress raisers a cluster of cracking is seldom an aligned array, offsets and undercuts form as coalescence occurs, and the path extends axially, as variously evident in these images. Occasionally, full thumbnail-shaped features are evident, but more typically only a portion of each crack segment is evident. For these reasons, opposing fracture surfaces along a crack can appear quite different.10 Comparison of these surfaces and others like them indicate that all are similar—yet each is unique to the initial in-plane locations and sizes of the cracking that coalesced to trigger the rupture or was intersected as a rupture ran axially along the cracking. The in-line inspection (ILI) and in-ditch inspection (IDI) technologies deployed to ensure the integrity of a pipeline over its next reinspection interval ideally would preclude ruptures like those imaged in Figure 54.17. It follows from the imaging shown in Figures 54.8 and 54.9, and in Figures 54.12 and 54.13 that these inspection technologies must characterize potentially complex arrays of cracks. One critical element of the integrity management (IM) assessment of such cracking involves determining: Figure 54.17 Portions along rupture paths reported to contain the origin (OD surface up). (a) Showing several offset segments—two of which are quite large—and also one noticeable undercut; (b) showing many offset segments—one very large undercut is evident, as is a smaller one; (c) showing several offset segments—two undercuts also are evident (SEM image); (d) showing many offset segments—several undercuts also are evident. In view of Figures 54.14 and 54.15, such IM analysis requires outcomes from the ILI and in-the-ditch technologies that quantify the lengths and depths of the many adjacent SCC cracks and their in-plane locations, and tip-to-tip spacings. Work to date indicates that step gains appear necessary before the threat of this insidious momentary transition from stable to unstable cracking can be reliably avoided based solely on the output from the crack-detection tools. A final point of concern regarding ruptures involves isolating the “origin,” which comprises just the crack segments that coalesced to trigger the rupture, from within the string of cracks intersected as the rupture ran axially. Unfortunately, the set of crack segments that comprise the origin is seldom self-evident among the string of coalesced crack segments intersected adjacent to it, except for cases involving brittle initiation. Isolating “origins” typically requires assessing the fracture features evident on the OD surface of the pipe, and occasionally the ID surface also, to identify local indicators of the crack’s direction. Origins typically involve the largest among the coalesced crack segments that lie between opposing undercuts—either of which might lie on the opposing fracture surface. In addition, they typically lie at the apex of the “fish-mouth” that forms as the rupture opens. Confidence that the candidate combination of features was the origin often is best developed using SEM analysis, coupled with viable fracture mechanics analysis of crack coalescence, subject to the steel’s properties and the loadings based on SCADA pressure data and informative site data. Figure 54.18 presents three views of fracture features typical of the leak paths that formed as axially coalesced cracking grew TW, prior to its length becoming critical. As for the ruptures, this SCC occurred in the body of the pipe, remote to stress raisers or other factors that affect the in-plane locations of the cracking. As for the ruptures, fracture mechanics coupled with the coalescence criteria controls this cracking path, with the traits evident for these leaks being similar for SCC in NN-pH and high-pH environments. As above, these fracture surfaces are shown at roughly the same scale to facilitate comparison among these leaks, as well as the ruptures shown above, the exception being the shortest among them. Again, all are shown with the OD surface up and represent leaks in steels with comparable lower to moderate toughness. All represent images obtained after the cracking was opened in the laboratory after it had soaked in liquid nitrogen (LN). As such the lighter/gray areas reflect brittle fracture, while as for the ruptures, the darker/black areas indicate SCC. Figure 54.18 Cracking and coalescence leading to TW leak paths (OD surface up). (a) Five offset segments—three of which were large (indicated by the arrows); (b) three offset segments—two of which were large, and contained the central segment; (c) two offset segments—each of which was evident on the opposing fracture surface. As expected, these images show a series of adjacent crack segments whose traits are otherwise similar to those for the ruptures. The only significant difference is that this cracking grew TW and was detected as a leak before its length reached critical. On that basis, leak paths often form in shorter clusters or in isolated SCC. Offsets are often evident, but while undercuts do form none is evident at the scale used to show these fracture features. Full thumbnail-shaped features are evident occasionally, but because the cracking was opened mechanically the crack segments typically involve only the portion of each individual crack that remained on that fracture surface being viewed. Such was illustrated earlier in regard to Figure 54.5b (see Footnote 10). Comparison of these surfaces and others like them indicate that each is similar—although recurrent traits like offsets and undercuts tend to be smaller and so not easily imaged. While similar in their recurrent traits, as for the ruptures each is unique in regard to the in-plane locations and sizes of the cracking as they grew TW. While isolating the crack segments that combined to trigger a rupture can be a challenge, the origin of a leak path is typically self-evident at the site where the cracking broke TW. Figure 54.19 presents a view of the fracture features typical of nonleaking still-stable cracking. As for the ruptures and the leak paths, this SCC has formed as crack segments coalesced axially, in the body of the pipe, remote to stress raisers or other factors that affect the in-plane locations of the cracking. This image was obtained after the cracking was opened following a long soak in LN. It follows that the lighter/gray areas in this image reflect brittle fracture, while as with the ruptures the darker/black areas are indicative of SCC. As for the leaks and ruptures considered, this stable cracking developed absent factors that affect where SCC occurs, like stress raisers. Likewise, fracture mechanics controlled the interaction and the eventual coalescence between its crack segments, indicating that the traits evident at ruptures and leaks are similar for still-stable SCC regardless of the cracking environment. To facilitate comparison with the leaks and ruptures, the image shown has been presented at roughly the same scale as those above, with the OD surface shown up. As above, while several such views could be shown, all would exhibit the presence of multiple sometimes overlapped thumbnail segments of various depths and lengths, specific to the origins for that cracking, so multiple imaging has little merit. Finally, as above, this image represents SCC in steels with lower to moderate toughness. As for the fracture surfaces shown for the larger cracks used to illustrate the leaks and ruptures, this image shows a series of adjacent crack segments whose traits are otherwise the same as was apparent in the recurrent features noted for the leaks and ruptures—except that these cracks are physically shorter and shallower. This decrease in size is to be expected in that this cracking had not grown to a size that could cause a rupture or leak. It also is apparent that as yet not all crack segments had coalesced axially. As the cracking is smaller, the offsets and undercuts are smaller, making them difficult to identify at a scale comparable to that used to show the leaks and ruptures. That said, such traits can be discerned at much higher magnification. Figure 54.19 Cracking and coalescence typical of secondary cracking near a rupture origin. Complete thumbnail-shaped features are likewise evident at higher magnification, but as for the leaks and ruptures the crack segments often involve only the portion of each individual crack that remained on that fracture surface being viewed (see Footnote 10). Comparison of the traits along the fracture surface of this still-stable cracking with those for the leaks and ruptures indicates no differences—save for their relative sizes and shapes. Again, each is unique and specific to the in-plane locations and sizes of the cracking as it initiated, coalesced axially, and grew into the pipe wall. Additional views of PTW cracking can be found in later sections, along with imaging of other leaks and ruptures. Consider now the traits of SCC as the crack size decreases to the scale of the microstructure, which for line-pipe steels prior to the later 1960s often showed average ferrite grain sizes in the order of 30–10 μm (~0.0012–0.0004 in. or ASTM #7 to #10). Figure 54.20 images cracking that was coincidently found on the OD surface of a pipeline during SEM analysis being done to characterize cracking that had coalesced to cause an in-service IG SCC rupture. This otherwise isolated patch of cracking lay in an area that appeared to be highly susceptible steel. In turn, these short cracks lay within an area of light corrosion under the same disbond as the much larger cracking that triggered the rupture. In view of the circumstances that underlie this cracking, it is very plausible that many field failures develop similarly from cracking that lay within relatively small patches of highly susceptible steel—which in part helps to explain why SCC has remained difficult to manage. Given the size-scale in Figure 54.20a, and the grain sizes noted above, this figure’s width ranges from about 18 to 56 grains, whereas the crack lengths range from ~10 up to ~75 μm (0.0004–0.003 in.). Part (b) of this figure shows the details of such cracking at slightly higher resolution, wherein the lengths of the smallest cracks are a fraction of the average grain size. Notice the large number of cracks that were initiated within this very small area. Given that the scale of this cracking is comparable to that of the microstructure, its traits might be expected to differ somewhat from the cracking imaged in Figures 54.17 through 54.19, which were growing at a scale controlled by fracture mechanics. Even so, small in-plane offsets are evident between adjacent cracks in Figure 54.20b, and occasionally offset cracks that initiated with slightly different orientations appear to be in the process of coalescing. In a uniform stress field, and in an environment that supports selective dissolution as occurs with IG SCC, it is expected that the mechanism driving cracking will advance cracking away from the pipe’s OD surface at a statistically similar speed in all directions—resulting initially in PSG. If the crack depth data parsed as dense and sparse in Figure 54.10b followed PSG, as was suggested in an earlier discussion of that figure, then the cracking once initiated as in Figure 54.20 would at least initially grow with an aspect ratio statistically close to 2. Figure 54.21a through d images a series of crack origins at close to the scale of the microstructure, which had formed along the OD pipe surface, leading to deeper cracks. Such cracking is comparable to that in Figure 54.20, except that here cracking at the scale of the microstructure has continued to grow into the pipe wall by IG SCC. The OD surface of the pipe is indicated in each of these views. Figure 54.20 Cracks initiating on the OD surface of a pipeline. (a) Cracking within a highly susceptible area; (b) as in part (a) but at increased magnification. Figure 54.21a shows a SEM overview of the cracking within which the images that follow were obtained. At the magnification used for this overview, it is apparent that this PTW cracking comprised three larger crack segments, which had coalesced axially prior to opening these cracks after a soak in LN. A study of Figure 54.21a reveals three discernable thumbnail-shaped cracks, one of which is identified by an arrow. Based on higher-resolution imaging of a zero-tilt image the half-length c, of this highlighted crack was 1168 μm (0.046 in.), and its depth, a, was 850 μm (0.033 in.), leading to an aspect ratio, 2c/a, less than 2, at 1.37. The other two thumbnail-shaped cracks were similarly sized, both with aspect ratios less than 2, at 1.48 and 1.62. The higher-resolution imaging in Figure 54.21b–d was obtained from within the cracking shown in Figure 54.21a. These features were imaged with appreciable tilt because tilt helps to visualize the 3D details by developing contrast between the various crack planes, and incremental crack fronts that give rise to the overarching crack front evident in Figure 54.21a between the SCC and brittle fracture. Unfortunately, the benefits affected by tilt complicate crack sizing. For this reason, the crack sizing was based on imaging that was characterized at zero-tilt. Figure 54.21b images the arrow-highlighted thumbnail feature at 7.5× higher magnification. The tilt and perspective used were chosen to highlight its crack front along its depth, but also helped to visualize the five small but discernable origins along its intersection with the pipe’s OD surface, among the many that had formed there. Figure 54.21 Crack initiation on the OD surface of a pipeline. (a) Overview of the crack and thumbnail origin; (b) magnified 7.5 times relative to part (a); (c) overview of this crack and its thumbnail origin; (d) origin magnified 7.5× as compared to part (a). Sizing this sequence of much smaller cracks indicated their average depth was about 224 μm (~0.009 in.), with the average length being close to twice that—consistent with PSG during their early growth. The larger among these cracks was 178 μm deep and 311 μm long (~0.007 by 0.0122 in.), while the smallest was 91 μm deep and 201 μm long (~0.004 by 0.008 in.). Higher-resolution SEM imaging showed the presence of four identifiable thumbnail cracks within the length of the larger of these cracks, whereas the smallest of these contained two similarly sized thumbnail cracks. Although the larger of the above-noted thumbnail features had an aspect ratio well less than 2 at 1.74, the above-noted sequence of five shallower cracks had an average aspect ratio of just under 2 at 1.95. Figure 54.21c images one of the deeper features found adjacent to the just discussed cracking, while Figure 54.21d is typical of the smaller of the cracks evident in Figure 54.21b. As the scale of this smallest of the cracks was in the order of the ferrite grain size, these small cracks reflect sympathetic nucleation triggered at the scale of the cracking imaged in Figure 54.20. Given the limited size of those small cracks, Figure 54.21d was imaged at 2.5 times higher magnification than that used for Figure 54.21c. A study of the cracking shown in Figure 54.21c identifies three discernable nearly semicircular crack fronts, each being highlighted by an arrow to assist in locating them. Other similarly sized thumbnail-shaped features were evident in higher-resolution imaging. The depth of the deepest among those was 360 μm (0.014 in.), with an aspect ratio measured at ~2.30. Aspect ratios measured for the two identifiable fronts moving in from the largest were 2.22 and 2.08. A careful study of the cracking shown in Figure 54.21d likewise identifies three nearly semicircular crack fronts, the depth of the deepest absent image tilt being 100 μm, whose aspect ratio was measured at 2.32. Aspect ratios measured for the two identifiable cracks adjacent to the largest were 2.13 and 2.28. This limited dataset, which has sized a small sample of these microcrack origins, supports the suggestion made regarding the trends in Figure 54.10b—that is that the many cracks sized in that work with initial aspect ratios near 2 reflect PSG as they nucleated along the OD surface. It follows that this imaging and the related crack sizing support the assertion that the early (shallow) growth of SCC follows a PSG model. Whereas the results discussed reflect high-pH SCC, the same conclusion would be drawn regarding NN-pH SCC. This follows from the work of Lambert et al. [10] concerning such cracking, which indicated that their shallow growth had occurred along the surface leading to long cracks—as has been observed for high-pH cracking. Prior trending and discussion parsed the response for several large crack populations in terms of their growth as dense or sparse (see Figure 54.10b). In addition, they were parsed in terms of their aspect ratios, grouped as less than 1, between 1 and 3, and greater than 3. Given the significant scatter typically associated with SCC, values of their aspect ratios grouped between 1 and 3 were considered representative of a PSG process emanating from the OD surface. The response of some of the shallowest cracking within this pooled population did fit the PSG model, similar to the behavior evident in Figure 54.21c and d. However, many similarly shallow cracks also developed aspect ratios with values as high as 14. This marked increase in aspect ratio without a noticeable increase in depth indicates that those cracks had grown in length along the pipe’s surface—consistent with the response evident for the sequence of five small origins noted regarding Figure 54.21b. The trending shown in Figure 54.10b indicates that as the cracking grew deeper than about one-tenth of the wall thickness, those larger aspect ratios trended down sharply—with values scattered from near 2 up to near 10. This decline could signal a shift from growth at and along the OD pipe surface to growth into the depth as common crack fronts began to form. That being said, this limited, scattered dataset did not uniquely (1) associate values of the aspect ratio near 2 with PSG; nor (2) quantify the onset of a transition to growth into the pipe wall. Each of these aspects is considered in sequence in the ensuing paragraphs. The results in Figure 54.22 conclusively establish that values of the aspect ratio near 2 are not uniquely associated with shallow cracking, such that they are not uniquely associated with PSG. This figure images two deep and correspondingly larger cracks that were located adjacent to rupture origins, wherein the deepest bounds of their SCC have been highlighted by inset thumbnail crack shapes. As for most such images, other bounds could be overlaid within, as well as beyond those shown, which share this or a similar shape. Key for present purposes is the observation that although these deep cracks were approaching failure the values of their aspect ratios differ little from those evident at the scale of the microstructure. It follows that the value of the aspect ratio does not uniquely correlate with PSG, nor with the onset of growth into the pipe’s wall. Figure 54.22 Examples of deep cracking with aspect ratios near 2 found along ruptures. (a) Along the 1965 Natchitoches MS rupture [17]; (b) along the 1968 rupture near Roanoke AB. ([18]/U.S. Department of Transportation / Public domain). While the dataset considered in Figure 54.10b was robust and specific to its purpose, its scope by design specifically sought to contrast dense versus sparse crack populations. In view of Figure 54.22, a broader database is needed if such data are to establish the empirical foundation to quantify the depth of the onset of growth into the depth. To that end, well more than one hundred physically measured cracks sized and reported as part of Ref. [14] have been incorporated for trending in Figure 54.23. Given that growth along the surface affects an increase in the value of the aspect ratio, the transition to growth into the depth should be evident in this figure as a decrease in the value of the aspect ratio. Figure 54.23 has been formatted similar to Figure 54.10b, except for the datasets added, which are listed in the symbol key as 195-1, 195-2, 195-3, and 195-4. These data were gathered from sample plaques cut from pipes that were removed from systems that had experienced IG SCC failures, for which the cracking colonies had been imaged using MPI, first in the field, and then on cutouts in the lab. After carefully flattening each plaque, the cracking was sized in reference to serial transverse grinds into the thickness of the pipe wall, as compared to the more common practice that sections through-wall along the cracking. While not detailed in Ref. [14], each grind targeted up to the order of 0.005 in. (0.127 mm) per pass. The depths of those grinds were referenced to the depth of a shallow skim-grind that was done over less than 3.6 in.2 (23.2 cm2) surface areas, to establish a clean flat benchmark depth for the ensuing serial grinds. As the plaques had been flattened mechanically to offset elastic rebound and were quite small on a side, those cleanup grinds removed less than 0.003 in. (0.076 mm) from the pipe surface. With this practice, the very high aspect ratio shallow cracking that lies immediately adjacent to the y-axis in Figure 54.23 would be ground away with the skim-grind. That said, the normalized depths for the initial readings were sufficiently shallow to identify many high aspect ratio cracks, which consistent with Figure 54.10b tended to decrease as their depths increased. Figure 54.23 Trending as in Figure 54.10b, but for a much-expanded database. Inspection of Figure 54.23 indicates that this much-expanded scope shows the same traits as were evident in Figure 54.10b. It is apparent that much of this data fall close to the y-axis, with this expanded dataset showing even higher aspect ratios than for the shallower dense cracking—in spite of the effects of the skim-grind. These data reinforce the tendency to grow and coalesce axially on the pipe’s OD surface prior to the onset of growth into the pipe wall. It is also apparent that the trend for shallower cracking now continues well beyond the limit depth evident in Figure 54.10b—which for this expanded dataset includes many results whose traits reflect the transition from dense and sparse spacings. Finally, much of this expanded dataset shows the same sharp drop in 2c/a that was evident in Figure 54.10b, which tends to level off at crack depths greater than ~20% of the wall thickness. Given that the data in Figure 54.23 represents pipe walls whose nominal thicknesses generally lie between 0.281 up to 0.360 in. (7.14–9.14 mm), this shift in response is associated with cracking whose depths run from 0.056 up to ~0.072 in. (1.43–1.83 mm). In this context the inferred transition to growth into the wall thickness roughly corresponds to the transition between dense and sparse circumferential crack spacings. Chapter 53 also considered this transition behavior, doing so in regard to the crack depths that corresponded to the thresholds for the initiation of SCC based on smooth specimen data, and for its continued growth based on fracture mechanics specimens. Coupling those threshold states in the context of linear-elastic fracture mechanics (LEFM) led to depths for the transition to FM-controlled cracking, denoted dTHscc. Values of dTHscc were bounded below for susceptible steels at 0.03 in. (0.76 mm), and above for resistant steels at 0.24 in. (6.1 mm).11 Given the span of wall thicknesses noted above, this outcome is fully consistent with the trends in Figure 54.23. It also corresponds reasonably with the transition from the dense cracking that favored growth along the OD surface, to sparse cracking that tends to grow into the pipe wall. Imaging along fracture surfaces and on the pipe OD surface has developed visual insights into how SCC develops from the scale of ruptures down through that of the microstructure. These fractographic insights have confirmed earlier analysis that indicated the just initiated cracking grew along the pipe’s surface from origins that developed at the scale of the microstructure and then coalesced axially, whereafter having formed a common crack front across groups of those small origins they began their growth into the pipe wall. Recurrent traits like offset steps, undercuts, and axial coalescence were clearly apparent at the scale of cracking that led to ruptures—on through cracking that was growing from origins at the scale of the microstructure. The transition from dense cracking that favored growth along the OD surface, to sparse cracking that tended to grow into the pipe wall was associated with a significant decrease in the frequency of cracking. Consistent with Figure 54.10, this transition would favor sparse clusters and colonies—but equally could develop around the periphery of dense cracking. For this reason, this transition develops largely independent of other cracking. But, as those cracks grow, their axial extension could bring what were distant crack tips into close proximity—dependent on the number and spacing between their nucleating sites. Axial coalescence could then occur. As was evident in Figure 54.20, the proximity between nucleating sites can be locally very dependent on the pipe’s surface condition, and the microstructure that lies below. As the effects of the steel’s thermal and mechanical (TM) history are effectively identical at the scale viewed in Figure 54.20, one can conclude that local differences in susceptibility reflect local composition differences and their response to the TM processing history. Susceptibility that is potentially controlled at the scale of the microstructure is disconcerting, as it imposes tremendous demands on the ILI and other management tools to detect such cracking hotspots before they become a threat to integrity. The upside is that Figures 54.10 and 54.23 indicate that once the susceptible hotspots become active, soon thereafter their growth along the pipe wall slows. Thereafter, only a few among the many hundreds of cracks that might initiate remain active and a potential threat continue their growth into the pipe wall. Recognizing the sensitivity to the local surface conditions noted in regard to Figure 54.20, it is not a surprise that, since the early work of Parkins, Fessler, and others, the condition of a pipe or a test-specimen surface was considered important to the cracking process. Since then, the time to initiation along with the frequency and character of the initiated cracks have been shown to vary with factors that affect the surface roughness and the local residual stresses. In that context, native pipe surfaces appeared less resistant to SCC, whereas because surface residual stresses vary even adjacent to where they are measured, the results often showed its effects were varied. Inconsistent outcomes were often evident in tests that considered surface effects because other microscale factors like decarburization, and/or naturally occurring micro-stress raisers (e.g., oxides, pits, etc.) are inherent in most hot-rolled pipe steels. Their presence appears to have confounded some attempts to isolate the effects of other factors, like residual stress. As past work has documented effects like pitting (e.g., Refs. [19, 20]), this subsection briefly explores the potential roles of oxide cracking and surface preconditioning in regard to the imaging shown in Figure 54.24. The most problematic SCC has occurred on steels whose microstructures and properties are close to isotropic, such that the possible effects of anisotropy remain ill characterized. That said, anisotropy also has the potential to affect a directional response to SCC, particularly for the higher-strength Grades, and for cold-expanded pipe. Figure 54.24 Potential accelerants for SCC initiation. (a) Initiation apparently focused at oxide cracks; (b) etched detail in the boxed inset in part (a); (c) grain-boundary etching; quiescent, stress-free; (d) preconditioned then cycled in the environment. Figure 54.24a images cracking developing from a relatively shallow pit that in spite of being shallow is covered by a heavy oxide layer. Three cracks are readily apparent below the base of the pit, the largest of which shows sharp changes in direction, as occurs for IG cracking. That morphology was confirmed once this area was lightly etched. The other two cracks lie within the box inset into this image. Figure 54.24b shows a lightly etched slightly magnified view of this boxed area. In total five cracks can be identified, which are highlighted by arrows. Two of the five show cracking that initiated across a grain boundary evident as short tight crack-like features, which because they crossed grain boundaries have been labeled TG. Each of these terminates quickly within the first or second grain they enter. The other three cracks lie within grain boundaries, but at the scale of this image, do not show evidence of their originating due to cracking in the oxide. The one large oxide crack that lies centrally within the inset box does not show direct connectivity in this x section to cracking in the metal interface below the oxide—yet there is evidence of cracking that could originate at that oxide crack a short distance above or below this x section. Whereas some cracks do show hints of growth from oxide cracks, others do not. As such these results are inconclusive. Quite simply one cannot conclude regarding the origin for a crack based solely on examining cross sections—regardless of whether the focus is pitting or oxide-crack origins. It follows that determination of the role of oxide cracks would require serial sectioning in a focused study well beyond the present scope. While perhaps of academic interest, its outcome would have little practical significance given that the stress raiser due to the corrosion-induced pitting alone suffices to accelerate the prior initiation of both forms of SCC. In contrast, the high-temperature oxide scales that formed on the hot-rolled plate or skelp used to make the pipe would act as stress raisers absent corrosion and thereby could accelerate the prior initiation of both forms of SCC. Figure 54.24c and d presents unpublished work done in collaboration with Redvers Parkins in the early to mid-1990s concerning the effects of mechanical preconditioning on the subsequent initiation and growth of cracking in the high-pH cracking environment. Suffice it for present purposes to consider its effects as evident on the surface of what were samples that had been ground to a smooth finish targeting ~30 microinch RMS or better. Mechanical properties were determined with triplicated testing using standard preparation and testing practices for use as a benchmark for the testing that followed. All other samples for purposes of the study were prepared similarly and protected with a light oil until just prior to preconditioning, when they were degreased, bathed in alcohol, and air dried. Preconditioning involved a step load then hold for 10 min that in turn was followed by 500 cycles at a stress ratio of 0.9, and a peak stress that targeted 85% of the actual yield stress (AYS) for one series, and 95% for the second series. The initial step load and hold were designed to develop stress-activated creep—while the load cycling at high stress was designed to initiate the formation of persistent slip bands, to the extent possible under high-R-ratio cycling. Given the association with both forms of SCC with microplastic strain, the higher of the peak stresses was anticipated to most accelerate these cracking processes. The preconditioned samples were then remounted within a chamber of the same design used for TT testing with the same test practices being used in regard to temperature (75 °C [167 °F]), potential (−650 mV SCE), and environment (aqueous 1N-1N carbonate-bicarbonate solution). Tensile cycling was done at a peak stress corresponding to service at 72% of the specified minimum yield stress (SMYS), at an R-ratio of 0.9, and frequency of 0.35 Hz for just 24 h. This relatively high frequency was chosen to expose the surface to cyclic microplasticity while limiting the time-at-stress that can develop in testing at lower frequencies. The intent was to explore the effect of microplastic cyclic straining on the surface while minimizing the extent of cracking, which is contrary to the usual purpose of the TT test practice. As a benchmark against which to compare the coupled effects of this history and exposure on the surface of the cycled samples, coupons of the same steel whose surface had been similarly ground were exposed quiescent and stress-free for 7 days—the usual duration of the TT test at the same temperature, potential, and environment. Figure 54.24c shows the surface of a benchmark exposure in the test environment for 1 h. Others were held for periods up to 7 days. It is evident from this image that the surface had just initiated grain-boundary etching—with little evidence of penetration as the worst attack just marginally disturbs the shallow grind-induced ridges on this surface. Samples held for 7 days suffered etching in the order of 0.001 in. (25 μm) or less. Figure 54.24d shows x sections cut along the lengths of the specimens, each showing evidence of surface attack, and the presence of emerging crack-like features. In both cases those crack-like features are evident initiating within the surface-connected grains, while others have initiated within and follow grain boundaries—with both occurring in the usual high-pH cracking environment. While this preconditioning developed cracking, its effect was considered marginal as compared to the depths of cracks formed in TT tests after comparable time/cycle exposures of samples not preconditioned. The motivation for this exploratory preconditioning study was not to guide the design of a related test matrix, but rather to (1) understand the extent to which the outcomes were consistent with the anticipated role of microplastic strain, and (2) determine if pipelines that experienced much different service histories would also experience a related difference in their susceptibility to SCC. Reflecting on those objectives, the outcomes were consistent with the expectations concerning microplasticity. But while the results indicated that history differences, for example, involving hydrotesting or cold-expansion, or frequent large swings in the pressure (e.g., pack/draft for gas lines and tankage-fill-drawdown for liquid lines) altered the surface, and so could affect susceptibility to SCC, as noted above its effects were considered minimal. Typical crack x sections were introduced and discussed earlier as the basis to illustrate the several traits that were associated with TG versus IG cracking. This subsection continues this dialogue, primarily in regard to the presence or absence of (1) OD-surface pitting, (2) corroded crack flanks, (3) down-crack corrosion debris, including apparently compacted debris, (4) tight versus open cracking, and (5) the occurrence of IG versus TG versus mixed IG-TG cracking. Whereas the images that follow were selected to make a point, in all cases comparable imaging has been documented, such that what is shown is characteristic of other field cracking. In some cases, it suffices to evaluate shallower cracks, which then permits comparisons at higher magnification over the crack’s depth. However, where deeper features must be used to illustrate down-crack traits, and/or higher magnification must be used to image the details, then for such cases only portions of the crack and/or other relevant details can be considered. Figure 54.25 Concerning initiation in OD-surface pits or corrosion. (a) Intergranular examples; (b) transgranular examples. Footnote 5 applies to the TG examples. Figure 54.25 considers the presence of pitting as an initiator of SCC, while those that follow consider the presence of corroded crack flanks, corrosion debris, and tight versus open cracking. Each of these scenarios involves the effects of a corrosive environment, which some have used as an indicator of a NN-pH environment. Likewise, the absence of those corrosive effects has been used by some as an indicator of a high-pH environment. In all cases, the plausible tie of these corrosive effects to the NN-pH cracking environment is evaluated with imaging presented specific to both IG and TG cracking. Figure 54.25a shows imaging for IG cracking whereas Figure 54.25b deals with TG cracking. Both figures show a stack of crack x sections, with the individual images in either stack being referred to as upper, middle, or lower as appropriate. All images in both stacks are shown at about the same scale—which for present purposes suffices to illustrate the sharply changing directions of the cracking in the IG stack indicative of their intergranular paths. Because of the fine features of those IG cracks, they are illustrated using as-polished imaging. Lightly etched imaging on serial sections confirmed their IG morphologies. All images in the IG stack show OD pitting that is clearly evident and is extensive across their widths at the scale used. In each case, the crack is emanating from the depths of one of those pits or traverses it. In addition, a layer of oxide overlays the OD for two of the three images in the IG stack. In contrast, at otherwise similar magnification the surfaces across the widths of the TG stack show minimal pitting, with no clear evidence that these cracks emanated from comparably sized pits. The images in Figure 54.25a clearly illustrate that IG cracks have initiated and grown in the presence of pitting along the OD surface. That said, very shallow cracking is evident growing from the bottoms of pitting. This imaging reinforces the earlier observation that the in-service rupture shown in Figure 54.2b had developed in association with OD pitting. While cracks emanating from pits are typically associated with the TG morphology, these and other similar images indicate that it is not unusual to find IG cracking associated with pitting, and/or found initiating from pits. IG cracking associated with pitting is not a surprise—indeed it should be anticipated that pits are stress raisers. If the local stress induced by the pit exceeds the threshold for IG cracking before the same occurs in the area that surrounds the pit, then cracking will initiate within the pit.12 Whereas TG cracking often is associated with its origins in general corrosion and/or pitting, their presence is not a precursor to TG cracking as is evident in Figure 54.25b. Metal-loss corrosion reduces the local wall thickness for which the locally higher stress could exceed the threshold for initiation before that of its surroundings, so initiation is favored within corrosion. Pitting overlaid on that background or absent general corrosion is a more localized stress raiser such that pits also are favored sites for SCC nucleation—regardless of whether it initiates and/or grows as an IG or TG crack. The observation that the cracking environments associated with IG and TG cracking are reversible13 further dispels the unique occurrence of pitting and TG cracking. Indeed, very shallow IG and TG features have been observed in the same metallographic mount. In this context, the growth of TG cracking absent clear evidence of comparable surface corrosion or pitting in Figure 54.25b is not a surprise. This image and those in the IG stack make the point that cracking associated with pitting is not unique to TG cracking, nor a unique indicator of TG cracking. Specific to this imaging the presence of the effects of corrosion is not an indicator of cracking in a NN-pH environment. While conclusions or inferences concerning the role of corrosion and pitting might be drawn as above based on Figure 54.25, and/or other images like them, because cracks have a finite length whether or not a crack initiates at or within corrosion or related pitting cannot be determined from a 2D image cut at a point along the crack. Rather, that determination requires a view of the OD surface with sufficient coverage and resolution to assess the likely origin of the cracking. Such is the case regardless of the crack’s morphology. Likewise, it also is not possible to conclude regarding the presence or absence of corrosion at the surface or down-crack—because this evidence can develop as the crack grows, or in the months to years that follow. Thus, it follows that in general the traits associated with the presence or absence of corrosion cannot consistently discriminate between cracking environments. That said, corroded crack flanks and down-crack corrosion debris (reaction products) have been and continue to be used by some as discriminators regarding both cracking morphology and the environment. For this reason, two further illustrative examples follow in Figure 54.26, which consider these aspects still further. Figure 54.26 shows pairs of x sections through three cracks, each of which lay in the vicinity of other crackings that shared the same traits. The imaging for the IG crack shown in Figure 54.26a includes both as-polished and etched images, the latter being at a slightly higher magnification. This was done because the as-polished image does not adequately reveal the morphology of this cracking. While not evident in this down-crack image, this IG cracking originated in association with pitting on an otherwise corroded OD pipe surface. The crack tip shown lay about 50% through-wall, and at that depth and elsewhere oxide was evident on its crack flanks, as was debris down to its tips. Many would consider such behavior unusual for or incompatible with IG cracking, yet it is not uncommon depending on the locale and other aspects of the sampling. Figure 54.26b shows a pair of TG cracks that, as for the IG imaging, originated in association with OD corrosion and local pitting. This pair of cracks is imaged at the same scale used for the down-crack view of the IG cracking but differs from it in that these cracks are quite shallow. Otherwise, they are similar in that their flanks were corroded and they were oxide filled to their tips. The point made in view of Figure 54.26 concerning the presence or absence of down-crack oxide and corrosion debris, and OD corrosion and pitting, is that these traits are not unique indicators of TG versus IG cracking, or the environments that they favor. Evidence of the effects of corrosion for the IG and TG cracking in Figure 54.26 indicates that aggressive environments were resident long enough for those effects to develop down-crack. It follows that distinguishing between the fine features of IG cracking that tracks grain boundaries versus cracks that cut across those boundaries as for TG cracking requires that the grain boundaries that cracked remain intact. Such is the case only for cracks that had grown for a short time, to limit the residence time, or for cracking that shows minimal effects of down-crack corrosion. Figure 54.27 presents three cracks that satisfy the second criterion. Each of these images includes an inset at a slightly higher magnification to better illustrate the nature of the traits of the IG cracking as compared to the TG cracking. As becomes apparent, these images reinforce the conclusion that closed the prior paragraph, while also illustrating aspects of tight versus open cracking. As for Figure 54.26 and others used to illustrate IG cracking, Figure 54.27a illustrates the traits of this pair of IG cracks in as-polished images viewed at higher magnification. It is apparent from these images that this cracking grew from a pitted OD pipe surface. The locally sharp changes in crack direction and crack branching evident for these cracks are characteristic of IG paths, such that these images were not replicated here with lightly etched views. While typical of IG cracking, both images show some evidence of corroded crack flanks, portions of which contain down-crack corrosion debris—as was also clearly evident for the IG cracking illustrated in Figure 54.26a. Portions of this cracking near the surface appear open in comparison to their lower extremities, which appear much tighter. Figure 54.26 Concerning corroded crack flanks and down-crack corrosion debris. (a) Intergranular examples—considered unusual; (b) transgranular examples—considered typical (see Footnote 5). Figure 54.27b illustrates rather shallow TG cracking, whose paths from what was a narrow shallow plowed gouge appear rather straight and open. This cracking lay about a wall thickness away from, and running parallel to the rupture, which grew TW along a straight path that SEM clearly showed had a TG morphology. Given that the local disbond environment was lost in the rupture, along with several adjacent joints to either end of the origin joint, the disbond environment could not be sampled local to the origin of this cracking. Figure 54.27 Concerning tight versus open cracking. (a) IG examples—Crack a1 (left) and Crack a2 (right); (b) a TG example; (c) shallow IG cracking that was pulled open during a hydroretest; note the pitted OD surface. Whereas the OD surface showed pitting indicative of the presence of an aggressive environment, the expanded lightly etched view of this cracking inset in Figure 54.27b shows little/no evidence of corroded crack flanks, although there is some evidence of down-crack corrosion debris. It is apparent there that this very shallow cracking tends to cut through grains, rather than growing around them. The 0.014 in. (0.36 mm) deep crack highlighted in the inset is the largest of three cracks that formed from within this shallow gouge. All three appear open, and at higher magnification, all show modest effects of flank corrosion over their depths, the deepest of which shows cracking one or more grains deep emanating from its tip. This shallow oxide-free TG cracking was chosen in contrast to the equally shallow oxide-filled TG cracking shown in Figure 54.26b to emphasize that the effects of an aggressive environment on the appearance of cracking are dependent on its residence time, and other factors that can affect dormancy. In this context, dormant or slowly growing SCC will incur the effects of their aggressive environment, whereas cracking exposed after limited residence time will not show an adherent flank oxide, nor down-crack corrosion debris. While plausible as the basis for the circumstances evident in Figure 54.26b versus Figure 54.27b, because the nature of the cracking prior to the rupture is unknown such cannot be proven. Suffice it here to note that what is evident in a metallographic x section is a consequence of the circumstance that produced it, which for evidence of corrosion requires both the environment and adequate residence time. Finally, consider the width of the cracking—which where broad has been inferred by some as indicative of corrosion and so also a NN-pH environment, whereas when tight it is inferred to be indicative of a high-pH environment. While plausible, inference based on width is unreliable in that the effects of corrosion are dependent on transport and other factors that vary with depth and loading. It is also unreliable in that crack opening depends on the pressure-induced stress and the crack’s depth. Cracking that experienced appreciable plastic blunting along its crack front remains open due to that local deformation, whereas shallower cracking closes absent that permanent stretch. It follows that the extent of crack opening depends on the pressure history and the environmental exposure, and so is not unique to the nature of the cracking, nor the environment it developed in. This is illustrated by reference to Figure 54.27c in which the deepest of the cracks is about 0.56 mm (~0.022 in.) deep. Even so, several of these cracks are broadly blunted and open a distance approaching one-fourth of their depth for the broadest case. Whereas this cracking has grown from a heavily pitted OD surface, close inspection indicates that the flanks of these open cracks show little evidence of corrosion, and appear free of corrosion debris. Yet, in this low-power view, the open cracking in this x section appears similar to many TG cracks known to have grown in a NN-pH environment. That said, this cracking formed on a pipeline that extensive SEM studies had shown experienced IG cracking, in what sampling had indicated was a high-pH environment, whose operation and maintenance (O&M) history included high-pressure hydrotesting. The cracking x sections illustrated to this point underscore the uncertainty that can arise when assessing cracking morphology based on a metallographic section. It is apparent from this imaging that the study of one or two cross sections that show open, oxide-filled cracks with corroded flanks can be inconclusive concerning the mode of growth; even more so concerning the cracking environment. Of the traits considered, the presence of open cracks is least instructive, for reasons that were clearly evident in view of Figure 54.27c. This and the related imaging made clear that what is captured in a metallographic section is a snapshot in time that reflects the prior history of the cracking considered, whose interpretation must be guided by the pipeline’s O&M history, from construction through the day it was cut from the pipeline. These images indicate that if the pressure history leads to crack-tip blunting, that process reshapes the usual tight-Vee profile of a crack, such that its flanks tend toward being parallel. In addition, depending on the toughness relatively shallow cracking, ranging from ~0.006–0.022 in. (0.16–0.56 mm) in Figure 54.27c, can open significantly as compared to their depths. In this context, dependent on their toughness pipelines that have experienced hydroretesting could show opened cracking more so than pipelines that have not been retested. That said, what is evident in a cross section must be interpreted in light of their O&M history. Consider now the sequence of images that comprise Figure 54.28, which characterize various traits of a line-pipe steel’s microstructure when viewed on x sections cut perpendicular to the crack’s axial path. One key to interpreting what is seen in such sections is the realization that the sizes, shapes, and orientations of the microstructural features vary randomly depending on the composition and how the melt solidifies. They further depend on how that solidified melt transforms as the temperature decreases, as it continues to cool with the passage of time. Equally key is the realization that SCC initiates and grows multiple adjacent cracks, each of which can be locally active on multiple adjacent planes (and so variously evident on serial x sections). The effects of the resulting microstructure are illustrated first. Thereafter the role of multiple crack paths is considered. Whereas the grain size and other constituents vary somewhat, consideration of microstructures typical of line-pipe steels indicates that the shapes and orientations of the grains can vary significantly, being influenced by the composition and processing history of the steel. Modern coatings correctly applied, coupled with the advent of clean thermo-mechanically control-rolled (TMCP) steels, have changed the landscape of external SCC on pipelines. Such coatings have diminished the frequency of SCC. In parallel, acicular ferrite has displaced the pearlite. Previously line-pipe steels had ferrite–pearlite (F–P) microstructures, wherein the pearlite showed a two-phase lamellar structure comprising alternating layers of cementite (iron carbide, Fe3C) and ferrite (alpha iron). As the melt solidified, grains comprising proeutectoid ferrite formed, with the austenite transforming later leaving pearlite distributed among the ferrite grains. Carbon content and other constituents controlled the relative F–P volume fractions, while the processing including the hot-rolling practices controlled the nature of the microstructure, and could result in banded structures. More critical in regard to SCC, those microstructures lay beneath coatings that over time degraded, and disbonded, whereas some coatings can shield the pipe from the CP. The random nature of the microstructure and differences in the shapes and orientations of the grains, and in the strengths of the ferrite and cementite, mean that at a planar distance of one or two grains in either direction from the crack path imaged in a x section, the traits evident on that section could differ significantly. This spatial dependence indicates that without examining a serial sequence of sections cut parallel to one another along the crack at a very close spacing the image used to characterize the cracking is but one snapshot over a very short distance versus what might be found along the length of that crack. While statistically they should be similar, as becomes evident the microstructure and the presence of multiple cracks in the vicinity of the crack tip can affect what is observed on adjacent x sections. That said, spatial variability in grain size and local orientation are practically relevant only if they affect the cracking path over distances that are large compared to the grain size. Figure 54.28a considers the scale of a microstructure’s effect in reference to a banded microstructure—a common trait of the F–P microstructures developed in hot-rolled line-pipe steels. The occurrence of banding has been associated with the presence and segregation of impurity constituents [22], which is evident in etched microstructures as bands of ferrite separated by bands of pearlite. In reference to Figure 54.28a, the ferrite appears uniformly white, whereas the pearlite has a gray lamellar appearance. Inspection of Figure 54.28a clearly shows that the banded structure traverses the width of the image, which relative to the size of the typical ferrite grains therein indicates that this microstructural effect develops at a scale that is very large compared to the grain size. Figure 54.28 Concerning the microstructure and coexistent forms of IG and TG cracking (see Footnote 5). (a) A typical banded F–P microstructure; (b) TG growth cuts across banding (yet high-pH); (c) cracking bifurcated by banding; (d) detail at the crack tip in part (c). The IG SCC fracture surface in Figure 54.28b is shown at a slightly higher resolution as compared to Figure 54.28a. Banding is clearly evident therein running across the image, a portion of which is highlighted within the boxed area, but is also evident to its left. It is apparent from these features that cracking along an IG path, as is evident surrounding the inset box, could abruptly transition to the TG morphology evident within the inset box. Figure 54.28c shows the full depth of a crack that has grown through a banded microstructure to a depth of about one-quarter of the wall thickness. Note that this cracking is relatively straight down to its tip and that it appears open over its full depth. Even at this low magnification, some evidence of corrosion debris is evident within its length. Inspection of this crack’s response local to its tip suggests that this banded structure has significantly altered this crack’s TW path, initially causing it to grow laterally. Figure 54.28d presents the vicinity local to this crack tip at higher magnification. A study of this image indicates that microstructural banding has blocked this cracking from its growth TW, with its growth forced onto an IG path that tracks the interfaces between this banding. Although its growth remained IG, its path TW runs a more or less straight course through this banding—which in x section would appear TG. This same response is evident along the depths of the cracking above its bifurcated crack tip. This cracking had developed TW by a combination of IG growth laterally along the grain boundaries (GBs) between the bands and along a TW path by TG fracture of the bands. The image in Figure 54.28d shows that upon encountering such banding the crack tip bifurcated, as it rerouted around this barrier, and eventually then resumed its growth moving toward a TW path in response to the pressure-induced stress field. As for the cracking above this bifurcated tip, its continued growth developed by sequentially breaking through this transverse banded microstructure, band-by-band. This microstructurally affected band-by-band growth presents a TG morphology—regardless of the cracking environment. TG cracking like this has been observed local to (1) IG cracking that occurred nearby in microstructures that were free of strong banding, and (2) where the findings of field sampling in related digs were consistent with a high-pH environment. In such instances where banding was prevalent, the cracking when imaged in metallographic x sections showed a TG morphology. It follows that at least where banding is prevalent, the microstructure can affect practically significant redirection of the cracking, indicating that the cracking morphology is not a unique indicator of the cracking environment. Given the cause of banding [22], its presence or absence as well as its extent can vary significantly through-wall, and in the plane of the pipe wall. While banding is absent in many steels, it can be more prevalent than that evident in Figure 54.28d. Such banding is common in steels produced into the 1970s and is broadly evident for steels that have experienced TG SCC in Grades X65 and X70 that were produced into the 1970s. Observing that the effects of the microstructure on the mode of cracking were clearly evident in regard to Figure 54.28, its effects and implications for SCC are considered more broadly in the next subsection. The results in Figure 54.28c and d showed that microstructures that lay transverse to the crack’s path could significantly affect both the crack’s morphology and its direction, which begs two questions. First, can a crack’s path be altered by less imposing microstructural features, such as larger grains? Second, is a crack’s morphology uniquely dictated by its cracking environment? This subsection addressed these questions in the sequence they are noted. Because growth in NN-pH environments has commonly occurred by a TG mechanism, cracks growing in that environment cannot experience a microstructurally affected shift onto a TG path. On that basis, the answers to the above questions have been developed in reference to IG cracking. Figure 54.29 images short segments of IG cracking that had grown in a documented high-pH environment, cut either from (1) specimens tested under controlled laboratory conditions or (2) coupons removed from under disbonds that had been field-sampled. As for Figure 54.28, this imaging characterizes the extent to which transverse microstructural features have altered the crack’s path. This imaging characterizes three line-pipe steels produced from the late 1940s into the late 1950s, each of which came labeled by the operator as X52, save for one for which SMYS was labeled at 50 ksi. These steels showed F–P microstructures usual for the era they were produced. That said, the imaging used has been selected due to their varied fractions of these phases, and other traits. In all cases, the cracking that entered these images along an IG path also exits along an IG path. Segments along its path affected by the microstructure are highlighted by arrows. Crack growth in each of these high-resolution images runs top-down, with the entry and exit sites for each of the crack paths identified by arrows toward the upper and lower margins of these images. Figure 54.29a shows a segment of cracking parts that track along ferrite–ferrite boundaries, or between F–P boundaries, or within pearlite, which as noted above comprises lamellar phase boundaries between ferrite and cementite. The ferrite appears white in these images, whereas the cementite appears gray and layered, while the cracking generally appears as black line segments. Notice that the microstructure containing this cracking is absent large-scale transverse grains, which could as for the banding act as barriers to through-wall growth. That said, such IG cracking could continue TW unimpeded in this and similar microstructures. Figure 54.29b shows a stack of two images wherein the microstructures and the resulting crack paths differ from that just discussed. The upper image shows cracking that runs almost exclusively between ferrite–ferrite boundaries (arrows). Whereas the prior imaging considered the response local to the crack’s tip, the lower image in this stack shows the origins and early growth local to and just below the pipe’s OD surface. The origin for the cracking that continues from the OD surface to the bottom of this image and beyond is indicated by the uppermost arrow, with cracking from an adjacent origin identified by the dotted arrow. As for the upper image in this stack, this growth tends to be focused on ferrite–ferrite boundaries—which in this microstructure tend to be oriented TW. As for Figure 54.29a, the microstructure within the volumes of steel containing the cracking in Figure 54.29b is absent in large-scale transverse grains. As such, the growth shown has occurred unimpeded and could continue through this and similar microstructures provided they are absent larger transverse grains. Figure 54.29 Concerning IG cracking either facilitated or blocked by the microstructure. (a) On mostly F–P paths; (b) on mostly ferrite–ferrite paths; (c) blocked by directional structure. While the cracking and microstructures in Figure 54.29a and b were imaged in areas free of larger blocky and/or transverse grains, such was not the case for the cracking shown in Figure 54.29c. Otherwise, the microstructure in Figure 54.29c is similar to that shown in Figure 54.29a. The cracking imaged in Figure 54.29c is similar initially to that in Figure 54.29a, as it tracks between ferrite–ferrite boundaries, and/or within pearlite, or along pearlite-ferrite boundaries. As for the prior cracking, the arrows at the top and bottom of this image identify the entry and exit sites for this cracking. But in contrast to the cracking and microstructures shown in Figure 54.29a and b, which were imaged in areas free of larger and/or transverse grains, the IG cracking in Figure 54.29c encountered two bands of ferrite grains. Once beyond this impediment, the IG growth resumed. Accounting for the difference in resolution, inspection of this image indicates that these bands are narrow as compared to the banding that blocked the crack’s path, leading to its bifurcation (see Figure 54.28c and d). Locally, this banded microstructure behaved like that encountered above that bifurcation, for which the local pressure-induced stress field sufficed to fracture the bands, creating what would appear as TG cracking in a metallographic x section. It follows that at the scale of the microstructure, the paths of IG cracking can be altered, impeded, or blocked by microstructural barriers typical of that found in many line-pipe steels. In view of this imaging, IG cracking will be prevalent in randomly oriented microstructures that are absent in heavy banding or large blocky transverse grains. In contrast, IG cracking in high-pH environments can be impeded or blocked where it encounters transverse banding and larger ferrite grains unless the local stress field suffices to break through that blocking. In such cases, as illustrated in Figure 54.28, IG cracking in high-pH environments would combine with TG cracking to continue the growth through-wall. At least for the situations considered in Figures 54.28 and 54.29, the cracking morphology was not a unique indicator of the cracking environment. Likewise, it follows that evidence of a TG morphology in a metallographic section does not uniquely indicate a NN-pH cracking environment. The imaging in Figure 54.30 broadens the scope concerning this topic with imaging that brings closure to the question of whether the crack morphology is a unique indicator of the cracking environment. As evident in this figure, it considers three cracks whose circumferential origins were spaced such that all three could be examined within the same metallographic x section. Related imaging in the source report showed no evidence of adherent flank corrosion, nor corrosion debris down-crack. Consistent with that, it noted that the pipe’s surface locally showed little evidence of aggressive corrosion. However, it was evident that elsewhere the OD surface of this coal-tar-coated pipeline was corroded, with some pitting also evident. A black film was evident on its fracture surfaces, which X-ray diffraction analysis indicated was primarily Fe3O4 and FeCO3, with traces of hydrated Fe2O3, and iron—similar to what since has been found local to SCC occurring in a high-pH environment. The failure reports circa 1965 stated that the cracking followed IG paths. This was confirmed in regard to as-polished and etched imaging for very shallow cracking that was characterized at 250 times magnification. As this was among the earliest of the US SCC ruptures, disbond fluids in adjacent pipe joints were not sampled—whereas the soil was analyzed by the operator who determined a pH of 4.8. Figure 54.30 presents as-polished and etched views of some secondary cracking that formed nearby the rupture path. Its proximity to the rupture path caused this and other secondary cracking to pull-open. The deepest of these secondary cracks, labeled M, runs the full depth of the image and continues beyond—there at a depth of 0.045 in. (~1.14 mm) or 17% TW. That continued growth occurred by coalescing with a parallel branch, labeled M′, which occurred just below this image. The depth of the shallowest crack normalized by the pipe’s wall thickness was just 9.4% TW, whereas the cracking toward the left margin was ~13% TW. Fracture mechanics analysis of stress shielding due to the deep open central crack indicates that prior to the main crack’s coalescence, all three cracks were growing with somewhat comparable depths. Given the close circumferential proximity of these cracks, their chemical compositions, processing, and strengths would be nominally similar. That said, the microstructure throughout this mount does not appear uniform, as locally banding is evident in places, as are some large blocky ferrite grains. Inspection of the etched image indicates that such features account for the quite different appearing segments tracking down each crack. Such is also the case for the differences evident in comparing the traits of these adjacent cracks. Figure 54.30 Coexistent IG and TG cracking in the same cross section. (a) As-polished view of coexistent IG-TG cracking; (b) as in part (a), but after etching. Although the shallower cracks developed pure IG paths, and X-ray diffraction analysis of its fracture surface indicated traits consistent with SCC occurring in high-pH environments, over much of its depth the central crack in Figure 54.30a appears similar to the TG path evident in Figure 54.28c. Inspection of Figure 54.30a indicates the crack left of the central crack follows a stepwise path over most of its depth whose scale is consistent with that of the microstructure, as occurs for IG cracking. Two straight segments can be identified along its depth (highlighted by arrows), which given they are straight over distances many grains in length might appear like TG cracking. Yet, a close examination of the etched image indicates these segments comprise IG growth along microstructural features aligned almost TW. The cracking over much of the length of the crack right of the central crack shows traits similar to that on the left side. But, in contrast, the crack to the right of the central crack shows some short segments that track a TG microstructure, as grains can be seen that are divided by this crack path. The juxtaposition of IG and TG cracking within the same metallographic mount demonstrates conclusively that cracking morphology does not uniquely discriminate between cracking environments. Table 53.1 (in Chapter 53) indicated that the factors causative of high-pH versus a NN-pH SCC differ, such that effective management plans for SCC would be designed specific to the causative conditions. Optimal SCC management thus requires broadly quantifying enough indicators of the cracking environment to confidently conclude whether it currently was a high-pH versus a NN-pH environment—or both over the course of time due to their reversibility. The best indicator of the cracking environment is field evidence drawn from within disbonds, which then is promptly analyzed. Although crack morphology is not a certain indicator of cracking, it can provide useful insight. But this requires more than removing a hot-tap coupon and imaging a x section. If pure IG cracking is observed, and SCC is the only plausible environmental assisted cracking (EAC) mechanism, then given the current state of understanding the cracking occurred in a high-pH environment. Given that the TG cracking imaged in Figure 54.28c and d was found adjacent to sections that showed IG cracking paths free of TG features, in field circumstances consistent with high-pH SCC, evidence of TG cracking in a x section is inconclusive, as is evidence of mixed IG-TG cracking. At a minimum, serial sections should be made, as should sections along several cracks in a few clusters. SEM is perhaps best in this context, as it broadly characterizes the cracking morphology. In addition to x sections and fractography, the coating type and condition should be considered, as well as the disbond fluid pH, the local potential, etc., as can be inferred from Table 53.1 (in Chapter 53) Absent case-specific data, such information should be sought for failures on the same system under comparable service and field conditions. In addition to the role of the microstructure, as noted earlier interpretating the cracking evident on a x section can be complicated by the presence of multiple independent parallel cracking, as well as by the branching and bifurcation of one or more of these cracks. For example, the x section through the IG Crack a2 imaged in Figure 54.27a shows a break along the main crack toward its tip, which was subsequently rejoined by cracking that developed off this x section. This x section also shows fine cracking at shallower depths, which either splits and grows from the main crack, or coalesces with other cracking running parallel to the main crack. Likewise, it shows clear evidence of multiple local cracks, crack branching, and a bifurcated crack tip. As Figure 54.28d illustrates, bifurcation is a special case of branching, which occurs at the tip of the main crack when divided into two often similar branches. Whereas that bifurcation developed in the context of a banded microstructure, branching, bifurcation, and complex cracking paths also develop associated with the effects of the cracking environment—which is the focus of this subsection. Branching and bifurcation due primarily to the influence of the cracking environment are shown for high-pH SCC in Figure 54.31a and b, whereas Figure 54.31c and d illustrates these features as they develop in the NN-pH SCC environment. As needed arrows are used to highlight these features, and/or other notable features, with inset boxes used to identify cracking that is shown at higher magnification, or in focused discussion. The cracking imaged in Figure 54.31a and b shows the classic traits of IG cracking—particularly in the multiple cracks penetrating within the grain boundaries evident in part (b) of this figure. Bifurcation is evident at the then tip of a large crack in Figure 54.31a, lying between the opposing pair of arrows toward the top of the image, beyond which the cracking has continued diagonally toward the margins of this image. Short arrested branches highlighted by dashed arrows are evident growing from the larger cracks. Two longer very tight branches have been highlighted by the dotted arrows. Finally, a dashed box has been inset over the right branch growing beyond the bifurcated tip, with the cracking lying within its bounds being shown at higher magnification in Figure 54.31b. Figure 54.31 Examples of the interplay between crack bifurcation and the microstructure. (a) As-polished—IG cracking; (b) lightly etched view in the inset box in (a); (c) TG cracking (lightly etched) (see Footnote 5); (d) similar microstructural effects on TG cracking (etched) (see Footnote 5). Figure 54.31b illustrates dissolution focused in GBs, which occurs with the active–passive cracking process that underlies high-pH SCC. As the figure illustrates, many potential cracking paths develop as dissolution occurs locally and progresses along all boundaries that are readily accessible to the high-pH cracking environment. Thereafter, the pressure-induced stress directs this dissolution (growth) along one or more TW paths. It follows that branching occurs easily in high-pH cracking environments, and therefore occurs frequently—at least in microstructures that do not impede or block its path. Coupled with microstructural features like grain-boundary triple points, the ease of growth along grain boundaries increases the chances of branching and/or bifurcation. Whereas the high-pH environment and a favorable microstructure tend to favor branching and bifurcation, the deeper TG cracking that develops in NN-pH environments appears relatively less sensitive to the microstructure. In contrast, the environment coupled with the microstructure can affect the paths of shallower TG cracking. Such effects become evident regarding the shallow TG cracking imaged in Figure 54.31c and d. This cracking was found on a pipeline where a NN-pH environment had been documented local to TG cracking found nearby in the same valve section. A study of the lightly etched microstructures evident in these figures indicates that it was banded. In spite of its being shallow, and rather tight given the magnification involved, this cracking shows evidence of adherent oxide along its flanks, which in places had filled the cracks down to their tips. As is often the case for TG cracking, this cracking was associated with a corroded/pitted OD surface—as evident in places in the x sections shown. While evidence of bifurcation is highlighted twice along the crack in Figure 54.31c and once along the crack near the left margin of Figure 54.31d, there is no evidence of branching like that apparent for the high-pH environment. The now dormant bifurcated branches are oxide filled, and oxide lies along the crack flanks. Throughout the depths of these cracks, both images show lateral jogs, and evidence of corrosion penetrating laterally into this banded microstructure, with some sites being highlighted by arrows. That said, while this response appears reminiscent of that shown for the high-pH SCC in Figure 54.28d, the trigger for branching and bifurcation there was a strong banded microstructure that blocked the TW growth of an IG process—not selective lateral corrosion. The depth of the deepest crack shown in the x section in Figure 54.31d is 0.037 in. (~1 mm), which for this case was ~11% of the wall thickness. Whereas deeper TG cracking tends to be less sensitive to the microstructure, this image indicates that TG cracking also could be blocked and redirected by strong microstructural features, like larger grains and strong banding. Hints of this are apparent in the bends and jogs that lie between the straighter portions of the deeper of these cracks (note the areas local to the arrows). Etched microstructures associated with the NN-pH SCC occurring in this 1960s/70s X65 and X70 line-pipe production often show strongly banded steels. On that basis, the effects of banding discussed for high-pH SCC also could be manifest in cracking in NN-pH environments. Bifurcation also develops in response to other drivers for both IG and TG morphologies, wherein the pressure history and operational environment of the pipeline lead to blunting at the crack tip, whereafter often it bifurcates. As bifurcation in this context is affected by the pressure and not strongly dependent on the microstructure, its discussion is deferred until later in this chapter. Discussion concerning the interpretation of metallurgical x sections has on occasion noted that the features evident on any section are influenced by those a short distance along the crack in either direction from the plane of the x section being examined. The upside of using x sections is that the microstructure can be made evident through the use of the appropriate etch. That said, the locations of the grain boundaries differ at a distance in the order of the grain size to either side of the section being examined—with the cracking there influencing that on the section under study—and vice-versa. On that basis, if there is any uncertainty concerning the features being observed, then serial sectioning in small steps could be instructive in resolving that uncertainty. The downside to this approach is that there is an equal chance that resolution by this process requires access to the material that already was ground away (destroyed) to prepare the x section in question. Because sectioning is destructive, a better approach involves first cleaning the fracture features as needed, followed by SEM examination. By interrupting the cleaning in a sequence of clean-examine-document cycles—each of which thins the layers of film and reaction products that formed under a common disbond—useful insight into the chronology of the cracking often emerges. Once cleaned, the clear and obvious differences in appearance developed by IG cracking versus TG cracking can be studied, and documented along the lengths of each crack or segment, and likewise through their depths. Changes in the morphology can provide insight into changes in the mechanical loading of the crack. If the pressure history is known, this could provide a timeline for the cracking—a topic that is illustrated later in regard to the effects of hydrotesting. Suffice it here to illustrate the differences evident between TG and IG cracking as evident in SEM imaging of IG cracking in Figure 54.32a and c, and in Figure 54.32b and d for TG cracking. Because the scale and nature of the microstructure influence the appearance of the features evident on fracture surfaces, the imaging presented for both the TG and IG cracking reflect comparable F–P microstructures developed in conventionally rolled14 X52 steels. Both steels variously showed evidence of banding and separations on their fracture surfaces. Both came from field failures for which the pipe OD and the cracking showed the effects of corrosion and the presence of corrosion debris. Figure 54.32a and c that is used to illustrate the fracture surface typical of IG cracking, came from a line that had previously experienced failures documented as IG cracking, whose field digs were consistent with a high-pH environment. In contrast, Figure 54.32b and d that is used to illustrate the fracture surface typical of TG cracking came from a cutout on a pipeline that had experienced failures documented as TG cracking, for which the results of related field digs were consistent with a NN-pH environment. Figure 54.32 The traits of IG and TG crack morphology resolved via SEM. (a) Typical IG example—at suitable magnification; (b) typical TG example—same scale as part (a); (c) typical IG example—higher magnification; (d) typical TG example—same scale as part (c). Note that at the scale used to image Figure 54.32a, the subtitle states that it represents a “suitable” magnification. The use of suitable in this context arises from the observation that the use of too low a power does not resolve the microstructure, whereas too high a power begins to image the individual grains rather than the field of them needed to broadly assess the cracking morphology. Comparison of the TG features in Figure 54.32b at the same magnification leaves the morphology of the TG features uncertain. Worse yet, in some cases such as this, without live imaging and knowing the grade and the grain size at the scale used for the imaging, what is TG cracking might by some be considered IG cracking of a fine-grained steel. The sensitivity of such imaging to the magnification becomes apparent by comparing the very different appearances evident in Figure 54.32c with that in Figure 54.32a—even though their magnifications differ slightly. In spite of the small difference in magnification involved, what appears as a blocky surface more or less throughout Figure 54.32a is clearly resolved in Figure 54.32c as corroded grains and their boundaries, along with branched cracking, all of which is usual for IG cracking that has laid dormant. The network of small cracks growing normal to the plane of the crack is also usual: it reflects the selective dissolution along grain boundaries and the effects of the stresses that develop among adjacent grains that have slightly different local orientations. Because the IG process affects cracking out of the plane of the major crack, an out-of-plane crack component also can be apparent with IG cracking. Such features are clearly evident at both magnifications for this IG imaging—as these fracture features undulate, and are far from planar. The occurrence of often extensive out-of-plane cracking leads to the possibility that what was the major crack plane gets left behind if/when the cracking finds a more favorable (less resistant) path for growth. It is this trait of cracking coupled with dissolution along many grain boundaries that leads to the branching typical of the IG process, and cracks that appear to stop and then reappear elsewhere in a crack’s x section. Such features were apparent in Figures 54.26a, 54.27a, 54.30, and 54.31a. Whereas this behavior can result in continued IG growth, if the path of least resistance encounters a banded/blocking microstructure then this IG cracking becomes coexistent with TG features. Thus, evidence of TG cracking along a predominantly IG path should not be a surprise—as SCC reflects the coupled effects of stress and environment that are overlaid on a background of an occasionally controlling microstructure—as was evident in Figure 54.30. Consider now the TG features shown in Figure 54.32b and d. A study of Figure 54.32b indicates that at a scale suitable to reveal the blocky appearance evident for the IG cracking this view of TG cracking remains unresolved. As noted above, without higher magnification this fracture surface could be misinterpreted. Views that are unresolved or lack features that show a characteristic shape or other identifiable visual traits—as in Figure 54.32b—have been termed “nondescript” in some SEM studies of TG fracture surfaces. What appears nondescript at the scale shown in Figure 54.32b is logically less resolved at lower magnification, and so remains nondescript at lower powers. In contrast, slightly higher magnification transforms this nondescript look into features that when viewed at the scale of the microstructure are flat relative to the shapes and out-of-plane traits evident for the IG cracking shown at the same magnification in Figure 54.32c. That said, a close inspection of Figure 54.32d reveals what appear to be grain boundaries, which can be confirmed as such at higher magnification. The same might be said of these features when imaged at lower power as in Figure 54.32b. While TG images like that in Figure 54.32d lack characteristic visual traits at magnifications capable of resolving the microstructure, and appear flat grain to grain, they do undulate to some extent when their fracture surfaces are viewed at lower magnification. Observe as well that TG cracking can show secondary out-of-plane cracking, which as evident in Figure 54.32d can show features that are characteristic of grain boundaries and triple points—both of which are apparent at the scale of this imaging. As for the IG cracking, this TG cracking shows evidence of corrosion. More importantly for present purposes, with the appropriate resolution it is clear that the in-plane features typical of TG cracking look nothing like those of IG cracking. This facilitates easy determination of the crack morphology over much or all of the fracture surface. As noted above, some features in the TG cracking imaged in Figure 54.32b and d are characteristic of grain boundaries and triple points, whose size is consistent with the scale of the microstructure. Grain-boundary cracking and triple points coexistent in a field of TG features have some interesting implications regarding cracking environments, and the use of morphology to discriminate between cracking environments. Mechanical metallurgy textbooks (e.g., Ref. [23]) indicate that at temperatures typical of hydrocarbon transmission pipeline operations the grain boundaries in metals are stronger than the material the grains are comprised of. On that basis, failure occurs along a transgranular path. It follows that absent dissolution or some other mechanism that weakens the grain boundaries, as occurs for the high-pH environment, the default mode of failure for metals like steel in typical transmission pipelines is TG. In turn, it follows that the potency of NN-pH electrolyte and related conditions dictate whether failure develops in and along the grain boundaries, versus through the matrix of grains. Finally, note that SEM has value far beyond discriminating the cracking morphology. It can be effective in identifying and sizing features, and its depth of field provides a 3D perspective from any angle, which can be key to assessing the sequence which individual cracks had coalesced, leading to a rupture or leak path. Finally, it provides instructive insight into why failures occur, and concerns like leak versus rupture, which in turn affect the consequences of a failure. A number of observations lead to practical takeaways based on the metallographic x sections considered and discussed in this compendium of images, which include The similarity in the traits of the cracking process from ruptures through shallow stable cracks begs two questions: (1) what underlies this similarity; and (2) what causes the decrease in the crack aspect ratio as crack coalescence along the pipe surface gives way to growth through-wall? As follows, SEM-based fractography provides useful insights into answers to both questions. Against a background of a cracking environment and a steel susceptible in that environment, microplastic straining in various forms has been cited as the primary driver for the nucleation of both forms of external pipeline SCC [3, 24, 25]. Although pipelines remain nominally elastic under usual service conditions, mechanical metallurgy textbooks (e.g. [23, 26]) indicate that as metals like steel deform elastically those grains whose microstructure and slip-systems favor localized flow can develop microplastic strains well prior to nominal yielding. As the results of Ref. [27] illustrate, this unconstrained flow normal to the surface gives rise to what for some time regarding SCC has been referred to as a “free-surface” effect (e.g., Ref. [5]). The absence of surface constraint enhances the evolution of microplastic strain local to the surface and thereby enhances the SCC processes affected by it. As the cracking deepens, this microplasticity develops within grains bounded by neighboring grains, which constrain the flow that at the free surface was unconstrained. This leads to incompatible displacements among neighboring grains, with this incompatibility being accommodated within the matrix of the grains and along their grain boundaries, diminishing the free-surface effect of several grains below the surface. Incompatible strains along the grain boundaries can activate mechanisms like film-rupture [28] focused within the grain boundaries—which is often cited as driving IG SCC. As slip is the mechanism of microplastic flow, it is enhanced within favorably oriented grains at the free surface. Reversed loadings, which occur in pipelines, lead to the formation of persistent slip bands [29]—which is cited as a precursor for fatigue [29]. Slip likewise is a plausible driver for cracking within and across the grain-matrix, leading to the nucleation and growth of TG SCC. Key in view of the above is the observation that textbooks concerning mechanical metallurgy [23] note that the grain boundaries are stronger than the material the grains are comprised of in metals at temperatures typical of pipeline operations. On that basis, Ref. [23] states that failure under such circumstances is trans-crystalline—equally TG. Thus, absent dissolution focused in the grain boundaries, as occurs for a potent high-pH environment, or another process that weakens those boundaries, TG cracking is the default (or expected) mode of crack advance. Given the role of microplasticity in SCC, such cracking is nucleated with increasing frequency as the stress increases—as has been widely observed in TT testing (e.g., Refs. [30, 31]), and effectively modeled (e.g., Refs. [32, 33]). It follows that local stress raisers will enhance the likelihood of SCC, and promote it at lower nominal stresses. Pitting has been recognized as an accelerator of EAC for more than four decades (e.g., Ref. [21]), as could be microcracking in adherent surface oxides, which can localize the stress in the steel below, and provide local access to the cracking environment. Pipelines operated at or near their maximum service pressure are more likely to selectively activate microplasticity in the grains favored for slip, depending on their maximum service stress. If that occurred in the presence of a cracking environment for the steel involved, then a select set of grains would nucleate cracks. Mechanics indicate that the local stress fields are elevated in the vicinity of their crack tips. If that increase sufficed to activate microplasticity in grains local to the crack tips, then the first cracks to nucleate would promote nucleation local to their tips—which herein is termed sympathetic nucleation. As this process replicates, it leads to axially aligned cracking. Nucleation as evident in Figure 54.20 activated a 2D array of sites, which with replication leads to axially aligned clusters of cracking—like that often found on pipelines. Given the physical scale of the microplasticity, it can be affected by factors like the presence or absence of mill-scale, pitting or other localized electrochemical attack, decarburization, residual stresses, and so on. It must also be noted that the microplastic response of steels and other metals is dependent on their prior loading history—showing both cycle-dependent and time-dependent responses at room temperature.15 It follows that SCC developing in response to microplasticity can initiate, or go dormant, or reinitiate, depending on the service history of the pipe and the properties of the steel—coupled with the presence of a cracking environment and a susceptible microstructure. Figures 54.33 through 54.36 image cracking as the basis to evaluate this sympathetic nucleation hypothesis—from the microscale up through larger cracking evident in secondary cracking found local to in-service rupture origins and hydrotest breaks. Thus, the crack lengths considered range from less than a tenth of a millimeter (a few thousandths of an inch), up through a few millimeters (a small fraction of an inch), and then on to sizes in cracking associated with a rupture. As evident in Figure 54.33a, the larger crack on the left margin of the image is the stress raiser that could promote symmetric sympathetic nucleation, which here continues beyond its tips, toward the figure’s right margin. The need for clarity achieved through magnification, in balance here with the page size constraint, dictates showing only the cracking that developed beyond one of its tips. The result of this process is a series of cracks whose lengths tend to decrease moving away from their parent. Figure 54.33b expands the right half of this overview, wherein the benchmark scale has slightly more than doubled. The shortest among the cracks imaged has a length of less than 0.1 mm (0.004 in.). The lengths of the two isolated cracks (solid ellipses) are about 0.3 mm (0.012 in.). At the scale shown, the shorter (and logically shallower) cracks have lengths comparable to the ferrite grain size. The composition and microstructure of this steel are typical of line-pipe produced in the United States from the late 1940s into the 1960s. Inspection of the sequence of cracks evident in this image indicates that this axial cluster comprises strings of shorter cracks, each separated from their neighbors by a ligament, which have been highlighted by arrows—with hints of still smaller features developing at its exterior tips (dotted ellipses). It follows that even for cracking that has just nucleated their evolution is consistent with sympathetic nucleation. In this context what later appears as one longer crack comprises what earlier in time was a multitude of short sympathetically initiated cracks that coalesce over their length as the ligaments failed between them. Figure 54.33 Sympathetic nucleation as the cracking grows away from its “parent” (SEM). (a) OD surface overview of an axial cluster of relatively short cracking; (b) expanded view of the right-half of part (a); note the many as yet to coalesce smaller cracks. Figure 54.34a roughly doubles the magnification used above for the right-most crack in Figure 54.33b, with a view to clearly image the details of the cracking highlighted there in the dotted ellipses, and to illustrate the decrease in the size of the ligaments as this cracking grows in length, and in so doing continues to open. Note in this context that as anticipated for sympathetic nucleation the lengths of the cracking highlighted by the arrows tend to decrease with increasing distance from the originating crack tip. Note as well that the ligaments between these highlighted shorter crack segments remain large compared to their lengths, whereas the ligaments between the now longer coalescing segments have either failed or have thinned and are near failure. In that context, all aspects of this cracking are consistent with sympathetic nucleation. Figure 54.34b characterizes the nature of the ligaments highlighted by arrows in Figure 54.33b. The imaging along the left margin of this figure has been isolated from the crack that lies toward the lower margin of Figure 54.33b—except that here it has been rotated and shown at roughly twice the magnification of that figure. The features within the dashed box in this image are shown to its right side—there further magnified by 2.5 times. Related SEM imaging as well as detailed study of this image shows that the leftmost ligament had just failed, while that to its right still remains intact, but very near failure. Considering typical ferrite grain sizes for the era of this steel’s production, the distance between these ligaments is in the order of 6–8 grains. On that basis, the shortest of the cracks evident in this image is in the order of the grain size. As above, this imaging is consistent with SCC nucleation and growth by sympathetic nucleation, with this process developing from sites of prior initiation into grains more favorably oriented for slip. Consider now the cracking imaged in Figure 54.35, which is somewhat longer than that in Figures 54.33 and 54.34, such that the benchmark scale has been increased by 2.5 times to 5 mm (0.2 in.). With few exceptions, the study of the longer among this cracking indicates that their ligament bridges across shorter individual cracks, as evident in Figures 54.33 and 54.34, have failed due to the increased opening of this longer cracking. As these ligaments gave way, the shorter cracking coalesced axially into longer cracks, like those evident in this image. As above, the larger crack on the left margin was the stress raiser promoting sympathetic initiation. As above, this inference is supported by the observation that the lengths of these cracks tend to decrease progressively moving away from the parent crack, here toward the right margin of the image. Note in this context that where multiple cracks are evident their sympathetic initiation and growth is influenced by stress shielding and the relative strengths of the grains. As such, while a pattern can be evident wherein the larger cracks activate sympathetic nucleation, its occurrence is conditioned by the initial locations of the larger cracks, the local susceptibility of the steel, and local stress shielding. Figure 54.34 Details of the cracking imaged in Figure 54.33 (SEM). (a) Details of the cracking nucleating beyond the tips of the originating cracks; (b) imaging of a just-failed and still-intact ligaments between adjacent coalesced cracking. Prior discussion regarding Figures 54.17 through 54.19 noted that the cracking traits along ruptures, leaks, and stable secondary cracking were comparable—save for their physical sizes. If their cracking traits differed only in physical scale, then the features evident in cracking in or adjacent to an origin, like that considered in Figure 54.17, should likewise be evident in the larger-scale cracking local to as well as just off the rupture plane. Figure 54.36 considers this plausibility relative to cracking evident about 1-in. (25 mm) to the left of a SCC rupture origin. Figure 54.35 Longer sympathetic cracking progressing from a “parent” crack (SEM). Figure 54.36 shows a perspective SEM view of the cracking on the pipe OD surface, and that along the adjacent fracture surface, which formed as the rupture ran axially from its origin—and propagated through and beyond the cracks that comprise the fracture features imaged. This rupture plane is approximated by the dashed line inset into this figure, which lies about 0.2 in. (~5 mm) from the path of the secondary OD surface cracking. The sizes and traits of this OD surface cracking are comparable to those shown in Figures 54.33 through 54.35. Finally, a zero-tilt SEM view has been inset across the top of the image that illustrates a portion of the length and depth along this fracture surface. In spite of lying adjacent to the rupture origin where a much larger cracking had coalesced to trigger axial propagating (rupture), the scale of this cracking is typical of many secondary cracks, and comparable to that evident in Figures 54.33 through 54.35. The longer open central crack within this axial cluster, which lies just off the rupture plane, appears to be the “parent” of the cluster, with the associated cracking fitting the concept of sympathetic nucleation. As expected, the extent of the cracking beyond its tips appears similar to either side—so as expected, sympathetic nucleation develops symmetrically. The series of cracks that formed above this cluster, which was intersected as the rupture as it ran from its origin, likewise exhibits a central “parent” that is flanked on either side by other cracking whose sizes are similar or tend to decrease with increasing distance from the parent. As such, the traits of this cracking are comparable to that in Figures 54.33 through 54.35. Figure 54.36 OD SEM perspective view of sympathetic nucleation adjacent a rupture plane. The ensuing images focus on the phenomenology of SCC, which further illustrates sympathetic nucleation. Thereafter, the crack’s transition from growth along the surface favored by the free-surface effect, to its growth TW controlled by fracture mechanics is outlined. As has been noted earlier, the response of the cracking illustrated is conditioned by the relative strengths of the grains in the vicinity of the crack tips and its influence on susceptibility, and the effects of stress shielding due to the surrounding crack locations and their sizes. Figure 54.37 images cracking typical of the crack segments that coalesce axially leading to crack lengths and depths whose continued growth prior to the pipeline’s next IM review could threaten its integrity. Figure 54.37a images a crack segment that had coalesced toward the right, becoming part of a leak path whose overall length was 60.1 mm, with a local TW depth of 9.4 mm (~2.37 by 0.370 in.). This now axially coalesced crack had a length of ~4.78 mm with a depth of ~1.81 mm (about 0.19 by 0.07 in.). Figure 54.37b images a PTW crack front that lay near the center of the just-noted leak path crack. This crack segment was ~20.3 mm long by ~6.2 mm deep (about 0.80 by 0.24 in.). The crack depth to wall thickness ratio, a/t for the first crack noted was 0.19, while that for the second was 0.28. Their sizes lead to aspect ratios respectively at 2.36 and 1.92, which are consistent with the trending of aspect ratio with normalized crack depth as detailed in Figure 53.21 (in Chapter 53). The profile inset below the fracture surface shown in Figure 54.37a approximates that crack’s local path across the pipe’s OD surface. The up-down nature of this profile indicates that the origins of this cracking lay on planes that were slightly offset circumferentially, and/or otherwise were inclined somewhat to the pipe’s axis. Although a similar profile was not inset to Figure 54.37b, a study of this figure similarly shows this up-down progression across its length. Inspection of the inset profile indicates it comprised about 26 directional shifts in the crack’s path, whereas a SEM study at a much higher resolution indicated in excess of 40 potential crack origins. It follows that this crack’s profile comprised a series of shorter cracks with an average length of ~0.12 mm (0.005 in.). The scale of that cracking as they formed, and their directional shifts as they grew and coalesced axially were controlled by the response of the local microstructure to the pressure-induced hoop stress and their cracking environment. The shortest of their lengths are comparable to the scale of the shorter crack segments that were evident in Figures 54.33 through 54.36. Figure 54.37c through f shows tilt-offset views of cracking typical of that evident across the OD surfaces of these cracks, and other larger cracks. The traits within these images suffice to show that their growth and coalescence along the pipe wall were consistent with the sympathetic nucleation process, as follows. The prominent feature centered along the OD in Figure 54.37c, whose width has been highlighted by the shorter arrow, appears to be the origin of the larger thumbnail-shaped crack that runs almost the full width of this image. The length of this crack is 588 μm (~0.023 in.), while its depth is 290 μm (~0.011 in.), which gave an aspect ratio of 2.03. A closer study within this prominent feature via SEM revealed a still smaller crack. It also revealed several other adjacent similarly sized smaller cracks lying across its width. Figure 54.37d images one of the several just noted similarly sized smaller cracks, which lay to the left side of the slightly larger central crack. As above, arrows have been inset to help in identifying their locations. Consistent with the ligaments separating the very small cracking imaged on the pipe’s OD surface in Figures 54.33 and 54.34, these smaller adjacent thumbnail-shaped cracks lie slightly separated from one another. Inspection of Figure 54.37d indicates that these smaller cracks have lengths that span a few grains, which was easily determined given this was IG cracking. Their lengths typically were ~70 μm (0.003 in.), with aspect ratios slightly more than 2—consistent with PSG from the OD surface of the pipe. The slightly larger prominent crack had a length of 111 μm (~0.004 in.) and an aspect ratio of 2.14, which also is consistent with PSG. The depth-normalized crack depth for the large crack that spanned the width of this image was 0.035, while that for the first crack noted shallow crack was 0.19, with that for the second was 0.28. Figure 54.37e is unusual in that it images the crack’s growth into the depth as it appears along the OD surface when viewed from within the pipe. In apparent contrast to the up-down profile inset to approximate the crack’s OD path (i.e., Figure 54.37a), the local profile in this crack comprises a sequence of short, straight, nearly colinear cracks separated as its path steps circumferentially to intersect and coalesce with other similar cracking. That said, resizing to view these cracks at comparable scales eliminates this disparity, the inference being their traits are also comparable. The perspective used to image Figure 54.37e was found to best reveal the cracking as it initiated and grew from the two cracks that lie central in this image. While difficult to discern at the scale used, SEM examination and related work indicated their sizes were similar: one had a length of 159 μm (~0.006 in.) and an aspect ratio of 1.77, while the second was slightly shorter at 152 μm (~0.006 in.) and an aspect ratio of 1.69. The crack depth to wall thickness ratio, a/t for the first crack noted was 0.004, while that for the second was 0.006. Figure 54.37 Traits of sympathetic origins across the OD surface of larger cracks. (a) Toward the left end of a long crack; (b) centrally within a much larger crack; (c) PSG emanating from an OD surface origin; (d) detail in part (c)—the length scale spans 50 μm; (e) cracking viewed toward the OD surface; (f) 1829 μm long crack with aspect ratio of 3.21. Finally, Figure 54.37f images the largest of the shallow thumbnail-shaped cracks considered as this progression toward growth into the depth driven by the increased stress intensity at the deepest sites along the crack front. The length of the crack that runs almost the full width of this image is 1829 μm (~0.072 in.). In spite of being the longest crack, it has not yet experienced much growth into the depth as its normalized crack depth remains small at 0.069, with its aspect ratio at 3.21. As for Figure 54.37c, a closer study across this crack via SEM revealed several smaller crack segments the locations for three of which have been highlighted above by arrows. Suffice it to note in view of this image that the growth of cracking with normalized depths in the order of 0.07 continues by coalescence along the surface between adjacent cracks whose sizes and locations appear consistent with sympathetic nucleation as illustrated along the OD surface in Figures 54.33 and 54.34. As sympathetic nucleation is an autocatalytic process, once it is established it could be difficult to stop—yet it is well known that many shallow cracks become dormant—both in the field and in the laboratory. Understanding dormancy in this context could open a path to managing such cracking. Taken together the images discussed indicate that larger cracks develop by stepwise axial coalescence between crack segments formed at the microscale. Related work [5] considered shortly indicates that normalized depths in the order of 0.07 lie at the upper bound for cracking by a PSG process, whereas at shallower depths cracks coalesce axially forming clusters of cracking like shown in Figures 54.33 through 54.37, with individual aspect ratios close to 2. As pairs of short near-semicircular cracks coalesce axially, their now coalesced length is roughly double their individual lengths. Likewise, when three adjacent similar cracks coalesce axially the resulting length is roughly triple that of their individual lengths, and so on for larger groups of similar adjacent cracks. Crack depth increases in response to this axial coalescence, but lags somewhat as PSG must first fill in the gap between their semicircular fronts, and thereafter develop across the coalesced crack pairs; similarly across groups of adjacent coalesced cracking. As fracture mechanics presupposes the existence of a well-defined crack front, it is reasonable in view of the above imaging to conclude that this stepwise PSG growth persists until that well-defined crack front emerges. Fracture mechanics texts (e.g., Ref. [36]) indicate that as the crack’s length increases, the crack-driving force increases for growth into the pipe wall, but relatively less so for growth along the pipe’s surface—which holds true for crack pairs (e.g., Ref. [7]). It follows that once such a crack front emerges that crack growth into the depth will increasingly outpace the growth in its length. The traits evident in Figures 54.33 through 54.37 indicated that this cracking, which was cut from field failures and digs, had initiated and grown by crack coalescence along the pipe’s surface by synergistic nucleation. Each microcrack nucleated within or along grain boundaries that were adjacent to prior cracking at sites, offset circumferentially slightly from their neighbors. The effects of differences in microstructural composition and grain-to-grain orientation were evident for some IG cracking, affecting initiation on differing crack planes—and showing clear local differences in susceptibility. As the size of the cracking increases and a dominant crack front emerges, the effects of their cracking history on the crack’s path becomes evident in the 3D nature of the crack’s path, as detailed next in reference to the crack segment imaged in Figure 54.38. Viewed from the OD, this segment lay at the left end of several axially coalesced crack segments with a total length of ~0.866 in. (22 mm) and a maximum depth of 0.0868 in. (2.20 mm). Although located at the left end of that crack, the opened faces of its cracking are mirrored about its length, with the crack face imaged here being its reflected image—thus this imaging appears reversed left to right. Its size is comparable to that of many of the crack segments that comprise the in-service ruptures and leaks shown earlier in Figures 54.17 and 54.18. Figure 54.38 shows about two-thirds of the length of what was a symmetric semielliptic crack that was divided axially to image the local microstructure on its through-thickness x section. From that, this steel showed a lightly banded F–P microstructure throughout the wall, which appeared typical of the pipelines constructed in the United States from the late 1940s into the early 1960s. Its grain size varied, ranging from ASTM 8–10. This crack’s overall length, 2c, was 0.200 in. (5.10 mm), and its maximum depth was 0.087 in. (2.20 mm), such that this portion of this crack had grown well into the pipe wall, for which a/t was 0.27. Part (a) of Figure 54.38 images this crack segment in perspective to help distinguish the SCC from the surrounding brittle fracture used to open it after a soak in LN. Part (b) is a SEM image whose depth of field reveals the nature of this cracking, which has been overlaid with aspects of this cracking, along with its size and other notations. Part (c) presents a perspective SEM view along much of this segment, which emphasizes the still discontinuous cracking process that was active across its fracture surface, and along its crack front. Part (d) is a close-up within part (a), which details the nature of the crack advance along one of the four major segments of this cracking. Finally, part (e) presents a schematic that bounds these four segments. Figure 54.38 Fracture features on a shallow IG cracking within a sparse secondary cluster. (a) Perspective image; (b) SEM image with dimensions; (c) detail of the cracking and its growth history over a large portion of this crack segment; (d) close-up perspective color image; (e) schematic of the cracking and its growth. The lower margin of Figure 54.38a is the OD surface of the pipe, which indicates that this initially painted OD surface had suffered corrosion under a local disbond in its line-travel over-the-ditch coal-tar coating. The black coloration is characteristic of the Magnetite-Siderite film often found in association with SCC, whereas the highly reflective area is brittle fracture. The radial features evident in part (a) reflect cracking that had initiated on differing planes and continued on those differing planes it grew. The brown tinge locally evident along the deepest portions of the crack was easily removed during its ultrasonic cleaning—which prior to cleaning showed the traits of very fine silt that had settled into and along the depths of this crack. After its ultrasonic cleaning, this crack was subjected to sequential cycles beginning with electrochemical exposure in ENPREP 214, which was followed by a wash in Alconox, and a rinse with alcohol (e.g., see Ref. [37]). SEM followed, which at higher magnifications showed evidence of many point-source origins along much of the length of this crack, although toward the center of the crack, these fine features were somewhat obliterated/consumed by corrosion. Four much larger overarching thumbnail features could be identified along the OD surface, each of which has been highlighted and numbered in Figure 54.38b. Smaller thumbnail crack fronts can be identified within them (like those noted in Figure 54.37), as can larger (deeper) ones beyond them—although the deeper crack fronts no longer show point-source response. As is evident in Figure 54.38b, this crack segment comprised cracking that had progressed from and grown as several rather independent crack fronts, which over time had axially coalesced between their independent origins along the OD surface. Higher magnification SEM suggested that the leftmost segment originated from a series of point-sources within the overlaid thumbnail shape labeled 1. Likewise, the more central segments originated from point-sources within the crack fronts labeled 2 and 3, while the right-most segment developed from point-sources within the crack front labeled 4—all of which appear more or less coplanar. This imaging indicated that growth into the depth by up to 2.2 mm (0.087 in.) had yet to establish a continuous smooth crack front, which is clearly apparent in Figure 54.38c. Figure 54.38c and d likewise shows that their growth in-plane and along their crack fronts remained discontinuous—with large growth steps evident between these segments. Finally, the image in Figure 54.39 makes it clear that crack fronts can remain somewhat discontinuous even at depths approaching TW, which for this image is evident from the shear lip formed adjacent to the ID surface as this crack failed. Figure 54.40 shows that similar disorganized crack fronts develop for shallow through deep TG SCC. Higher magnification SEM views and crack-size trending indicate that TG cracking grows into the depth by a stepwise process comparable to that illustrated above for IG cracking. Inspection of Figure 54.40, and that shown in Figure 54.39 for IG cracking, indicate that crack growth into the depth is discontinuous, occurring along segmented crack fronts that lie along the tips of each crack segment—for both IG and TG SCC Areas of isolated growth are evident in the steps that form along the crack’s front, apparently associated with local differences in susceptibility and other microstructural influences. Both IG and TG cracking can develop undulated fracture surfaces wherein the undulations trace back to their microscale origins at the OD surface. These features continue to evolve, even for deep cracks at or approaching failure. Figure 54.39 Disorganized deep IG crack front along the shear lip of hydrotest rupture. Figure 54.40 Disorganized crack fronts for shallow and deep TG cracking. (a) Shallow secondary crack in a sparse cluster; (b) nearby the crack in part (a); (c) typical of deep cracking along a rupture—the corroded OD surface is evident below the cracking. A number of observations led to practical takeaways based on the fracture surfaces and detailed imaging considered and discussed, which include IG cracking grows around microstructural barriers with a 3D component, whereas TG cracking cuts through them in a planar (2D) fashion, as was illustrated at comparable scales in Figure 54.32. For this reason, under otherwise similar circumstances, the 3D nature of IG cracking makes it easier to identify crack fronts and small crack origins. On that basis, the figures used to image and discuss the nucleation and early growth processes of SCC have relied on IG cracking. That said, it is appropriate to trend physically sized IG cracking in contrast to such data for TG SCC, and also to expand the number of the pipelines represented, which has been done in Figure 54.41. Figure 54.41 plots crack length as a function of depth for two large datasets each of which quantifies the response of SCC on several large-diameter gas transmission pipelines. One considers TG cracking, whereas the other comprises IG cracking. Whereas prior trending in Figures 54.10 and 54.23 presented the averaged-growth response of several adjacent similarly sized cracks, the datapoints in this figure each represent one crack. The dataset represented by the x symbols characterizes IG SCC, while those shown by the + symbols characterize TG SCC. Figure 54.41 Trends for crack length versus depth for dense IG and TG SCC. Because these datasets cover a range of pipe diameters and wall thicknesses, in Grades X52 and X65, the measured crack lengths and depths have been normalized to provide a common basis for plotting. Lengths as usual have been normalized by the square root of R × t, while crack depth has been normalized by the nominal wall thickness. The local slope of the data-trend within this normalized format is an indirect measure of the aspect ratio.16 Values of the aspect ratio that trend about 2 are consistent with point-source growth—which this figure shows occur only at shallower depths. As the cracks deepen, the aspect ratio deviates from PSG response, tending to sharply increase—which for these results leads to aspect ratios that approach 10. Inspection of this figure indicates that the results for the IG cracking show less scatter and a clear lower-bound trend, which indicates the birth and early growth of IG SCC occurs at an aspect ratio of about 2, consistent with PSG. While the trend for the TG cracking shows more scatter, it too indicates that the shallower TG cracking shows PSG, as the values of their lower-bound aspect ratios hover near 2. In the format of this plot it is apparent that the transition from PSG at origins is more or less completed for both cracking mechanisms at normalized depths in the order of ~5% of the wall thickness. Given the wall thicknesses involved, the upper-bound depth for PSG lies in the vicinity of absolute crack depths ranging between 0.016 and 0.020 in. (0.41and 0.5 mm)—the order of several ferrite grain diameters. The onset of the shift away from PSG is evident in Figure 54.41 for both IG and TG cracking at normalized depths in the order of ~2% of the wall—or about 0.006 and 0.008 in. (0.15 and 0.20 mm). This range of depths corresponds to about 6–8 grains, such that it is consistent with growth moving beyond the effects of the free surface, as discussed in the prior chapter. The onset of this transition also begins at crack depths that lie within the range of transition crack depths, dTH, which defined the shift from free-surface- to fracture-mechanics-controlled cracking (see Figure 53.11 in Chapter 53). This consistency with crack depth for both IG and TG cracking indicates that the modeling approach introduced in the prior chapter and developed herein regarding coalescence is conceptually and quantitatively viable for both forms of SCC. Given the range of crack sizes and crack-tip spacings evident earlier in the dense versus sparse clusters, as well as between secondary cracking versus leaks versus ruptures, expanding the scope to consider sizes up through failure presents a wide range of plausible outcomes. As for the dense cracking considered in Figure 54.41, the range of outcomes as the cracks grow deeper is largely controlled by stress shielding and by the initial frequency and proximity of the cracking. Absent the role of stress raisers or other factors, growth into the depth becomes bounded within a dense cluster. It is for this reason that the crack depth for such cracking appears bounded at less than 10% of the wall thickness in Figure 54.41. Note in this context that the NN-pH and high-pH images of dense cracking showed tight spacings axially, as well as circumferentially (see Figures 54.8, 54.9, 54.12, and 54.13). In contrast, those same figures indicated that those spacings for the secondary cracking, and the leaks and the ruptures were generally much larger. It follows that two quite different scenarios are possible for sparse cracking—which in such cases are largely controlled by the maximum operating pressure and the steel’s resistance to cracking. Where the maximum operating pressures are lower, and/or the steels are more resistant, the axial spacing between sites supporting nucleation becomes larger—such that axial coalescence is less likely. If axial coalescence is less likely, then growth continues into the depth with little axial growth and equally little possibility of rupture—such that leaks become probable. On the other hand, if the combination of maximum operating pressure and the steel’s resistance to SCC lead to axially spaced clusters close enough to support axial coalescence and growth, then ruptures become more probable, and ensue if the coalesced crack length exceeds the critical length for that steel and operating situation. Because tougher steels support larger stable cracks, SCC can grow to appreciable sizes without failure, leading to longer lives. This same scenario plays out if the ACS is very slow, as it takes a much longer period to develop a crack of critical length. Such cracking remains stable longer—leading to secondary cracking that might be located by a hydrotest, or by some type of nondestructive inspection or ILI, or other practice like SCC direct assessment. In contrast, because cracking in lower toughness steels becomes unstable after limited growth, rupture and leaks could occur much sooner. Likewise, where aggressive environments or susceptible steels are involved. Figure 54.42a summarizes data based on physically measured crack sizes for each of these four cracking scenarios. Again, normalized axes are used to accommodate the range of pipe geometries involved, with data shown for both IG and TG cracking. Inspection of Figure 54.42a indicates that the dense cracking considered in Figure 54.41 lies within the lower left corner, which is anticipated as these datasets are respectively similar in content to that shown in Figures 54.10 and 54.23. In contrast, the data for sparse field cracking found via digs, as well as that found along ruptures or via leak detection span the range of depths up through values that correspond to the wall thickness. As expected in view of the above discussion and its scenarios, leaks and the associated but nonleaking segments tend to group at depths equal to the full-wall thickness, or approaching it. Also consistent with the above scenarios, ruptures and secondary cracking fall between the dense cracking and the leaks, with the secondary cracking typically developing shorter cracking as compared to that for the ruptures. Finally, given that hydrotests are expected to expose larger cracking this data tends to group at depths in excess of 40% of the wall thickness. Consistent with the above scenarios, these hydrotest failures comingle with leaks and ruptures, and due to the higher wall stress tend to fall at shorter lengths—although differences in toughness will tend to mask this trend. Figure 54.42 Normalized crack length as a function of normalized depth. (a) For sparse IG and TG SCC; (b) as part (a), but including the prior datasets. Figure 54.42b adds the three datasets used to broaden the scope of Figure 54.10, as presented earlier in Figure 54.23. As for Figure 54.23, this broader scope bridged the gap in Figure 54.42a between the dense cracking at very shallow depths and the sparse data that at normalized depths greater than 40% of the pipe wall. While a trend is evident that shows deeper cracking is associated with longer cracks, it is equally apparent that short deep cracks do occur—as was evident in Figure 54.22. Also, data representing longer shallower cracks is evident. Suffice it to note in view of this response that there is no typical aspect ratio for SCC, such that the blind choice and use of one could have unfortunate consequences. As alluded to earlier, the modeling concepts introduced earlier and the transition crack sizes developed in that context appear to be broadly consistent with the phenomenology of field crack initiation, growth, and failure, as illustrated in detail in Figures 54.17 through 54.21 and in Figures 54.33 through 54.40, and as trended to summarize that response in Figures 54.22, 54.41, and 54.42. This subsection revisits the bathtub concepts and outcomes in Figures 53.13 through 53.15 in Chapter 53 in the light of this phenomenology, and its quantitative trending, which have been integrated within the conceptual framework of the bathtub curve shown in Figure 54.43. The upper portion of this image presents the phenomenology as well as the physical scale of the processes involved—which runs from the order of the grain size at nucleation (~10–30 μm or 0.0004–0.0012 in.) to 1000 times that or more regarding the scale of the cracking that threatens integrity. The lower portion of this figure presents the same conceptual schematic as was shown in Figures 53.14 and 53.15 (in Chapter 53). Because the phenomenology of this chapter is broadly consistent with the concepts and the transition from free-surface- to fracture-mechanics-controlled growth adopted therein, Equations (53.1) and (53.2) and the predictive approach outlined in Chapter 53 remain a viable basis to quantify the field response for IG cracking. As discussed earlier, the coating must degrade and a disbond must form, as must the cracking environment (subject to seasonal differences and the soils/terrain, etc.) before SCC can nucleate, which here is denoted Stage 0. Stage I in Figure 54.43 continues to characterize the initiation and early growth under the influence of the free-surface effect. Consideration of the phenomenology indicates that Stage II of the prior chapter correctly reflects the shift in cracking response as the cracking deepens beyond the effects of the free surface because restraint to microplastic flow develops due to the surrounding subsurface grains. Although Stages I and II differ phenomenologically, this transition in the role of the free-surface effect as it occurs in a TT test specimen is comparable to that on a pipe’s surface provided that their surfaces were similar. Data from TT testing with native surfaces in field-relevant environments would satisfy this requirement. It follows that Stages I and II can be reasonably quantified by the decreasing power-law growth response evident in such testing, as underlies the approach implemented in the context of Figures 53.14 and 53.15 (in Chapter 53). Finally, the phenomenology was consistent with the threshold and transition concepts, and the depths that underlay quantifying the bathtub curves developed in Figure 53.15 (in Chapter 53). In addition, the phenomenology evident for TG cracking has been shown to be comparable conceptually to that for IG cracking. On that basis, the consistency demonstrated in the prior chapter for IG cracking between predicted cracking speeds and service lives can be reasonably anticipated to develop in regard to cases involving TG cracking. Work to evaluate this plausibility is currently underway. A number of observations led to practical takeaways based on the fracture surfaces and detailed imaging considered and discussed, which include Figure 54.43 Field phenomenology overlaid on the bathtub curve and its concepts. Earlier the occurrence of multiple cracks, and branching and bifurcated crack paths were discussed in regard to x sections that illustrated their effects concerning IG versus TG cracking and the role of the microstructure. Branching and bifurcation also occur macroscopically, often as a consequence of crack-tip blunting. Bifurcation at the macroscale was evident early in this chapter, where it was apparent to the unaided eye in the upper two images shown in Figure 54.3a. Crack tips can blunt in response to the plastic stretch that develops across a crack tip due to a step increase in pressure, as occurs in a high-pressure hydrotest. Blunted tips also can form due to an aggressive environment resident along a crack tip. The larger the step increase, and/or the deeper the initial crack, the larger the stretch that develops across a pressure-induced blunt. A similar situation develops when corrosion blunts the tip, except in this case, the scale of the blunt depends on the nature of the corrodent and its residence time, in addition to the pressure and the crack depth. This subsection first outlines the mechanics of blunting. Thereafter the effects of hydrotest-induced and corrosion-induced blunting are discussed along with their implications concerning delayed SCC growth and/or its dormancy. FEA of the deformation response local to an axial crack in a tough strain-hardening steel provides insight into the plastic flow that occurs locally and globally due to a large step increase in pressure. Figure 54.44a shows the (radially magnified) deformed shape on a transverse section of a pipe local to a long axial slit with an initial through-wall depth of 50%, which has been overlaid on its unpressurized shape [38]. In comparison to its initial shape, it is apparent that (1) the pipe has ovalized globally; (2) the wall has thinned appreciably local to the slit; and (3) significant local stretch has occurred across the crack tip, while rotation has occurred local to the plane of the crack. In contrast, much less tough steel with comparable flow properties fails on a cross section much like that of the undeformed mesh in the background of this image, absent appreciable ovalization, local thinning, and/or local deformation or rotation. It follows that the properties of the steel can have a first-order effect on the outcomes of a hydrotest and/or a pressure hold at service pressures [12, 16]—with the same often evident in regard to the thresholds for the initiation and growth of SCC. The viability of the traits evident based on the FEA is confirmed by the deformations and stable tearing that have occurred in full-scale testing under similar circumstances [16]. This is apparent in Figure 54.44b, which shows the deformed pipe shape and deformations local to the axial slit that had failed in such testing. Because that image reflects a full-scale test that continued to failure, the events apparent therein carry beyond those of the stable deformed state shown in Figure 54.44a. Consistent with the results of the FEA the full-scale test shows local stretch and rotation, which opened the initially tight sharp V-notch and led to its blunting. Thereafter, cracking initiated at the blunted tip, and as the imposed pressure continued to increase it led to stable then unstable tearing through-wall, and rupture of the vessel. Figure 54.44c shows a cross section through the cracking process that has initiated and grown well beyond the blunt, but was interrupted just prior to becoming unstable and growing through-wall. Initial symmetric bifurcation is apparent in this image on either flank of the V-notch—each site is circled in the image. Whereas the steel’s properties that control this process can be chosen uniform when numerically modeling this cracking, which leads to symmetric bifurcation as has almost occurred in reference to Figures 54.28d and 54.31a, this seldom occurs in practice. Rather, the subtle differences in the local properties tend to promote the continued growth of a dominant branch, as occurred in Figure 54.31c and d, as well as in Figure 54.44c. This dominant branch then develops along its path of least resistance by continued MVNC, with local micro-blunting briefly occurring early along that path as highlighted in a few cases by arrows. Voids ahead of and along the growing crack tip also have been highlighted by arrows in Figure 54.44c, as have the remnants of voids that have coalesced and failed, which now lay in the wake of its growth. Figure 54.44d schematically depicts the transition from an initially sharp crack to one that has blunted. It indicates the stretch zone that forms as it blunts in response to the increasing local stress field and the change in crack size as this occurs. This schematic also depicts the lobes of intense plastic deformation and the slip planes that form within those lobes, which favor the initial growth from that blunted tip. Eventually, this shear-plane tearing turns in response to the maximum principal stress whereafter the growth continues through-wall. Finally, this schematic infers a role for strain hardening, which in high-hardening steels affects increased resistance to the microplastic flow that was noted as causative of both forms of SCC [3, 25]. In turn, this implies that the effects of strain hardening could be as important as the effects of blunting in slowing or stopping SCC. Figure 54.44 Characterizing ductile stretch and cracking local to a highly stressed crack tip. (a) Deformed and undeformed meshes local to a highly stressed axial crack-like feature; (b) image local to V-notch that blunted and initiated leading to failure in a full-scale test; (c) bifurcating tip (circled), one nucleates voids that coalesce and blunt sequentially (arrows); (d) schematic of blunting, opening stretch, and bifurcation at the deformed crack tip; (e) J–R curves showing blunting and initiation lines and the ensuing crack growth resistance (see Footnote 17); (f) typical trends in the crack-driving force, JD, for a specific aspect ratio and pipe size. 17Prior work has shown that the resistance to cracking depended on the effects of prior plastic deformation, including pre-strain and cyclic deformation (e.g., [39]). This motivated work in the mid-1990s to determine if J-Resistance curves responded similarly, and if blunted crack-tips affected the outcome. Data [40] were reported for two X52 and X70 steels concerning pre-strain whereas the effect of a blunted crack-tip was reported for X46 and X80. The data showed the initiation resistance was reduced significantly by modest pre-strains (more so for the X52). In contrast, as expected the initiation resistance increased with increasing tip radius for the X46 and X80 steels. Subsequent independent work confirmed these effects regarding initiation [41]. It is clear that these effects offset – but to what extent? As such effects can be significant, they should be considered. Nonlinear fracture mechanics (NLFM) characterizes the ductile crack growth process illustrated in Figure 54.44c and d in terms of the resistance to cracking, denoted JR, and a crack-driving force, denoted JD. The resistance is quantified in terms of a J–Resistance (J–R) curve, like that shown in Figure 54.44e, while the driving force is quantified in the manner shown in Figure 54.44f. The y-axis in Figure 54.44e quantifies the value of JR, while the x-axis denotes the change in crack depth. Inspection of this J–R curve indicates three regimes of unique crack response. At values of JR along the resistance curve below the “blunting line” the crack’s tip is considered to remain sharp. At values of JR just beyond the “blunting line,” herein denoted JRb, the crack’s tip is considered to begin to blunt. As the value of JR just passes the “initiation line,” hereafter denoted JRc, the blunting process gives way to the onset of cracking. Once initiated, the resistance to its continued growth is indicated by the local slope of the J–R curve, denoted dJ/da. Fracture mechanics textbooks detail this process in general, with pipeline-specific applications evident in the literature (e.g. [12]). Figure 54.44f presents typical trends for values of the crack-driving force, which in its most rudimentary form for a pipeline is a function of the pressure, P, and the crack depth, a. The driving force in this simple context has the form JD = JD(P,a). Handbooks (e.g., Ref. [42]) have tabulated results for a few cases involving axial cracks that include the role of strain-hardening exponent. On that basis the potential influence of strain hardening associated with the stretch zone and blunting indicated in Figure 54.44d can be embedded in JD, and so could be assessed easily. The corresponding effect of hardening on JRb and JRc can only be assessed by testing material cut from panels of the same steel that were prestretched to a targeted average prestrain. Experience has shown that the distribution of strains can locally vary appreciably within the test panel. To limit scatter due to their variation, the distribution of local strains should be characterized using an overlaid circle-grid or more modern scheme, like DIC (digital image correlation). In this way, the prestrain specific to the blunting and cracking during each J–R test can be accounted for. Experience also has shown that the use of the trends reported in handbook solutions generally requires case-specific benchmarking (e.g., Ref. [12]). For this reason, care should be taken to benchmark those trends using case-specific values of JD, as quantified via FEA within the usual limits of its validity. Avoiding the uncertainty that could develop in this approach requires that case-specific values of JD be quantified parametrically via FEA to the full extent necessary. The results in Figure 54.44f reflect trending FEA results from the meshing and runs made for just one crack aspect ratio. These results are specific to the piecewise flow properties measured from the onset of plasticity through uniform elongation for the specific steel of interest. The y-axis in Figure 54.44f presents JD as a function of the normalized pressure shown on the x-axis, with each of the contours specific to a thickness normalized crack depth, a/t. The values of JRb (blunting) and JRc (initiation), from the J–R curve in part (c) have been overlaid on this plot, as have the pressure levels corresponding to hydrotesting at 90% (the Code minimum), 100, and 110% of SMYS. The sequence of images outlined in Figure 54.44a–d characterize aspects of a crack-tip’s response as the pressure increases through failure, which occurs at cracking whose sizes are exposed by the hydrotest. Crack tips in the remnant crack population (those that survive the hydrotest) experience a much different pressure sequence during the test, and thereafter. Once the target peak pressure is achieved, their crack tips experience the effects of decreasing pressure. This occurs as the peak pressure decays to zero, either as the line drains local to a hydrotest break, or as the pressure is released, and water is moved on to the next test section. After the line is rehabbed, and dried and refilled, this population of remnant cracking experiences an increase in pressure as the pipeline returns to its usual operational conditions. As the peak hydrotest pressure begins to decrease in the above sequence, the localized plastic flow within the stretch zone at the crack tip begins to be compressed by the large elastic field that surrounds it. This compression increases as the pressure continues to fall, which eventually leads to closure along the crack tip. These effects are greatest at zero pressure. Elastic constraint around the plastically deformed crack tip leads to compressive stresses local to the crack tip. While this compression stress diminishes as the pipe is repressurized, because that compression reflects the effects of the much larger test pressure, the zone local to the crack tips in the remnant cracking remains under compressed, which causes closure at their tips. The local compression diminishes the cyclic pressure stress range within the crack-tip zone, which drives the stress component of the SCC, while the strain hardening within that zone limits the extent of microplastic strain that long has been considered causative for both forms of SCC [3, 25]. In addition, crack-tip closure can block access of the cracking environment to the crack tip. Hydrotesting in this context has the potential to simultaneously reduce or remove all three mutually necessary factors for SCC, as it can: (1) reduce the effects of the stress component of SCC, (2) reduce the susceptibility of the steel (microstructure) to cracking in both environments, and (3) block access of the environment to the crack’s tip. Three keys are critical to affecting these outcomes within a hydrotest section. First, blunting and strain hardening must be developed by the test history. Second, the crack’s tip must remain well within the compressive zone affected by the blunting. Third, this must occur at all crack tips within the hydrotest section whose sizes pose an integrity threat during the next reinspection /revalidation interval. All of these benefits disappear if the hydrotest history affects crack initiation and growth beyond the blunt. Equally critical, initiation must be avoided, because the zone affected by blunting is small and therefore lies close to the crack’s tip—such that very little growth beyond the blunt can eradicate or diminish these benefits. Local compression and crack-tip closure and its related effects have been suitably modeled in aerospace applications since 1970 [43], as has a crack’s acceleration or retardation depending on whether the overload involved tension or compression [44]. The potentially beneficial effects of pressure tests due to such effects have been suitably modeled since the early 1990s [45, 46], with clear benefits quantified for select test histories circa 2000 in work that considered SCC [15]. This prior work and similar studies have shown that the flow and fracture properties of the steels involved play a key role in quantifying and understanding when blunting might be beneficial, with insight into their role evident in Refs. [12, 15, 45, 46]. As becomes evident shortly many factors other than the steel’s properties also can play a significant role. Hydrotesting has been used to expose cracks whose size was considered an integrity threat since the 1950s. The optimal hydrotest for such purposes would quickly expose the “near-critical” cracks, doing so without growing the remnant cracking—because this would avoid pressure reversals when the pipeline was returned to service. By the early 1990s [45, 46], it was apparent that this could be achieved by a high pressure imposed for a short time period, coupled with a lower pressure to ensure leak detection while limiting the time-dependent growth during the hold time for that leak check. Based on this observation, parametric simulations of a crack’s response to pressure-time histories were made to determine the optimal combinations of hydrotest pressures and time-holds for the class of steel that was in common use [46]. These simulations were based on modeling that coupled mechanics that addressed (1) pressure-driven cracking and (2) cracking driven by high stresses sustained during the hold time for the leak check [45]. Those simulations first determined the range of peak pressures to quickly expose the near-critical cracks, and thereafter sought leak check hold time pressures that balanced leak detection with minimizing growth during the leak check for hold times up to 24 h. This early 1990s work [46] developed and illustrated the utility and effectiveness of what became known as the “spike” hydrotest. Hydrotest parameters for these parametric simulations designed to avoid failure could be determined easily because the inputs to these analyses were specified in terms of representative properties and remnant crack sizes, and the pipeline’s operational history was set relative to the maximum allowable for pipelines in open-country service. The results of these simulations were then trended, which led to two opposed extremes in the hydrotest pressure to be applied over the course of the hydrotest. The peak (or spike) pressure targeted quick failure of the near-critical cracking for the class of steel considered, which then targeted 110% SMYS—thereafter, the simulations determined that continued cracking could be minimized in balance with detectability if the leak check was done at a pressure reduced from the peak by pressure 10% [46]. While the results of the 675 simulations made for the base parametric matrix could be trended leading to the above outcomes, other simulations made over the course of sensitivity studies led to some disparate results. They also revealed that in addition to being sensitive to the average flow and fracture properties used (as noted earlier), the outcomes could be equally sensitive to (1) the ratio of the peak test pressure to the pressure corresponding to the AYS used; (2) the sizes of the remnant crack population considered, and their locations relative to the low-point location for the test; (3) the locations of elevational differences relative to the low-point; and (4) the assumed distribution of the flow and fracture properties throughout the test section, overlaid on the locations of the remnant cracking. If the assumed remnant crack population included more than one near-critical crack, then typically only one among them failed, which dictated retesting. In addition, it was noted that if for any reason the crack tip grew beyond the zone of compression, then the test was ineffective. While not considered then, it has since been recognized that the same outcome would occur if corrosion consumes the zone of compression. In contrast to hydrotests whose objectives can be met at opposed limits on the test pressure, the discussion relative to Figure 54.44 indicated that the optimal hydrotest to control SCC would: It follows that the scheme previously found effective to expose near-critical defects, while avoiding pressure reversals, now also must affect this process while also achieving blunting that affects compression and strain hardening sufficient to control the SCC. The three regimes of unique response noted earlier regarding the J–R curve (cf. Figure 54.44e) also are key in designing hydrotests to manage SCC. In view of these regimes, the optimum test to control SCC18 must first affect crack-tip blunting, as it affects the compression local to the crack’s tip and crack closure. In regard to Figure 54.44e, this requires a hydrotest that would drive JD along the J–R curve to levels just beyond the “blunting line,” that is, JD ≥ JRb. In addition, the optimum test to control SCC must avoid/minimize crack advance, such that this test would keep the value of JD below the “initiation line”; thus, JD ≤ JRc throughout the remnant population. Finally, to expose the near-critical cracking, the hydrotest must drive JD past the “initiation line” for these cracks; that is, JD ≥ JRc, doing so to a level that quickly exposes the near-critical cracks subject to dJ/da, while avoiding growth within the remnant population, such that JD ≤ JRc throughout the remnant crack population. The challenge in designing optimal pressure–time histories is neither analytical nor numerical: experienced yet practical subject-matter experts can deal with this. Rather, it traces to three unknowns and the observation that JRb and JRc lie in close proximity along the J–R curve. The three unknowns include Regarding the proximity of JRb and JRc, inspection of Figure 54.44e indicates that for this example dataset JRb = 87 KJ/m2 and JRc = 102 KJ/m2, such that their values differ by just 15 KJ/m2 (values in US units are evident from the figure). In relative terms, this difference might be considered large. However, what is large must be assessed in reference to values of JD, which are specific to the remnant crack population and the near-critical cracking, and can be inferred from relevant data such as that in Figure 54.44f. Due to constraints imposed on its release, this figure does not specify the crack shape that its depth contours characterize. Suffice it for present purposes to note that data from EMAT tool runs place its dimensions toward the lower side of some remnant SCC crack populations. Subject to the above values of JRb and JRc, an inspection of Figure 54.44f indicates that a code minimum hydrotest pressure would not cause blunting, even for the deepest of the cracks shown (a/t = 0.9). As such, a hydrotest to a minimum of 90% SMYS would have no effect on the remnant cracking at depths less than 90% of the wall thickness. Likewise, it is apparent that testing to 100% of SMYS would marginally affect blunting for the deepest of the cracks shown, but would not cause cracking. As such, specific to the properties and the crack aspect ratio considered in these analyses, compression and crack closure would develop, which in turn would make such a test effective for this very deep cracking. That said, the remnant population—which comprises the practically relevant cracking—would remain unaffected by this relatively high pressure. Finally, it is apparent in Figure 54.44f that testing to 110% affects blunting for cracking deeper than 50% of the wall, but also initiates growth beyond the blunt for cracking deeper than 60% of the wall—although at the shallowest of these depths, little growth would occur. Unfortunately, even at 110% of SMYS much of the remnant population is unaffected—yet much of that cracking could pose an eventual risk of failure based on Figure 54.42, in spite of this very high test pressure. It follows that this hydrotest would be considered ineffective or detrimental because it would lead to (1) a remnant population that continued to pose a potential integrity threat; (2) deeper cracking that was prone to growth during the hydrotest, eliminating the beneficial effects of compression and crack closure, and/or (3) growth in the sizes of the remnant cracking. The discussion to this point indicates that designing hydrotest pressure-time histories that blunt but do not promote cracking beyond the blunt will pose a challenge in the field applications—because in such cases the crack population is unknown, and the average properties might at best be guesstimated. The longer the hydrotest section, the more difficult it becomes to achieve this because elevational differences modify the desired pressure-time history. Moreover, as the length of the test section increases the remnant cracking and properties distributions become more varied. Likewise, the chance that the remnant crack population includes one or more near-critical cracks increases, such that the likelihood of retesting increases. In view of the above, success or failure in hydrotesting to control SCC involves four potential outcomes, which to facilitate the discussion in the ensuing subsection are labeled I to IV. Outcome I covers hydrotests that have no effect or value, in that either SCC was absent or blunting does not occur. Outcome II groups tests that were effective because the crack tips in the remnant crack population that posed a threat were blunted, doing so absent detrimental growth. Outcome III groups tests that were ineffective because initiation and growth occurred for the deeper of the remnant SCC (i.e., the test failed to control SCC) and also detrimental because it grew the sizes of the remnant cracks, which as time passes expands the population that poses an integrity threat. Finally, Outcome IV is comparable to III, except that it leads to immediate failure. Although there are four potential outcomes of hydrotests done to control SCC, illustrative examples readily exist only for three—because the associated cracking leads to a failure, whose subsequent analysis documents the features involved. In contrast, hydrotests that successfully control SCC (Outcome II) tend to go undocumented—unless a failure ensues locally. On this basis, illustrations follow in Figures 54.45 through 54.47 for Outcomes I, III, and IV. Three of these involved TG SCC on line segments where field digs had over time documented NN-pH disbond fluids.19 While aspects of these are similar, these events were unrelated. A fourth involved IG SCC, as it minimized the potential effects of the environment on the crack-tip profile. Figure 54.45a shows a x section cut through cracking that lays a short distance from the origin of a hydrotest rupture. This cracking was not contiguous with that of the origin but was intersected as that rupture propagated axially down the pipeline. For that reason, failure through this section did not develop from either branch of the bifurcation evident at the deeper of the cracks apparent in this image, but rather formed as this cracking was intersected along the rupture path. Measurements indicated that the bifurcation divided by the rupture path grew from cracking whose depth was 49% through-wall. As the branches of this bifurcation developed significant growth beyond their originating crack tip, the test pressure driving the rupture not only sufficed to initiate blunting but likely was close to driving one of these branches to failure had the rupture not been triggered nearby. It also follows that cracking somewhat shallower than 49% also would have bifurcated and grown as well. Related measurements indicated that the cracking to the left side of the axial split was 27% through-wall while that to the right side was slightly shallower at 19%. The tips of these much shallower cracks remained sharp: surprisingly, in spite of their growth in a NN-pH environment neither showed evidence of blunting or the onset of bifurcation based on OM done at 100X. Related OM showed the presence of still shallower cracking on the OD surface of this x section whose crack tips likewise had remained sharp. The absence of blunting at either of the shallower adjacent cracks indicates that cracking to a depth greater than 27% through-wall was required to cause blunting given this pipe steel’s properties, and the test pressure when rupture occurred. Given the significant postblunting growth beyond the tip of the 49%-deep crack, this pressure history would have caused blunting at depths less than 49%. That said, based on the absence of blunting at the two cracks that lay to either side of the rupture path, it can be concluded that without blunting this hydrotest would not retard the growth of the remnant SCC that was 27% through-wall or shallower. These and other similar or shallower sharp cracks are typical of Outcome I. Because cracks this depth and shallower comprise much of remnant SCC populations based on EMAT ILI data, it can be inferred that this test failed to meet its primary target for much of the remnant cracking. The upside is that at their current depths such cracks did not pose an integrity threat. Given the discussion to this point, it should be apparent that the cracking response to a hydrotest, like that shown in Figure 54.45a, could differ from other x sections elsewhere within the same hydrotest section. Even though all such cracks were subject to the same “optimum” pressure history, the local sizes of the cracks can differ, as could the pipe’s properties, its cracking environments, and its elevation. On this basis, the range of circumstances captured in Figure 54.45a could be distributed to some extent throughout a hydrotest section. As just noted, the response of its shallower cracks comprises Outcome I, while the response of its deeper cracking corresponds to Outcome III. Finally, given that the deeper cracking in Figure 54.45a lay in close proximity to the origin, it is reasonable to assume the response at the origin was similar to that imaged—except that its local drivers exposed near-critical cracking, which corresponds to Outcome IV. Figure 54.45 Illustrated outcomes of hydrotesting, here associated with TG and IG SCC. (a) Still-sharp cracking adjacent to hydrotest-induced blunting; (b) deep yet sharp IG SCC. While Outcome I was imaged in Figure 54.45a associated with other outcomes, unresponsive cracking (i.e., those with still-sharp crack tips) is routinely evident in failure analyses on x sections of IG SCC that had been cut remote to the origin and off the plane of its rupture. The deepest cracking imaged in Figure 54.45b is representative of sparse cracking that can be found in IG x sections cut remote to the origin and rupture plane. Whereas the TG cracking involved longer cracks as compared to their depths, the deepest of these IG cracks had an aspect ratio close to 2—much like that for the in-service ruptures shown in Figure 54.22. In spite of its limited magnification, inspection of Figure 54.45b indicates that the tip of the deepest of this cracking remained sharp, which was confirmed via OM that had been done at 100X. The response of the specific crack depths imaged in Figure 54.45a is not transferrable to other situations. This is clear by comparing the blunting and bifurcation evident in Figure 54.45a to the still-sharp tip of the even deeper cracking shown in Figure 54.45b. Such differences in response trace for example to differences in the fracture resistance of the steels involved, or in the pressure histories used. But it also can occur due to differences in their crack aspect ratios, as shorter cracks of the same depth are much more resistant to opening. Consequently, their tips are less prone to blunt. Of these three, analysis indicated that the much smaller aspect ratio dominated the response specific to this comparison. For such reasons, remnant crack populations developed on one system are seldom transferrable to other pipelines. As such, care must be exercised when developing “representative” distribution parameters for use in evaluating candidates “optimum” pressure-time histories. Such is equally the case regarding the properties and the other distributions involved. The features imaged in Figure 54.46 were documented within a secondary crack that lay along the rupture path a short distance from the origin of this in-service rupture. As for Figure 54.45, this SCC was not contiguous with the origin. High-resolution SEM imaging that was done in association with Figure 54.46 showed nondescript features throughout the fracture surface, which were bounded below by dimple rupture. Such nondescript fracture features were earlier noted as characteristic of TG SCC. Control of the TG SCC population remnant on this line segment was sought through high-pressure hydrotesting that was planned initially on a 5-year retest interval. Unfortunately, this in-service break occurred about 4 years after the hydrotest that had been done prior to its return to service, which had targeted a low-point pressure of about 100% of SMYS. Figure 54.46 Illustrated outcomes of hydrotesting, where TG SCC had occurred prior to the test. The cracking apparent in Figure 54.46 is fully consistent with the just-noted O&M history. TG SCC is indicated therein growing from the surface toward a step along the fracture surface that is easily visible along its full length. For clarity, that step has been highlighted by a dashed line laid just below it. NLFM analysis based on the depth of this step below the OD surface, and properties and trends like that in Figure 54.44e and f, respectively, indicate that this depth sufficed for crack-tip blunting, and initiation, during the course of the above-noted return-to-service retest. On that basis, this step apparently formed as the crack tip blunted: it represents the crack-tip “stretch” shown schematically earlier in Figure 54.44d. As this step forms a ridge along the blunt, it has been referred to as a “blunt-ridge.” Observe that portions of a similar ridge can be seen toward the bottom of Figure 54.46, bordering the transition from the SCC into the dimple-zone. These formed as the rupture path opened this cracking, which as noted earlier occurred about a year prior to the next planned hydroretest for this line segment. Because crack-tip stretch causes plastic flow oriented perpendicular to the plane of the cracking, events like blunting permanently “mark” the fracture surface, contributing to a map of a crack’s history. This map is permanent over time unless it is obliterated by corrosion, or marred by mechanical damage due to contact with the mating fracture surface, or in transport. Crack advances by mechanisms like SCC, fatigue, corrosion, and MVNC, each leaves characteristic visual cues on fracture surfaces, which are identifiable with appropriate magnification and tilt. The characteristic features of these mechanisms thus become part of this map, creating a record of the crack’s history. On this basis, areas of TG SCC were identified during the SEM study that led to Figure 54.46, as were those for other cracking mechanisms. It was apparent that as the SCC deepened it gave way to a blunt-ridge that had formed during a hydrotest. TG SCC resumed beyond that until rupture was triggered nearby. Inspection of Figure 54.46 indicates that the radial features evident within the TG SCC, which are evident above the blunt-ridge, show strong continuity across the ridge and beyond it. Continuity across this ridge of even the finer among these features indicates that the ductile stretch and void formation that formed the ridge sufficed to initiate cracking, which continued beyond the ridge and onto the crack plane that formed beyond the blunt. Such cues are characteristic of stable tearing as it occurs during hydrotesting,20 which in this case occurred during the hydrotest done 4 years prior. Their presence beyond the blunted crack tip determines that the compression and closure induced by the prior hydrotest were left in the wake of the continued cracking that then occurred beyond the blunt-ridge. On this basis, the previously active TG SCC could resume/reinitiate soon after the line was returned to service and thereafter could continue to grow. The features in Figure 54.46 indicate this TG growth continued until the rupture was triggered nearby, which exposed this fracture surface. Its depth at that time was bounded by dimple rupture that occurred as the axial split initiated nearby and ran axially causing rupture. This bound between the SCC and the dimples is highlighted in Figure 54.46 by the line that lies just below the SCC. Typical of Outcome III, the hydrotest done 4-years prior was ineffective regarding SCC in that the local compression and closure sought from that hydrotest were left in the wake of the stable tearing that initiated and grew during the test. Related detrimental growth likely also occurred for the deeper cracking. Such circumstances rationalize why other in-service ruptures have occurred prior to the next scheduled retest. Figure 54.47 uses the traits evident along a x section coupled with the O&M history and NLFM to infer the outcomes of this hydrotest scenario, much as was done regarding Figures 54.45 and 54.46. As for Figure 54.45, this figure images a through-wall section that for this example was cut local to the origin of a rupture, which terminated a retest that had been underway to manage TG SCC. As the extensive annotation in Figure 54.47 indicates, this image characterizes a more complex service—retest history as compared to that just discussed in Figure 54.46. While it is similar in some aspects to that case, as was noted earlier these failures were unrelated. As becomes evident, this scenario differs from the effects of the single hydrotest just considered in that it involves cracking that exposed near-critical SCC. Figure 54.47 illustrates a case where blunting and bifurcation occurred twice, which in both cases was induced by the pressure step during a high-pressure hydrotest. The first occurred in response to a hydrotest done prior to returning the line to service following a failure in this test section. The second occurred following in-service SCC growth, during a scheduled hydroretest. In this case, the increased pressure coupled with the deeper cracking sufficed to trigger bifurcation, with stable tearing then continuing through-wall along one of its branches, which went critical leading to axial rupture. (While hydrotest ruptures lead to axial splits a few yards [meters] in length, other compressible transported fluids could propagate the split many joints.) Figure 54.47 Illustrated outcomes of hydrotesting TG SCC, with bifurcations then rupture. A study of the fracture surfaces associated with Figure 54.47 indicated that both hydrotests were preceded by TG SCC. Examination of this section indicates that bifurcation occurred at the then current crack tips—and that both tests developed evidence of stable tearing during the hydrotest. Bifurcation during the first hydrotest resulted in short branches that grew slowly enough over a short distance, such that they remained stable until the test pressure dropped, and remained so as the line was repressurized in its return to service. This stable cracking following the initial bifurcation parallels the response just discussed in regard to Outcome III. By the end of the first hydrotest, the bifurcated branches were short and remained stable with minimal benefit to limit SCC because they were shallow. Accordingly, the SCC resumed in service, which this image indicates continued from the tip of the leftmost branch, as annotated in the image. By the time the next hydroretest was approaching the SCC had grown roughly halfway through-wall. As imaged in Figure 54.47, bifurcation occurred at that depth during the second hydrotest, and grew deep enough to trigger through-wall growth, which then became unstable axially, leading to rupture. Given the prior history for this line segment, it is very likely that cracking much like that shown was active elsewhere along this pipeline. The presence of such cracking, coupled with the rupture, is consistent with Outcome IV. While a detailed inspection of the image indicates that nearly symmetric bifurcation occurred, it was the leftmost branches that in both tests eventually became part of the rupture path. For this reason, only their stable counterparts are evident in the image growing into the right side of this through-wall cracking. Figures 54.45 through 54.47 illustrated aspects of cracking and failures due to SCC that document three of the four potential outcomes of hydrotesting. The fourth—the “beneficial” tests that comprise Outcome II—was absent because these outcomes do not get documented unless they are found fortuitously associated with nearby failures. Experience in regard to modeling this process (e.g., Refs. [12, 15, 45, 46]) indicates that there is a relatively narrow window of test pressure histories between “no effect” and “beneficial” that avoid detrimental outcomes. It follows that pressure testing to blunt the deepest in a population of cracks within a test section many miles long without adversely affecting stable tearing during the course of the pressure test will indeed pose a major challenge. This is practically evident in experience that has shown in-service failures occurring prior to their next scheduled retest—even when using rather short retest intervals. This subsection considers aspects of corrosion that often occur in association with SCC. For reasons that follow, the effects of corrosion can be beneficial or detrimental in applications where hydrotesting is used to control SCC. As becomes apparent, corrosion tends to occur selectively along the crack tip leading to localized blunting, which as becomes evident can delay the SCC and/or lead to dormancy. Conversely, corrosion along a crack tip that has already blunted due to hydrotesting can consume the stretch zone associated with the blunting process. In turn, this can reduce the magnitude of (1) the localized compression and (2) the related crack-tip closure, with the net effect of accelerating SCC. Dormancy is then considered in regard to these aspects as well as in reference to microstructural aspects. Figure 54.48 Corrosion localized along crack fronts, and the induced crack-tip blunting. (a) Progressive effects of cleaning; (b) SEM detail of the corrosion-induced blunting. Figure 54.48a illustrates a sequence of images that document the appearance of a SCC fracture surface over the course of a sequence of clean then document cycles, using the cleaning practice outlined earlier to remove the magnetite-siderite film and corrosion debris [37], and prepare the sample for SEM analysis of its fracture features. While sequenced cleaning can be instructive regarding the chronology of cracking, its purpose here is to illustrate that corrosion can be found resident along a crack tip, wherein the reaction products have locally resisted the intended effects of cleaning. Figure 54.48b is used in that context to illustrate the resulting blunting along crack tips, much like that occurring in response to a hydrotest, and to support the related discussion that follows thereafter. The images that comprise Figure 54.48a are numbered respectively from i to vi as they transitioned from as-received, then out of the ultrasonic bath, then through four cleaning cycles, the last of those shown being close to that suitable for SEM analysis for this example. The benchmark length shown in each image is 5 mm (~0.2 in). The crack segment illustrated was central within a longer crack, roughly three times the length of the segment shown. The OD surface is oriented up in this imaging—the area bounding the crack tip below showed dimple rupture. The crack surface as-received was covered by a dark almost black film that in places showed a red-brown tint akin to that of “rust.” As evident in this imaging, loose debris came free in the ultrasonic soak, which left an almost black film overlaid in many places by the red-brown tint. Cycles of cleaning progressively thinned the black film and removed much of that tint, which in the last of these images can be seen still resident along the crack front, and in a few other areas that were very resistant to the cleaning.21 Figure 54.48b shows details typical of the appearance local to a corrosion-induced blunted crack front: as this image indicates, it appears semicircular in profile. In this image, several pits are evident, whose depths are large in comparison to the scale of the blunted groove that lies along the crack front. As implied by this sequence of images, the debris that is still resident along most portions of the cracking shown in Figure 54.48a proved to be adherent and very resistant to cleaning. These traits imply that such reaction products could limit access to the cracking environment to the crack tip. As becomes evident shortly, blunting such as this can significantly reduce the speed of cracking, potentially leading to dormancy. While both local corrosion and pressure tests can cause crack-tip blunting, the resulting local stress fields differ significantly. As discussed in Figure 54.44, the incompatible stretch that develops across a crack tip due to the step increase in pressure during an optimal hydrotest leads to compression and crack-tip closure within the stretch zone around the crack tip. Rather than creating a potentially beneficial blunt along the crack front as just considered, corrosion local to a crack tip could consume the zone of incompatible stretch, which offsets the local compression and crack-tip closure, and so counteracts those beneficial effects. It follows that the presence of an aggressive down-crack potentially stagnant environment can counteract the potential benefits of a hydrotest done to help control SCC. The physical scale of the stretch zone relative to typical corrosion rates of unprotected buried steel coupons [49] indicates that the benefits of even the optimal hydrotest could be fully offset by local corrosion in less than 1 year. The effects of down-crack corrosion as just outlined—beneficial corrosion-induced blunting versus its detrimental consumption of the crack-tip stretch zone—develop along with the reaction products generated by that corrosion. As these reaction products occupy a greater volume than the steel they consume (e.g., Ref. [50]), their influence also should be considered. Oxide wedging at crack tips has been considered in regard to fatigue, in reference to the effects of submicron thickness oxide layers [51]. In spite of such thin layers, laboratory work involving shallow cracks indicated that the threshold for cracking was reduced. In turn, this led to order-of-magnitude increases in the average growth rate, whereas deeper cracks showed little effect. The large expansivity ratio of Fe3O4 suggests that a much thicker layer might be anticipated with SCC, which infers an even greater detrimental influence on the ACS for SCC. Unfortunately, little has been done to assess the effects of corrosion-induced wedging local to crack tips in tests directly relevant to external SCC on pipelines. Suffice it here to note that wedging increases the tensile stress across the crack tip. As such, wedging is anticipated to reduce the benefits of both the optimum hydrotest and corrosion-induced blunting, and increase the detrimental effects of corrosion within the stretch zone. Detrimental effects like these likely contribute to the cases where in-service SCC failures occurred prior to the next planned retest. If SCC was a continuous process, then according to the fundamental concepts invoked from physics and electrochemistry—for example, Faraday’s second law—failure would occur within months once the cracking environment formed on the pipe wall. As this is far from reality, either these concepts are irrelevant to SCC, and/or SCC is discontinuous, and/or SCC occurs across a range of rates. Sufficient laboratory work was done in the early years to demonstrate the relevance of the basic science (e.g., Refs. [3, 25]). It follows that the cracking must be discontinuous, and/or it occurs across a range of rates. As both scenarios are evident in laboratory experiments (e.g., Ref. [51]) it is reasonable to expect that the same would occur with field cracking. Scenarios where SCC was once active, but then was effectively stopped by decisions taken to decrease MOP and/or the discharge temperature, or to change the cyclic stress ratio, will respond to sequenced cleaning cycles, much like the traits evident in Figure 54.48a. Likewise, they could show corroded crack fronts like that evident in Figure 54.48b. Dormancy along corrosion-blunted crack fronts is likely, in that the physical expansion of the reaction products along the crack front could limit access to the cracking environment along the crack tip. Although porous, and on a dry surface can be flaky and friable, the expansivity ratio for compounds involving iron (III) oxides is large, and on fracture surfaces these compounds are neither flakey nor friable. Thus, local to a space-confined crack front a band of reaction products would be highly compressed, and so could constrain the flow of moisture through it. If and where this occurs the corrosion component of SCC would be absent, such that the SCC mechanism could go dormant, with its speed reduced to a practically negligible value. Because IG SCC grows by an active–passive mechanism [3, 25], maintaining a sharp crack tip is key to keeping the flanks of the crack passivated, such that the dissolution that advances the crack tip remains focused within the grain boundaries. Although for a different reason, the same can be said for TG SCC, as TG growth shows a strong dependence on stress, to the extent that in many ways it has been likened to corrosion fatigue (e.g., see Ref. [53]). Continued TG growth at a sharp crack tip is thus favored in comparison to reinitiating cracking following blunting, as the stress local to a corrosion-blunt would be much reduced for both IG and TG cracking. The significance of maintaining a sharp crack tip in contrast to a blunted tip can be determined by comparing empirical cracking speed data at sharp crack tips relative to that at blunted tips. While this comparison begs to be documented by discriminating laboratory testing, given the challenge posed by the scale over which the stress field of the blunt develops, it is not a surprise that such results have not yet been reported specific to SCC (to the author’s knowledge), whereas they have for fatigue. That said, the outcome of such experiments can be inferred through order-of-magnitude analysis, as follows. The cracking speed at a sharp crack tip can be quantified in reference to dissolution according to Faraday’s Second Law, leading to values of the ACS of about 10−6 mm/sec (or 1240 mils/year). If that sharp tip is not maintained, corrosion ensues thereby blunting the crack. Local dissolution in this context could be represented reasonably by data for general corrosion on the surfaces of soil-buried pipelines. Referenced to bare pipelines subject to CP, upper-bound speeds have been reported for general corrosion at about 12 mils/year across a broad range of pipelines [49]. By contrasting Faradaic rates to those for general corrosion it follows that growth at a blunted crack can be slowed significantly versus a sharp crack—by ~100-fold for this scenario. In this context, blunting has the potential to significantly slow cracking, or plausibly stop it. Dormancy and intermittent growth also can be affected by microstructural barriers whose scale is large relative to the grain size. Evidence of microstructural barriers affecting shallower cracks has been illustrated and discussed in Figures 54.28, 54.29, and 54.31. That imaging showed that cracking through-wall could be blocked by banding, and/or by large transverse ferrite grains. But as expected, as the scale of the crack became large relative to the grain size the effects of those barriers were diminished. For example, the image in Figure 54.28c indicated that deeper cracking could create a path through-wall by failing each band or a large blocking grain in its banded microstructure as they were encountered. While evident but not considered in regard to the effects of banding and larger grains, banded steels are prone to separate between the bands in areas where the crack-induced and other local forces lead to stresses directed through-thickness (by local tension) or in the plane of the separation (by local shear). As the discontinuity caused by separation is oriented perpendicular to the paths of through-wall cracking, larger separations are obstacles to continued growth. As evident in the images shown in Figure 54.49, some separations can be very large compared to the scale of the microstructure. Moreover, their associated planes of through-thickness weakness can develop at a scale comparable to that of deeper cracking. Figure 54.49a shows an image wherein SCC originating below the image has grown just into its field of view, which given the scale noted has prompted separations to form and open up to lengths in the order of one-tenth inch (2.5 mm). Inspection of this image indicates that these separations open in the interface between the bands, which comprise alternating layers of different microstructures that for this steel were ferritic versus pearlitic. Banding is reportedly due to micro-segregation during solidification that in turn traces to fluctuations in the concentrations of alloying elements, primarily manganese (e.g., see Ref. [22]). Hot rolling thereafter pancakes the grains, which elongates the resulting microstructure, the interfaces between which are directionally weak perpendicular to (tension) and within (shear) the rolling plane. Figure 54.49 Separations typical of banded steels produced in the 1970s. (a) Typical banding and associated separations; (b) perspective view at higher magnification. Figure 54.49b is a perspective view within the box inset in part (a). As evident therein, this separation formed and opened within the remnant wall that failed as the rupture path grew through this area. This open separation has been reoriented to show the interface between the bands, as well as the nature of the cracking that has bypassed it, which includes IG patches typical of the SCC that was evident on the fracture surface just below this image. Little ductility is evident on the wall of the separation, although the process appears somewhat ductile where the just separating interface intersected the fracture surface. Consistent with its location and the ductile nature of the fracture in this vicinity, the fracture surface around the separation shows dimples and small patches of IG features. Note in this higher magnification view that many much smaller separations are evident, as are elongated features that appear to act as seeds for potential separations. Observe as well that the plane of the rupture path was altered as the fracture grew, and that the cracking filled-in beyond the discontinuity as it grew past it. Figure 54.49 contrasted the features evident when ductile fractures containing small patches of SCC encountered a separation. Figure 54.50 is similar, except that it images cases where deeper SCC has encountered a blocking separation. Figure 54.50a is an overview that provides perspective for the details shown in Figure 54.50b, which illustrates that the growth of deep SCC can be blocked effectively by larger separations. Figure 54.51, which follows shortly, is similar except that the imaging there indicates that after some delay deeper SCC cracks can grow beyond large separations. As becomes evident, separations could delay cracking but also could cause dormancy. Figure 54.50 Views of a large separation that has blocked the advance of SCC. (a) Overview of a separation that blocks growth; (b) crack and vertical steps along the separations. Figure 54.51 Low magnification imaging of the interaction of SCC with separations. (a) Overview of separations that block growth; (b) crack and vertical steps along the separations. Figure 54.50a shows an overview in which the depth of field permitted by SEM has captured SCC growing on adjacent planes that were vertically mismatched by ~0.06 in. (1.5 mm). This image was captured adjacent to cracking that contributed to the critical length leading to this rupture. The pipe’s ID surface lies along the rear of this image; the OD surface and the SCC origins lie toward its front face. A dashed line has been inset into this image to highlight the location of a large band that had separated, with interfaces intermittently evident along the fracture surface during SEM imaging over a distance of more than 1 in. (25 mm). This banding was opened (separated) over its length where the progression of a deep intersecting crack had been blocked. Prior to being stopped that SCC had grown from the OD surface with a thumbnail-like shape to a length approaching ½ in. (~12 mm). This same separation also had opened slightly elsewhere along this fracture surface, hints of which can be seen continuing toward the right margin of this figure. Figure 54.50b enlarges the area containing the thumbnail-like crack. Inspection of this image indicates that its thumbnail-like shape is interrupted at about mid-wall—where the crack tip runs parallel to the pipe surface over a distance of ~0.25 in. (6.35 mm)—which is roughly ½ its length. Over that distance, the rear edge of the crack is bounded by the discontinuity created by the opened separation. A vertical transition is evident along that boundary, which formed as the axial path of the rupture intersected this crack, whose matching crack face remained on the opposing fracture surface. It follows that what began as an actively growing SCC that over much of its length had reached roughly mid-wall, had since become dormant until rupture ensued nearby. Consistent with its arrest and dormancy the corroded surface of this crack was resistant to cleaning. Remnant reaction products remain evident as the lighter highlights that lie just above the notation “SCC” in this image. These areas show anomalous contrast because this nonconductive remnant is “charging.” Given that the area containing this remnant had survived 14 cleaning cycles, the underlying cracking apparently lay dormant for some time. As for the prior example, Figure 54.51a presents a view of cracking wherein the transition from the SCC to the crack path associated with rupture is vertically mismatched at several locations, for which the largest was close to the mismatch of the prior figure. This mismatch is most evident in this image in the vicinity of the open separations, where it is highlighted by a dotted line laid on the plane of the SCC, and a dashed line laid on the plane of the rupture. As for the prior example, this cracking lies adjacent to the origin that triggered this rupture. The pipe’s ID surface lies along the top of the image; the OD surface and the origins of these cracks lie along the bottom of the image. As for the prior figure, there are areas of anomalous contrast associated with remnant reaction products. The arrows highlight tight separations some of which are quite long and aligned with others along the same banding interface. Somewhat opened separations are clearly evident and so have not been highlighted. Figure 54.51b shows the cracking that continued beyond the right end of part (a). It is shown at the same scale and orientation and makes use of the same notation to locate the larger vertical steps from the plane of the SCC up to the rupture. Banding is clearly evident within the rupture path, even at this limited magnification. Separations are highlighted as in part (a), with the tighter ones being highlighted by arrows. Several long rather tight separations are evident within the arc that bounds the large thumbnail-shaped crack. Separations are also evident further toward either end of this thumbnail, along the transitions between the plane of the SCC and that of the failure path that grew beyond the SCC by dimple rupture as the pipe failed. At higher magnification, dimples indicative of ductile failure are evident throughout the rupture path—except within the banding interfaces. (The small-font notations barely readable in this image document the depths of features measured in microns (μm) from the OD surface, which are ignored as they are secondary to its present purpose.) Inspection of this image indicates that a portion of the SCC that ran the width of the image tracks a thumbnail-shaped crack front, whose smooth curvature indicates that it grew into the pipe wall unrestrained by microstructural factors. In contrast, within the dotted box inset to the right margin of this figure, this curved crack front deviates sharply, transitioning to straight, whereafter it grew parallel to the pipe wall. Related imaging indicates that this straight front continued beyond the dotted box to the right, to a length of the order of ¼ in. (~6 mm). Inspection also reveals a slightly open separation over this length. As for the prior figure, vertical steps exist between the plane of the SCC and that of the rupture along opened separations. Key for present purposes is the observation that compared to Figure 54.50b, which showed that a separation had effectively blocked SCC growth through-wall, the SCC within the thumbnail feature shown in Figure 54.51 had continued to grow around and beyond the separations. It appears in this context that the scale of the banding and whether it was tight or opened affect its role in blocking slow-growing cracks as occurs for SCC. Finally, note that high-resolution SEM imaging revealed a band of corrosive attack that ran along the curved portion of this deeper cracking, and continued axially along the larger separations that blocked the adjacent SCC. This band of corrosive attack is evident in Figure 54.51b as a marginally darker narrow band that tracks the just-noted path. Such attack along crack fronts is indicative of SCC that had slowed or become dormant, as outlined in regard to Figure 54.48. In summary, the cracking shown in Figures 54.50 and 54.51 indicates that larger separations with a weak interface that had opened can arrest deep SCC and affect dormancy, whereas at interfaces whose strength resists opening the SCC was slowed somewhat, as it had to grow around the barrier and filled-in in its wake. It follows that larger microstructural barriers formed due to banding that separates in service can affect dormancy, while those that remain tight slow the SCC. Where SCC had blunted due to corrosion along its crack fronts its growth would slow due to that blunting, which could lead to its arrest and dormancy. Reflecting on the results gathered from several years of laboratory experiments concerning external SCC on pipelines, Parkins [52] in early 1990 stated: the great majority of stress corrosion cracks initiated in pipeline steel subjected to realistic stressing conditions become dormant after growing for only a relatively short time or distance. His statement reflects the outcomes of a series of discriminating experiments that he had directed at understanding dormancy and the circumstances that reinitiated SCC. Given that dormancy occurred where one of the three concurrent requirements for SCC was no longer satisfied, he developed a test matrix whose outcomes sought to quantify the conditions that caused dormancy versus those that reinitiated it. He used constant-extension-rate tests and tests involving cyclically loaded precracked specimens subject to the usual test-control parameters; namely stress, temperature, potential, and cracking environment. His precracked testing considered specimens one of which had a single fatigue precracked defect, while the other specimens contained arrays of naturally nucleated SCC. His results, the above statement, and other conclusions were detailed in his 1989 annual report for the AGA’s Project NG-18, which then was underway at Battelle [52]. His key observations and conclusions concerning the tests of single-crack specimens included (paraphrased in places): His key observations and conclusions concerning testing of arrays of SCC included (also paraphrased in places): In addition to the above-noted outcomes, Parkins reported observations and conclusions specific to the effects of service-like cycling where the potential was cycled in and out of the range considered optimal for cracking. Such tests led to the observation that prolonged cycling out of the optimal range diminished the initiation of cracking when those optimal conditions were reinstated. For other circumstances, he observed the opposite effect. Aspects of this behavior Parkins surmised were due to surface-related effects such as pitting. Parkins’ work led to some key observations based on laboratory data, as follows: In addition to the Parkins’ laboratory-based results, causes of dormancy for field cracking were illustrated and discussed in terms of crack-tip blunting due to selective corrosive attack along a crack front, and due to hydrotests designed to affect blunting that also succeeded in limiting initiation and growth thereafter during the hydrotest. Causes of dormancy for field cracking also were illustrated regarding the microstructural factors. Banding was shown to temporarily block growth, thereby reducing the ACS due to intermittent cracking. It also altered the cracking direction—which leads to the same outcome. Large separations were illustrated as barriers whose presence blocked the growth of deeper cracking. One key takeaway in this context is that variable amplitude cycling can promote reinitiation, such that pipelines would be best operated with minimal cycling that affects an increase in the peak pressure. This chapter was developed with a focus on field cracking to complement the prior chapter whose content had focused on laboratory data, which was presented to (1) quantify the kinetics of SCC as the basis to (2) develop and calibrate a model of a pipeline’s SCC response to environments that would be experienced under typical field conditions. As that chapter considered field cracking only in regard to validating the model, this chapter has focused on the field appearance of SCC, to acquaint readers with what they might find in the field if their systems are prone to SCC. It also has focused on the interplay between mechanics, as it affects the stress component of SCC, and physics and electrochemistry as they affect the environmental component of SCC. The coupled role played by stress and mechanics and the environment has been evaluated relative to the microstructural backdrop that the IG and TG SCC develop on. Because this chapter has considered field cracking in complement to the prior chapter’s focus on laboratory results, and because many observations, conclusions, and takeaways have been presented in this and the prior chapter within the subsections they reflect, the key conclusions that follow consider the interplay between these sequential chapters. In that context, the key conclusions include A work covering the present scope and history reflects the contributions of many over the 70 plus years that SCC has continued to be a challenge to manage. Its content derives from a comprehensive review and analysis of SCC imaging gathered since the early years through more recent work that has benefited extensively from quality metallography, and SEM imaging, which was unavailable in the early years. The contributions and insight derived from decades-long relationships with the late Drs. Fessler and Parkins (the latter during his Summer Sabbaticals), and with Drs. Jeffery Colwell and John Beavers, and Mr. Robert Eiber during our years at Battelle are gratefully acknowledged. This work also benefited over the years from productive discussions and field imaging, which have developed in association with Mr. Jim Marr and in years past with the late Mr. John Mackenzie. Finally, the author acknowledges the efforts of Dr. Winston Revie in organizing this second edition of Oil and Gas Pipelines: Integrity, Safety, and Security Handbook.
54
Physical Traits and Growth Processes for High-pH and Near-Neutral-pH Stress-Corrosion Cracking
54.1 Introduction
54.2 Imaging SCC and Related Observations
54.2.1 SCC Imaged Along Fracture Surfaces
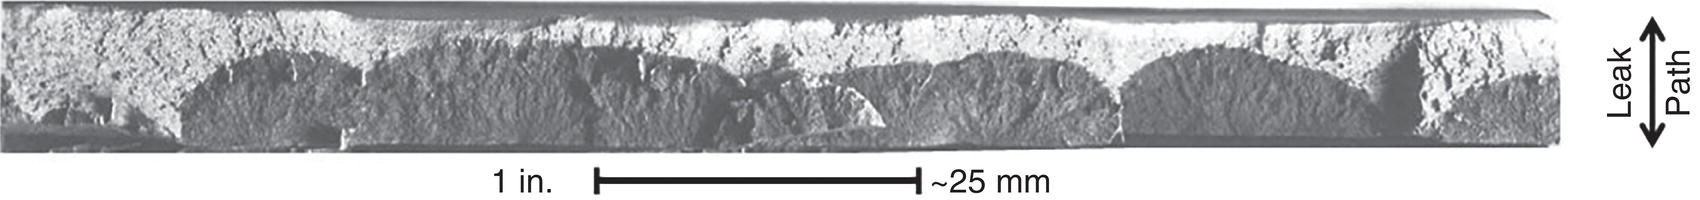
54.2.2 SCC Imaged on Cross Sections
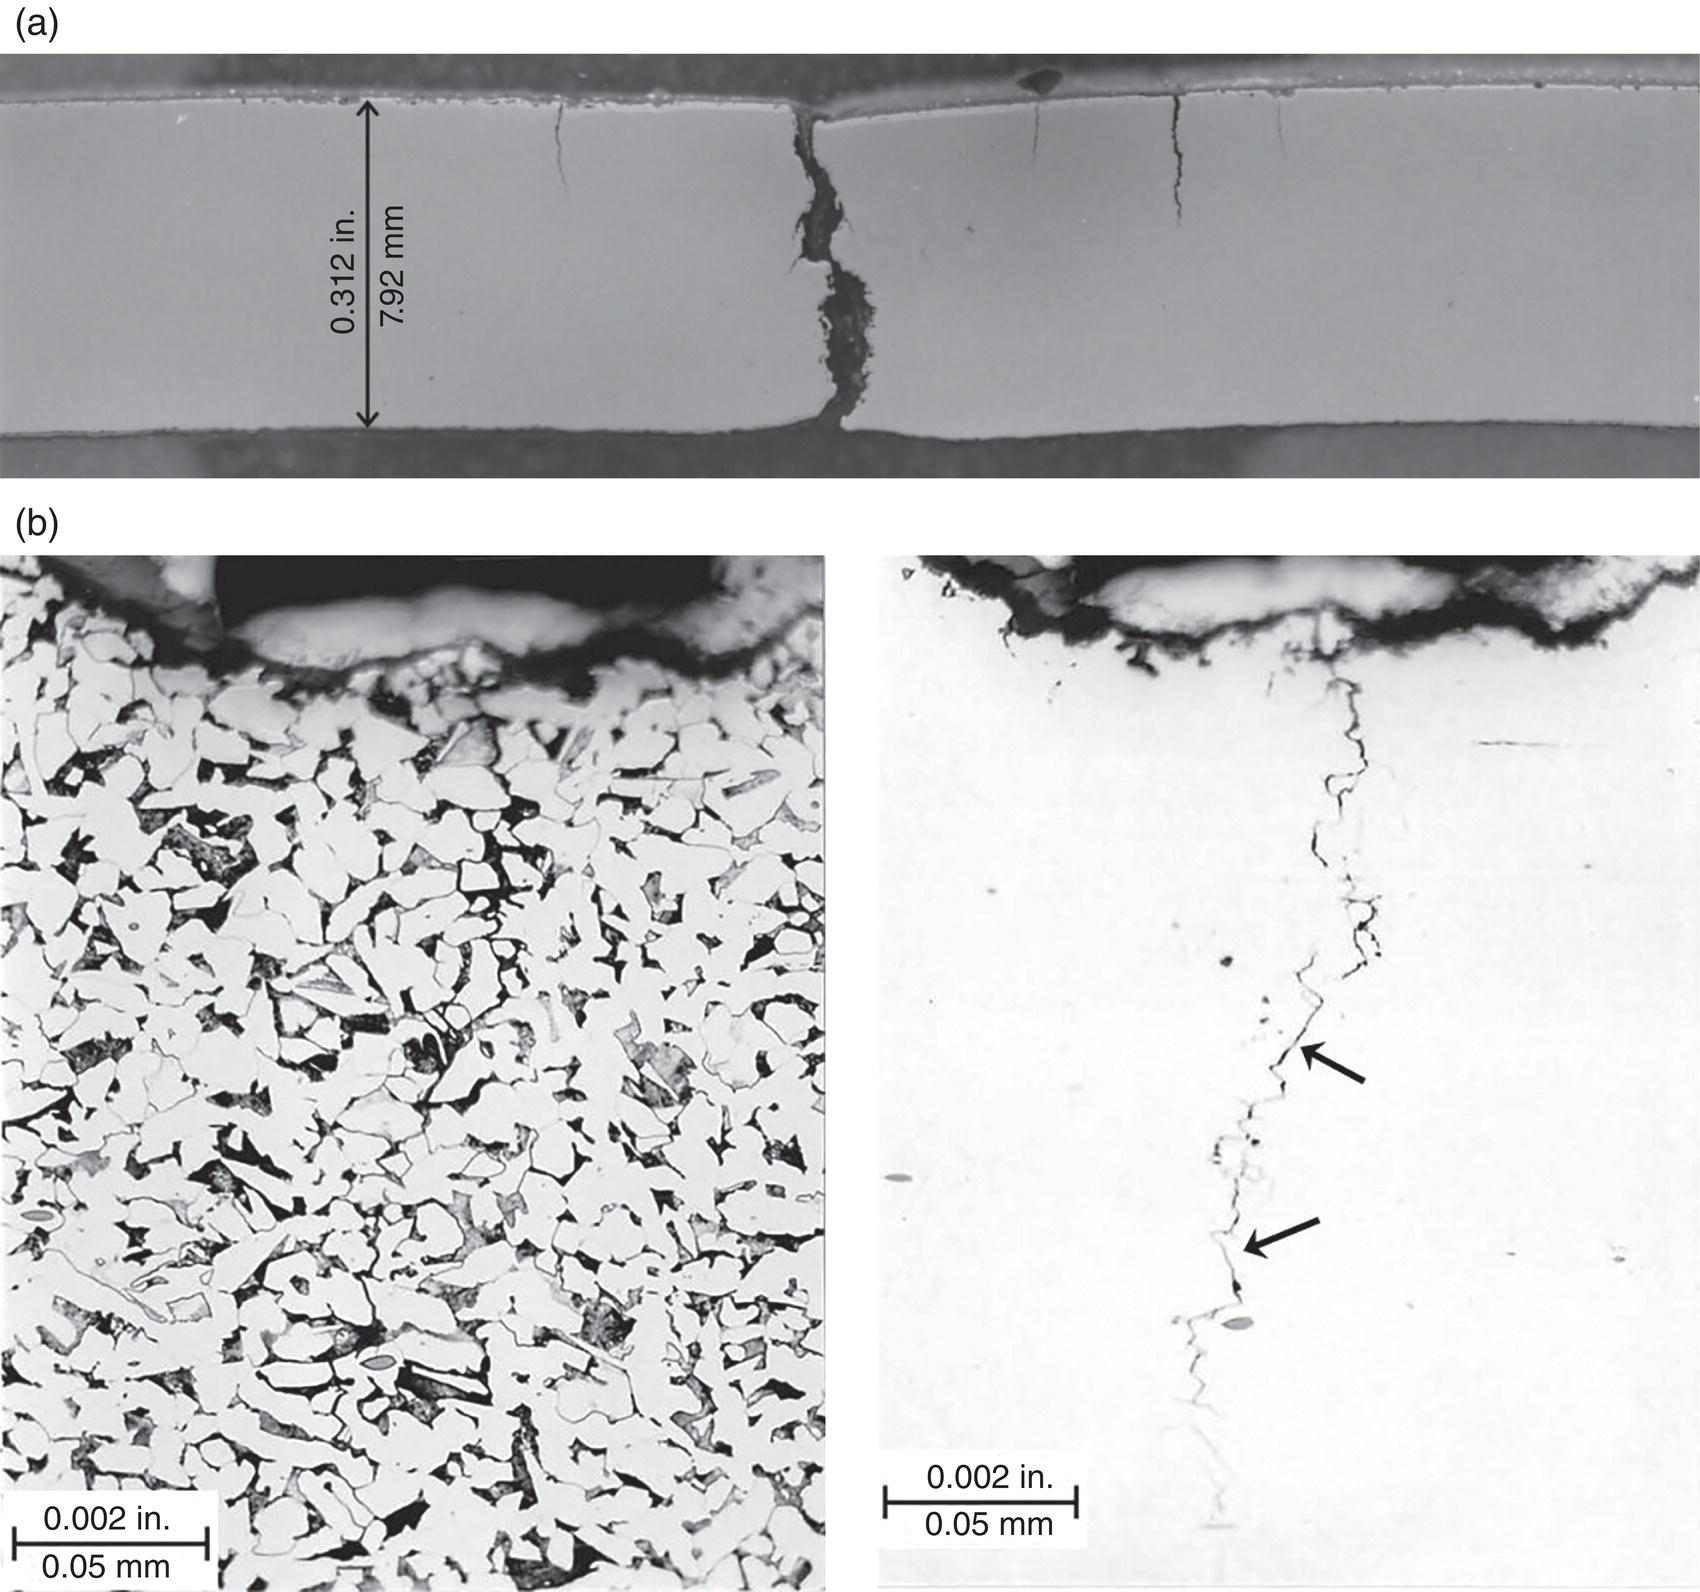
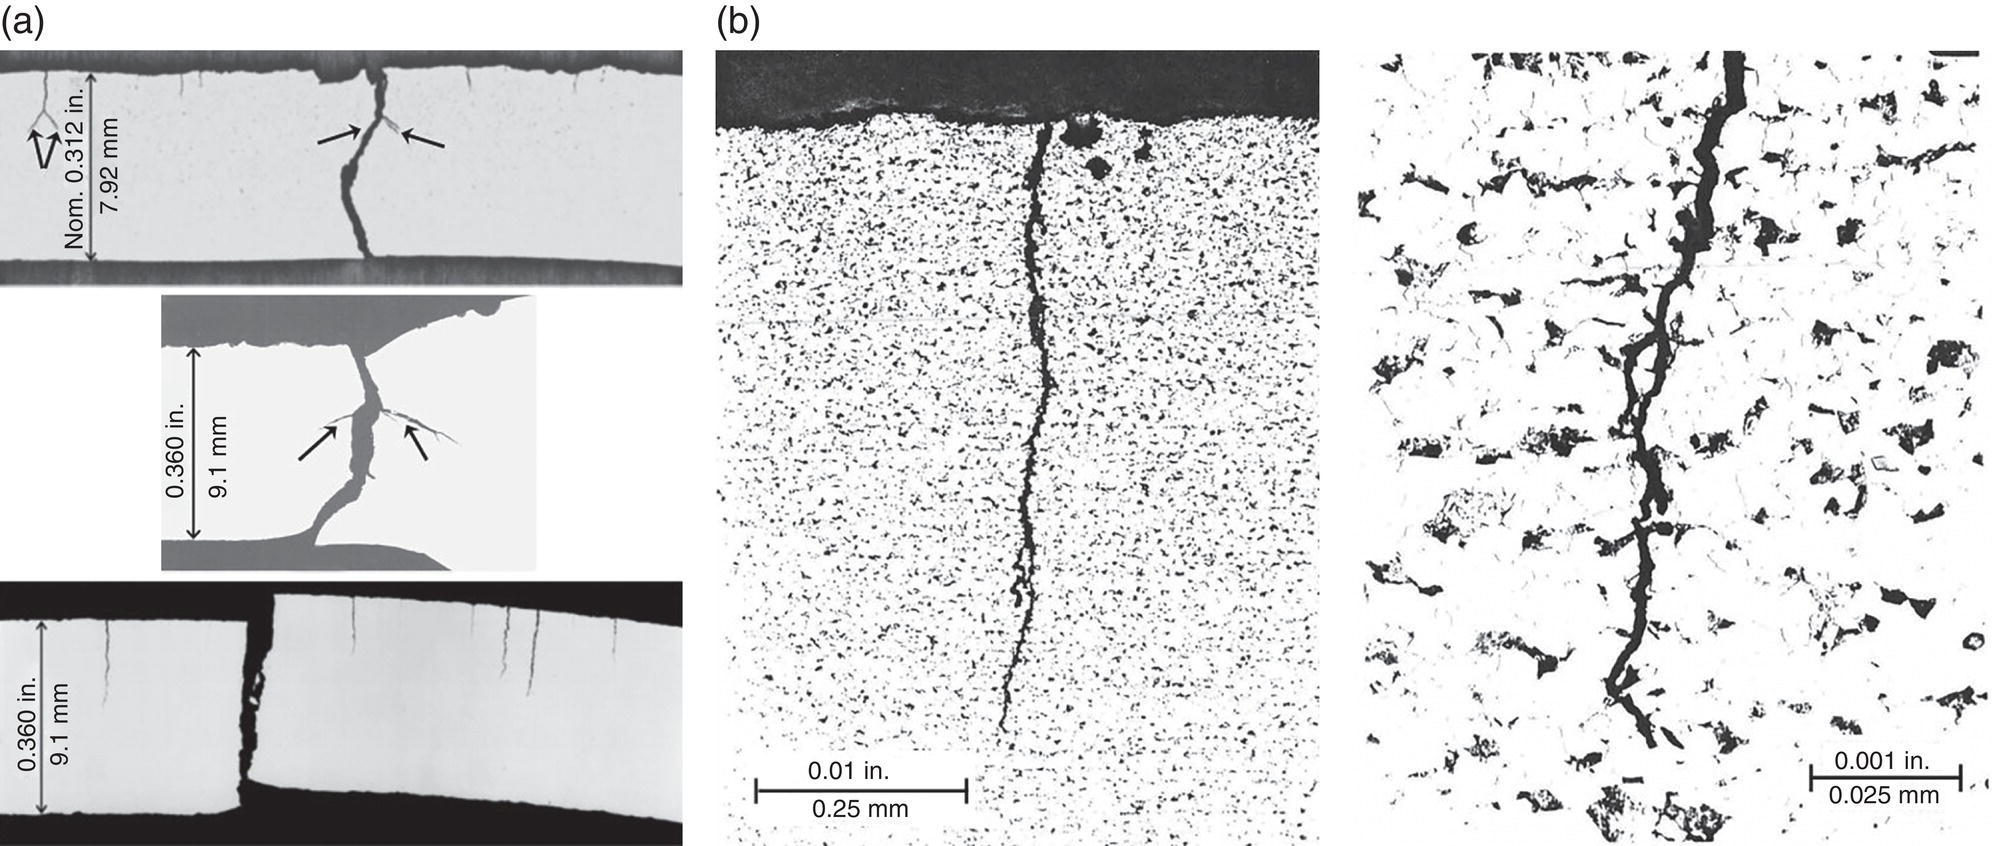
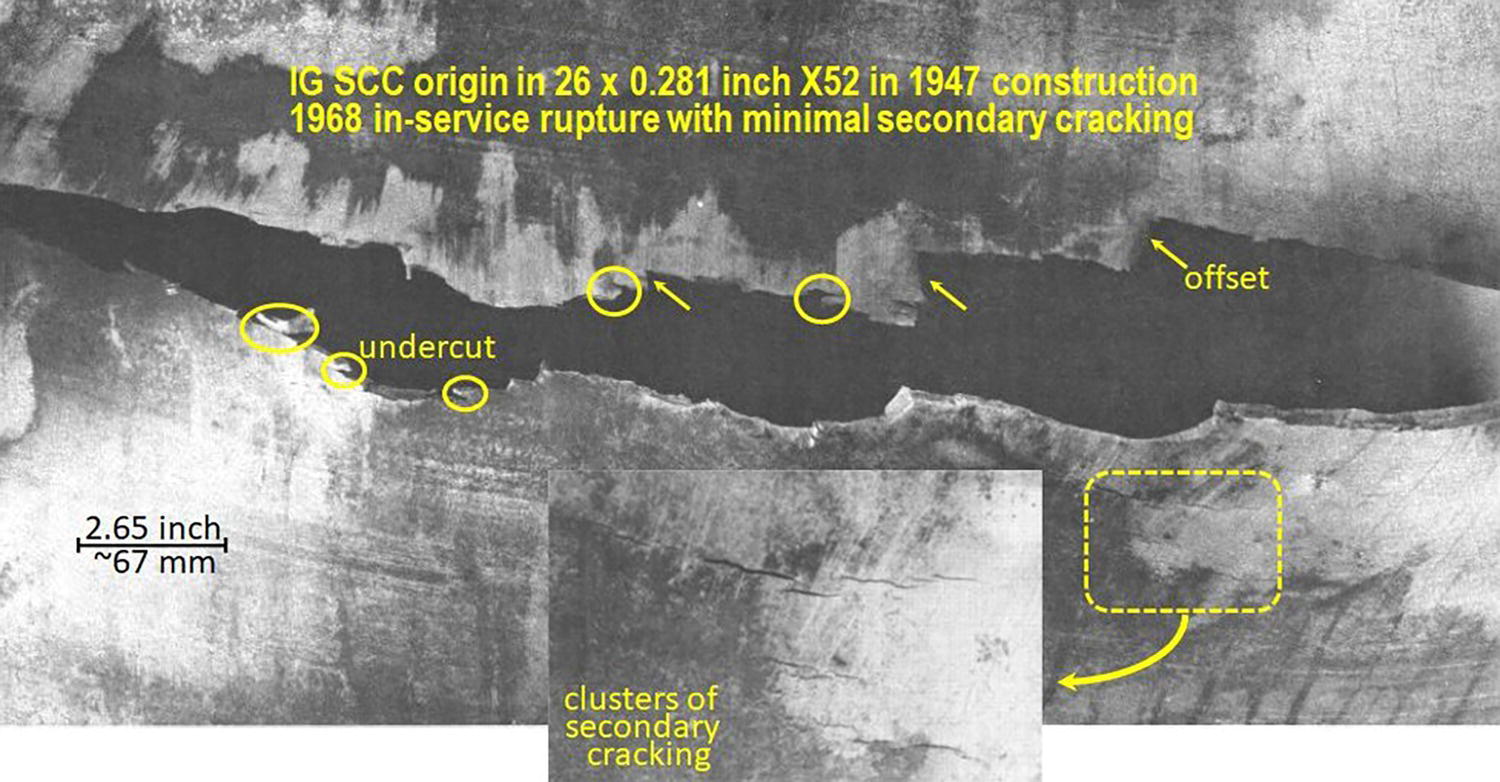
54.2.3 SCC Imaged on the OD Surface
54.2.4 Perspective Imaging
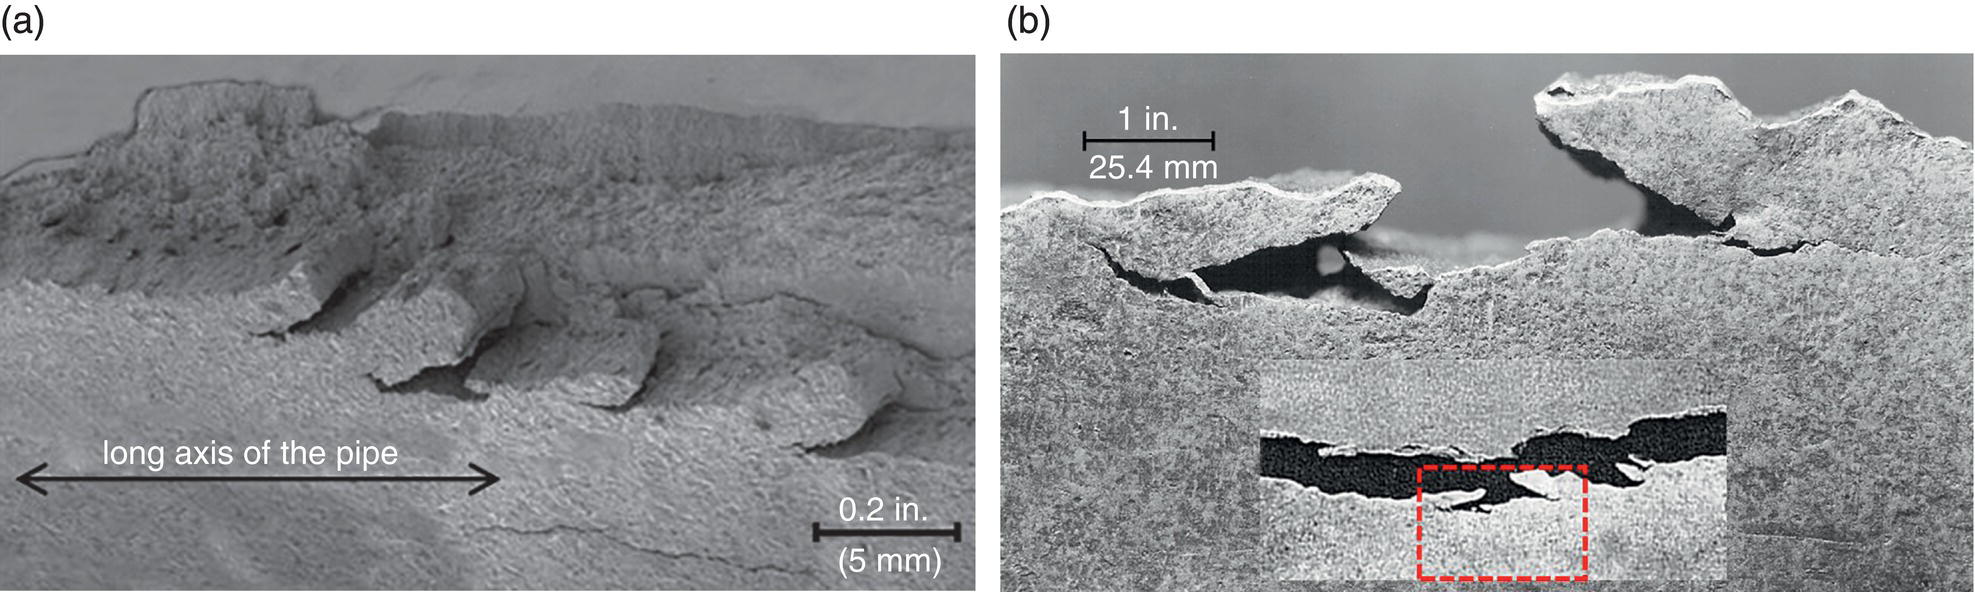
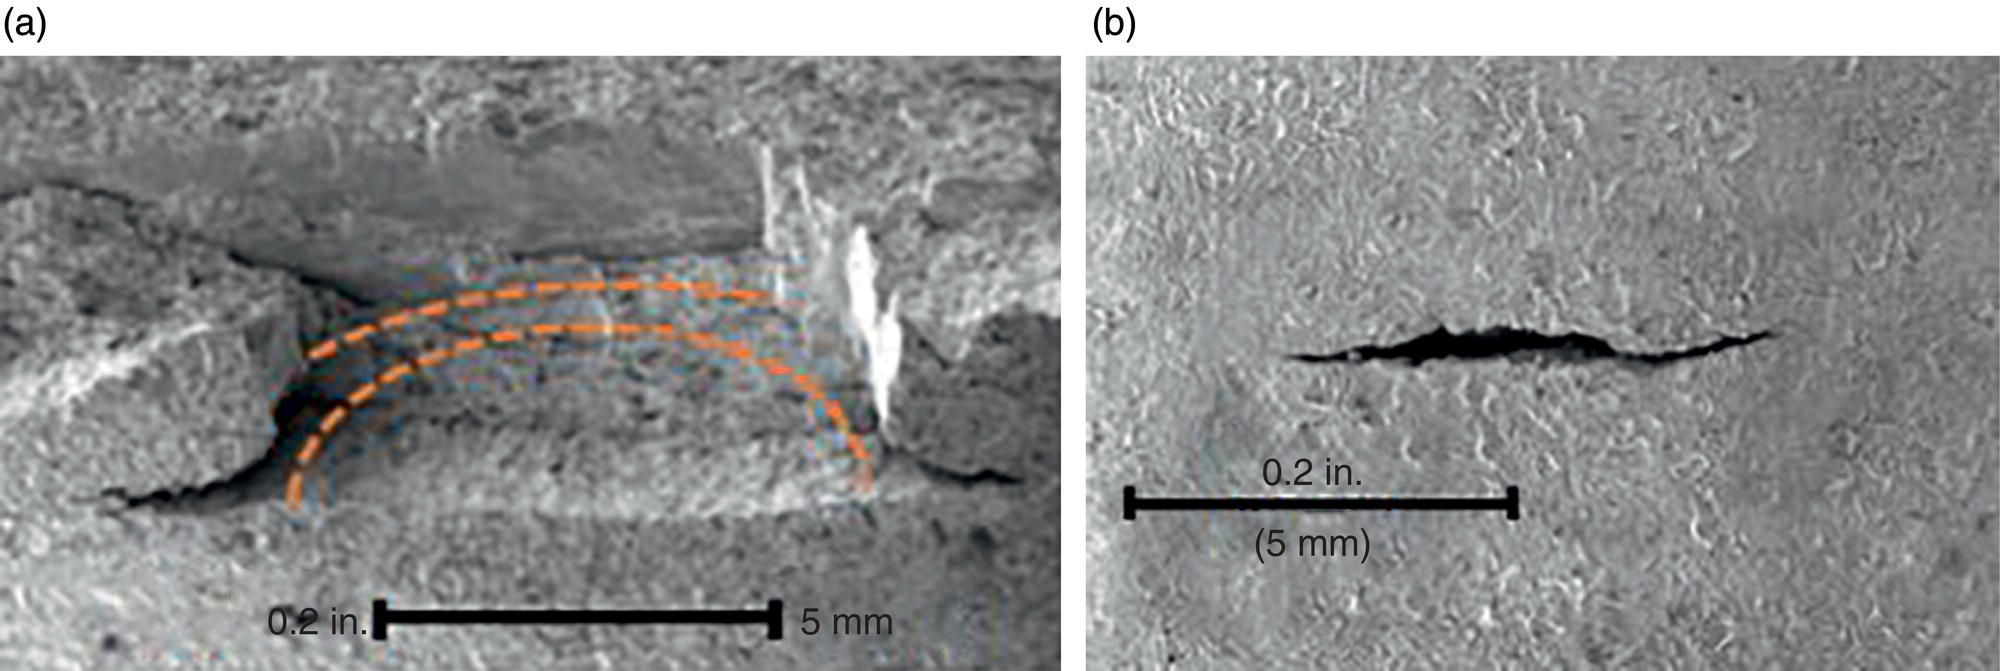
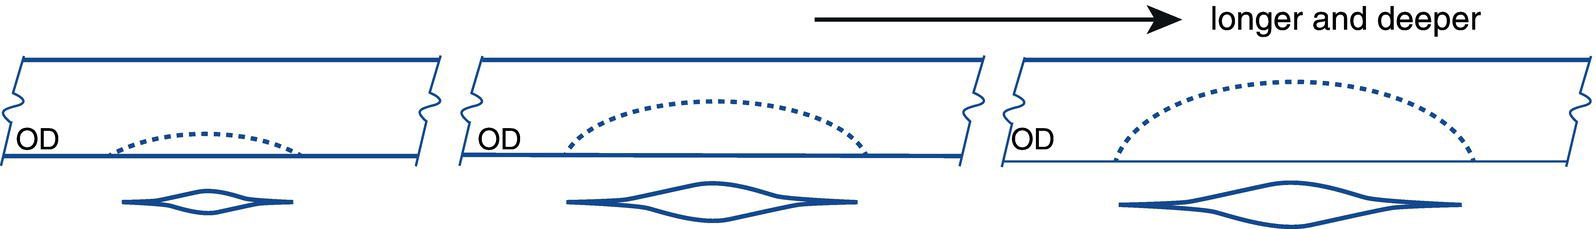
54.2.5 Summary
54.3 Compendium of SCC Images: Observations and Discussion
54.3.1 Cracking Imaged on the Pipe OD Surface
54.3.1.1 Circumferential Crack Spacing Under a Common Disbond
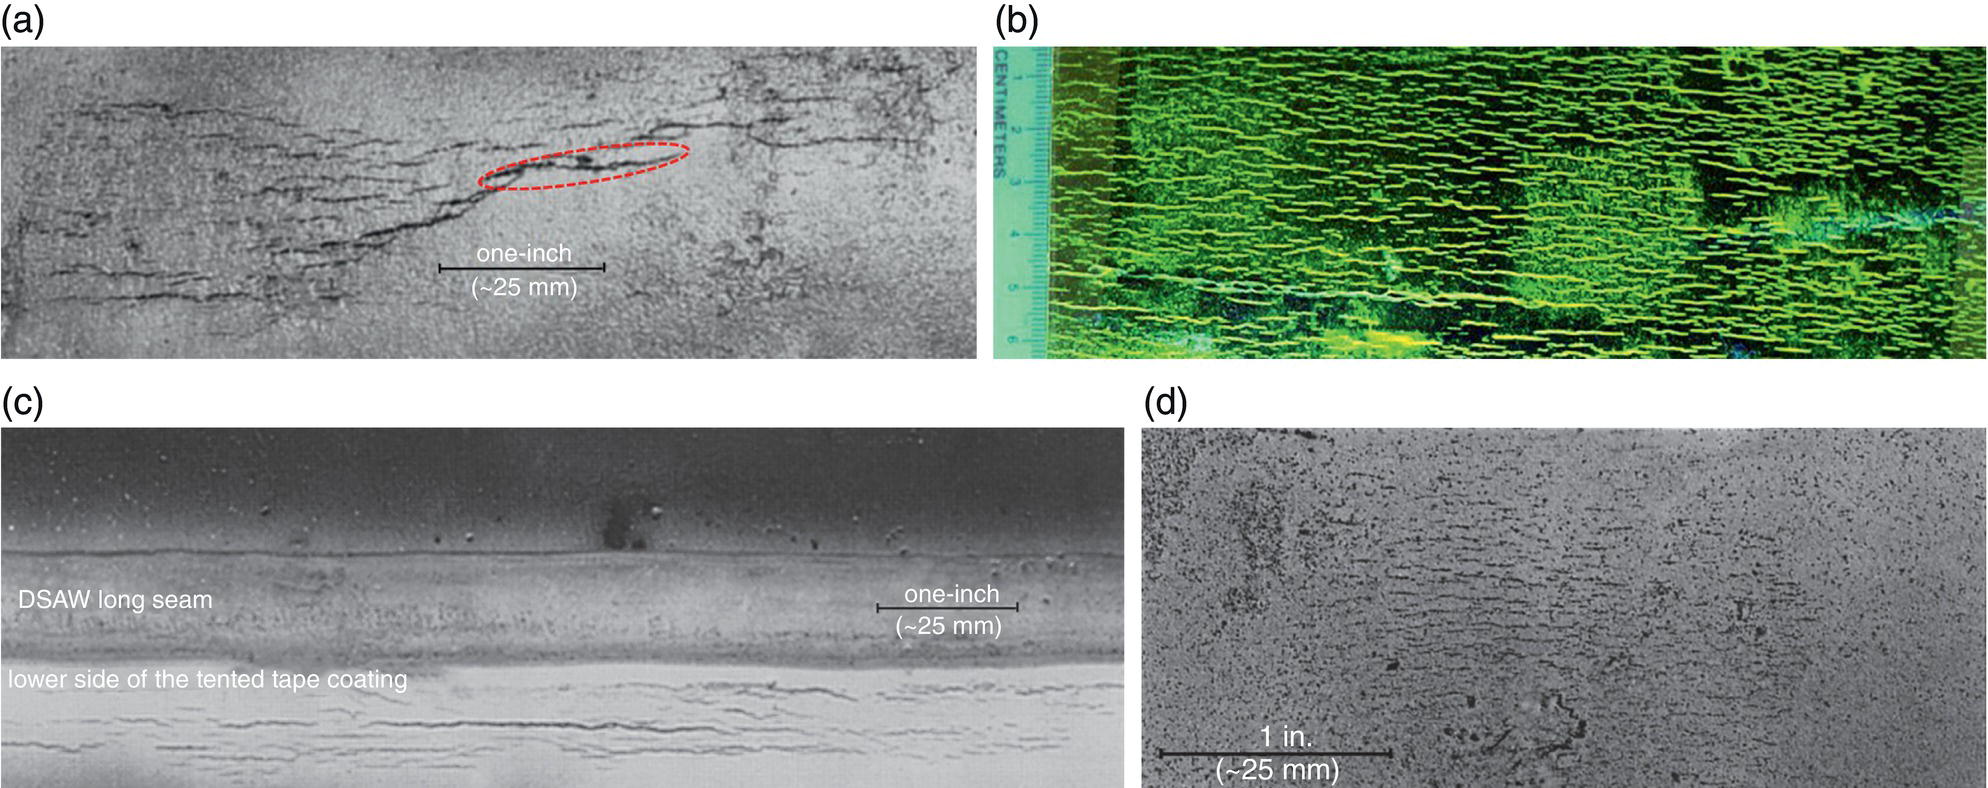
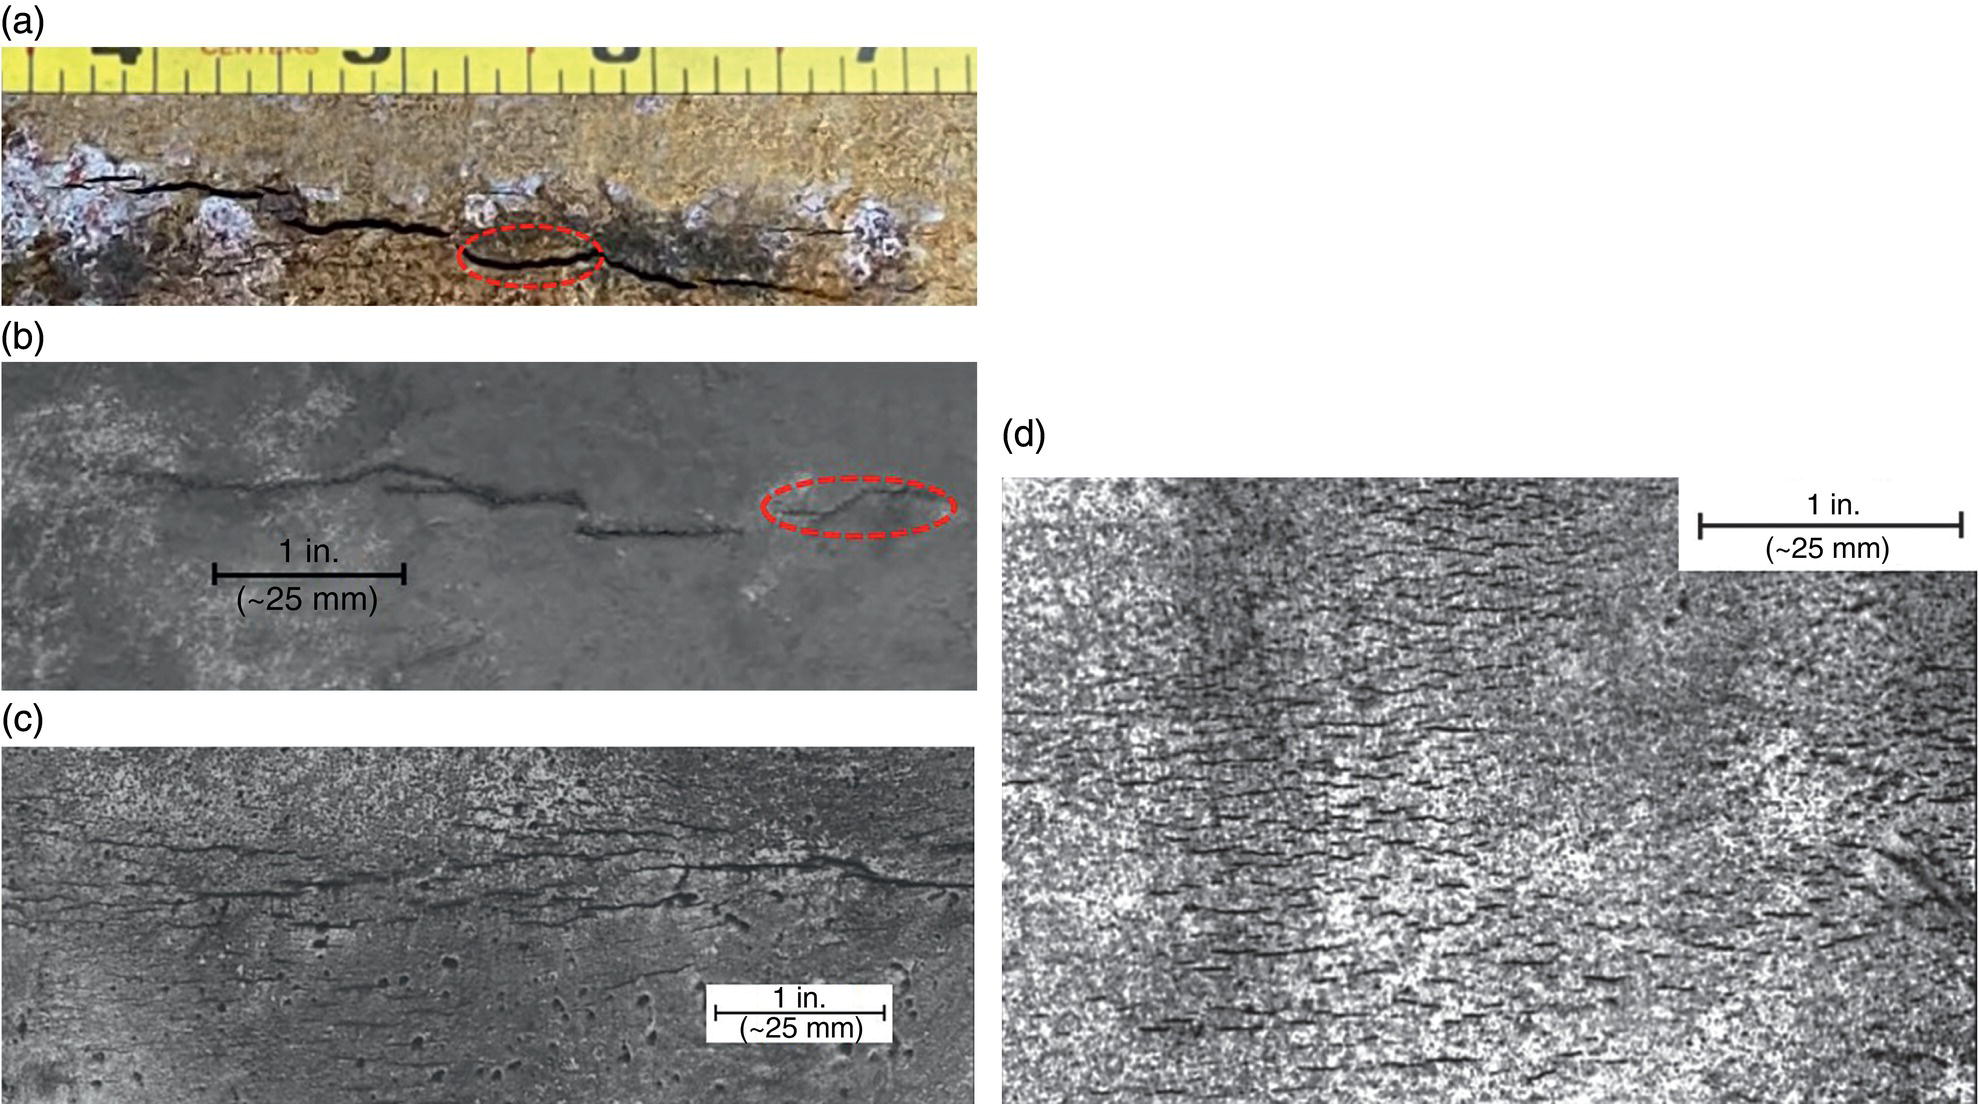
54.3.1.2 Trends in Crack Shapes and Sizes in Dense Versus Sparse Clusters
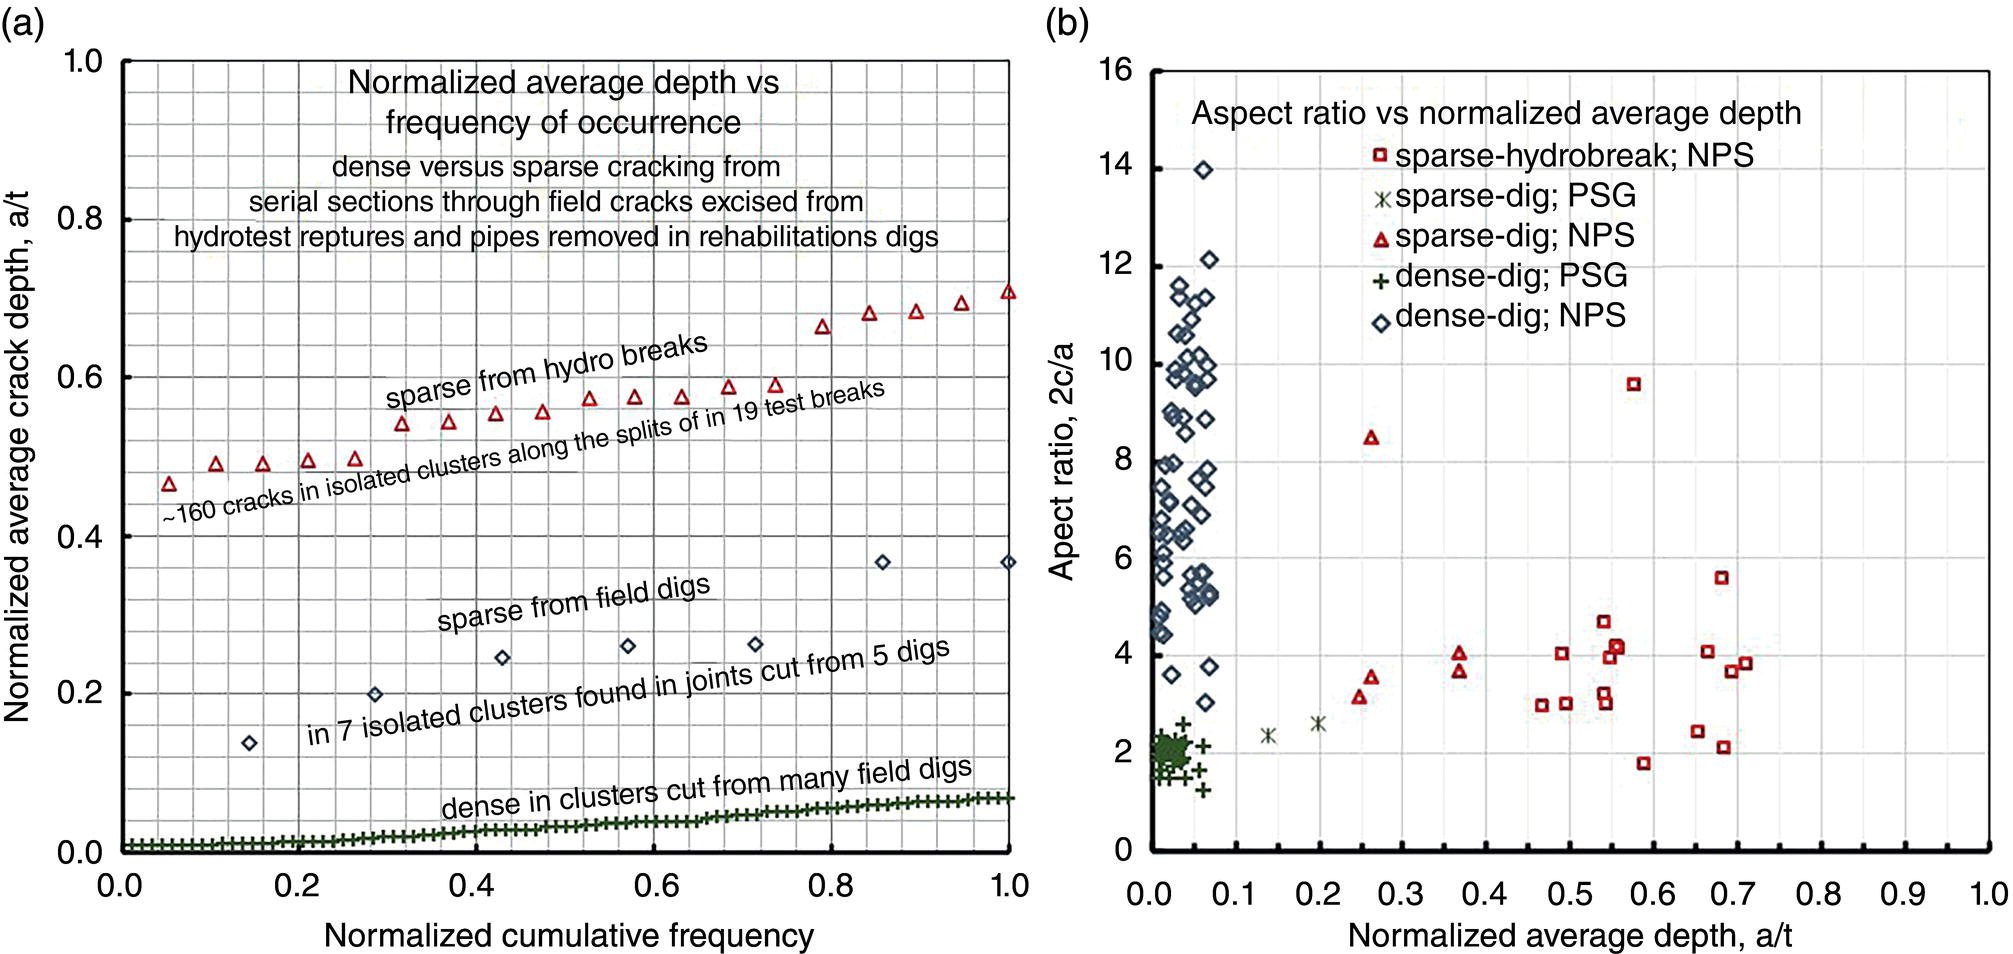
54.3.1.3 Trending the ACS in Dense Versus Sparse Clusters
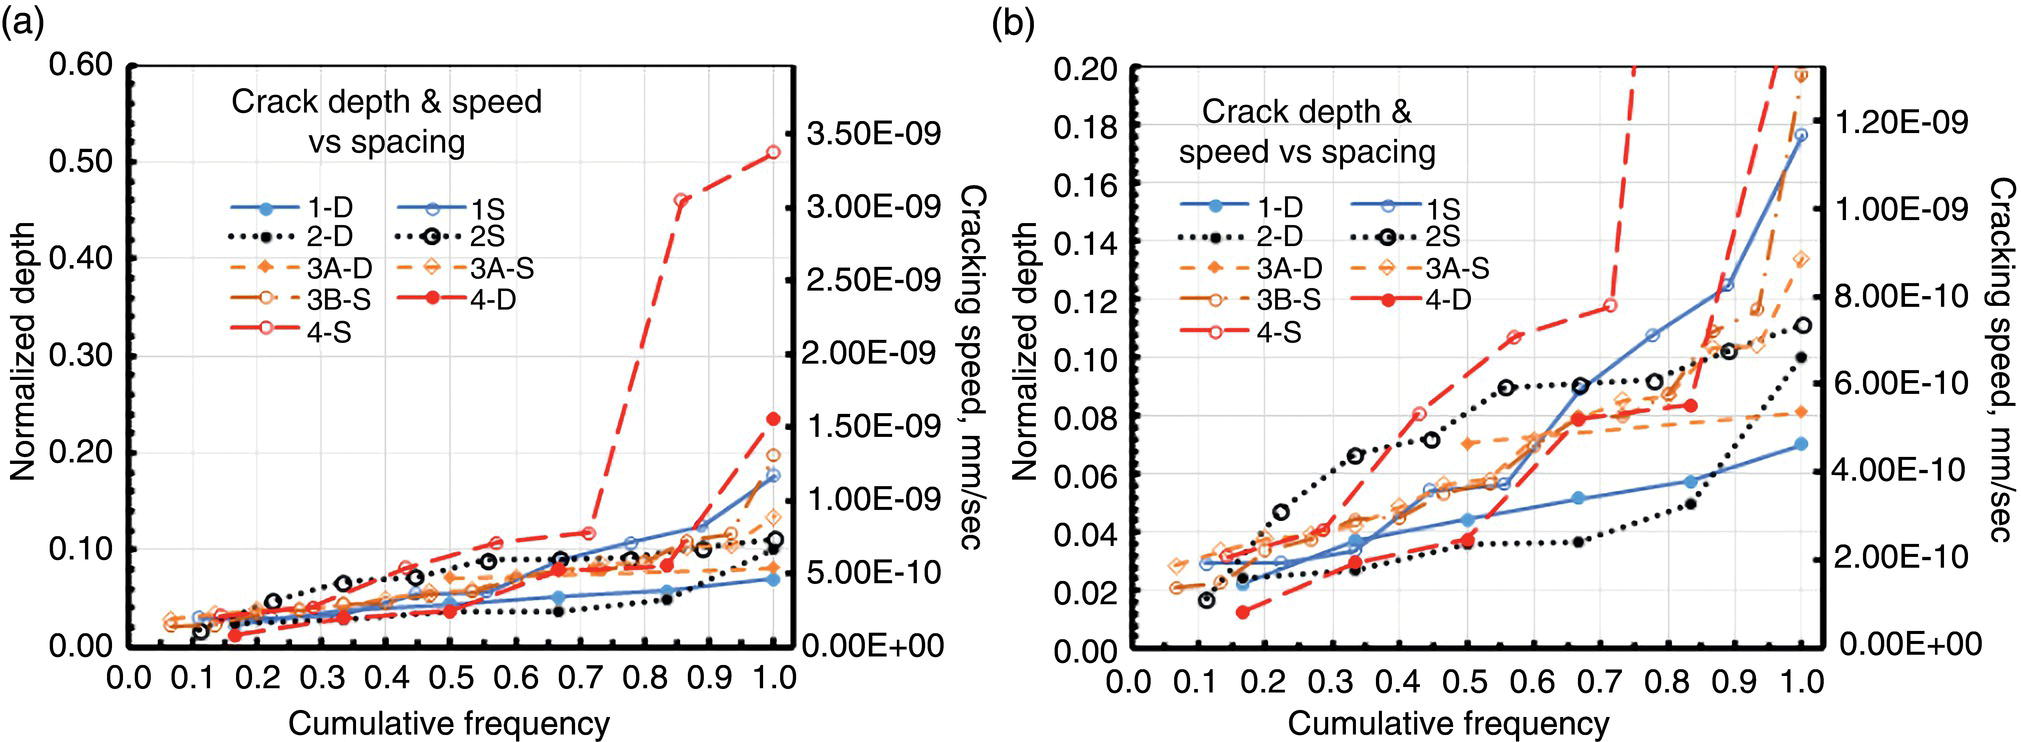
54.3.1.4 Observations and Takeaways
54.3.1.5 Additional Imaging Typical of Cracking on the Pipe OD Surface
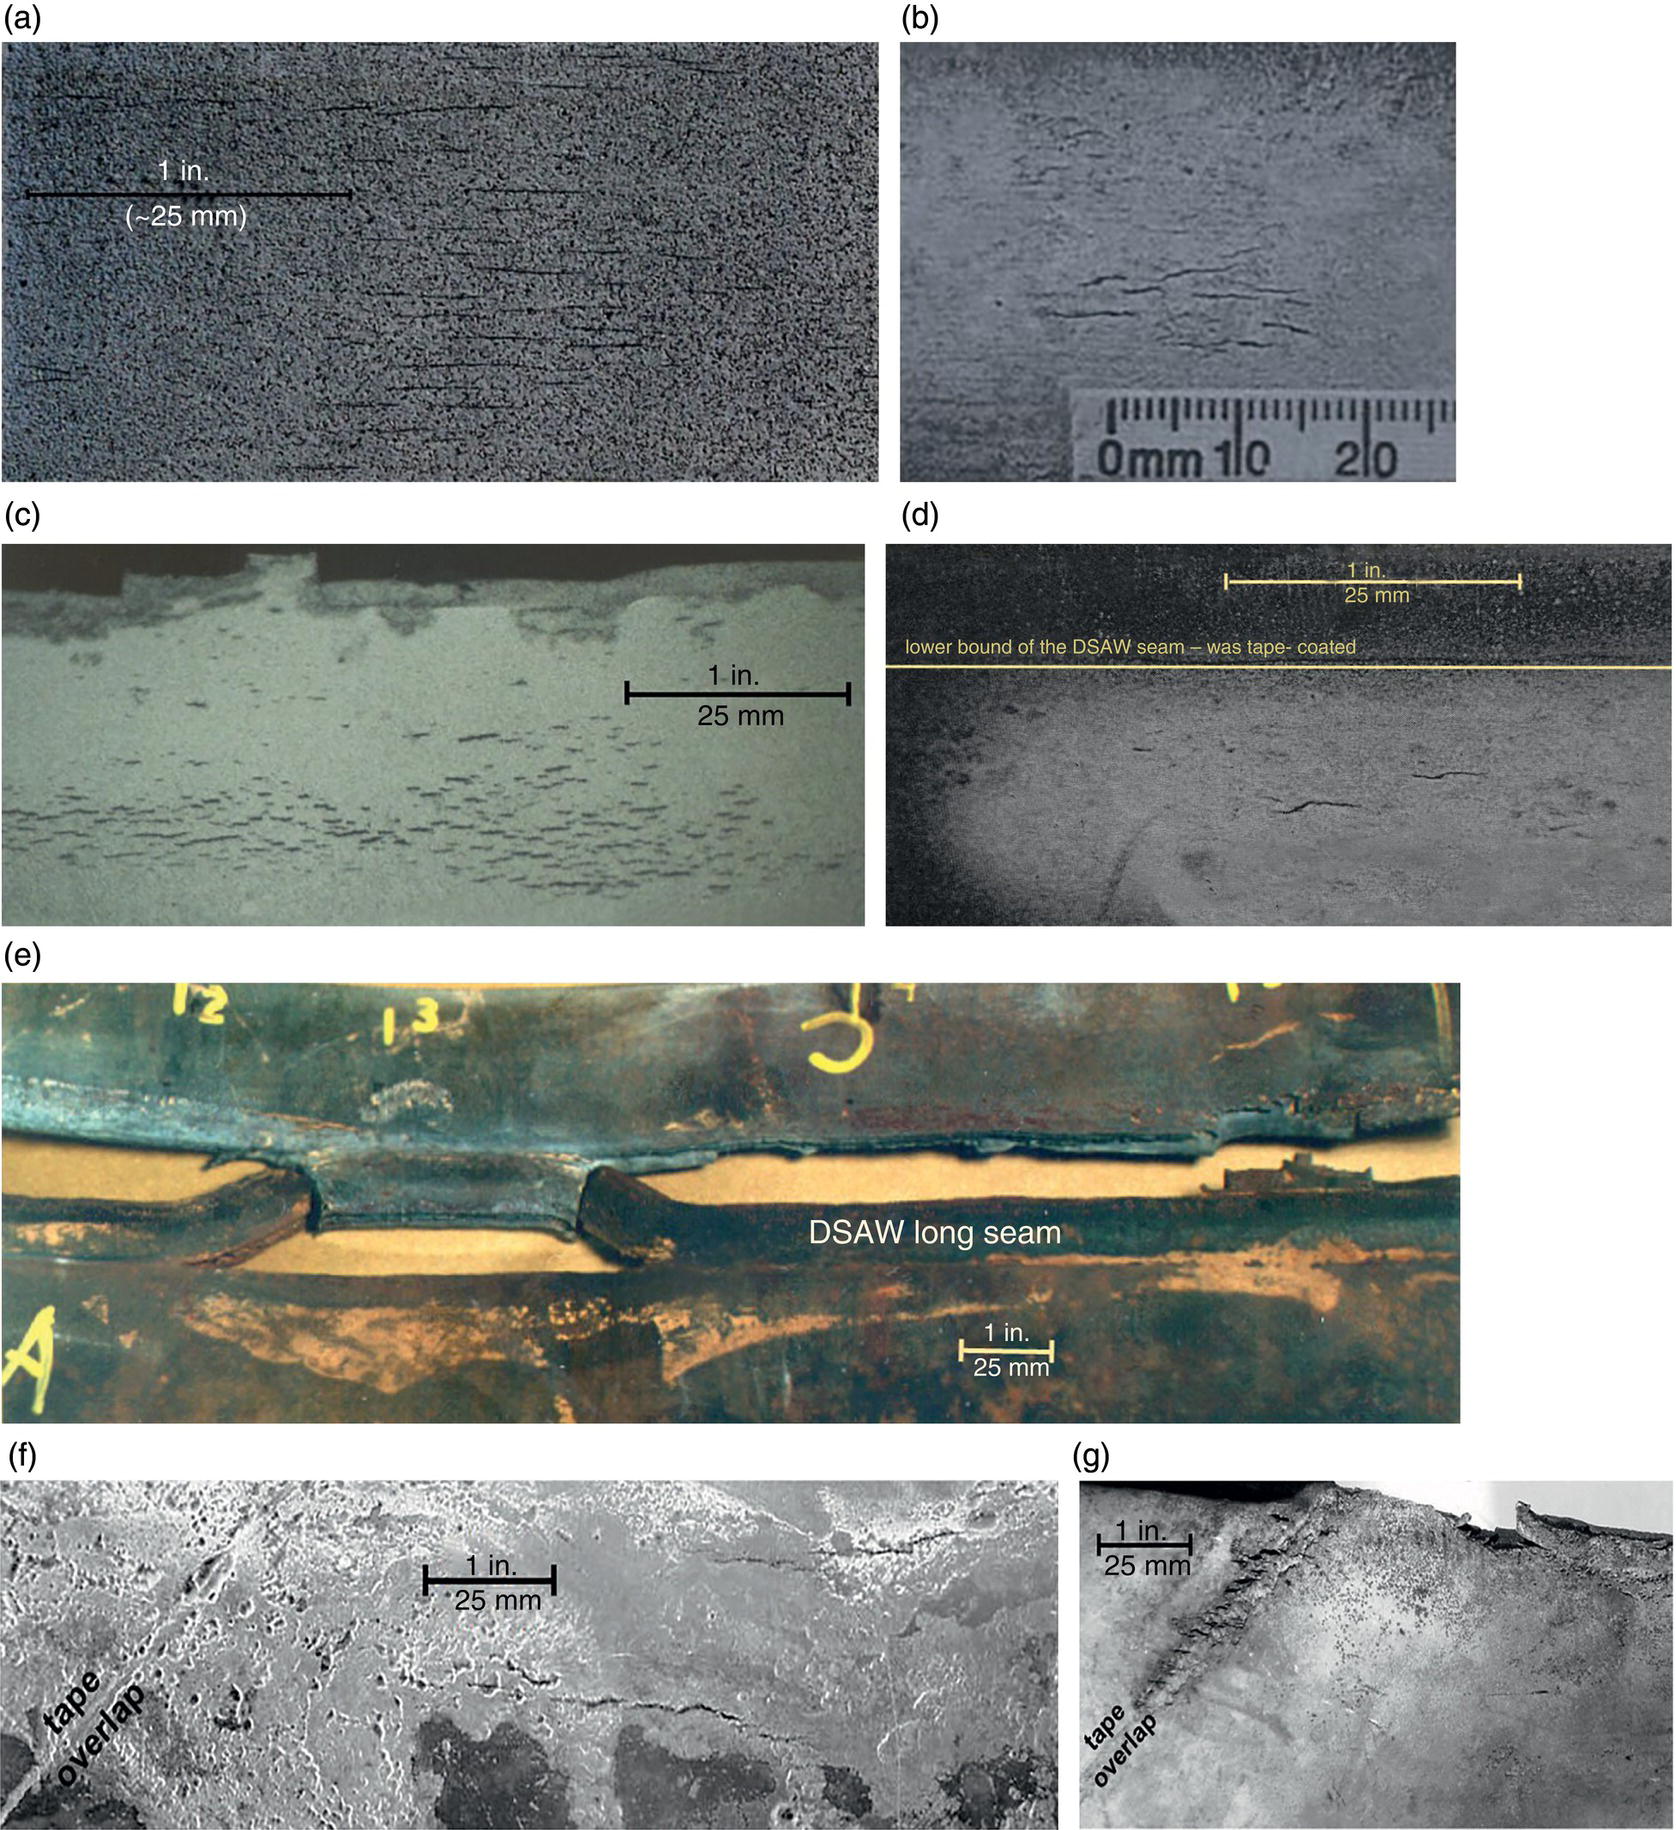
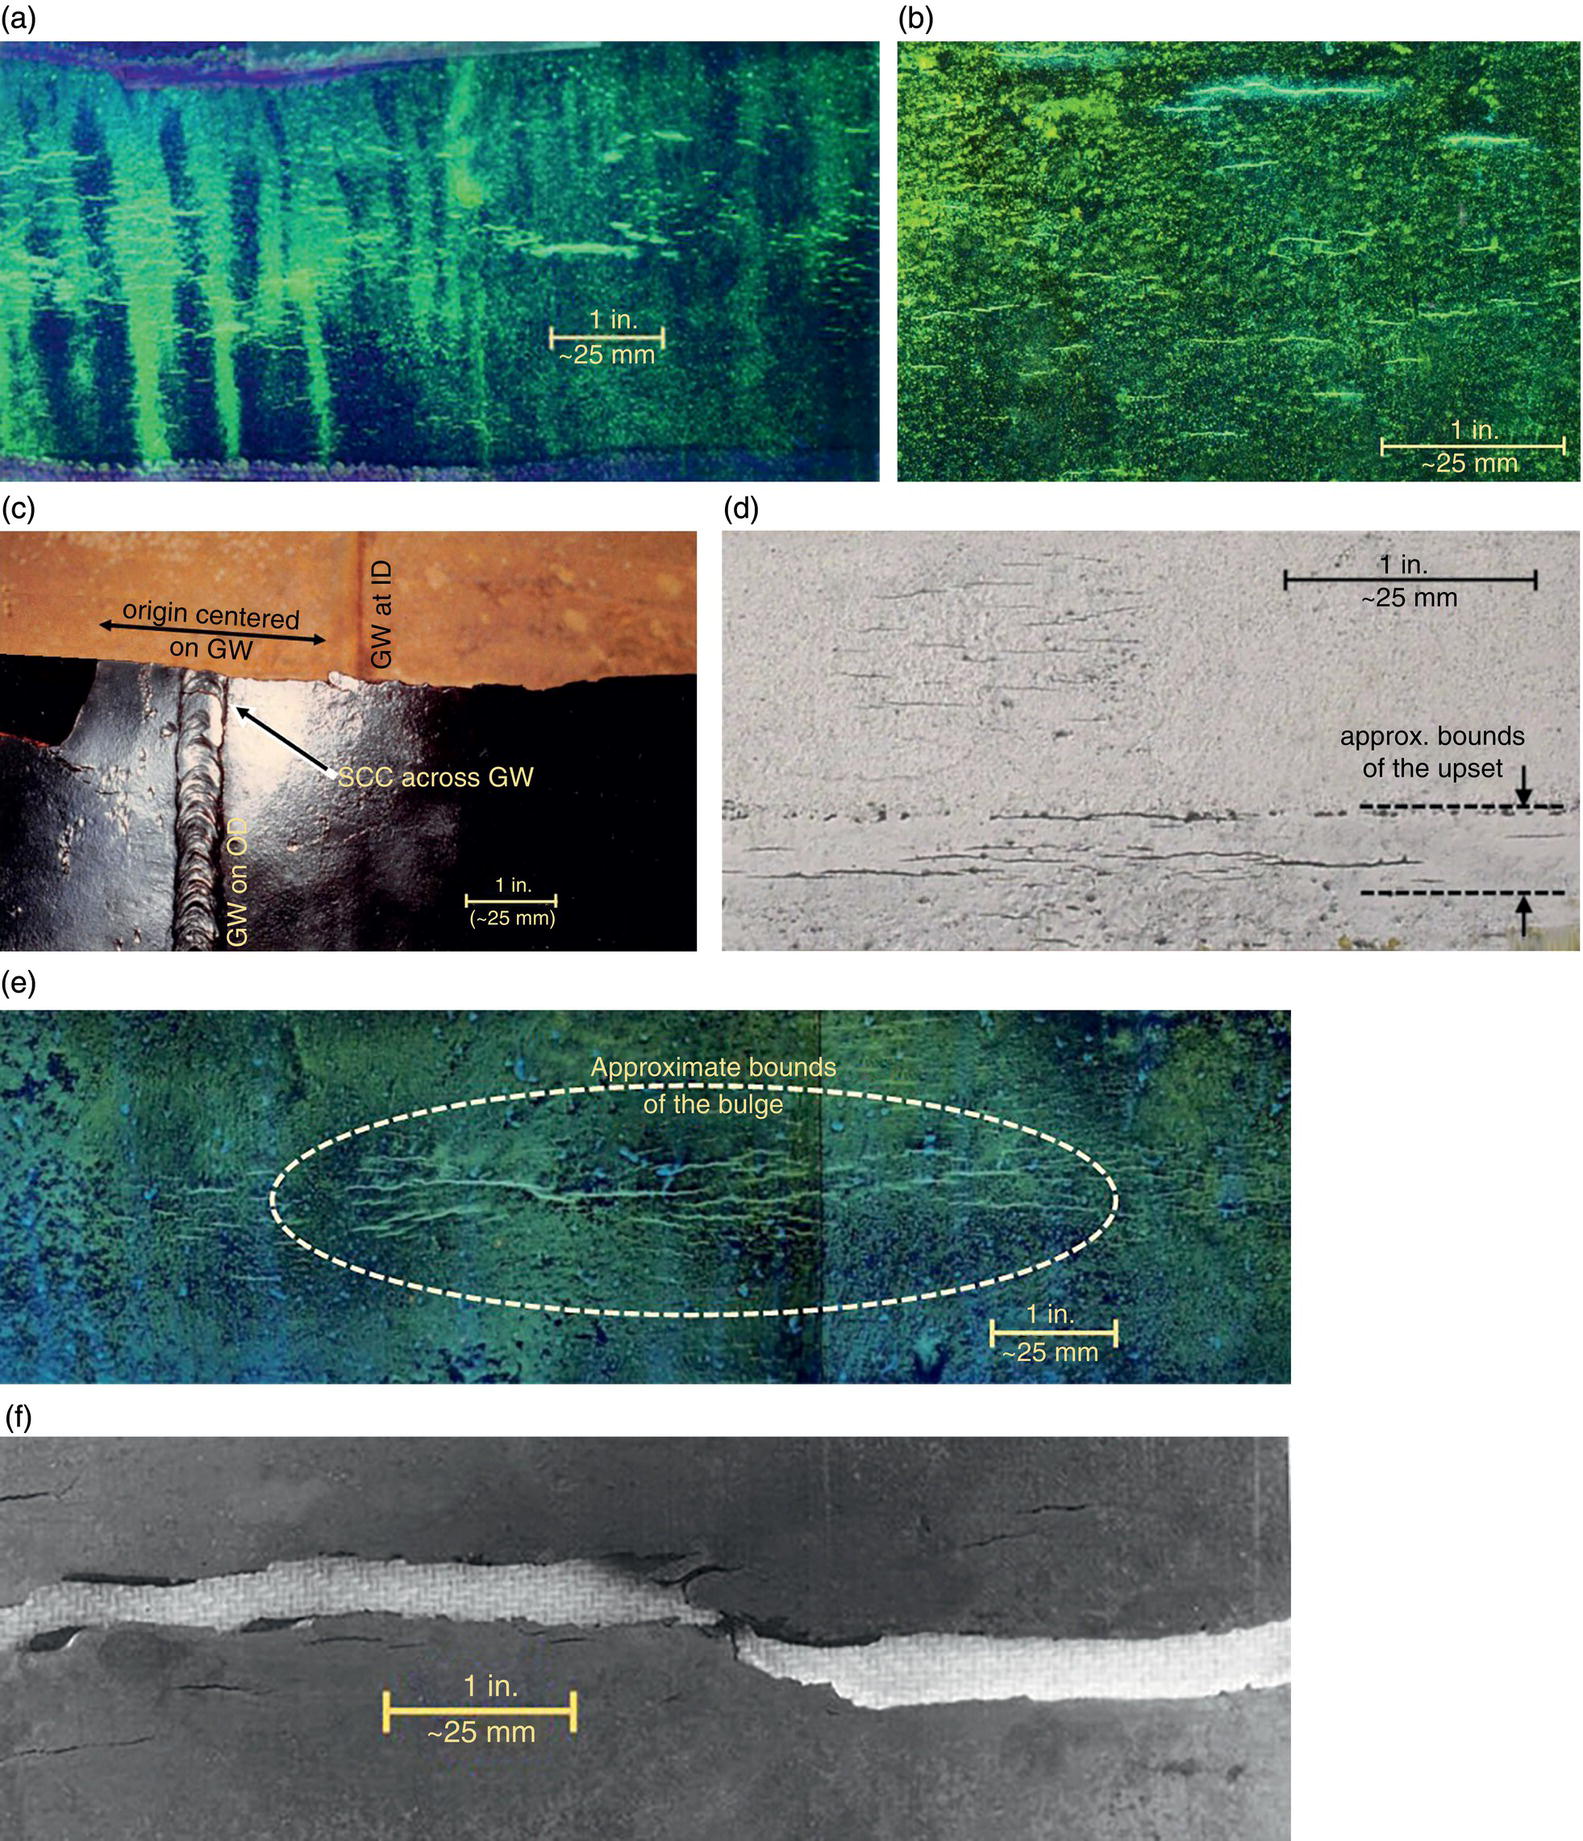
54.3.1.6 Observations
54.3.2 Crack Interaction and Coalescence
54.3.2.1 Concepts and Analysis
54.3.2.2 Imaging and Observations
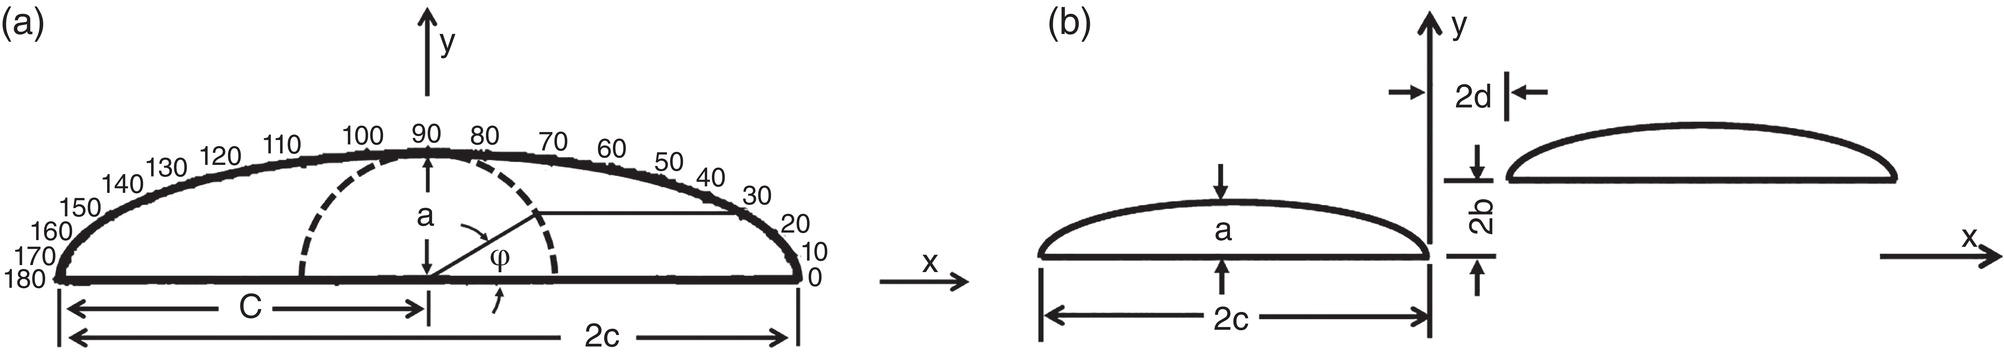
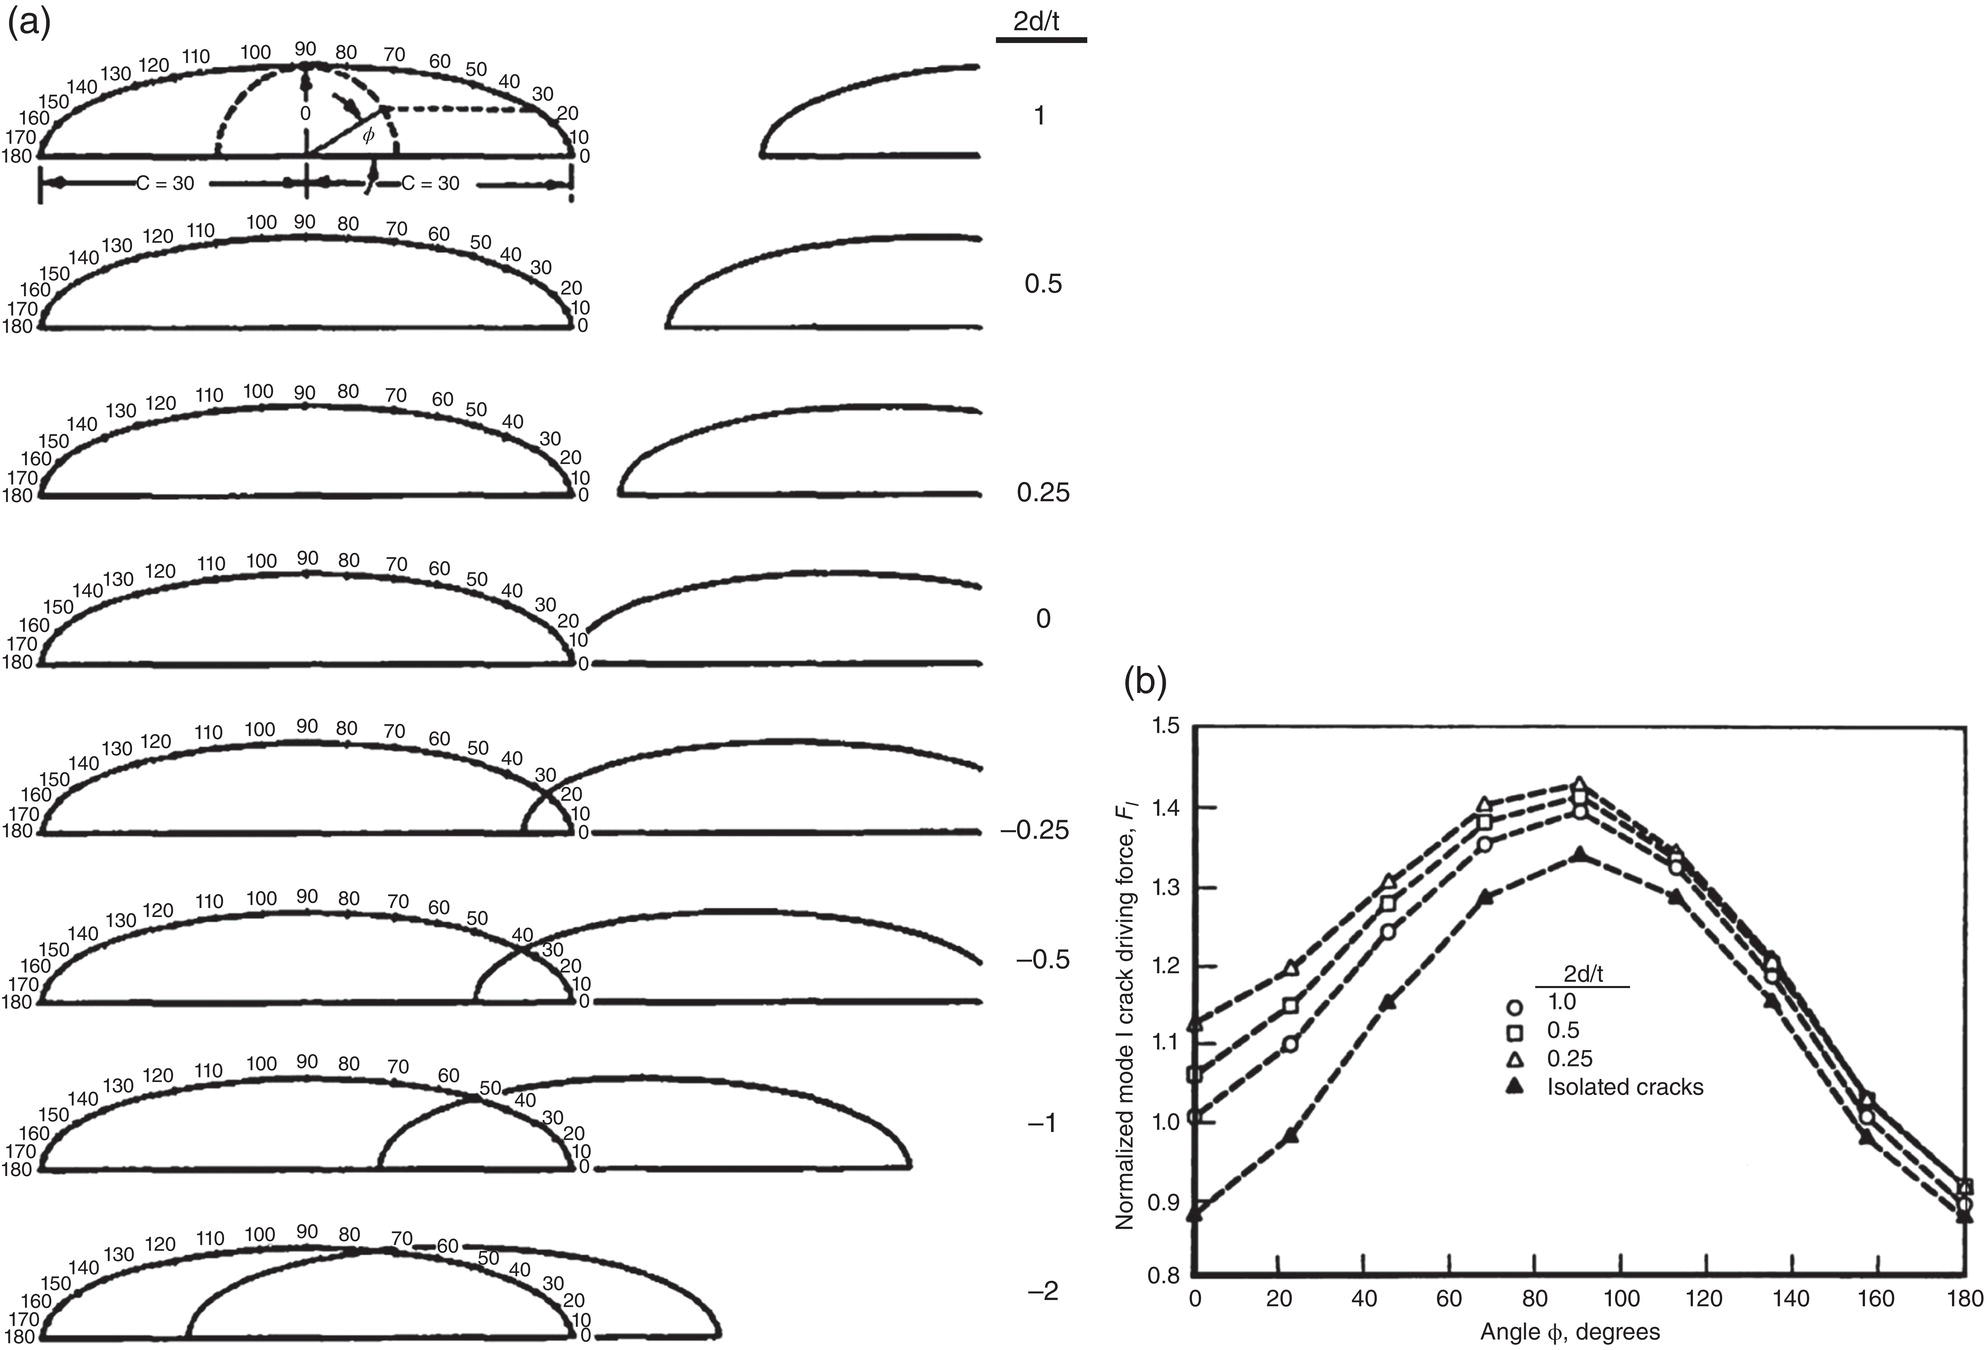
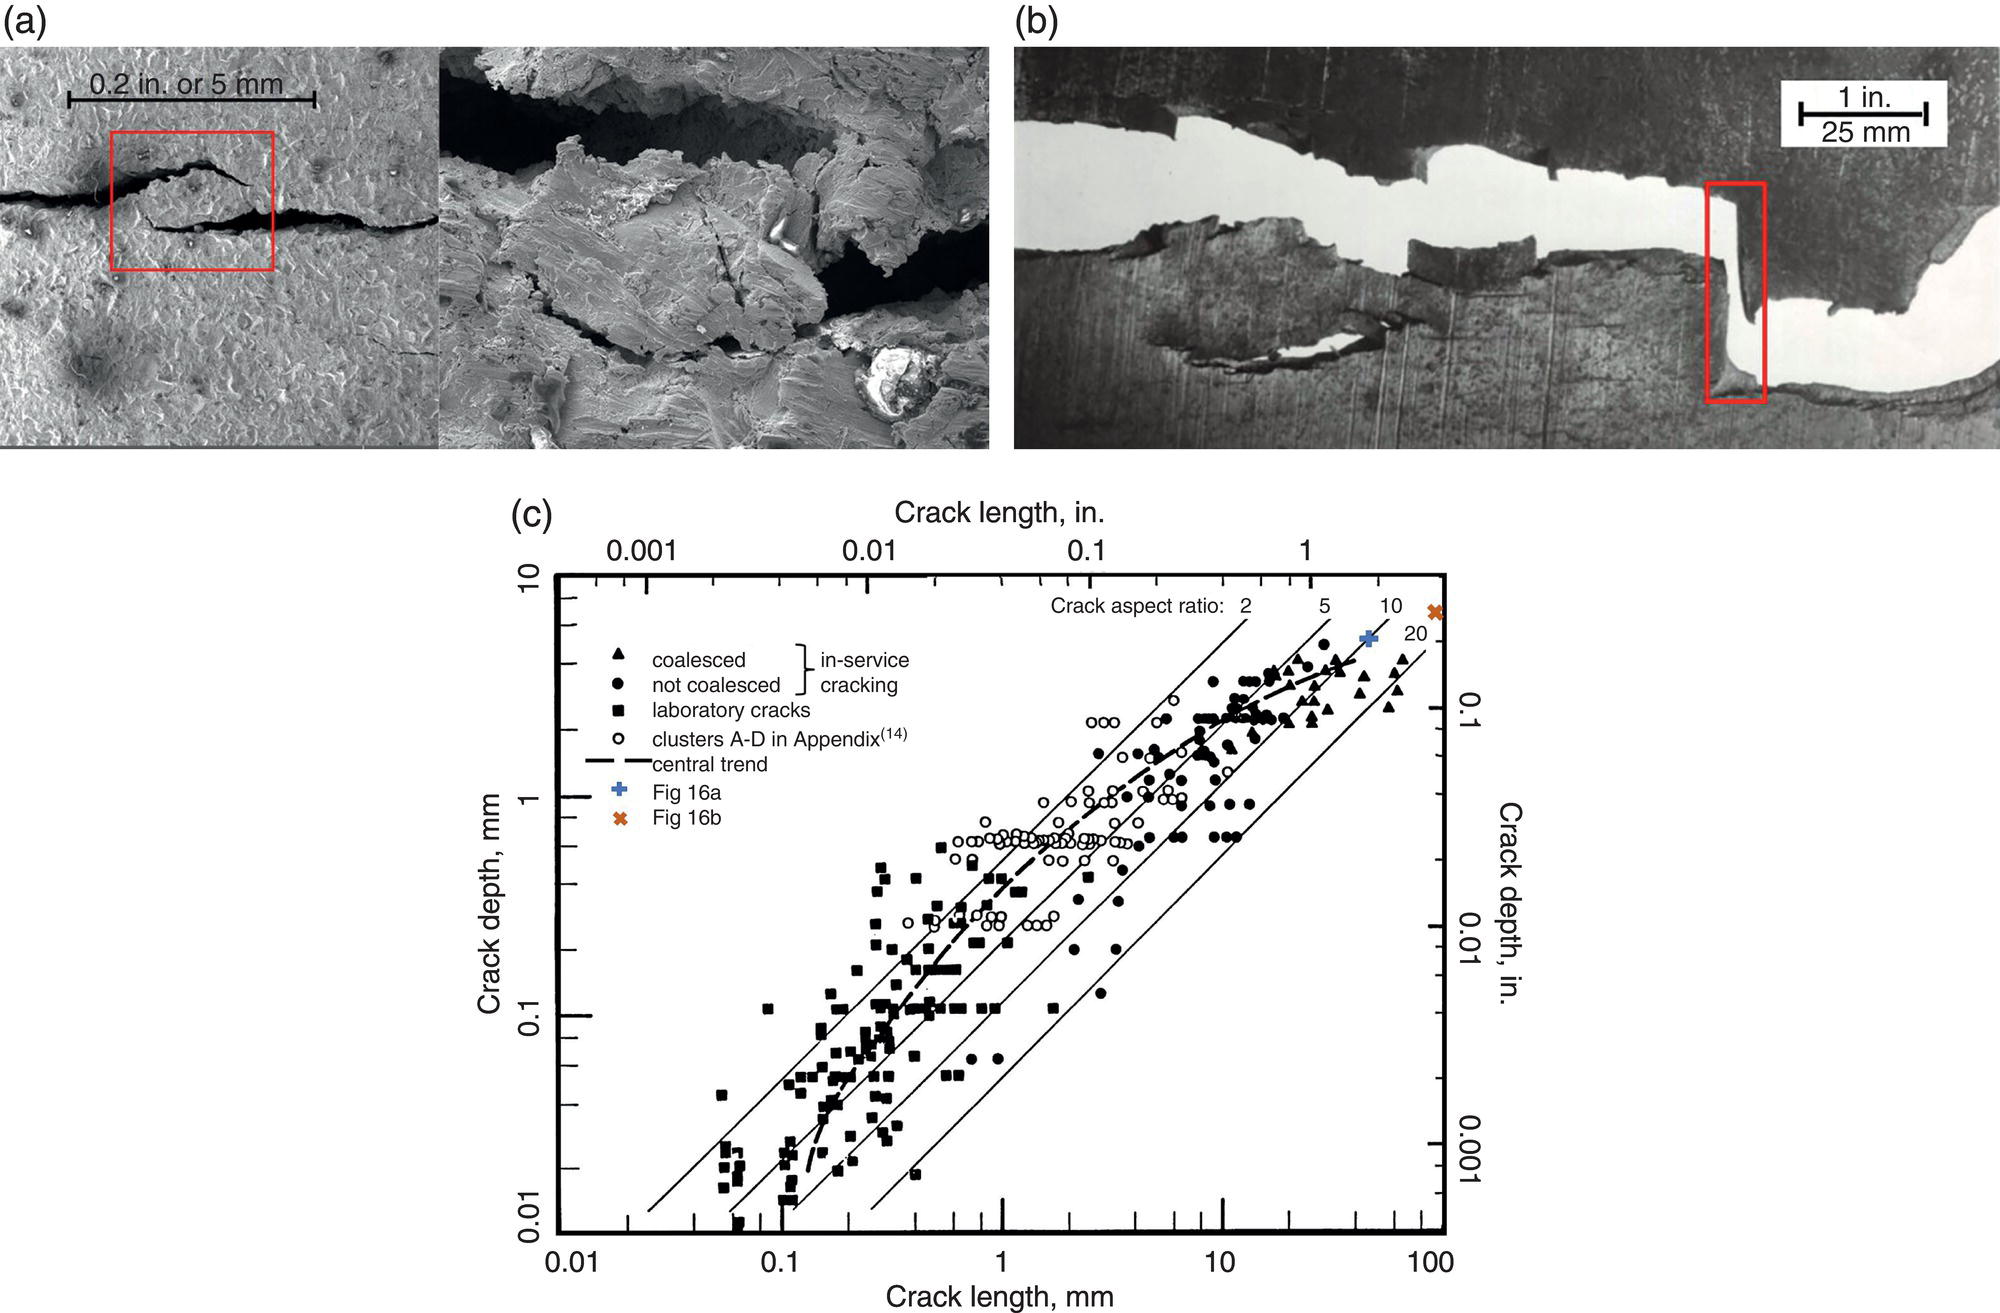
54.3.2.3 Technical Issues and Practical Takeaways
54.3.3 Fracture Surfaces: Rupture Origins Versus Leaks and Stable Cracking
54.3.3.1 Rupture Origins
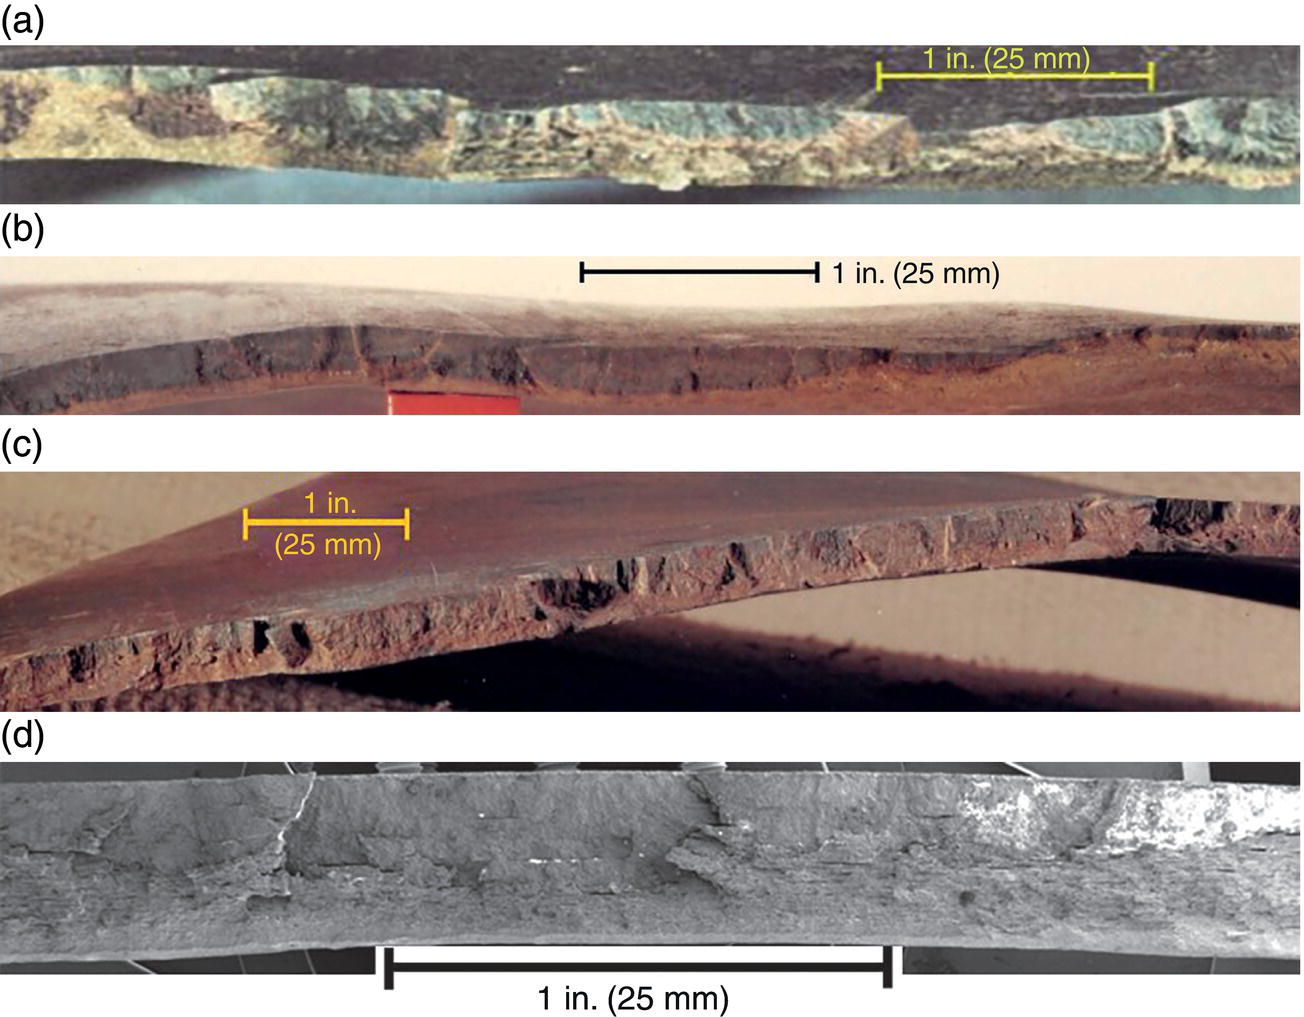
54.3.3.2 Leak Origins—Opened in the Laboratory
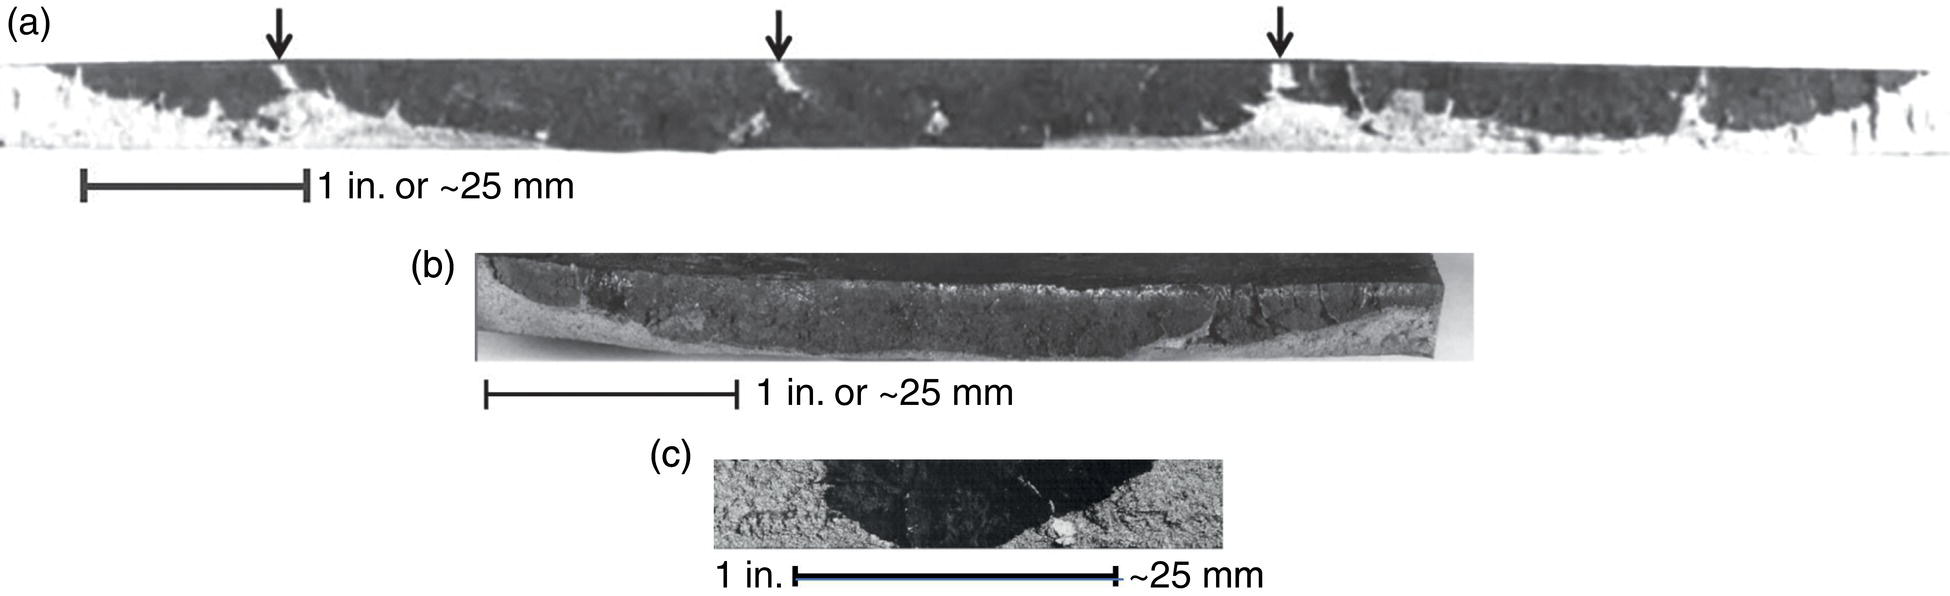
54.3.3.3 Still-Stable PTW Cracks—Opened in the Laboratory
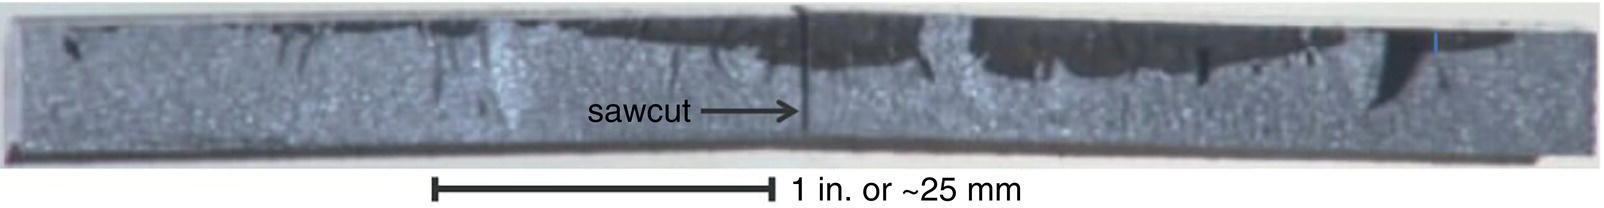
54.3.3.4 Crack Initiation and Point-Source Growth—Views Along Fracture Surfaces
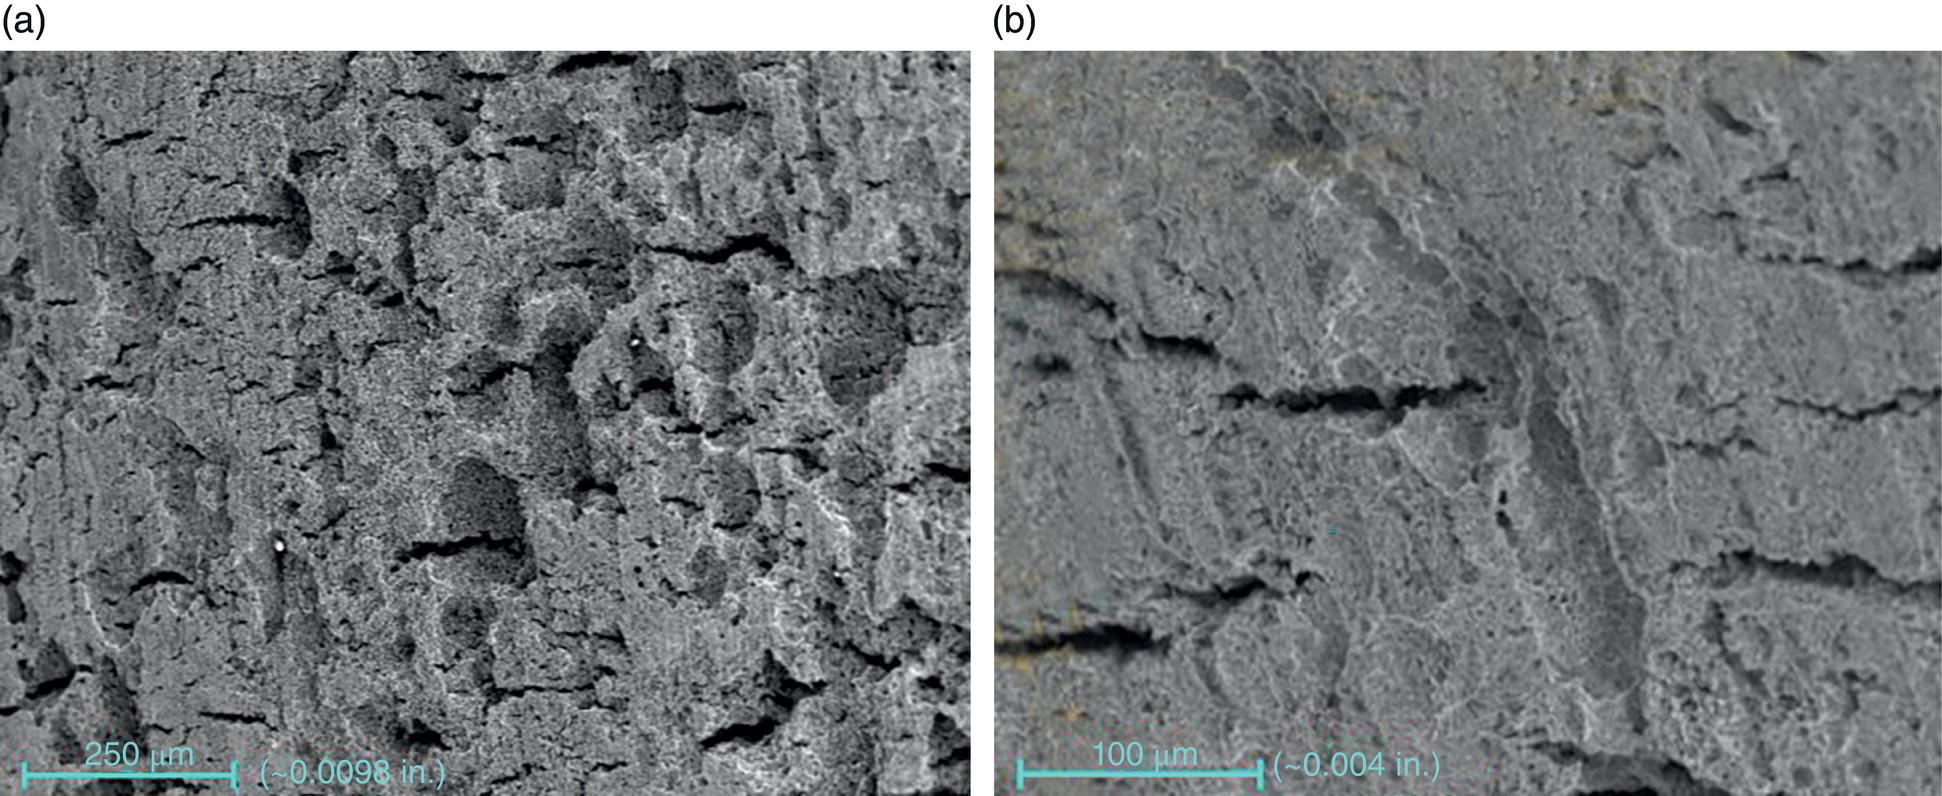
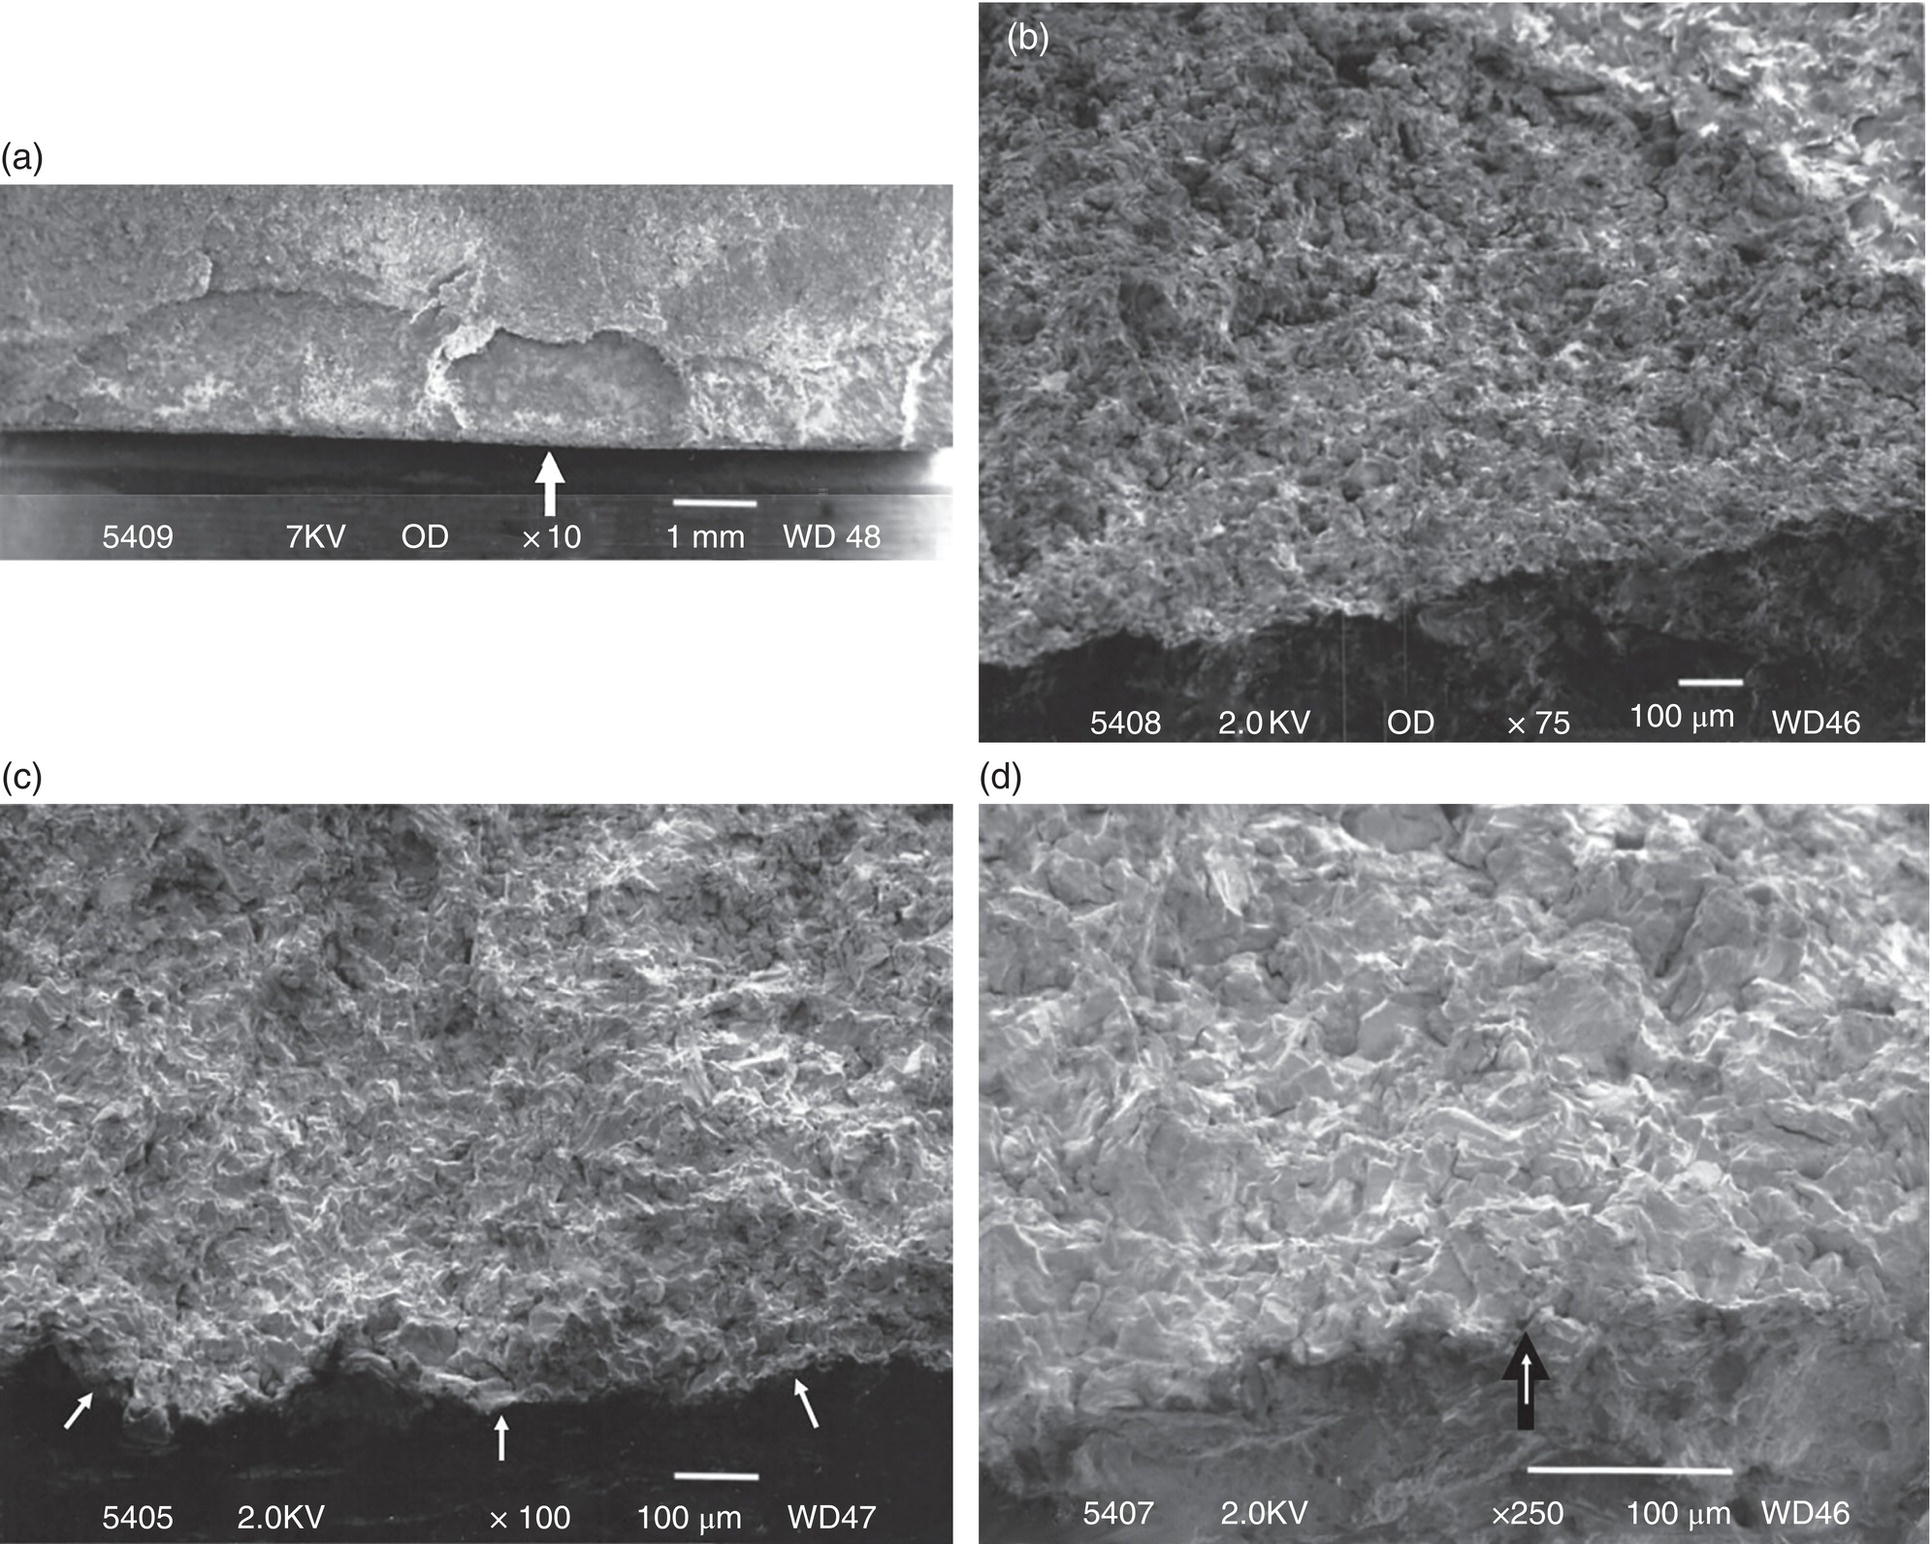
54.3.3.5 Onset of Growth into the Pipe Wall and Shift to Fracture Mechanics Control
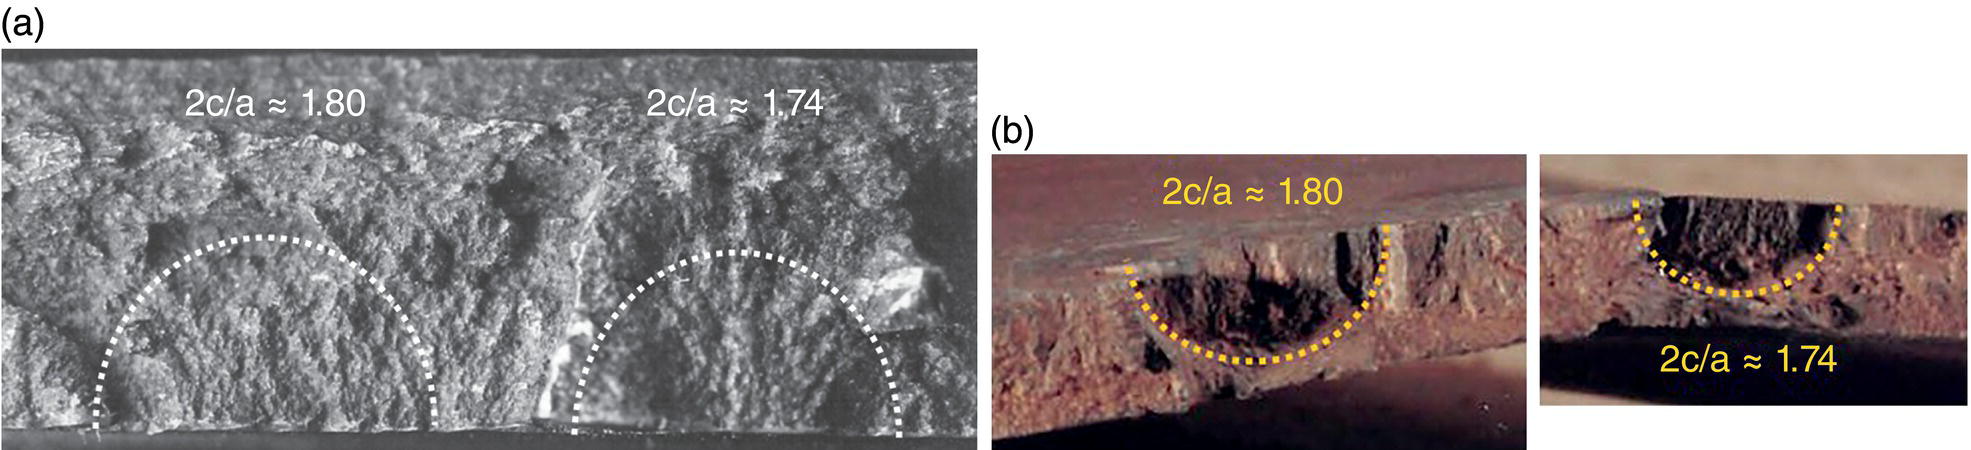
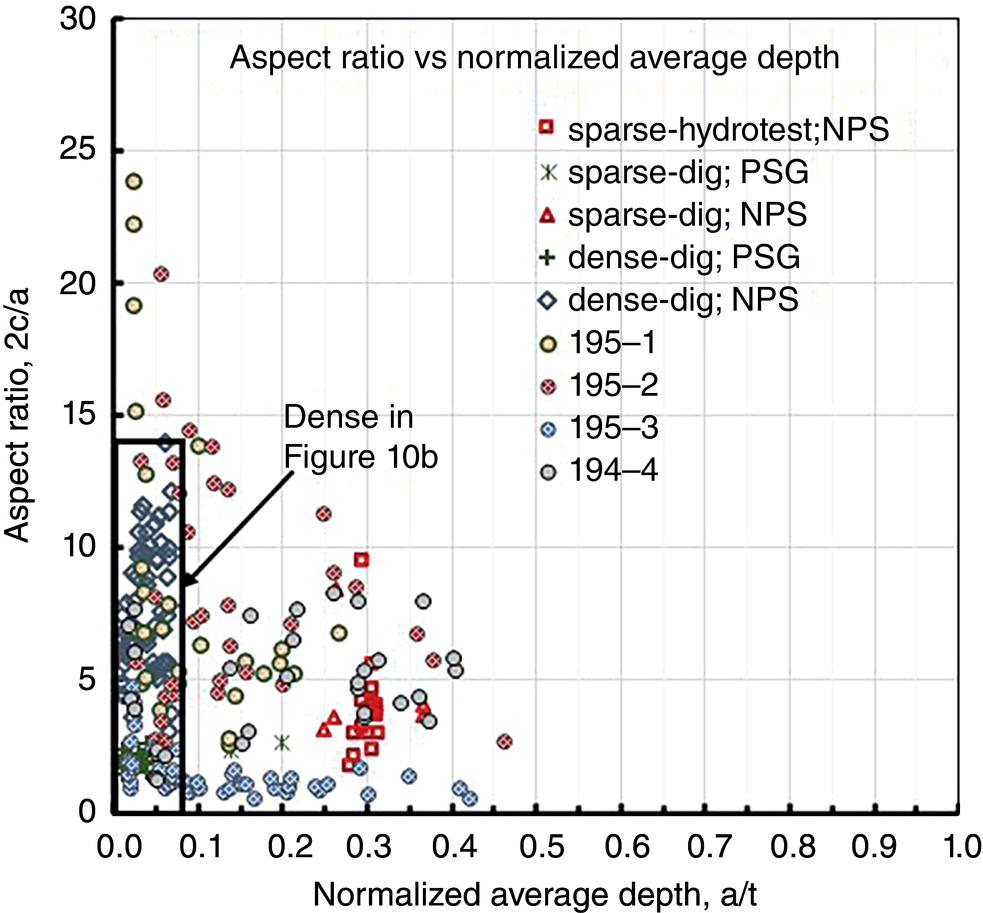
54.3.3.6 Summary and Practical Takeaways
54.3.4 Cracking Imaged in Metallographic Cross Sections
54.3.4.1 Potential Origins and Early Growth Imaged in Metallographic Sections
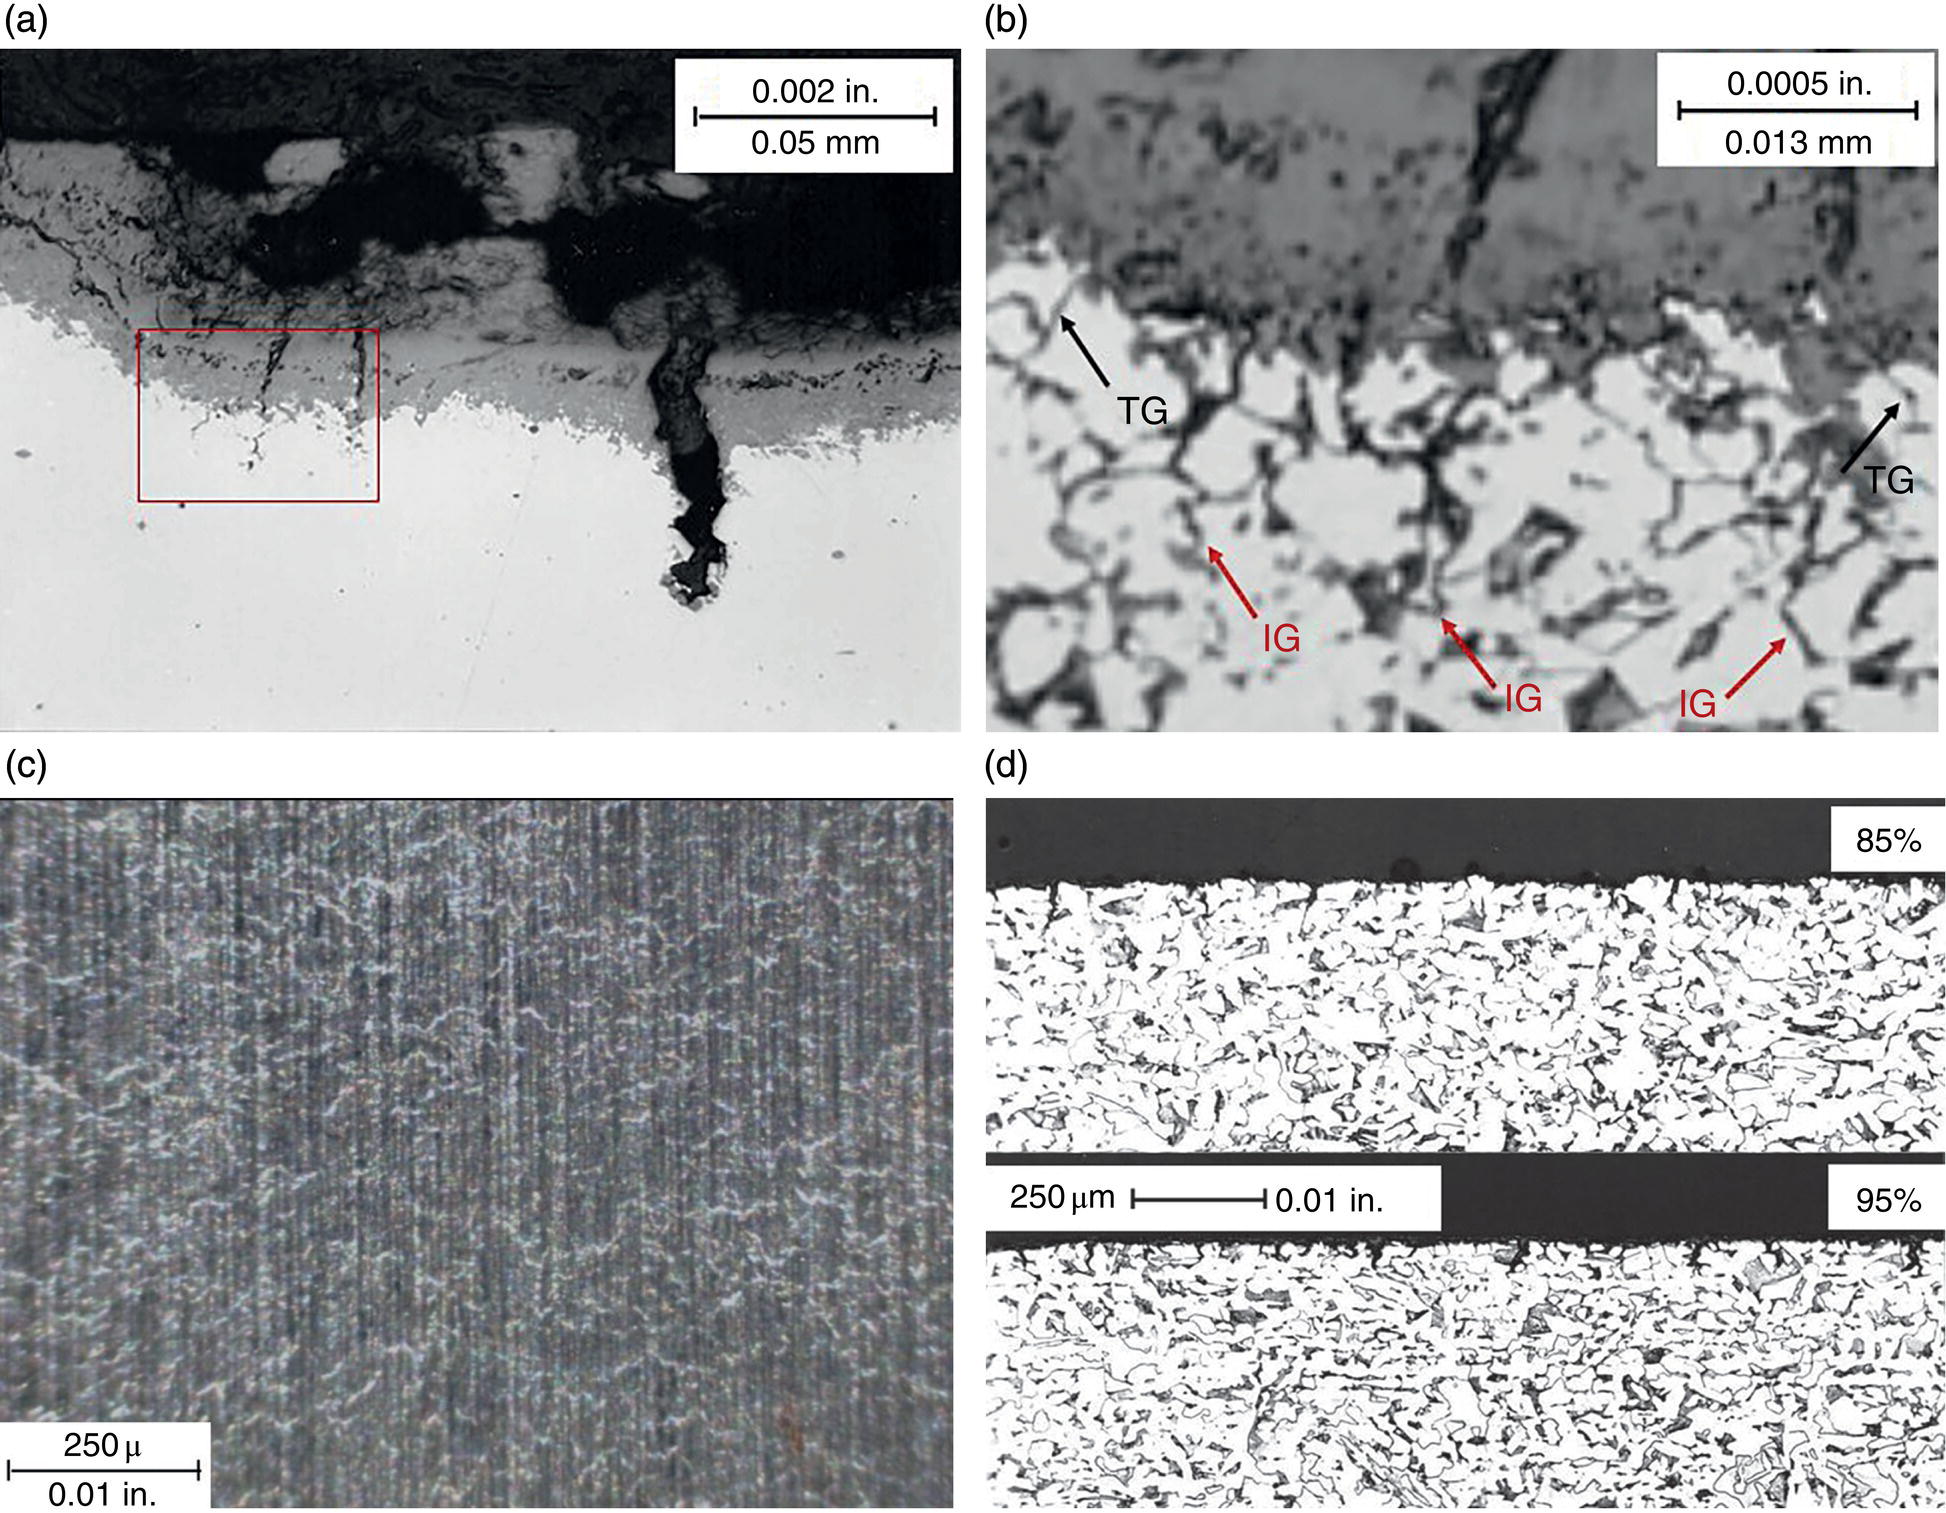
54.3.4.2 Cracking Imaged in Metallographic Sections
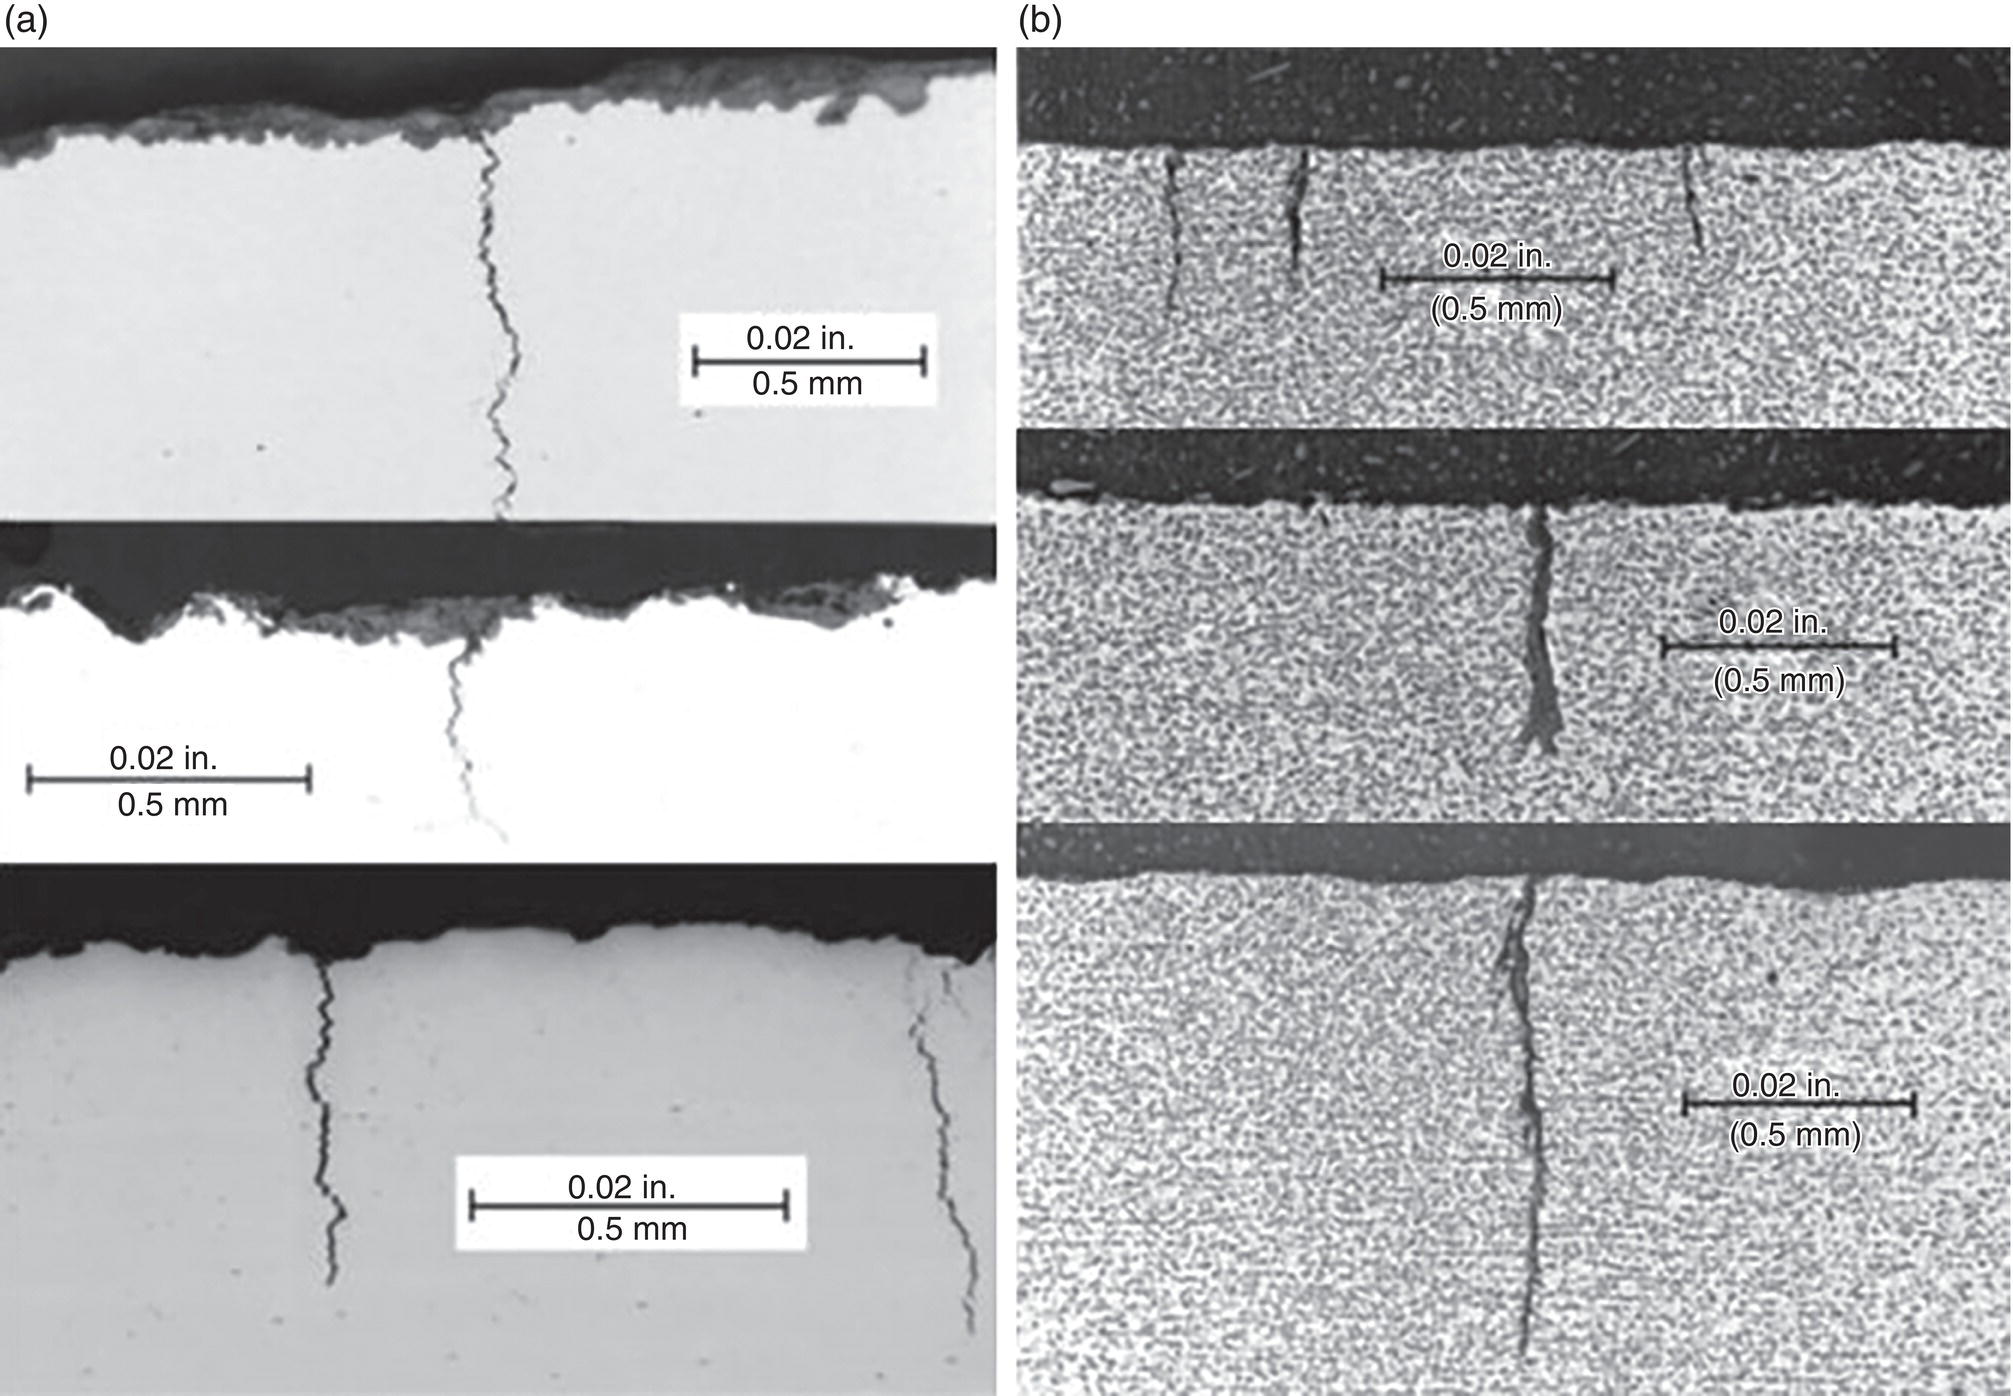
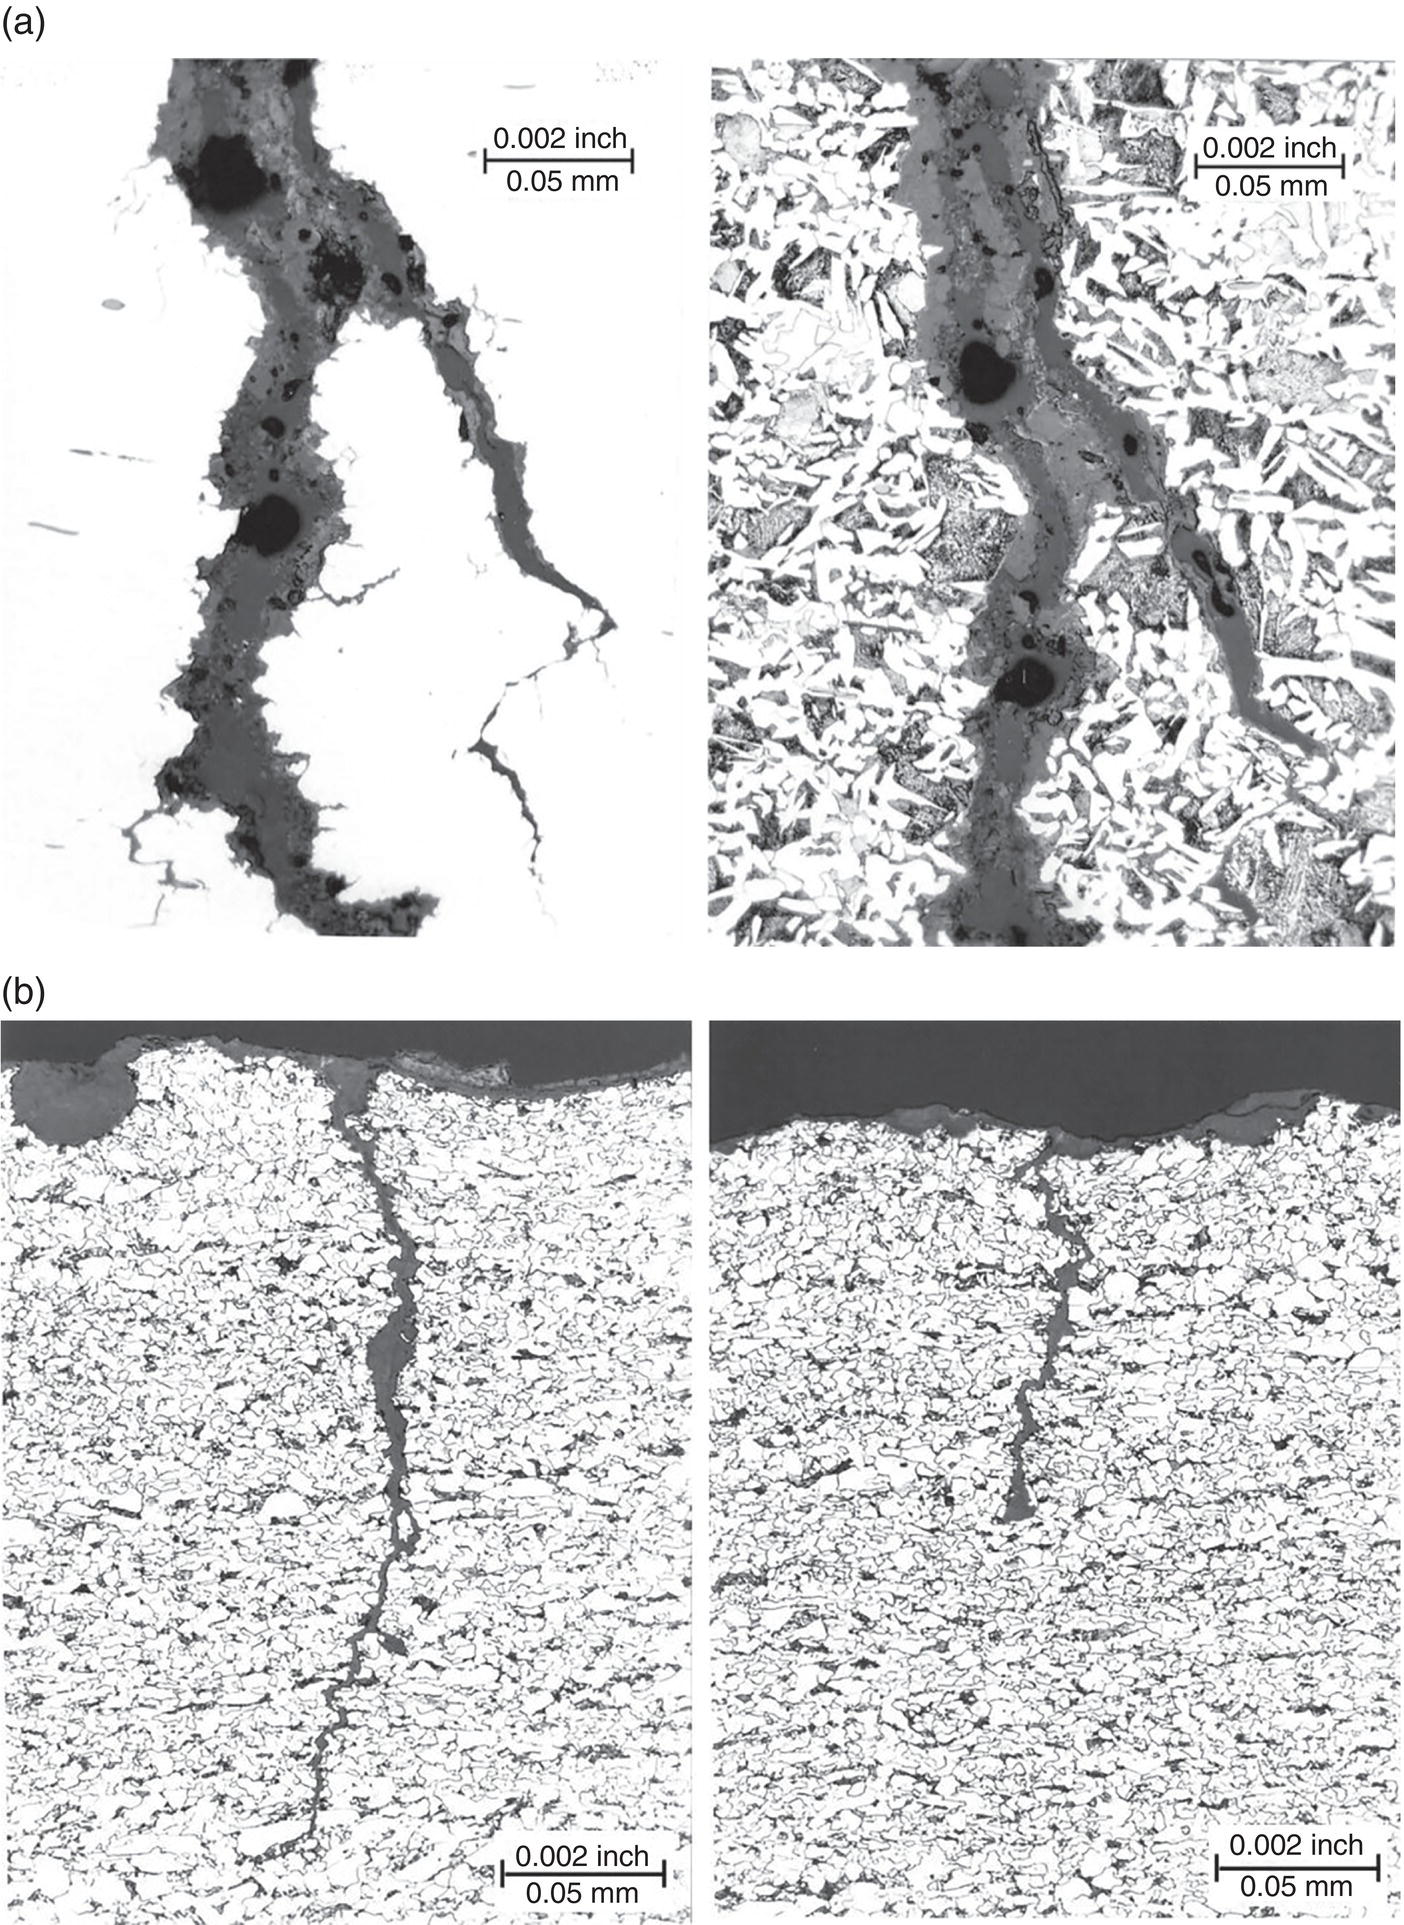
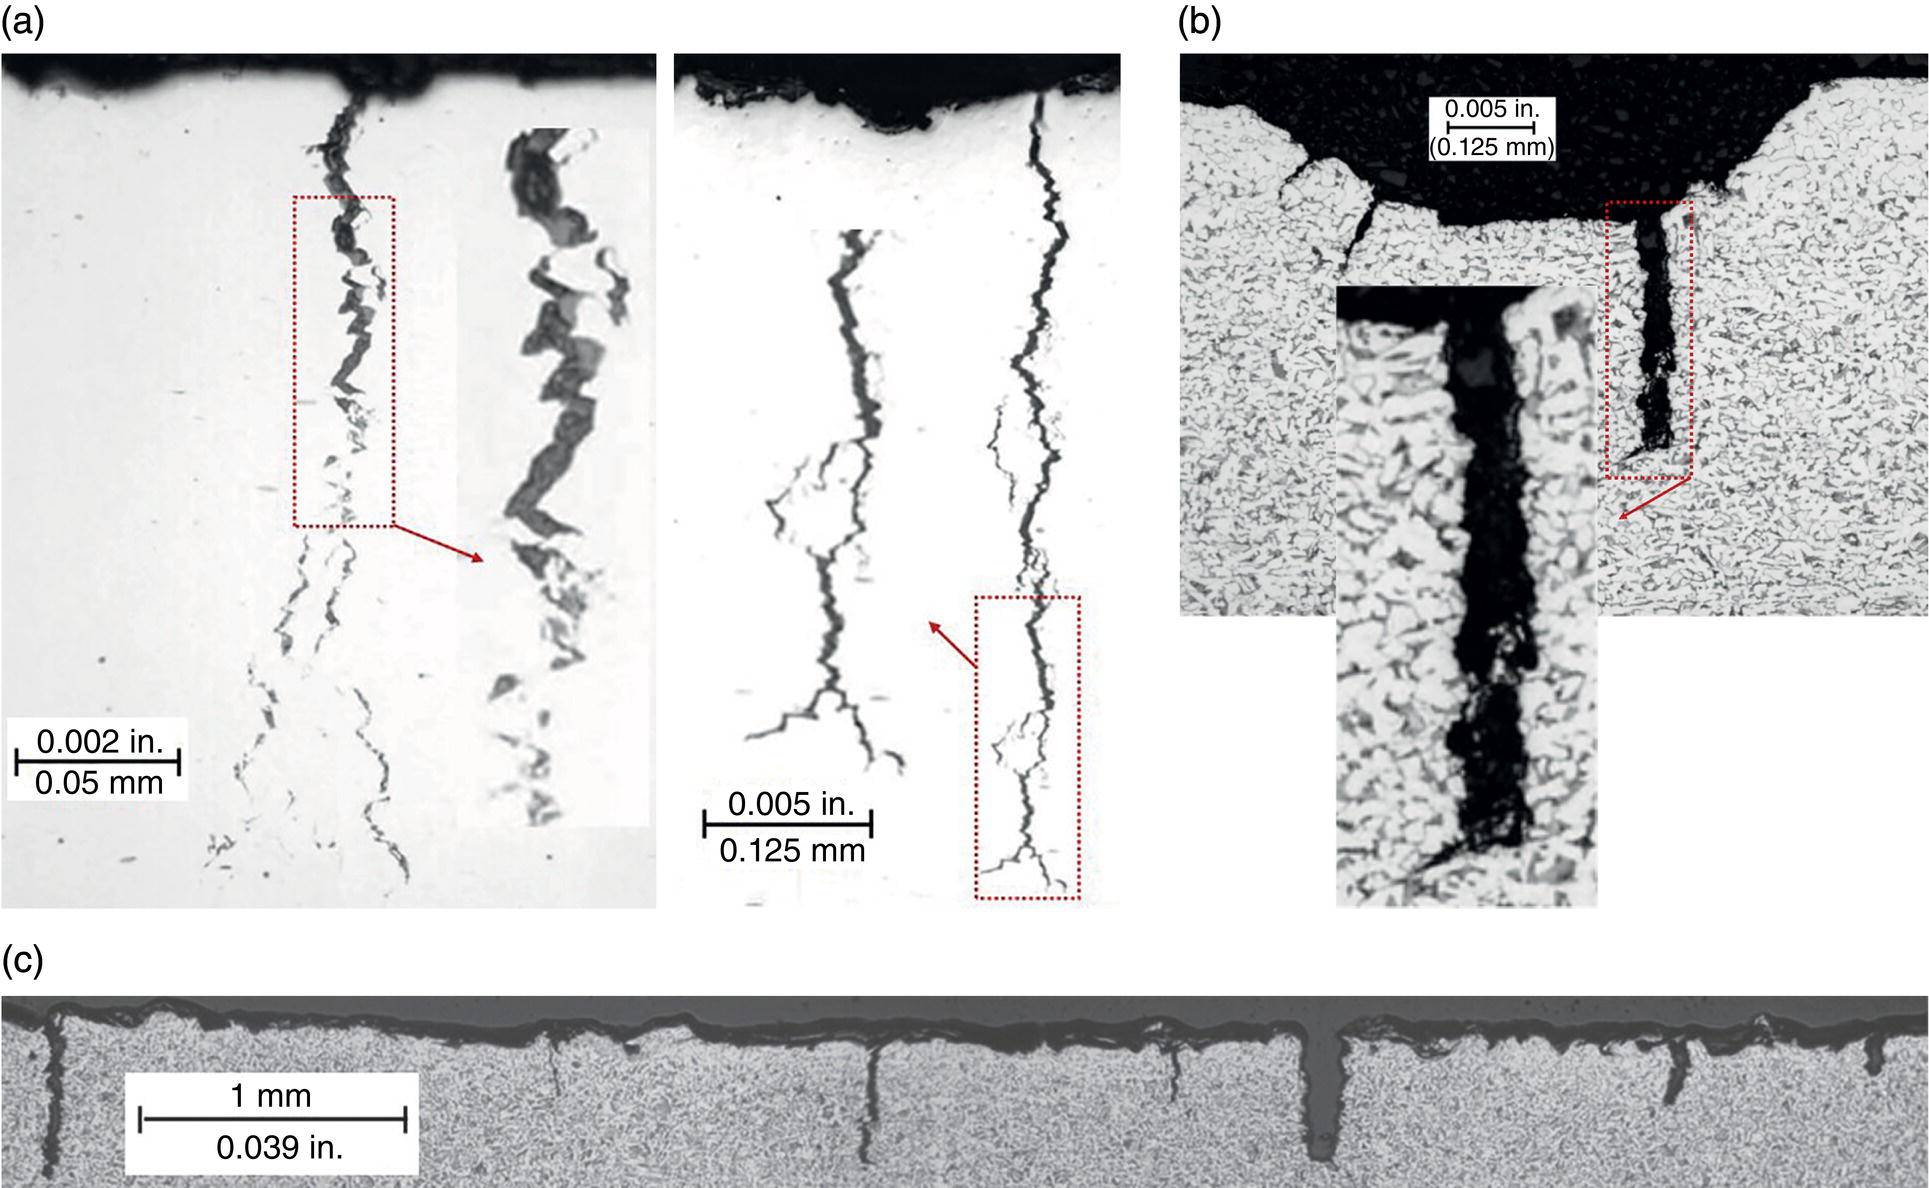
54.3.4.3 Microstructure Can Affect Crack Morphology
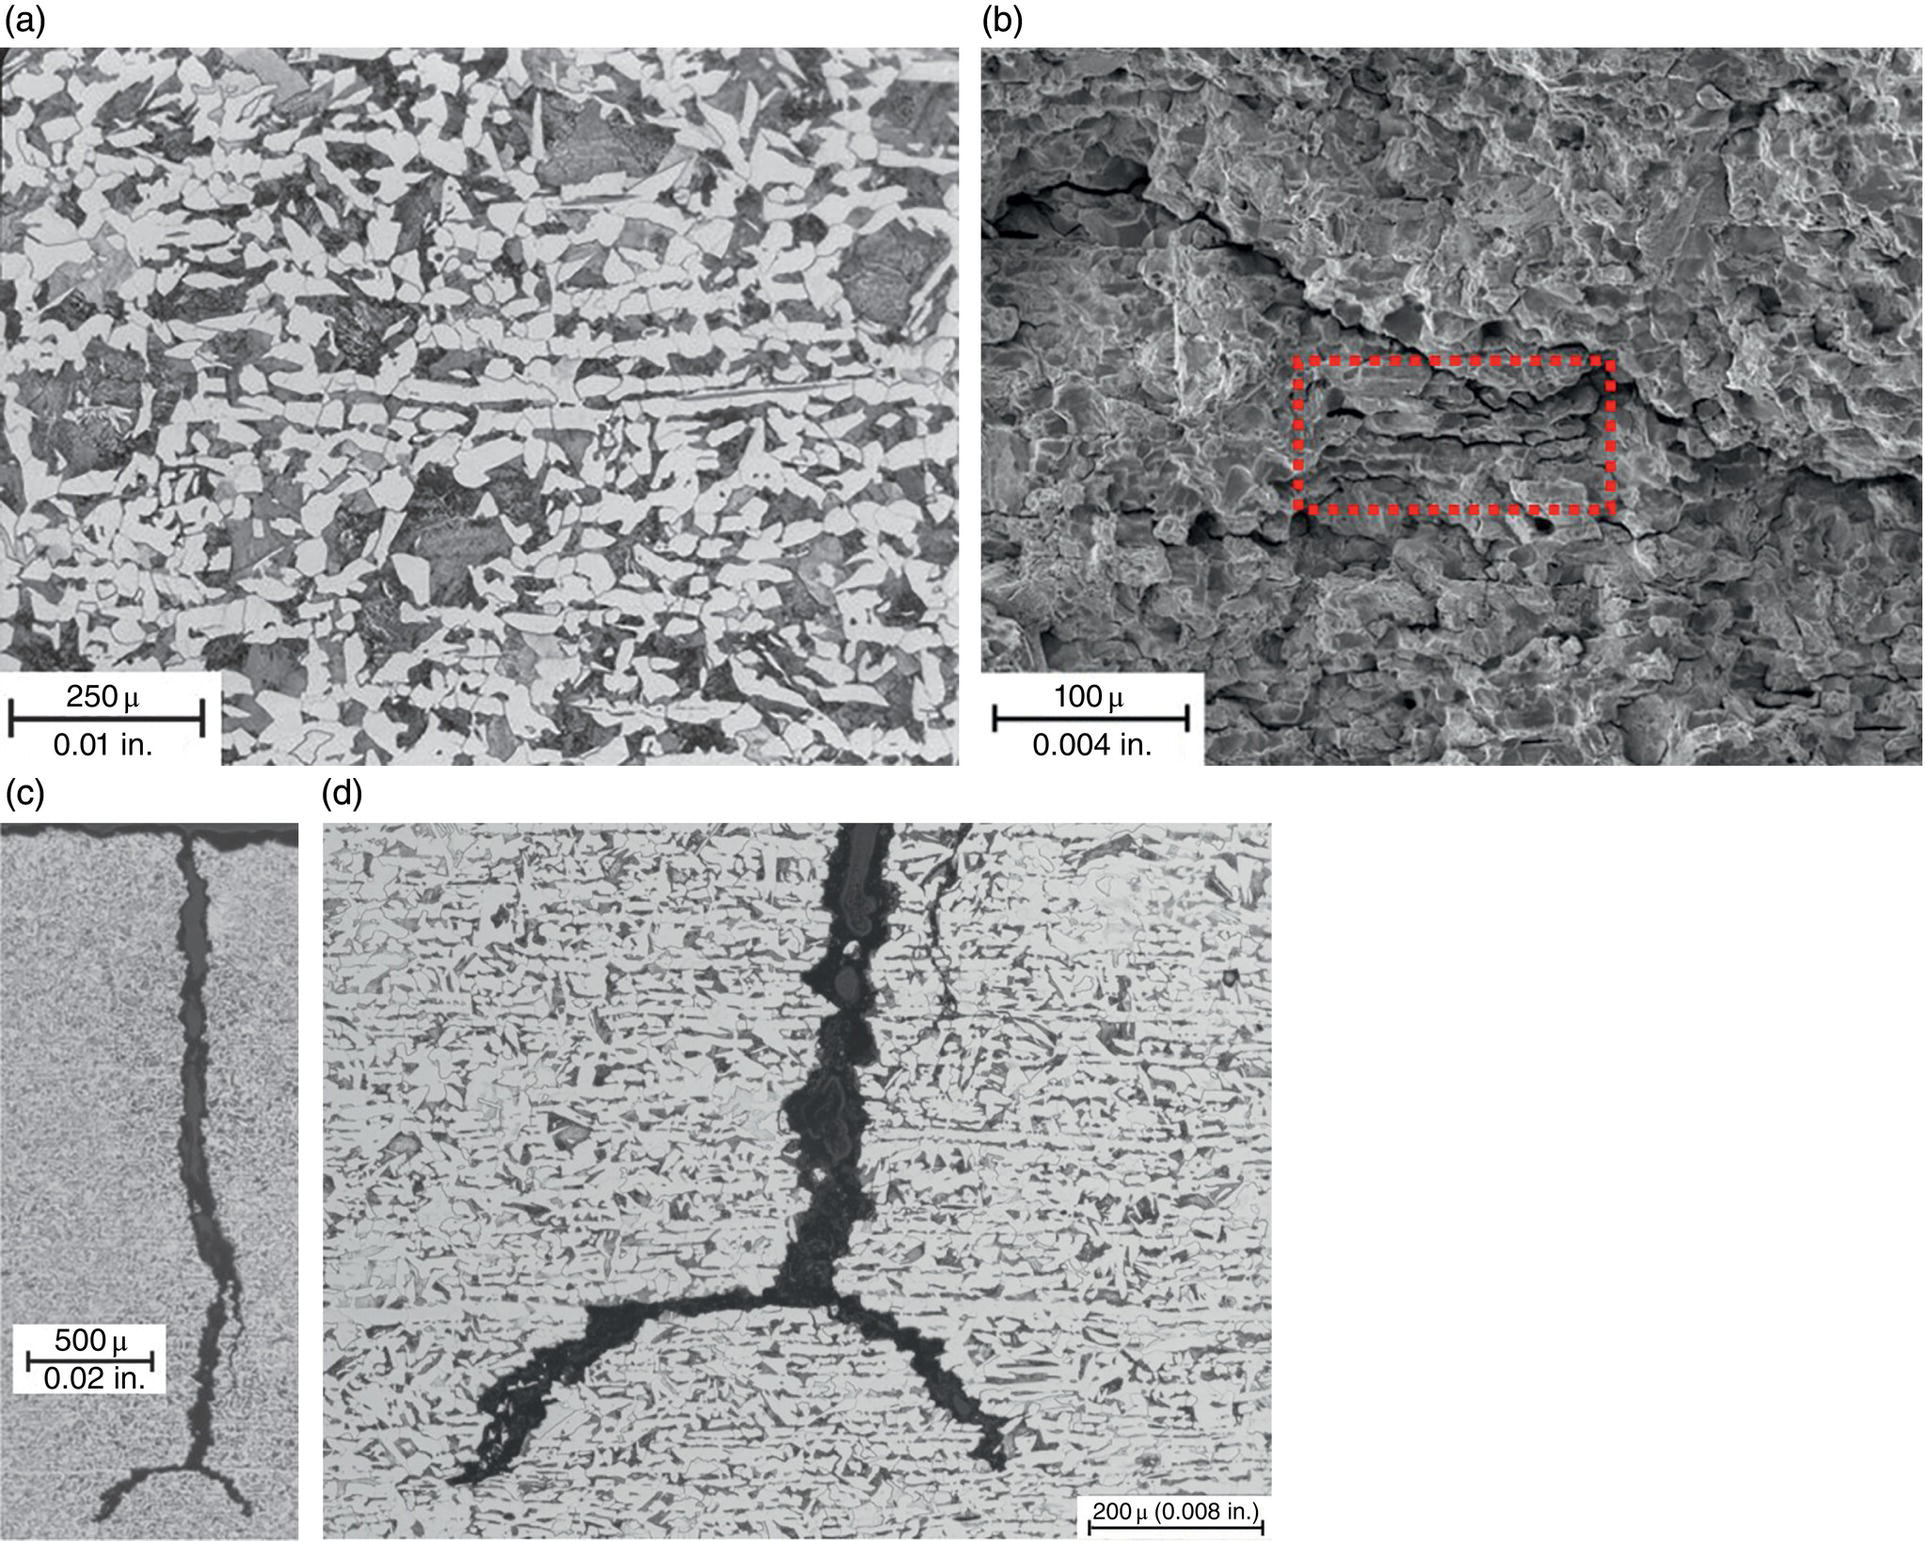
54.3.4.4 Is the Cracking Environment Uniquely Tied to the Cracking Morphology?
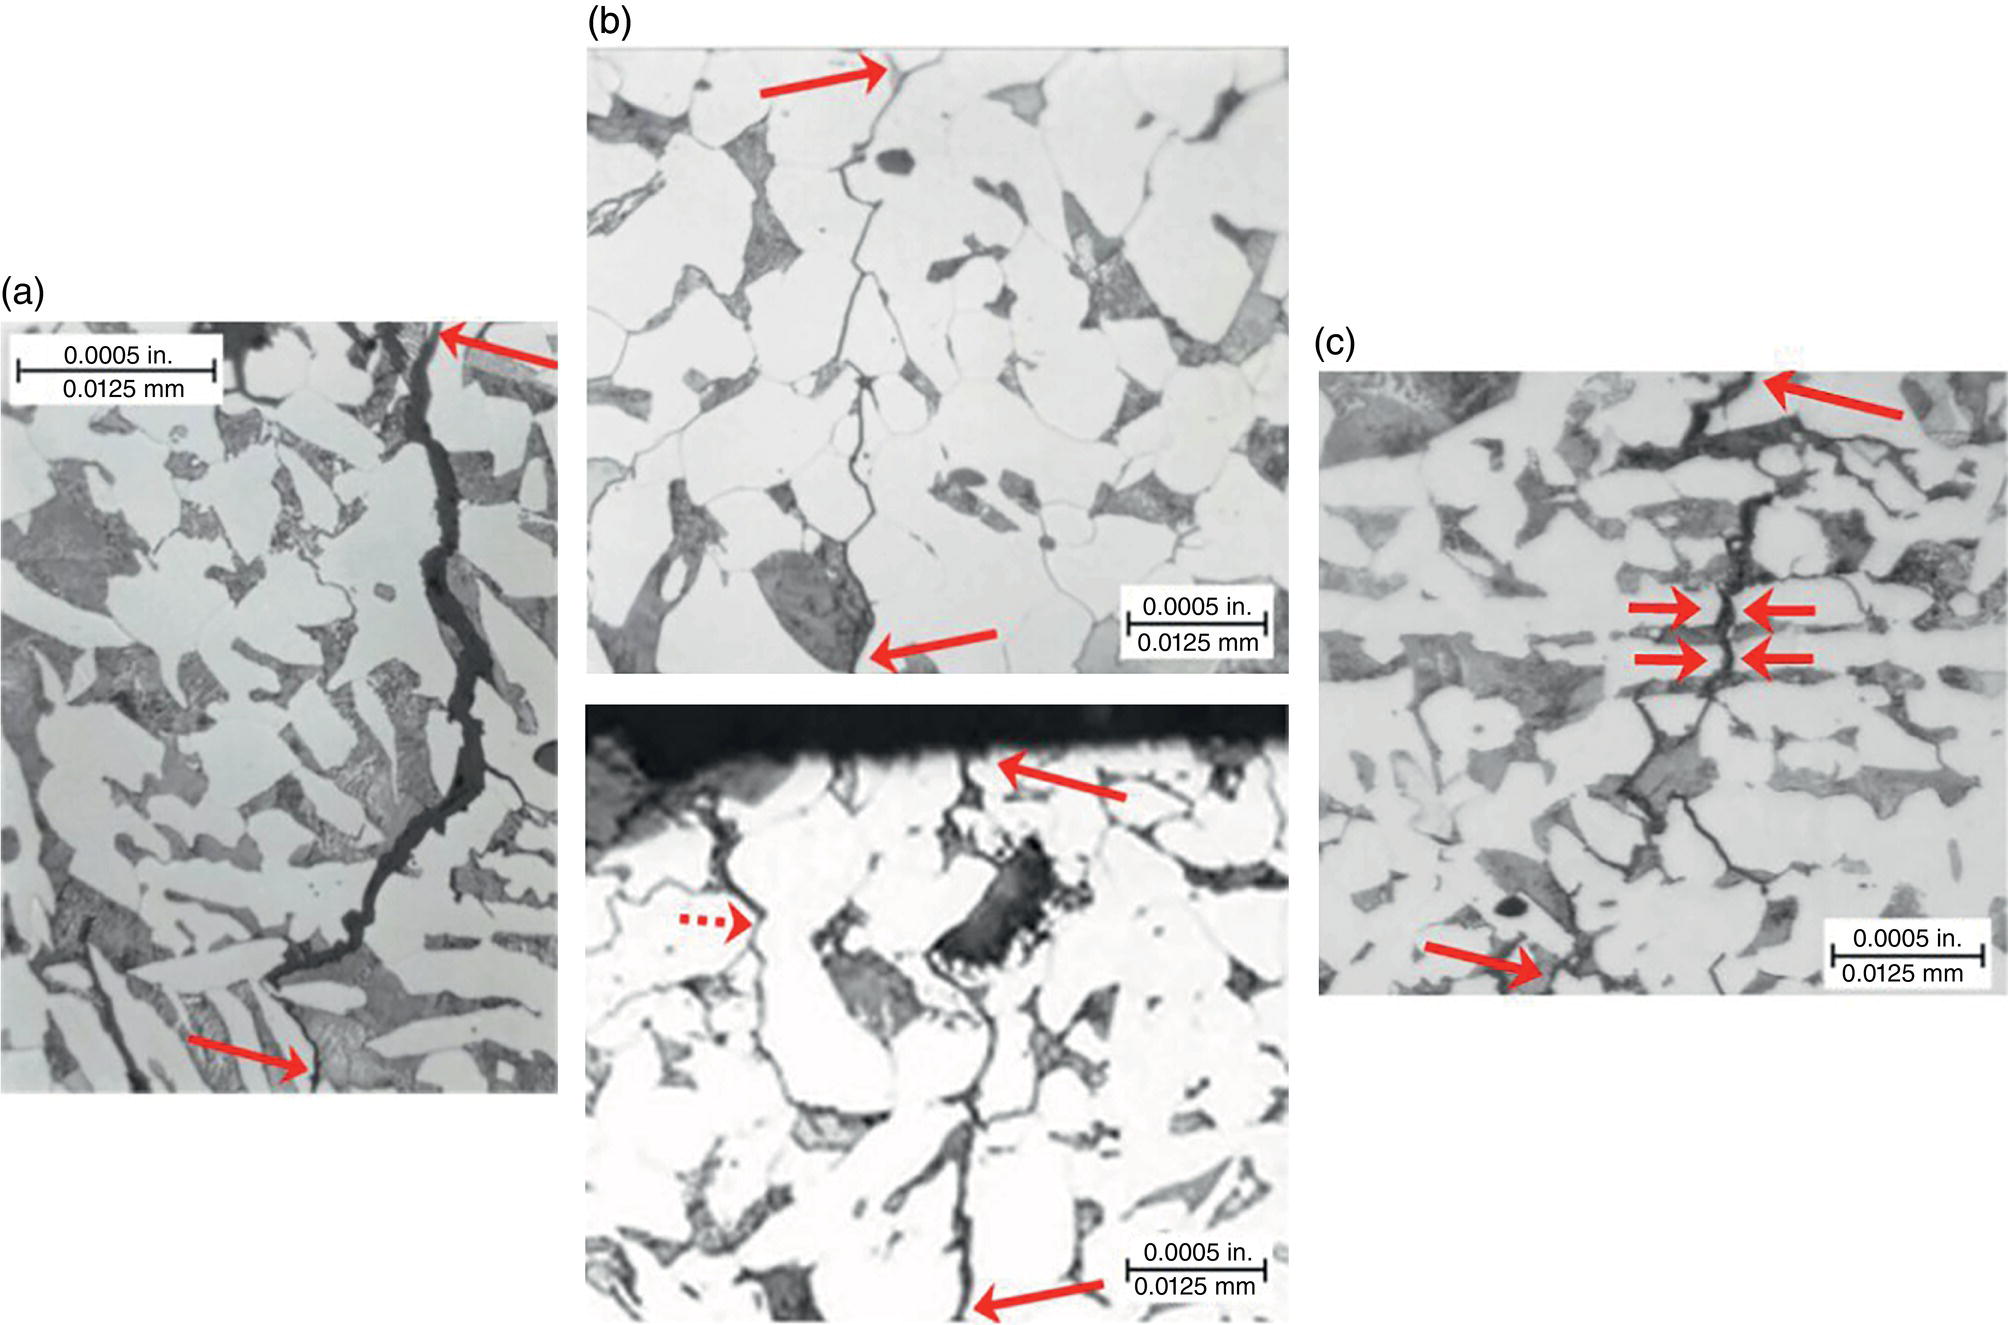
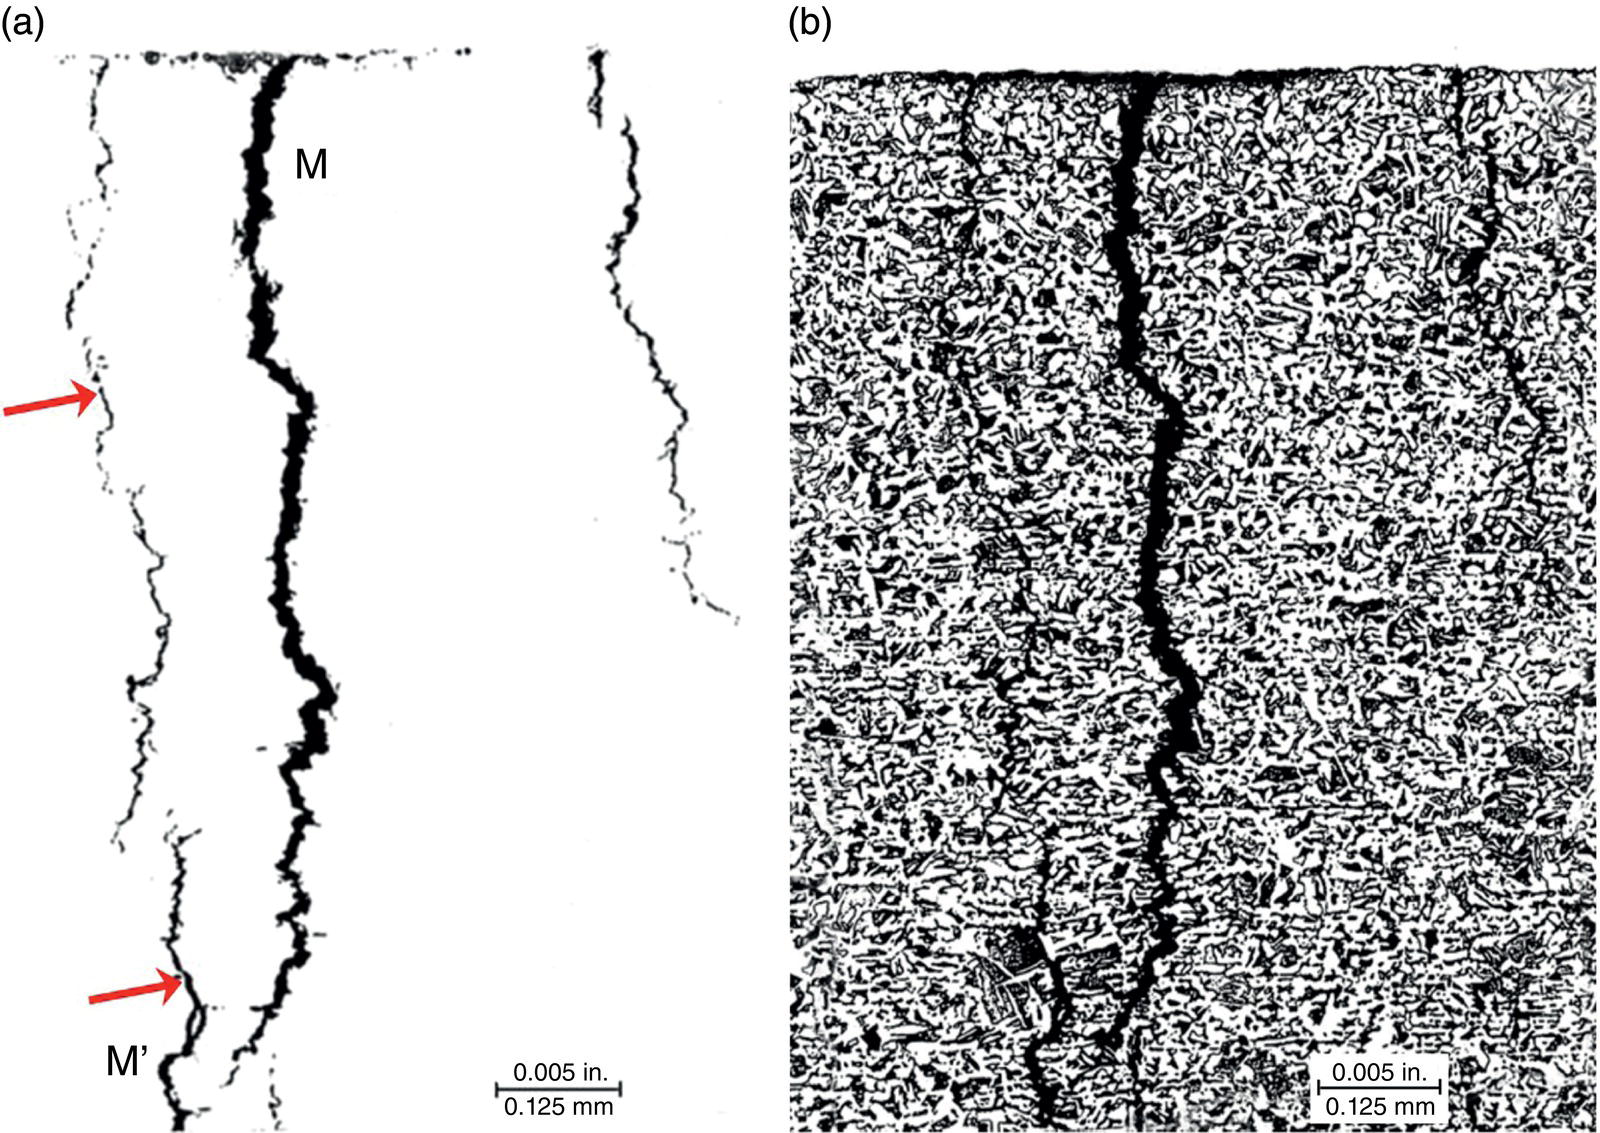
54.3.4.5 Multiple Local Cracking Paths—Crack Branching and Bifurcation
54.3.4.6 High-pH SCC
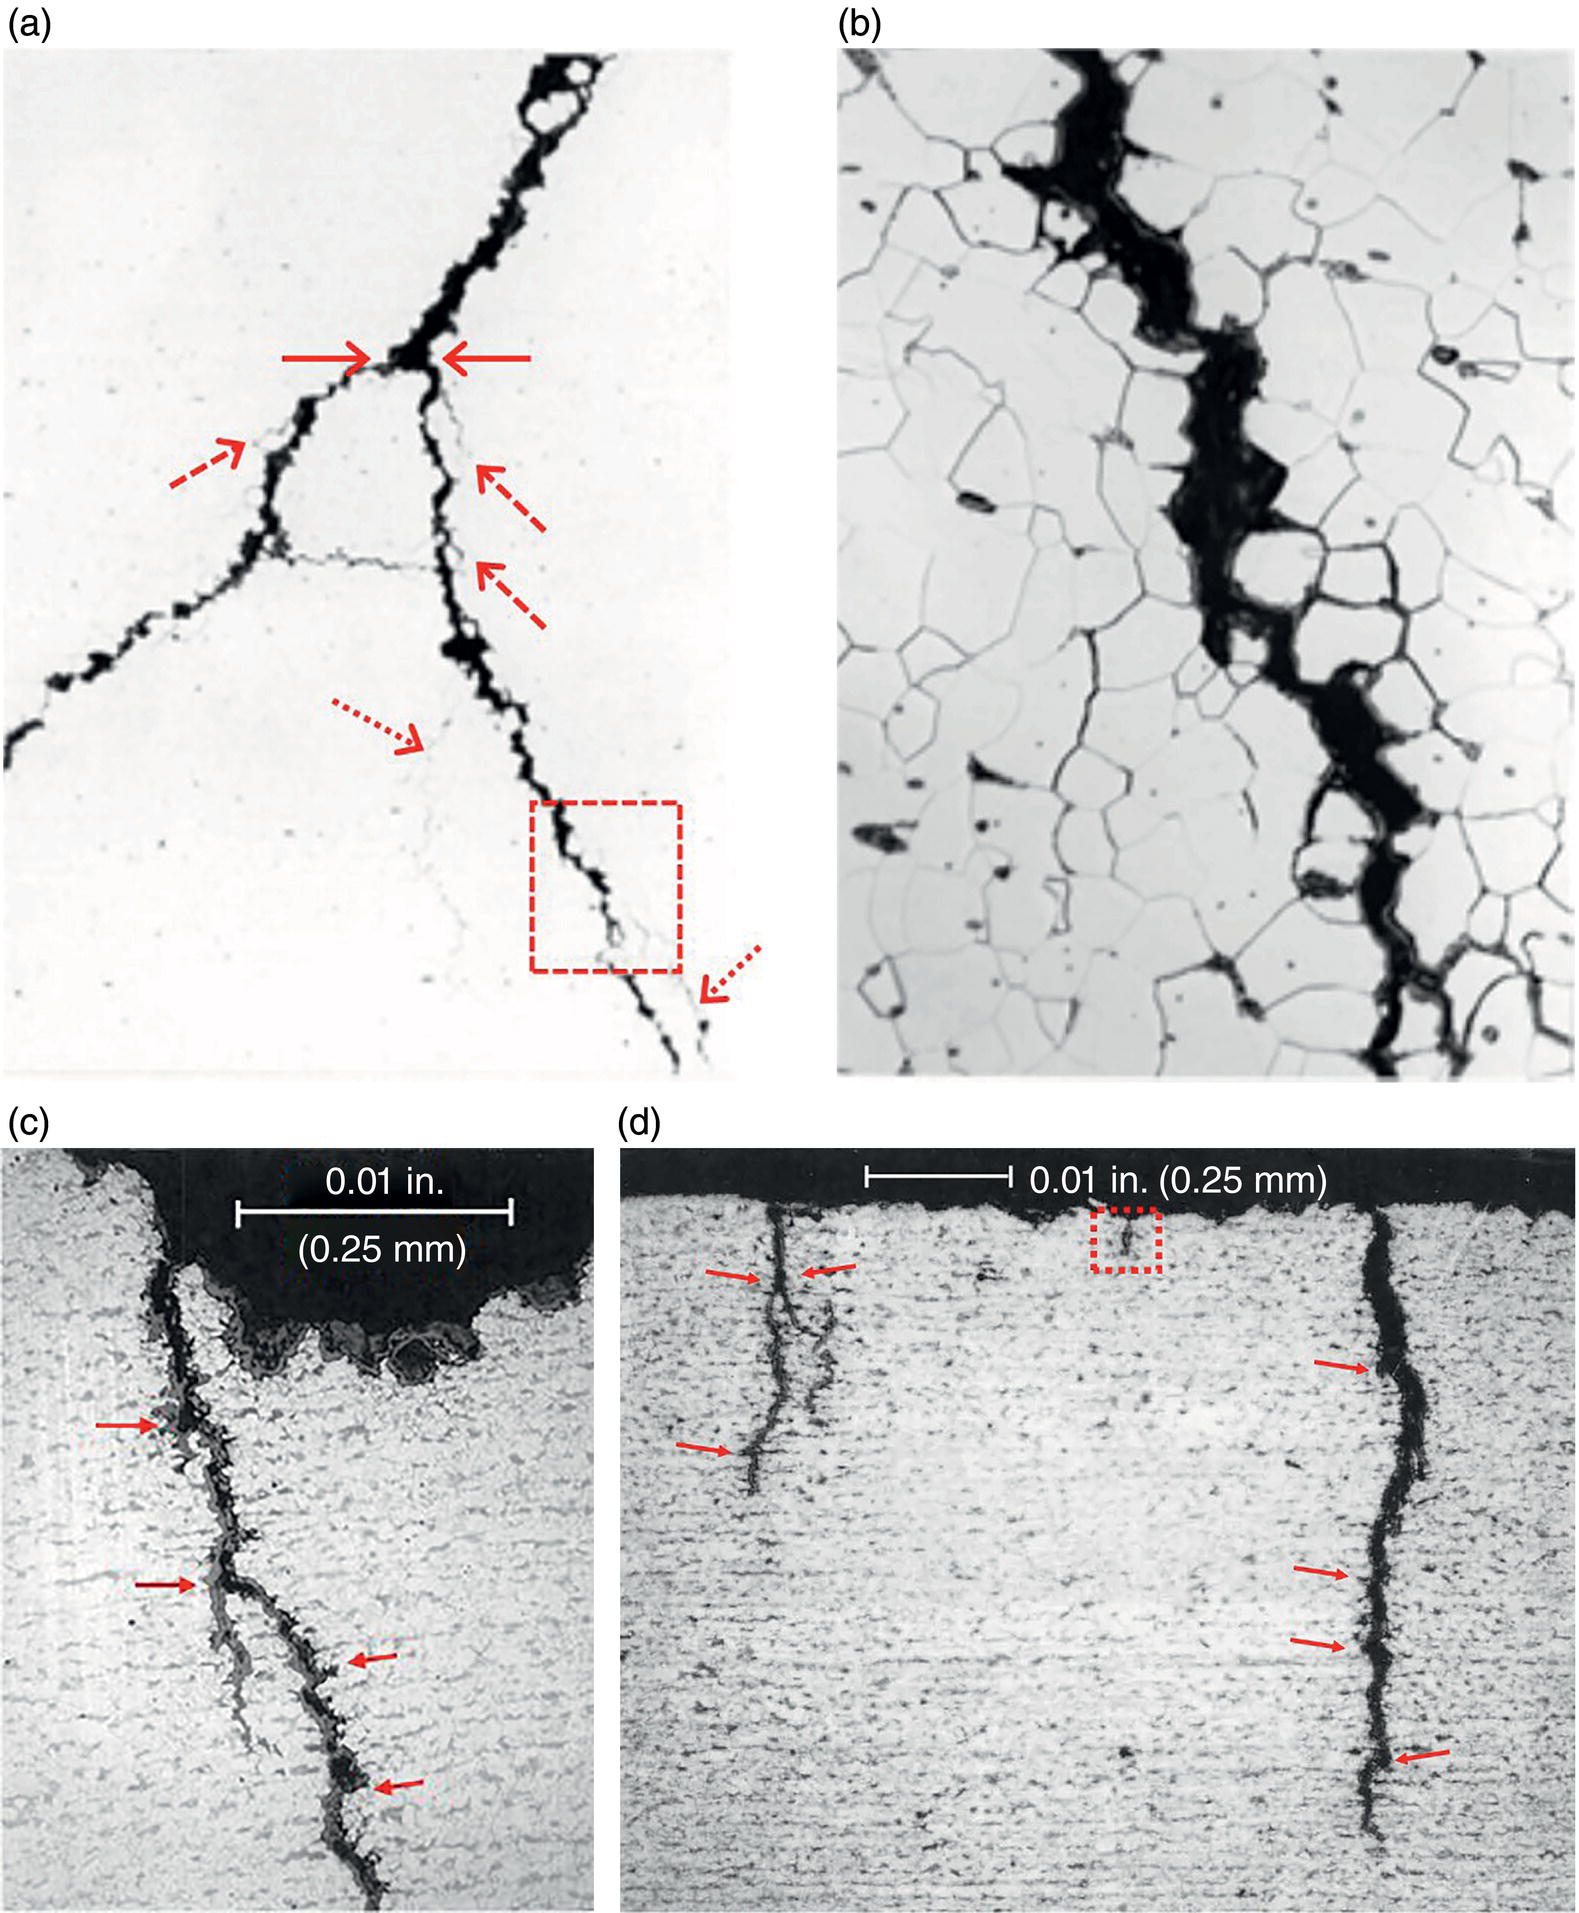
54.3.4.7 NN-pH SCC
54.3.4.8 The Merits of SEM Imaging and Implications of Coexistent IG-TG Cracking
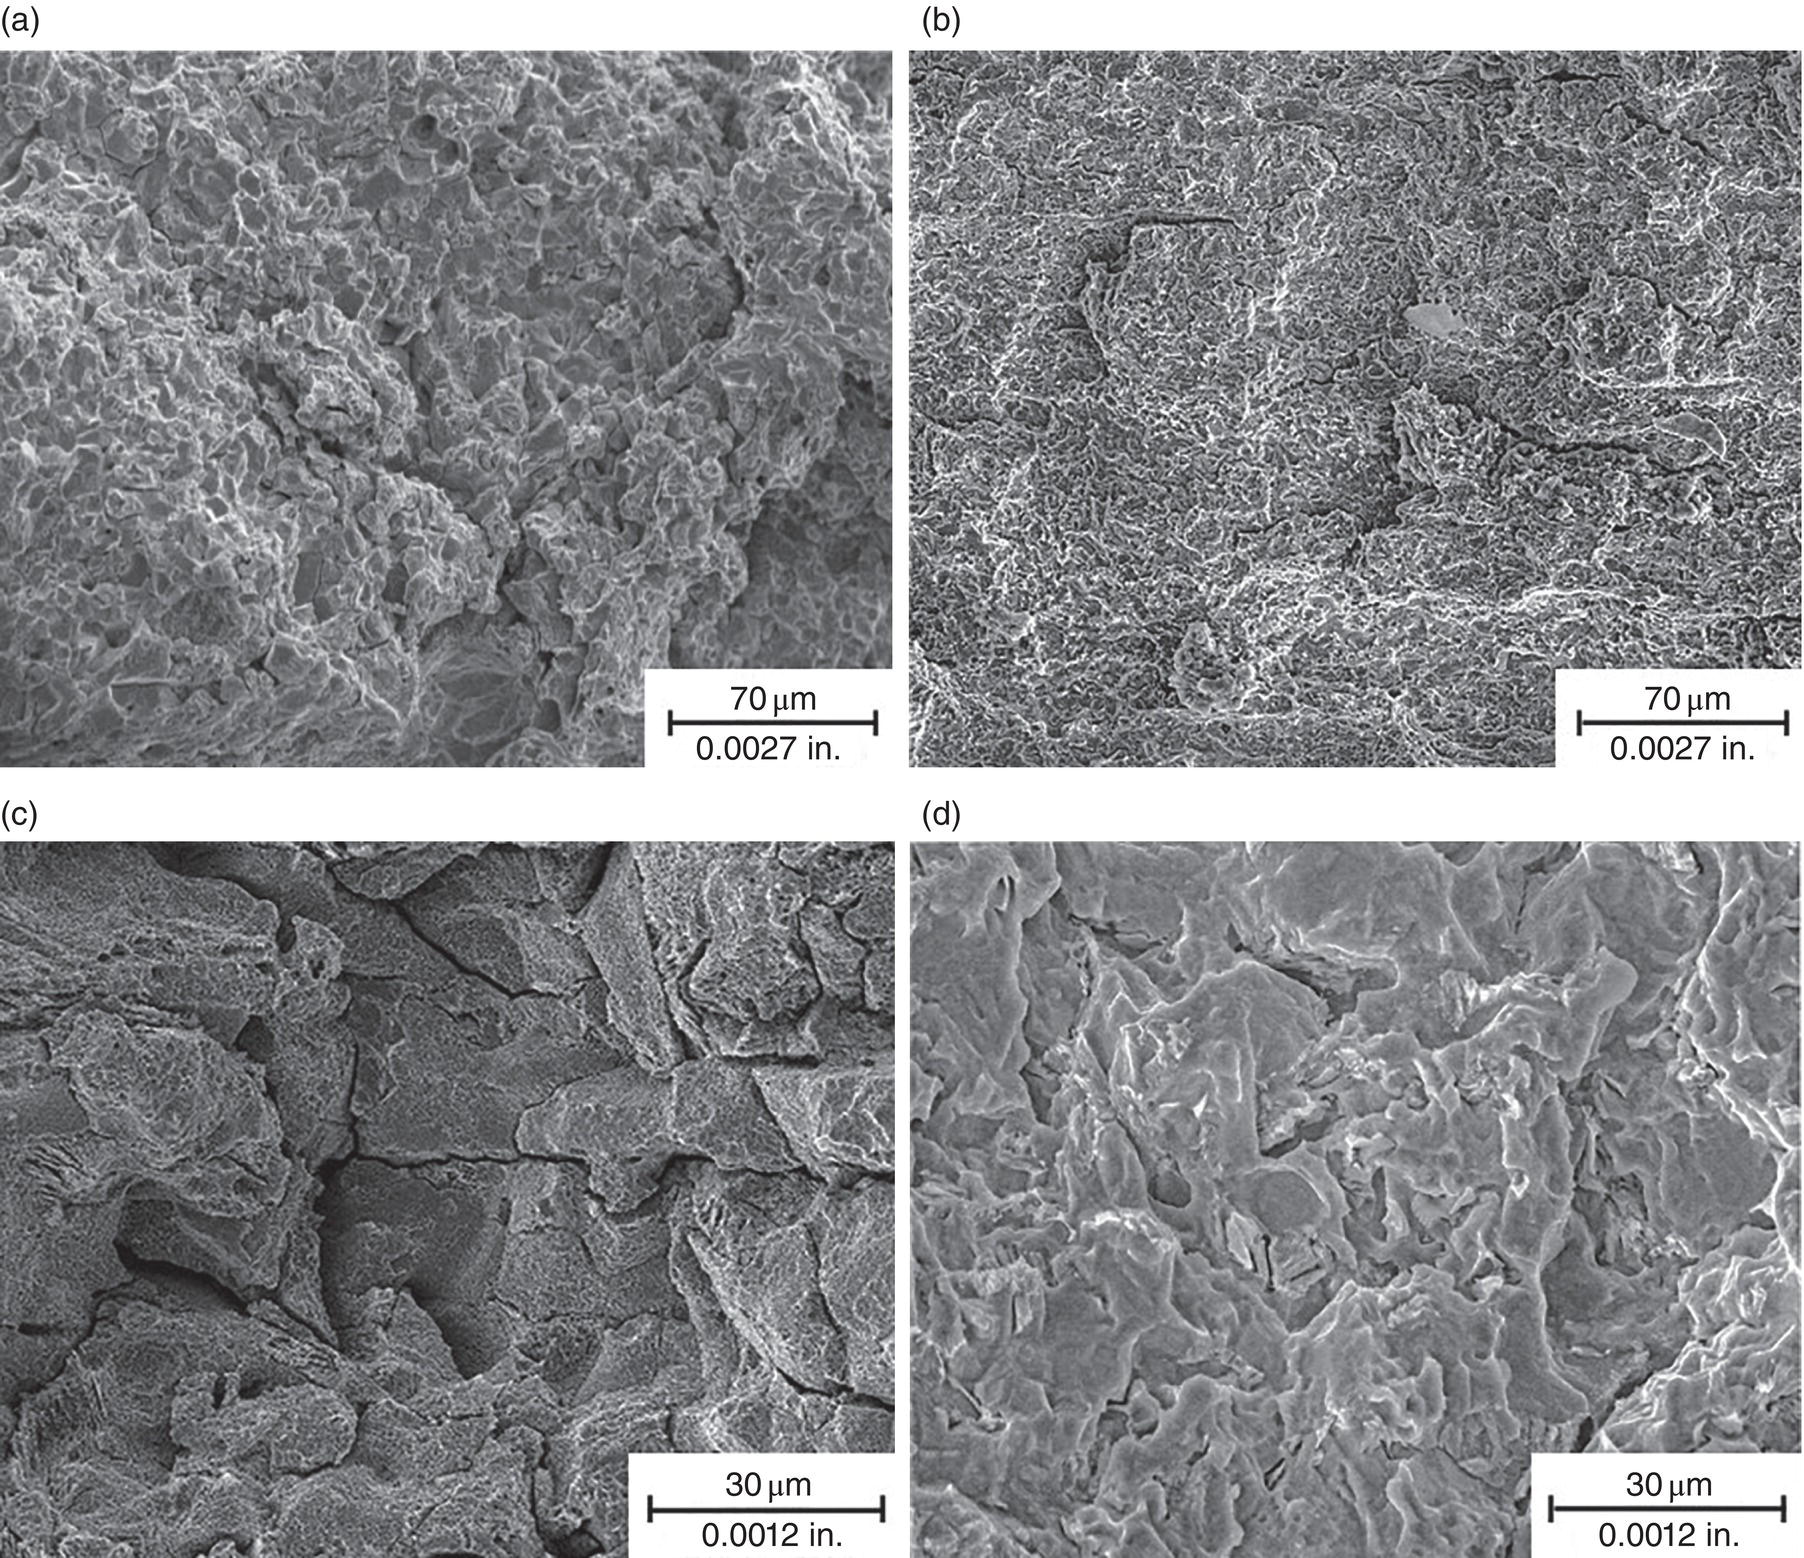
54.3.4.9 Observations and Practical Takeaways
54.4 Crack Initiation and Growth Behavior on Pipelines
54.4.1 Insights into the Initiation and Early Growth Processes
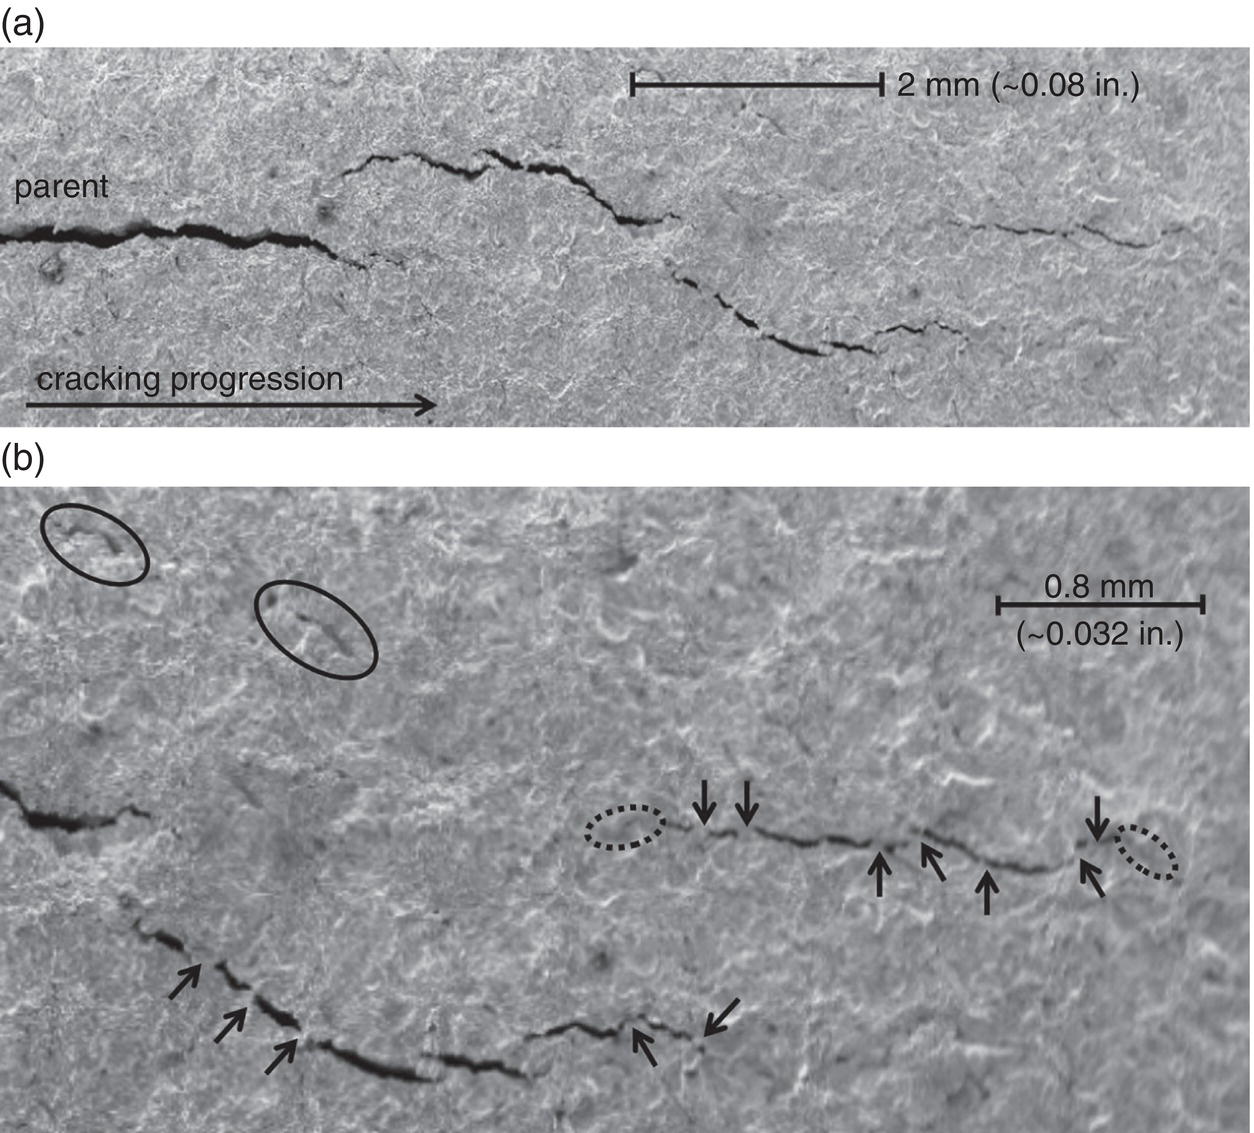
54.4.1.1 Observations and Insights as the Crack Size Increases
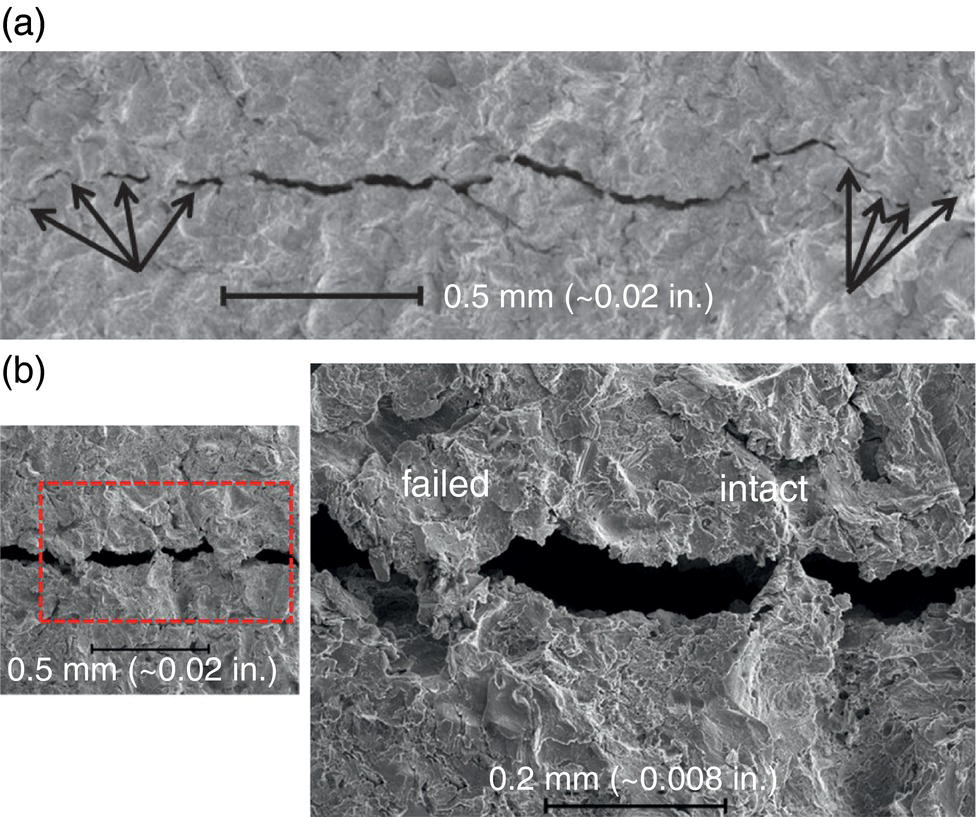
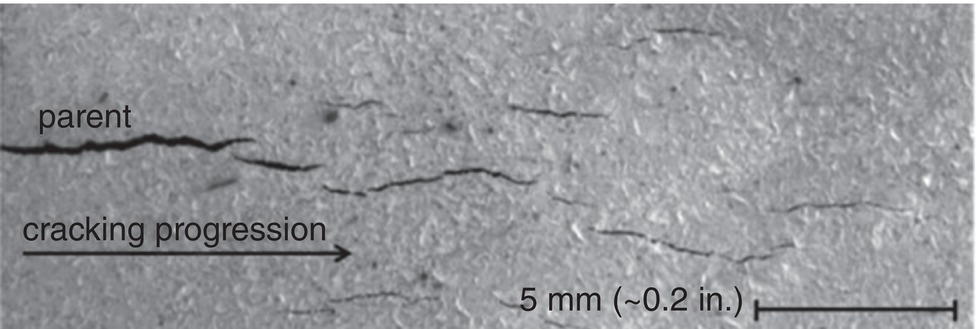
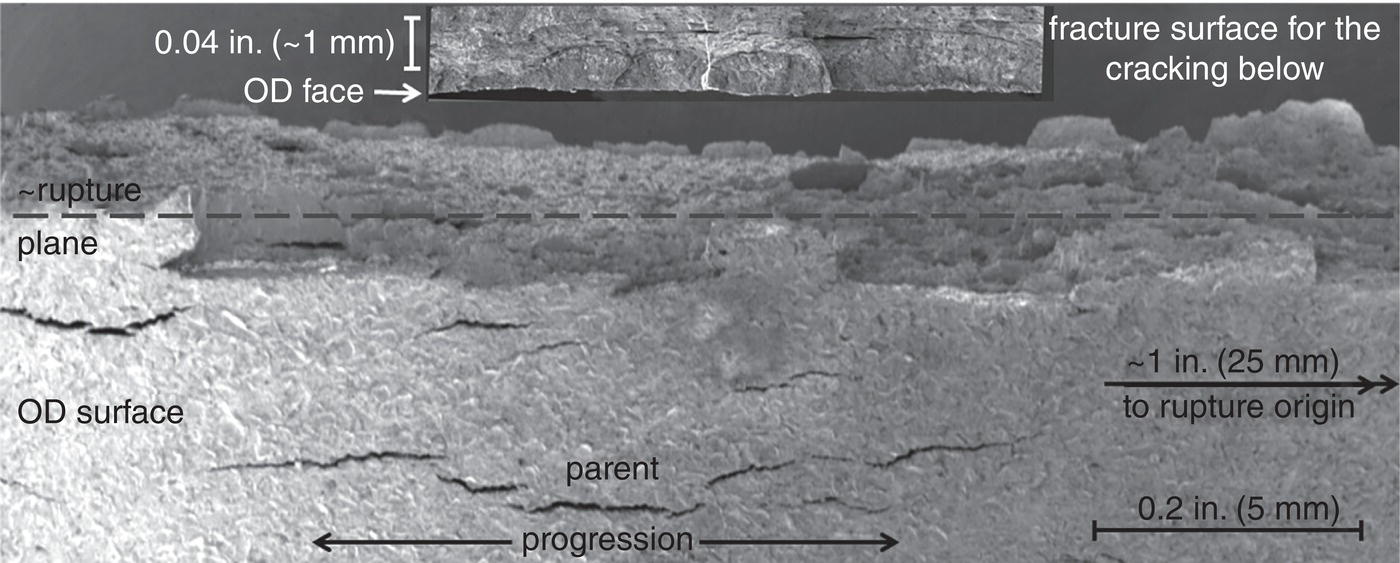
54.4.1.2 Free-Surface Effects Give Way to Fracture Mechanics Control

54.4.2 Crack Growth into the Pipe Wall
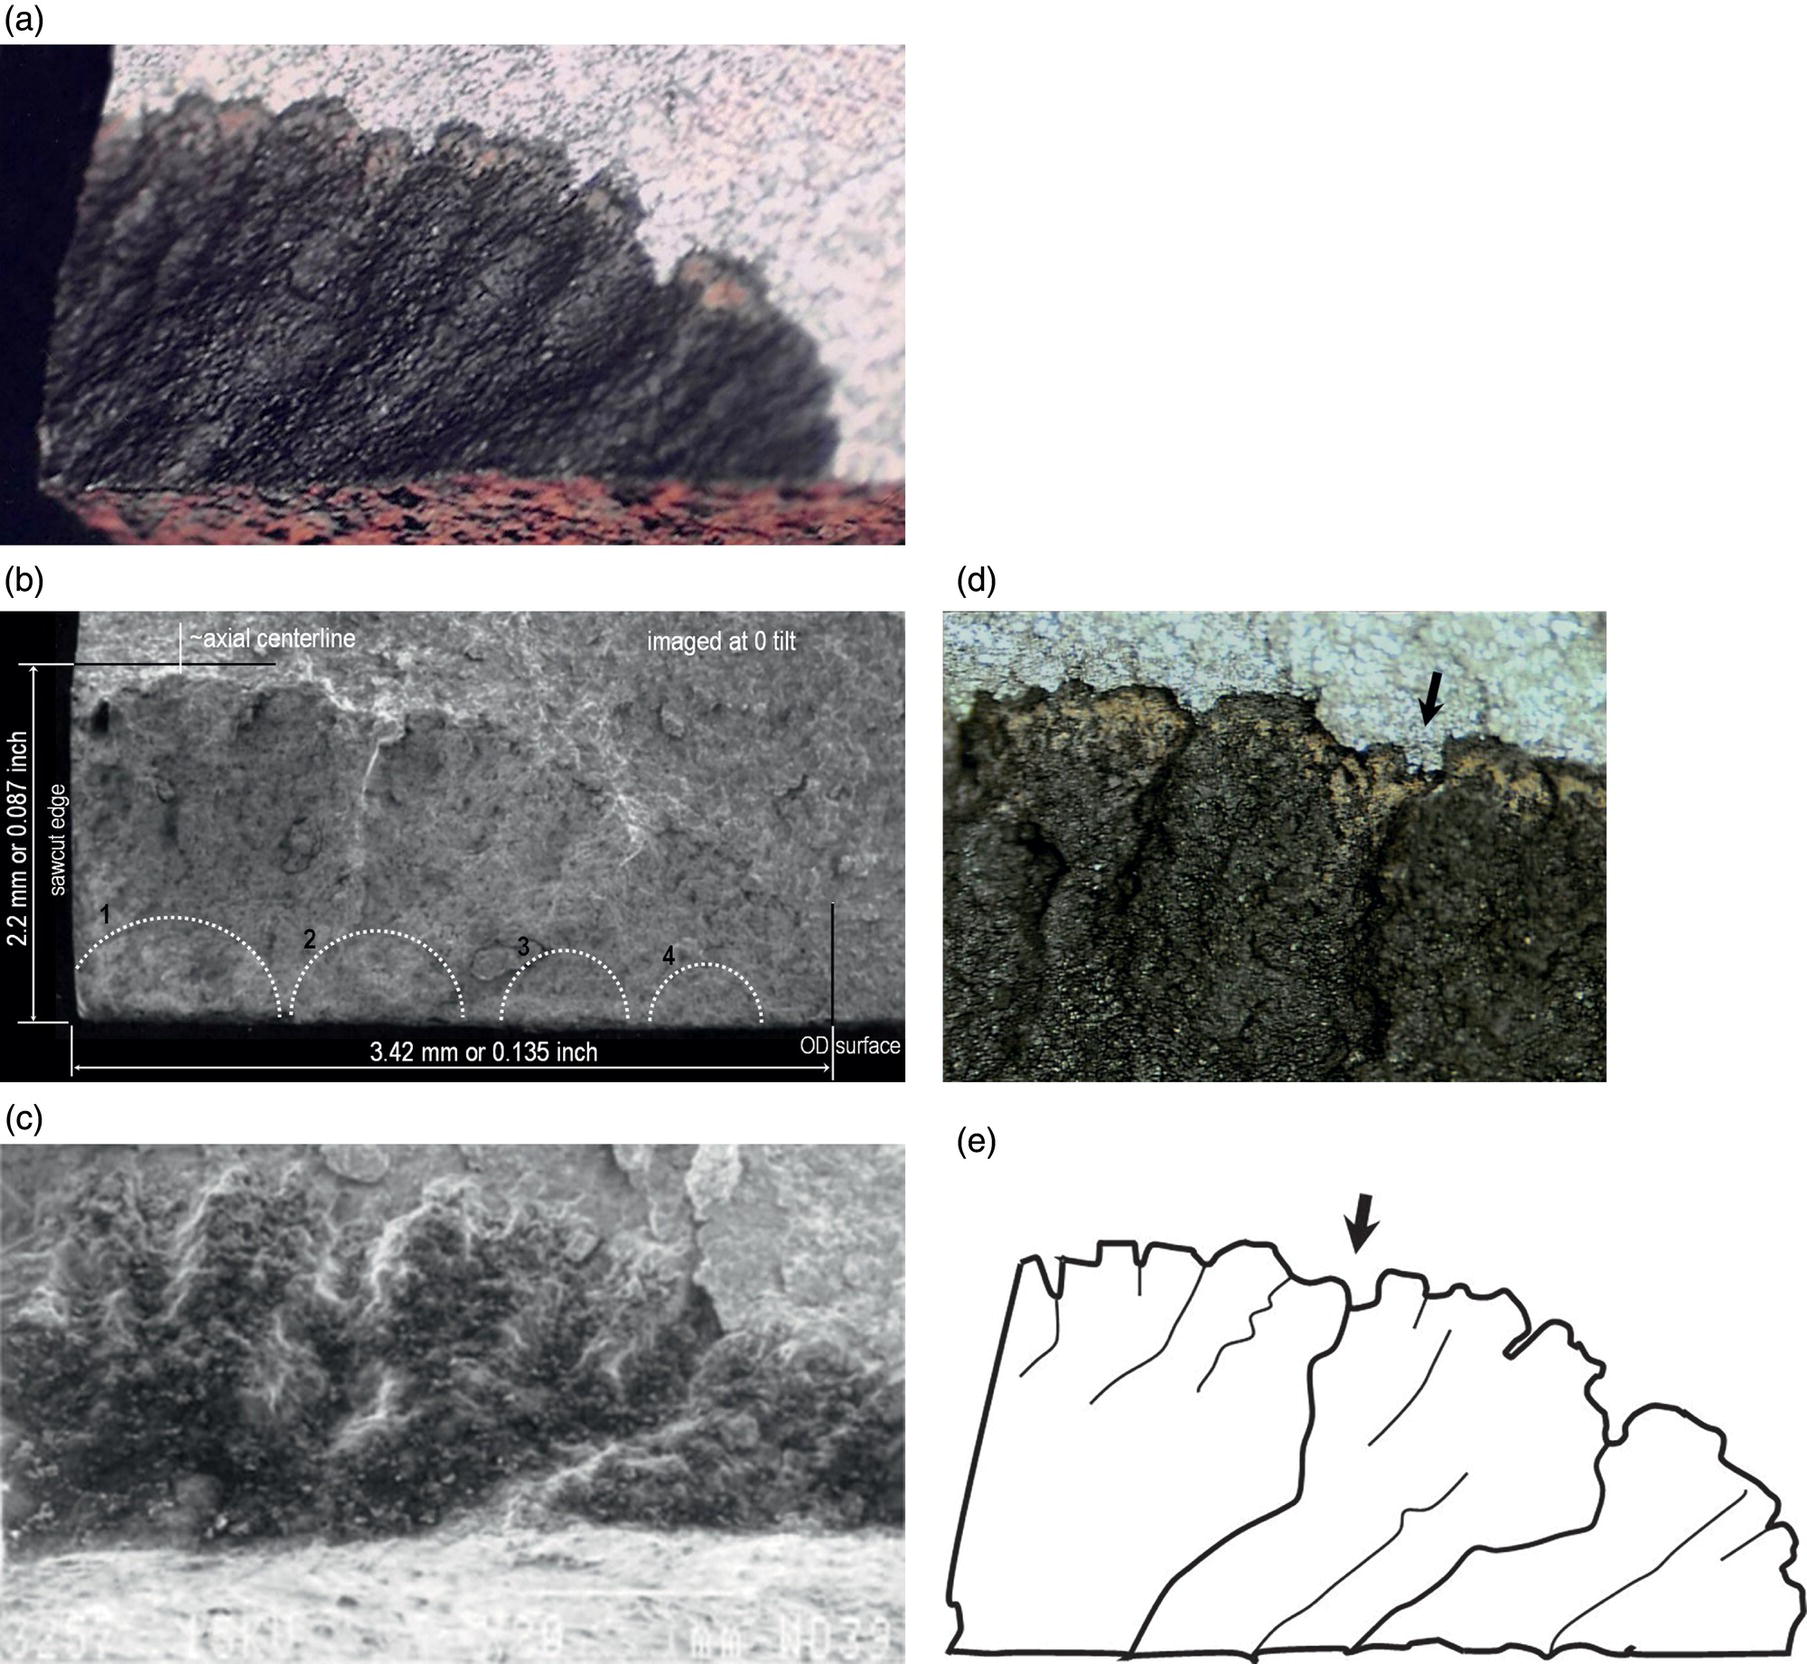
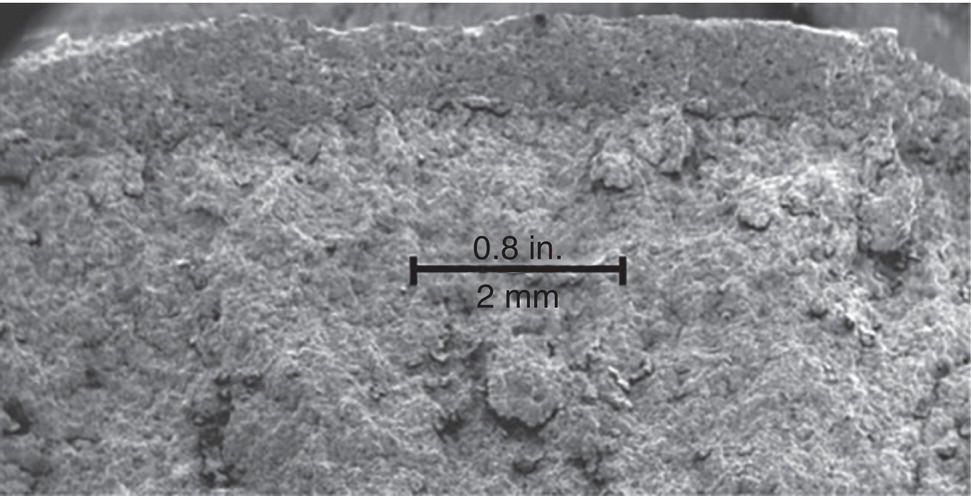
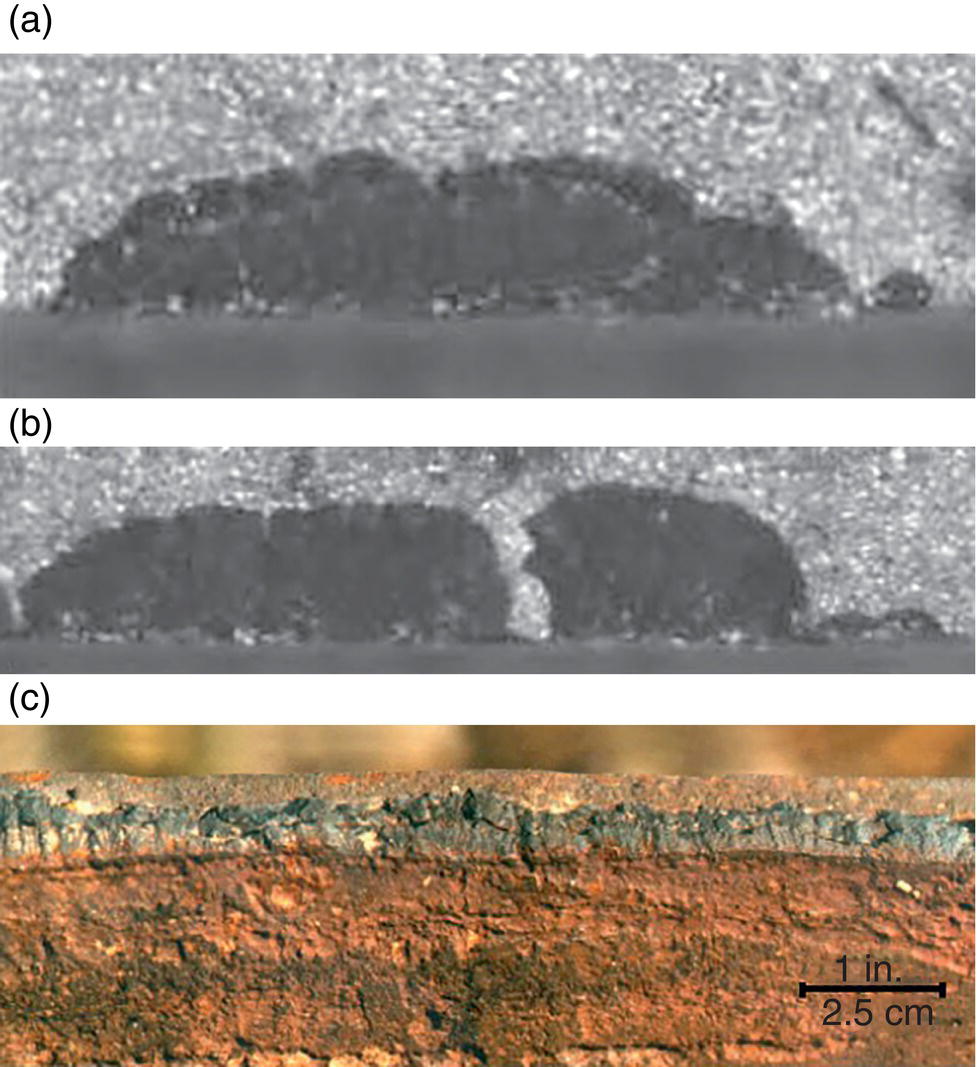
54.4.2.1 Observations and Practical Takeaways
54.4.3 Trending the Phenomenology of Field Cracking
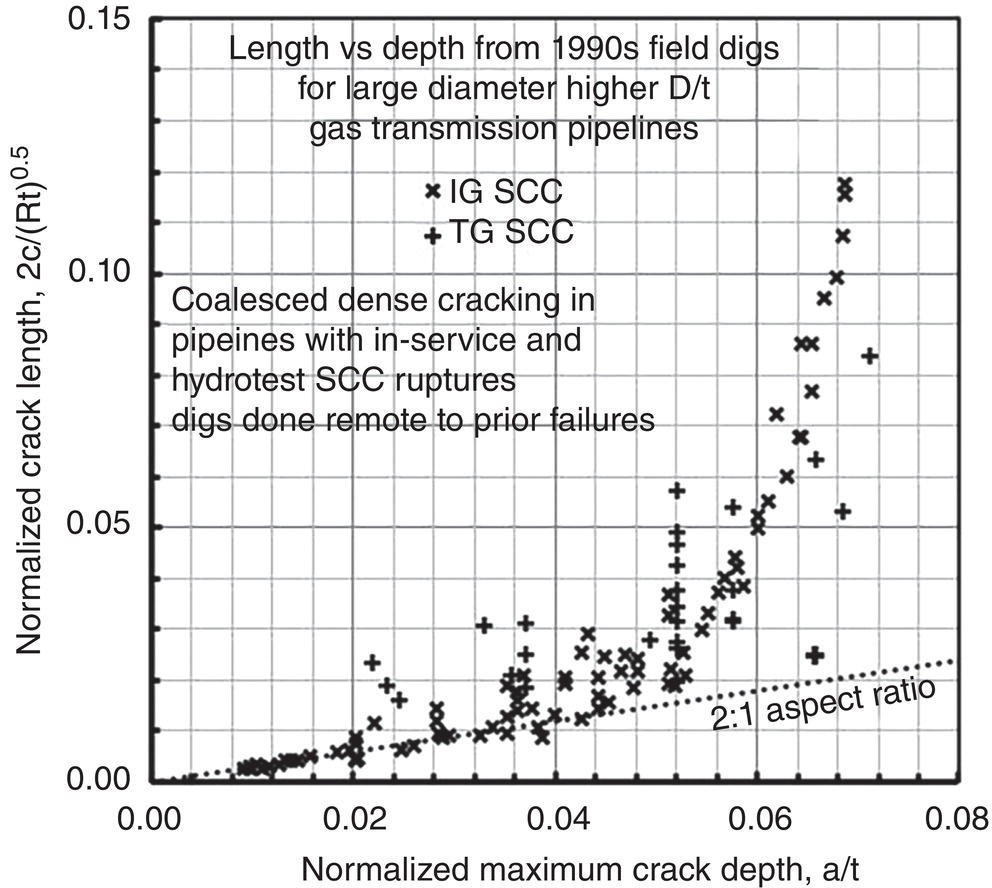
54.4.3.1 Trends in Crack Response from Nucleation Through Failing Sizes

54.4.4 Closure Between Field Phenomenology and Laboratory-Based Modeling
54.4.4.1 Observations and Practical Takeaways
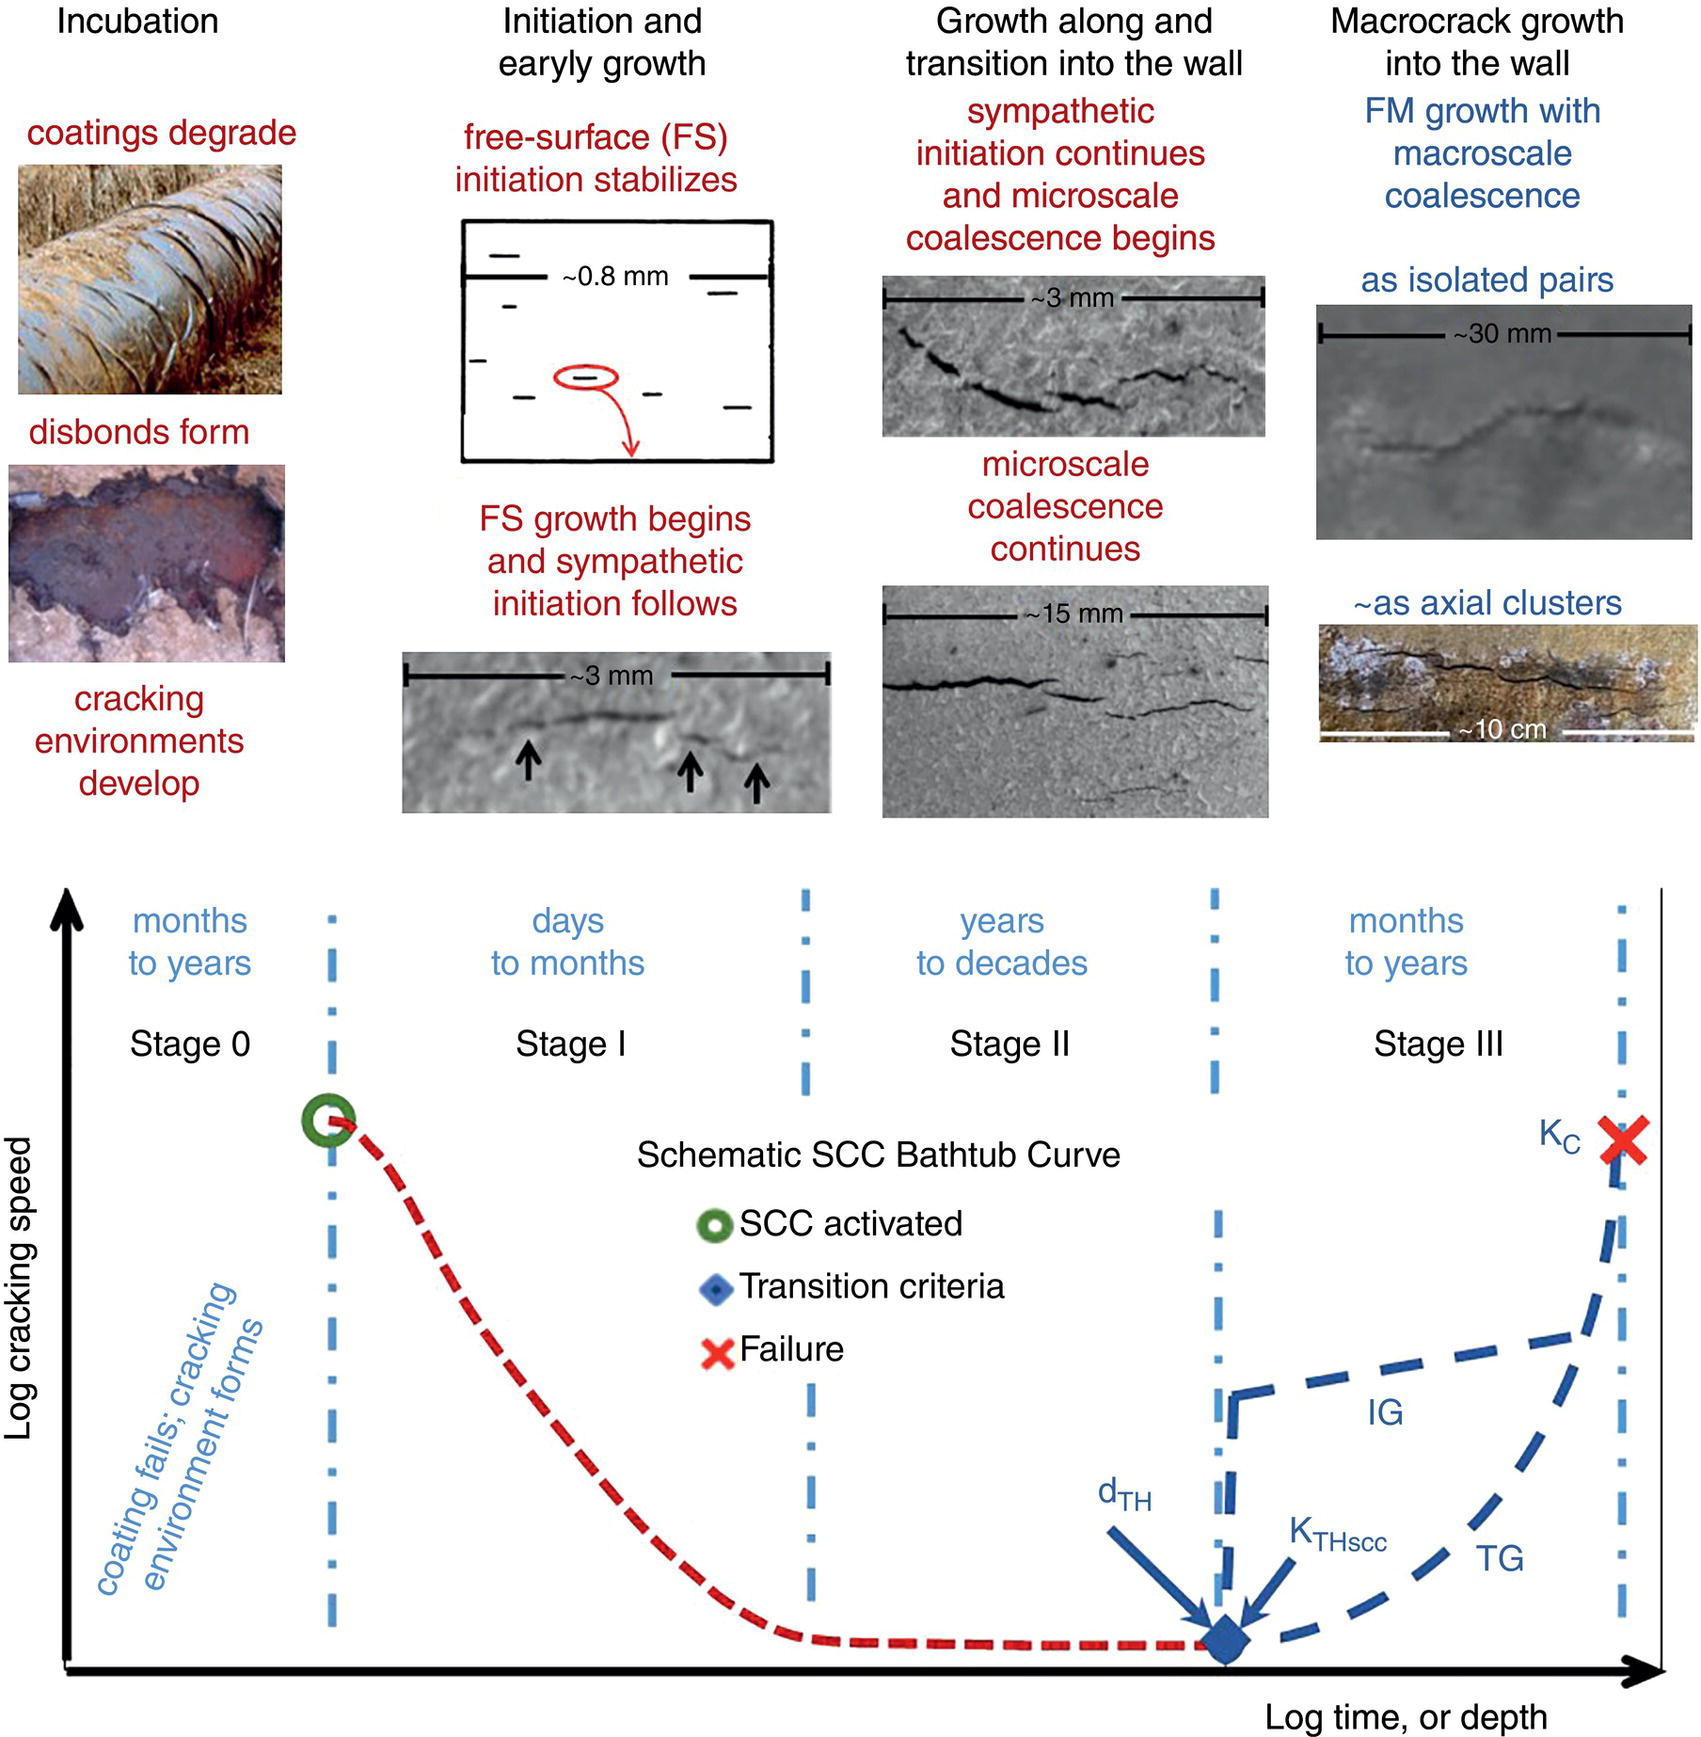
54.4.5 Effects of Crack Blunting—Implications for Hydrotesting and Dormancy
54.4.5.1 Blunted Crack Tips and Cracking in Ductile Line-Pipe Steels
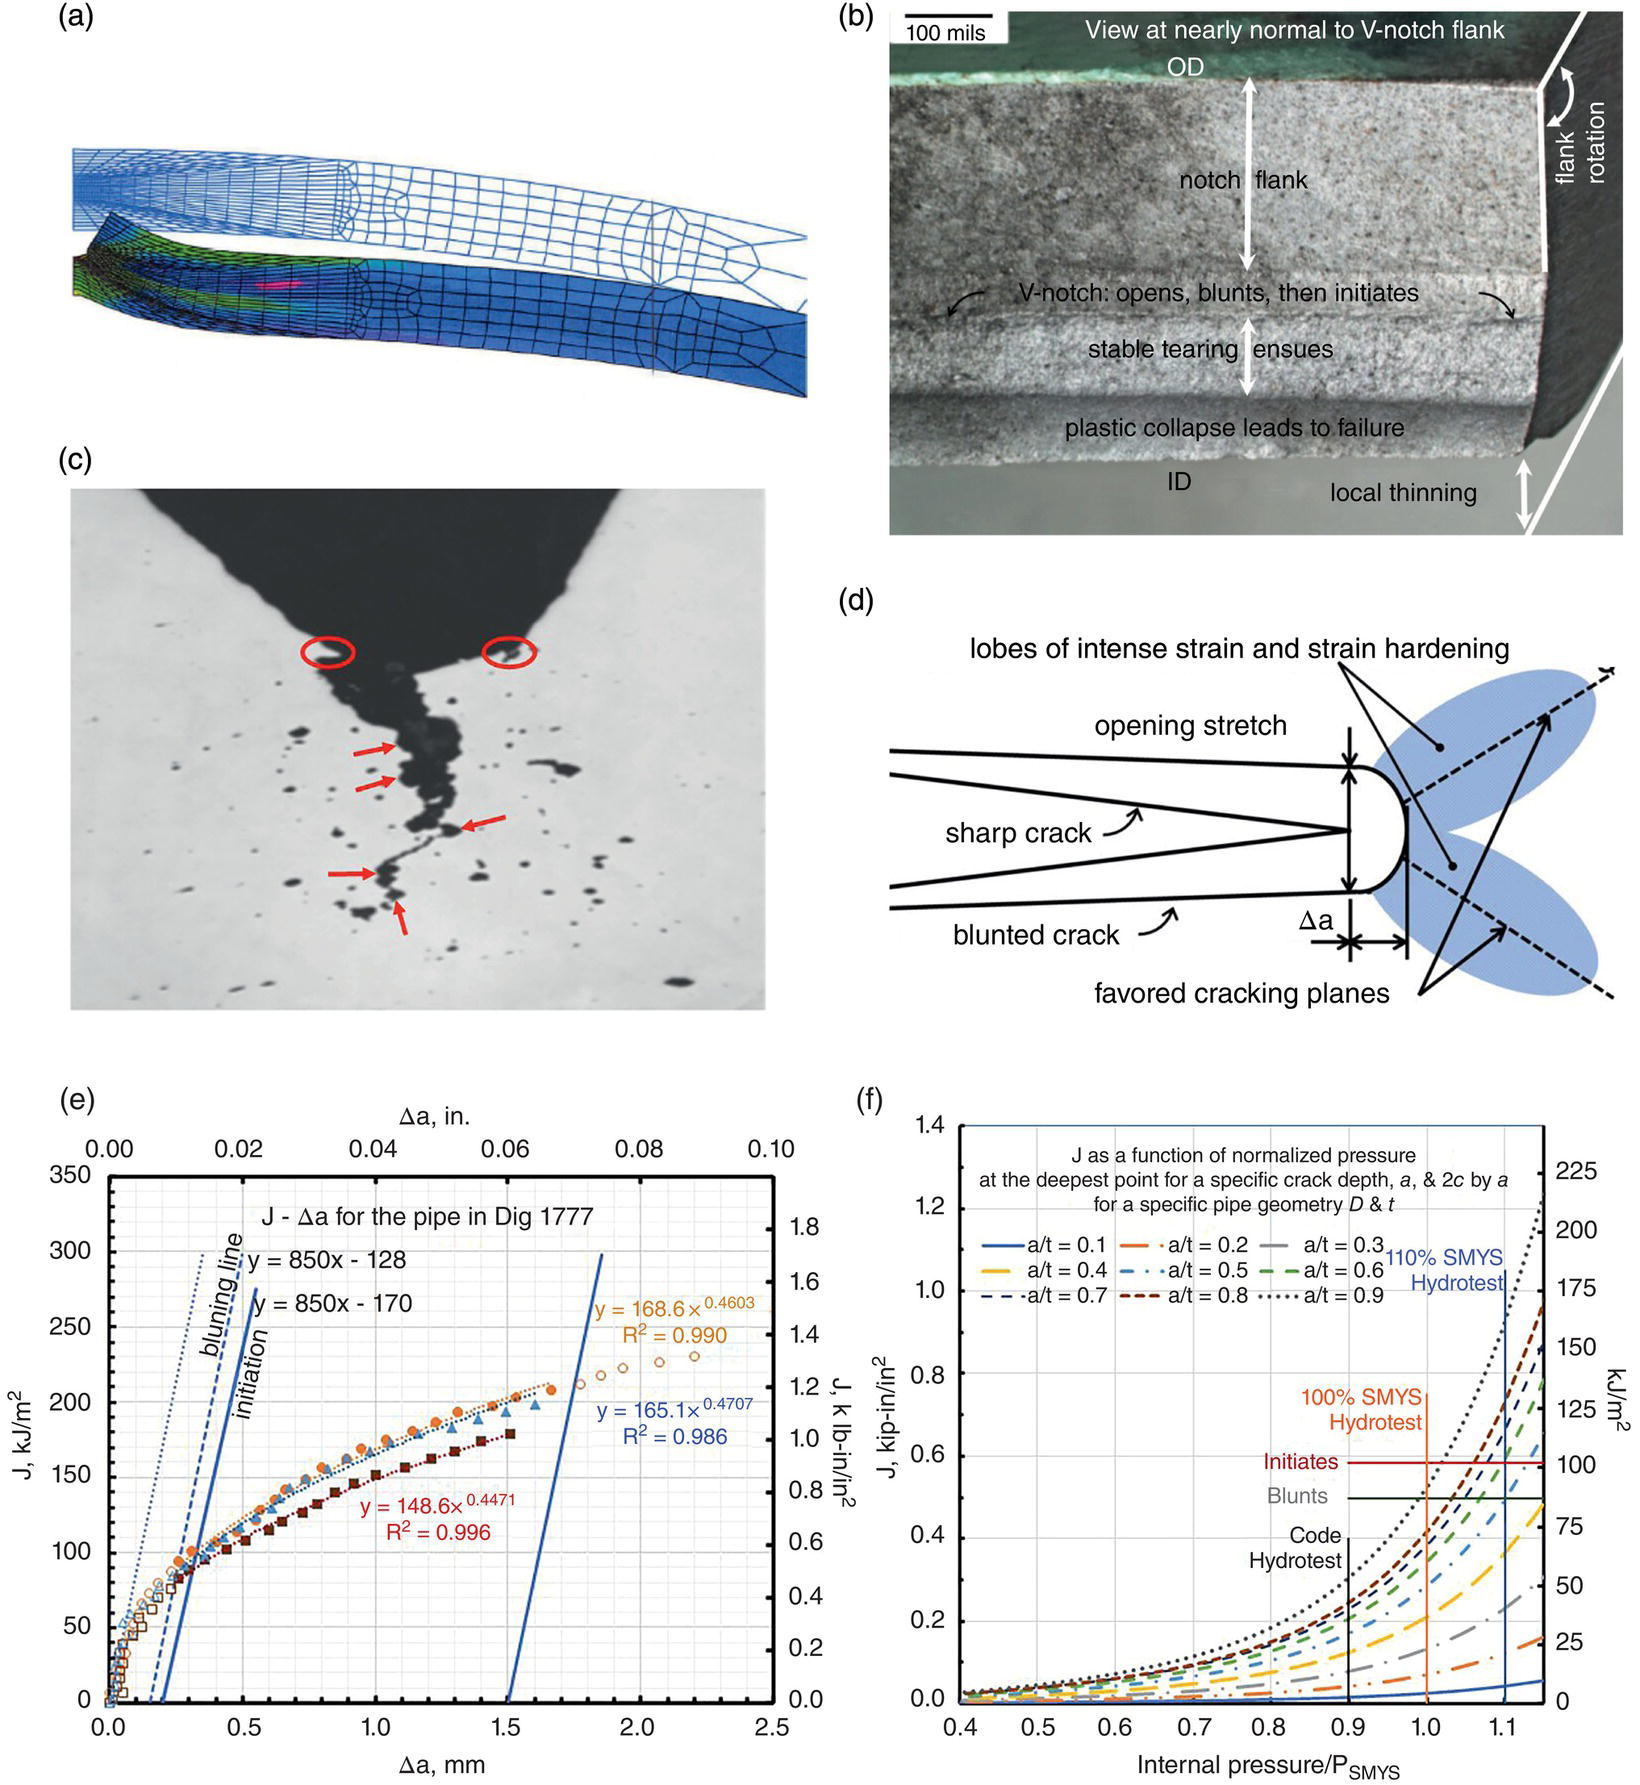
54.4.5.2 Response at a Crack Tip Over the Course of a Hydrotest
54.4.5.3 Hydrotesting to Expose Near-Critical Cracking
54.4.5.4 Hydrotests to Manage SCC: They Are More Complex Than Exposing Near-Critical Cracks
54.4.5.5 Illustrations of the Potential Outcomes of Hydrotesting to Control SCC
54.4.5.6 No Effect: Unresponsive Cracking—Outcome I, Coupled with Outcomes III and IV
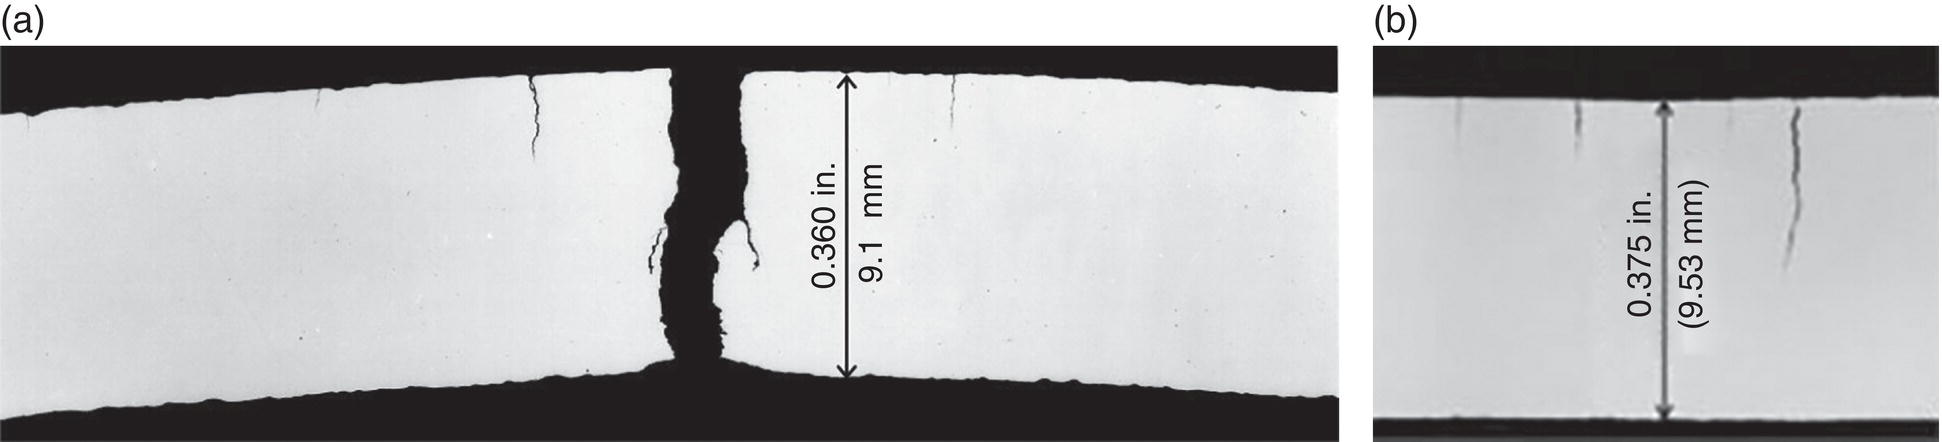
54.4.5.7 Cracking That Blunts, Initiates, and Grows, with Little Effect on SCC—Outcome III
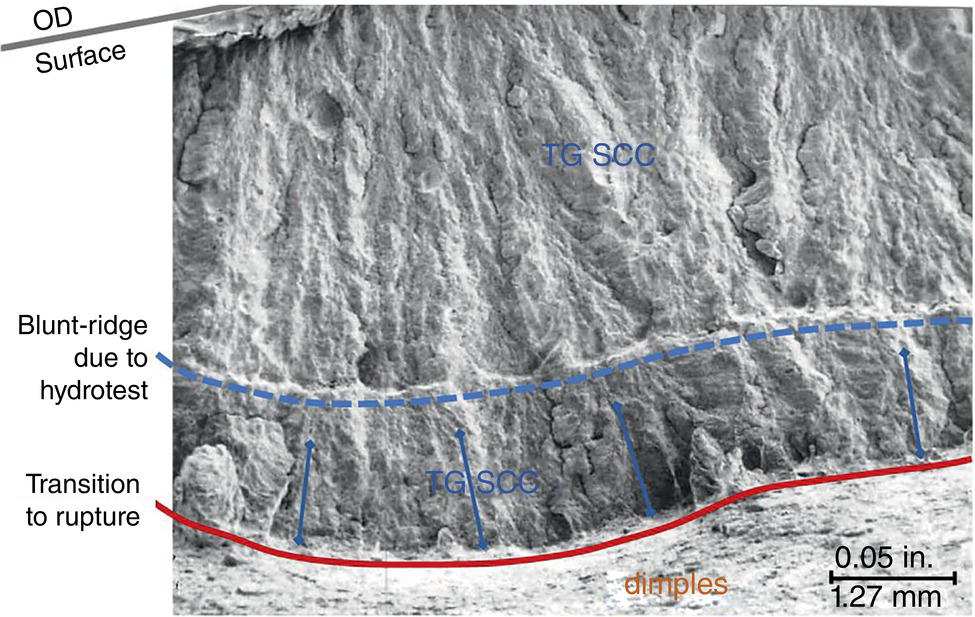
54.4.5.8 Cracking Blunts, Initiates, and Grows to Rupture During the Test—Outcome IV
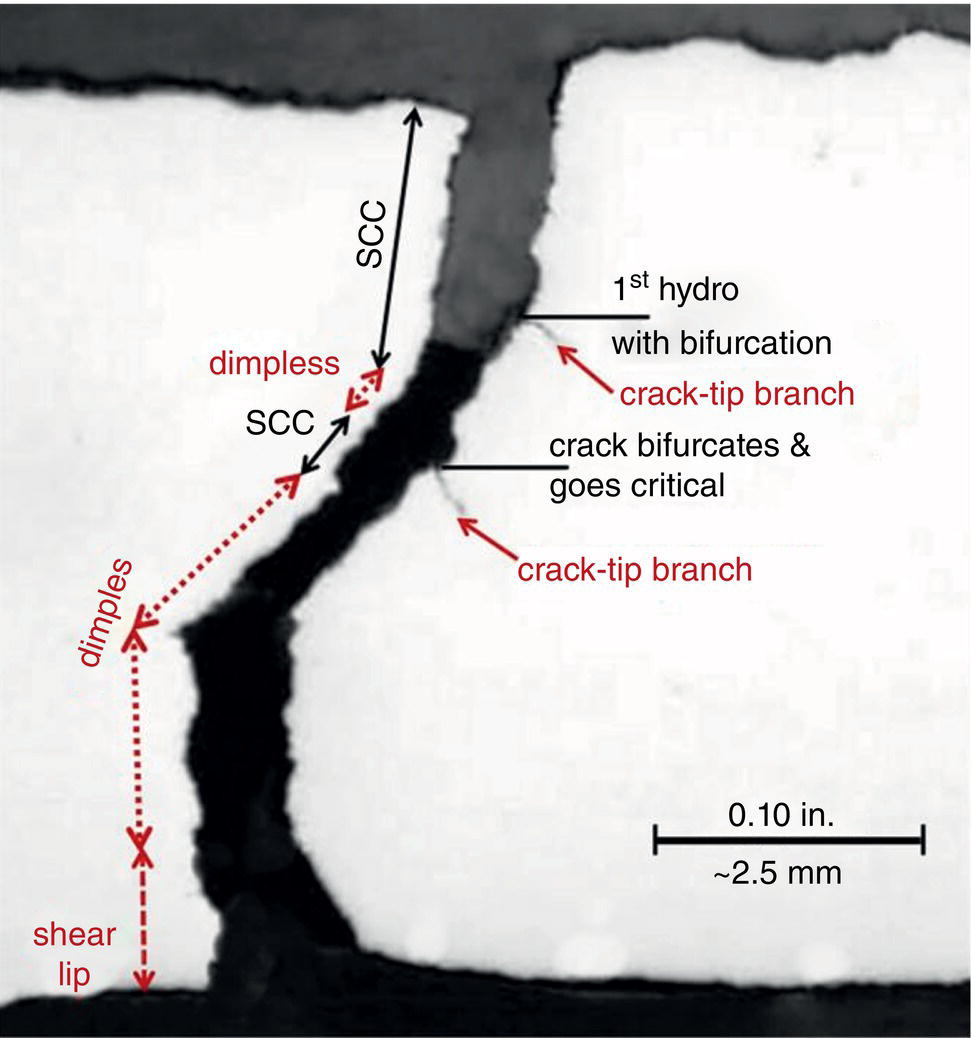
54.4.5.9 Observations and Takeaways
54.4.6 Blunting and Other Effects That Trace to Localized Corrosion
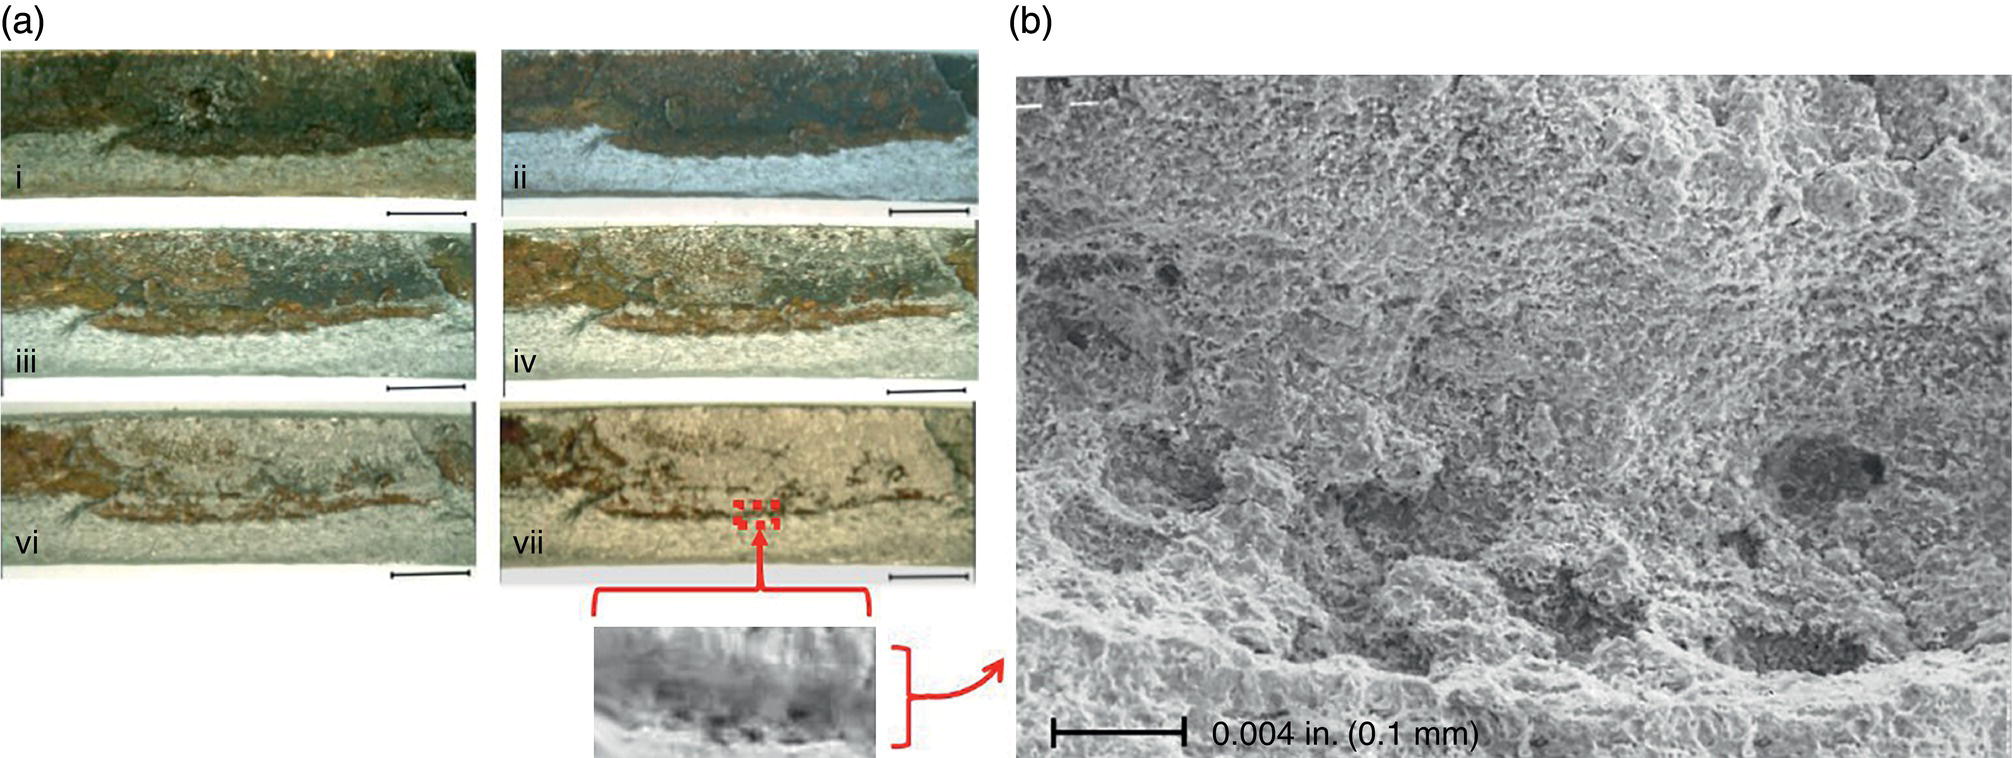
54.4.6.1 Corrosion-Induced Blunting
54.4.6.2 Corrosion Acting Counter to Mechanically Induced Blunting
54.4.6.3 Other Potential Effects of Down-Crack Corrosion
54.4.7 Dormancy and Intermittent Growth
54.4.7.1 Role of Crack-Tip Blunting in Dormancy and Intermittent Growth
54.4.7.2 Role of Microstructural Barriers in Dormancy and Intermittent Growth
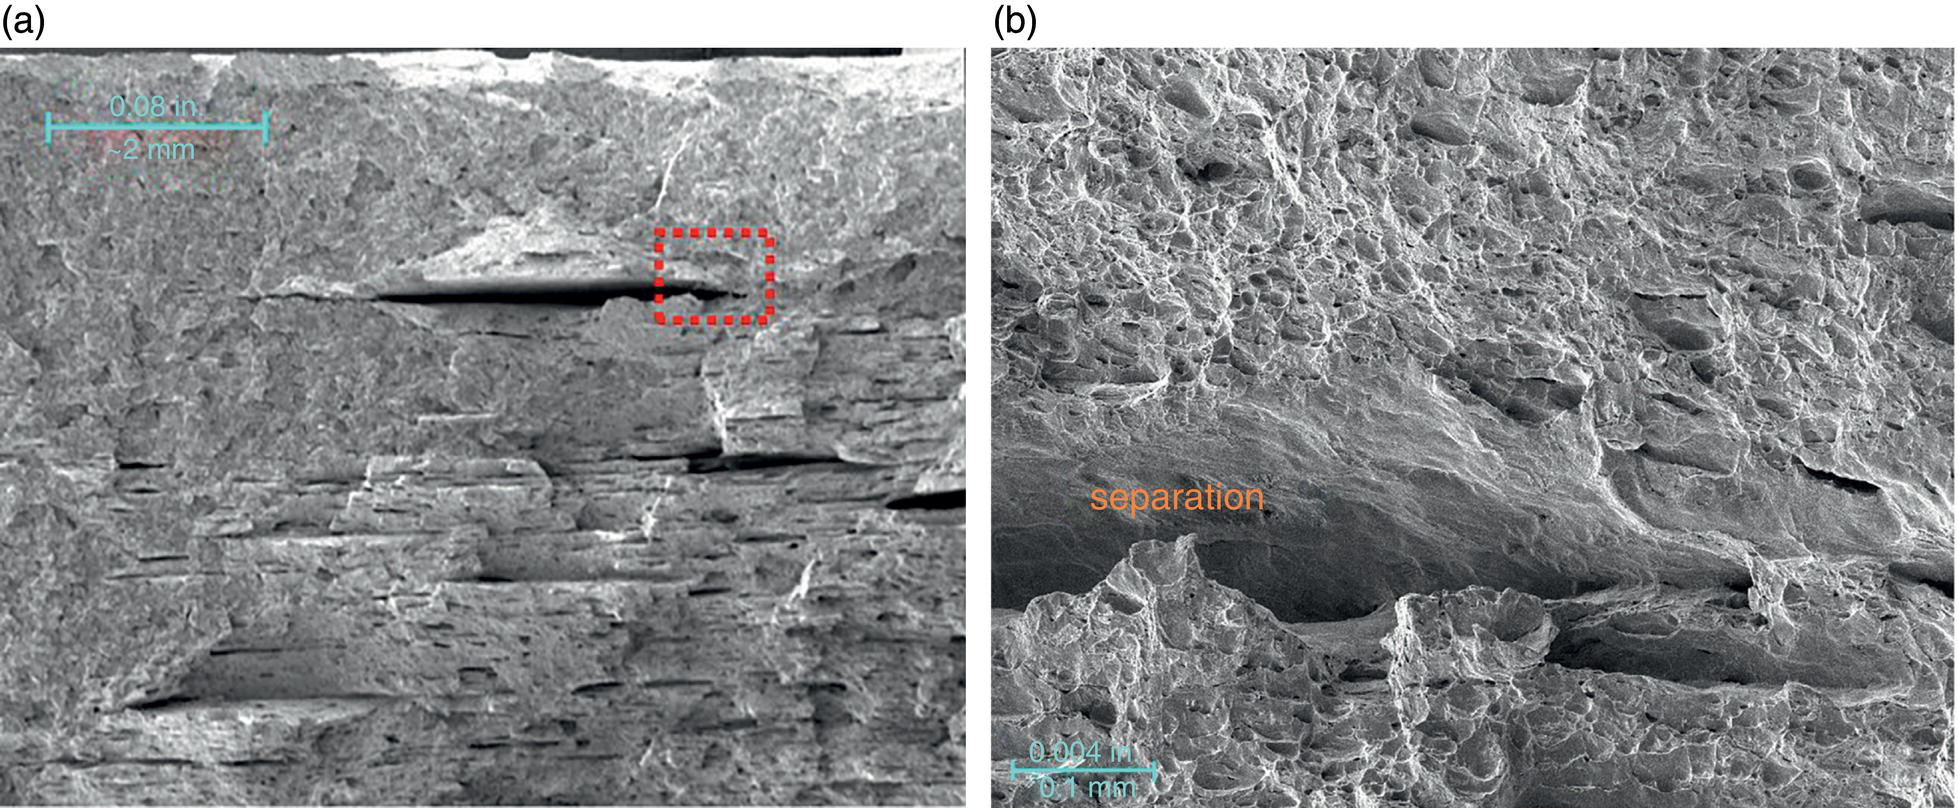
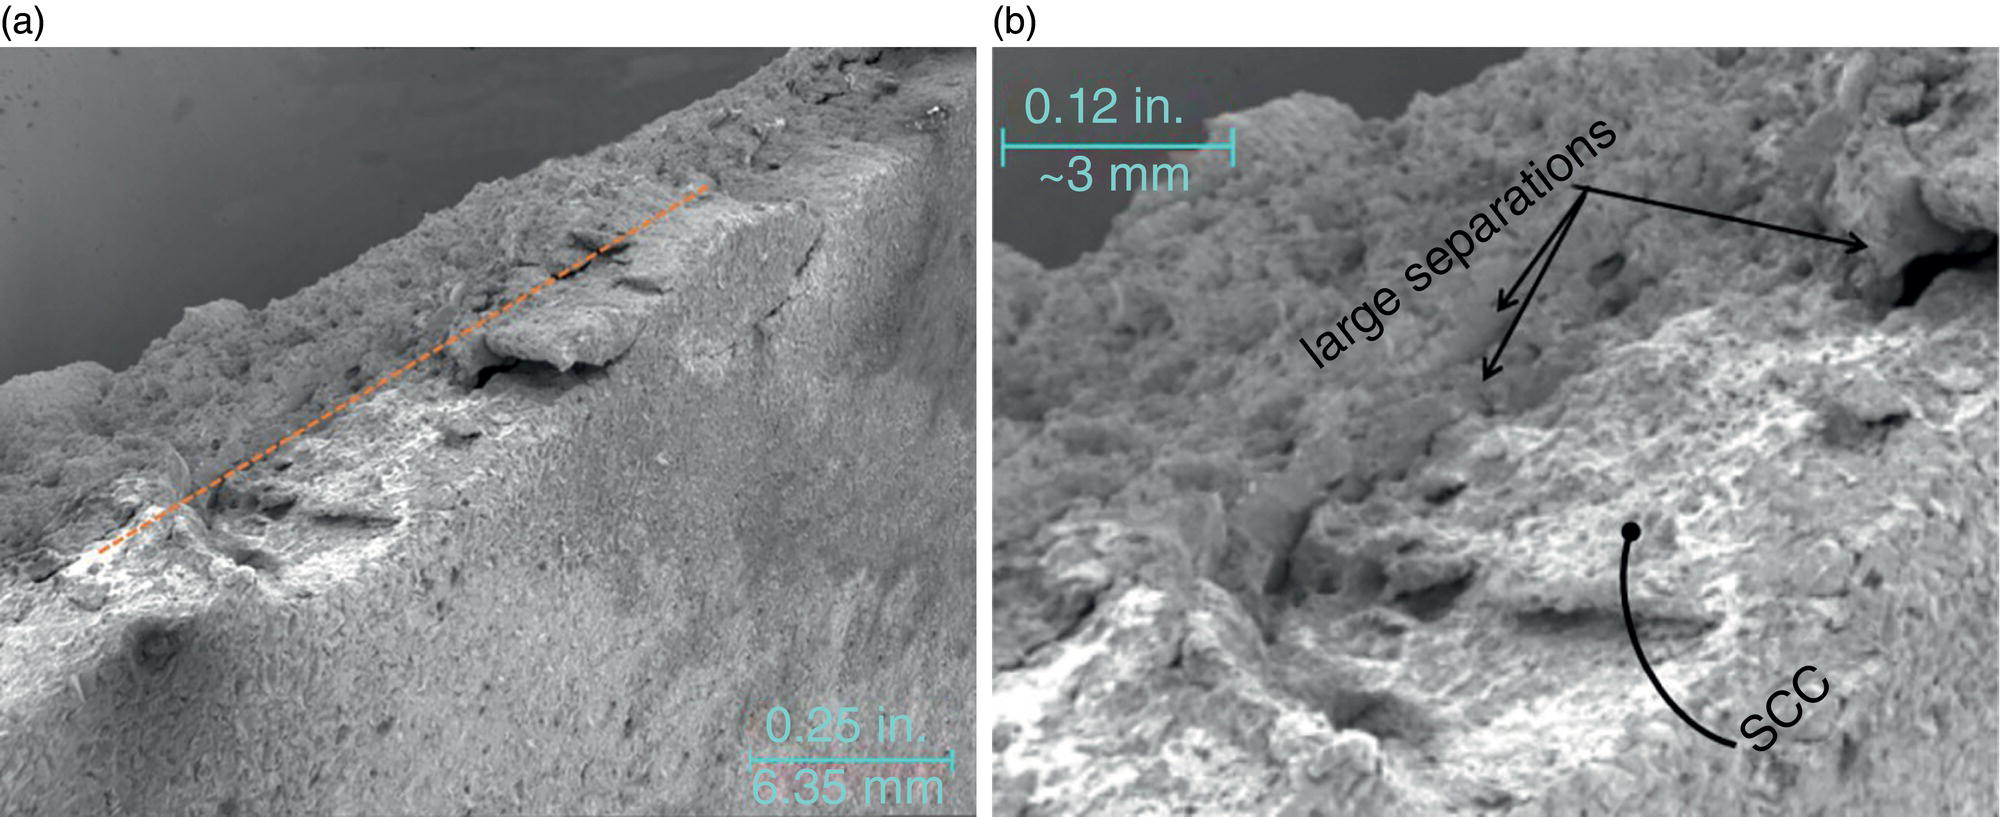
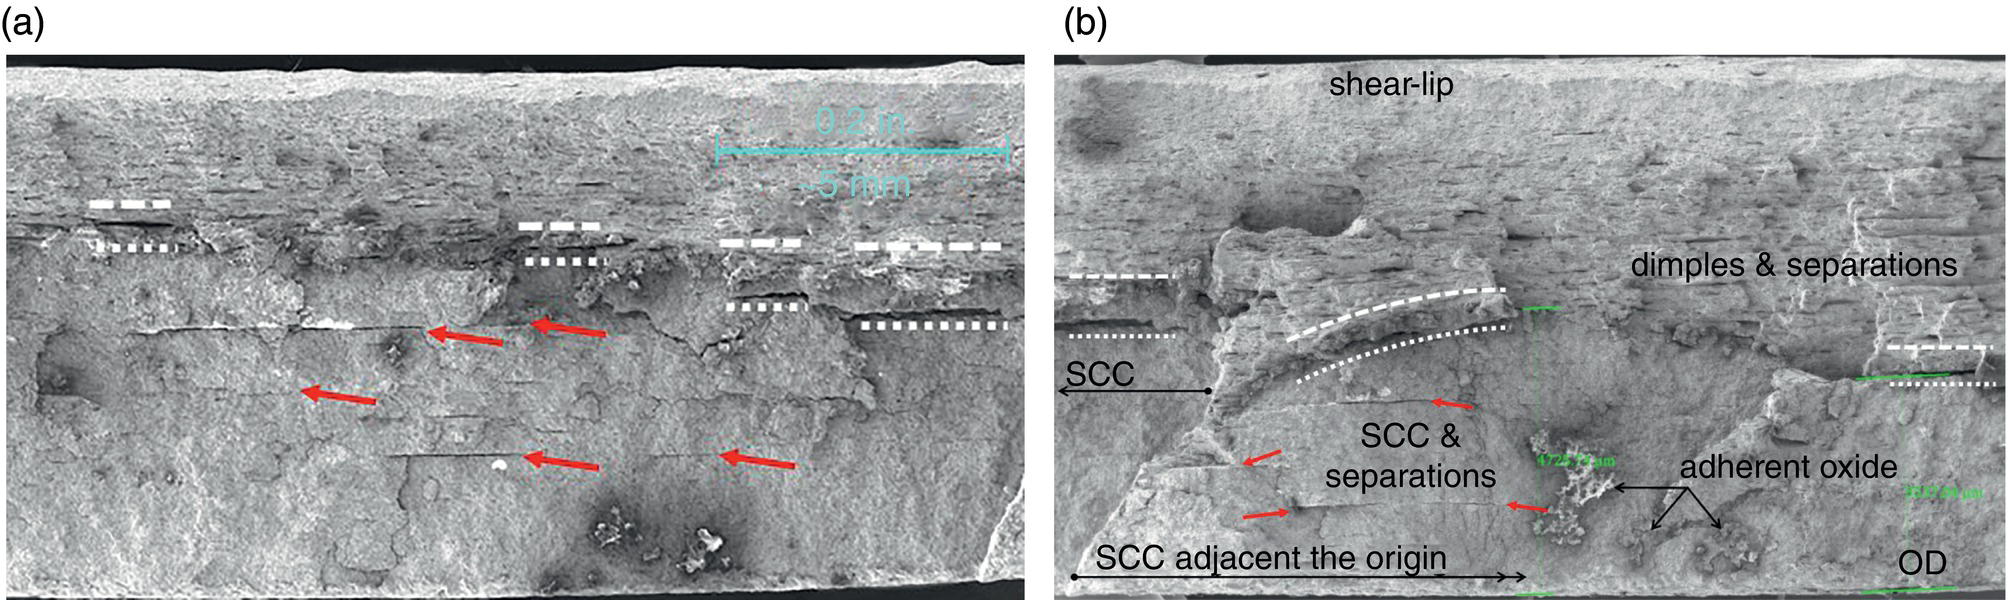
54.4.7.3 Discussion and Conclusions
54.4.7.4 Observations and Takeaways
54.5 Summary and Key Conclusions
Acknowledgments
References
Notes