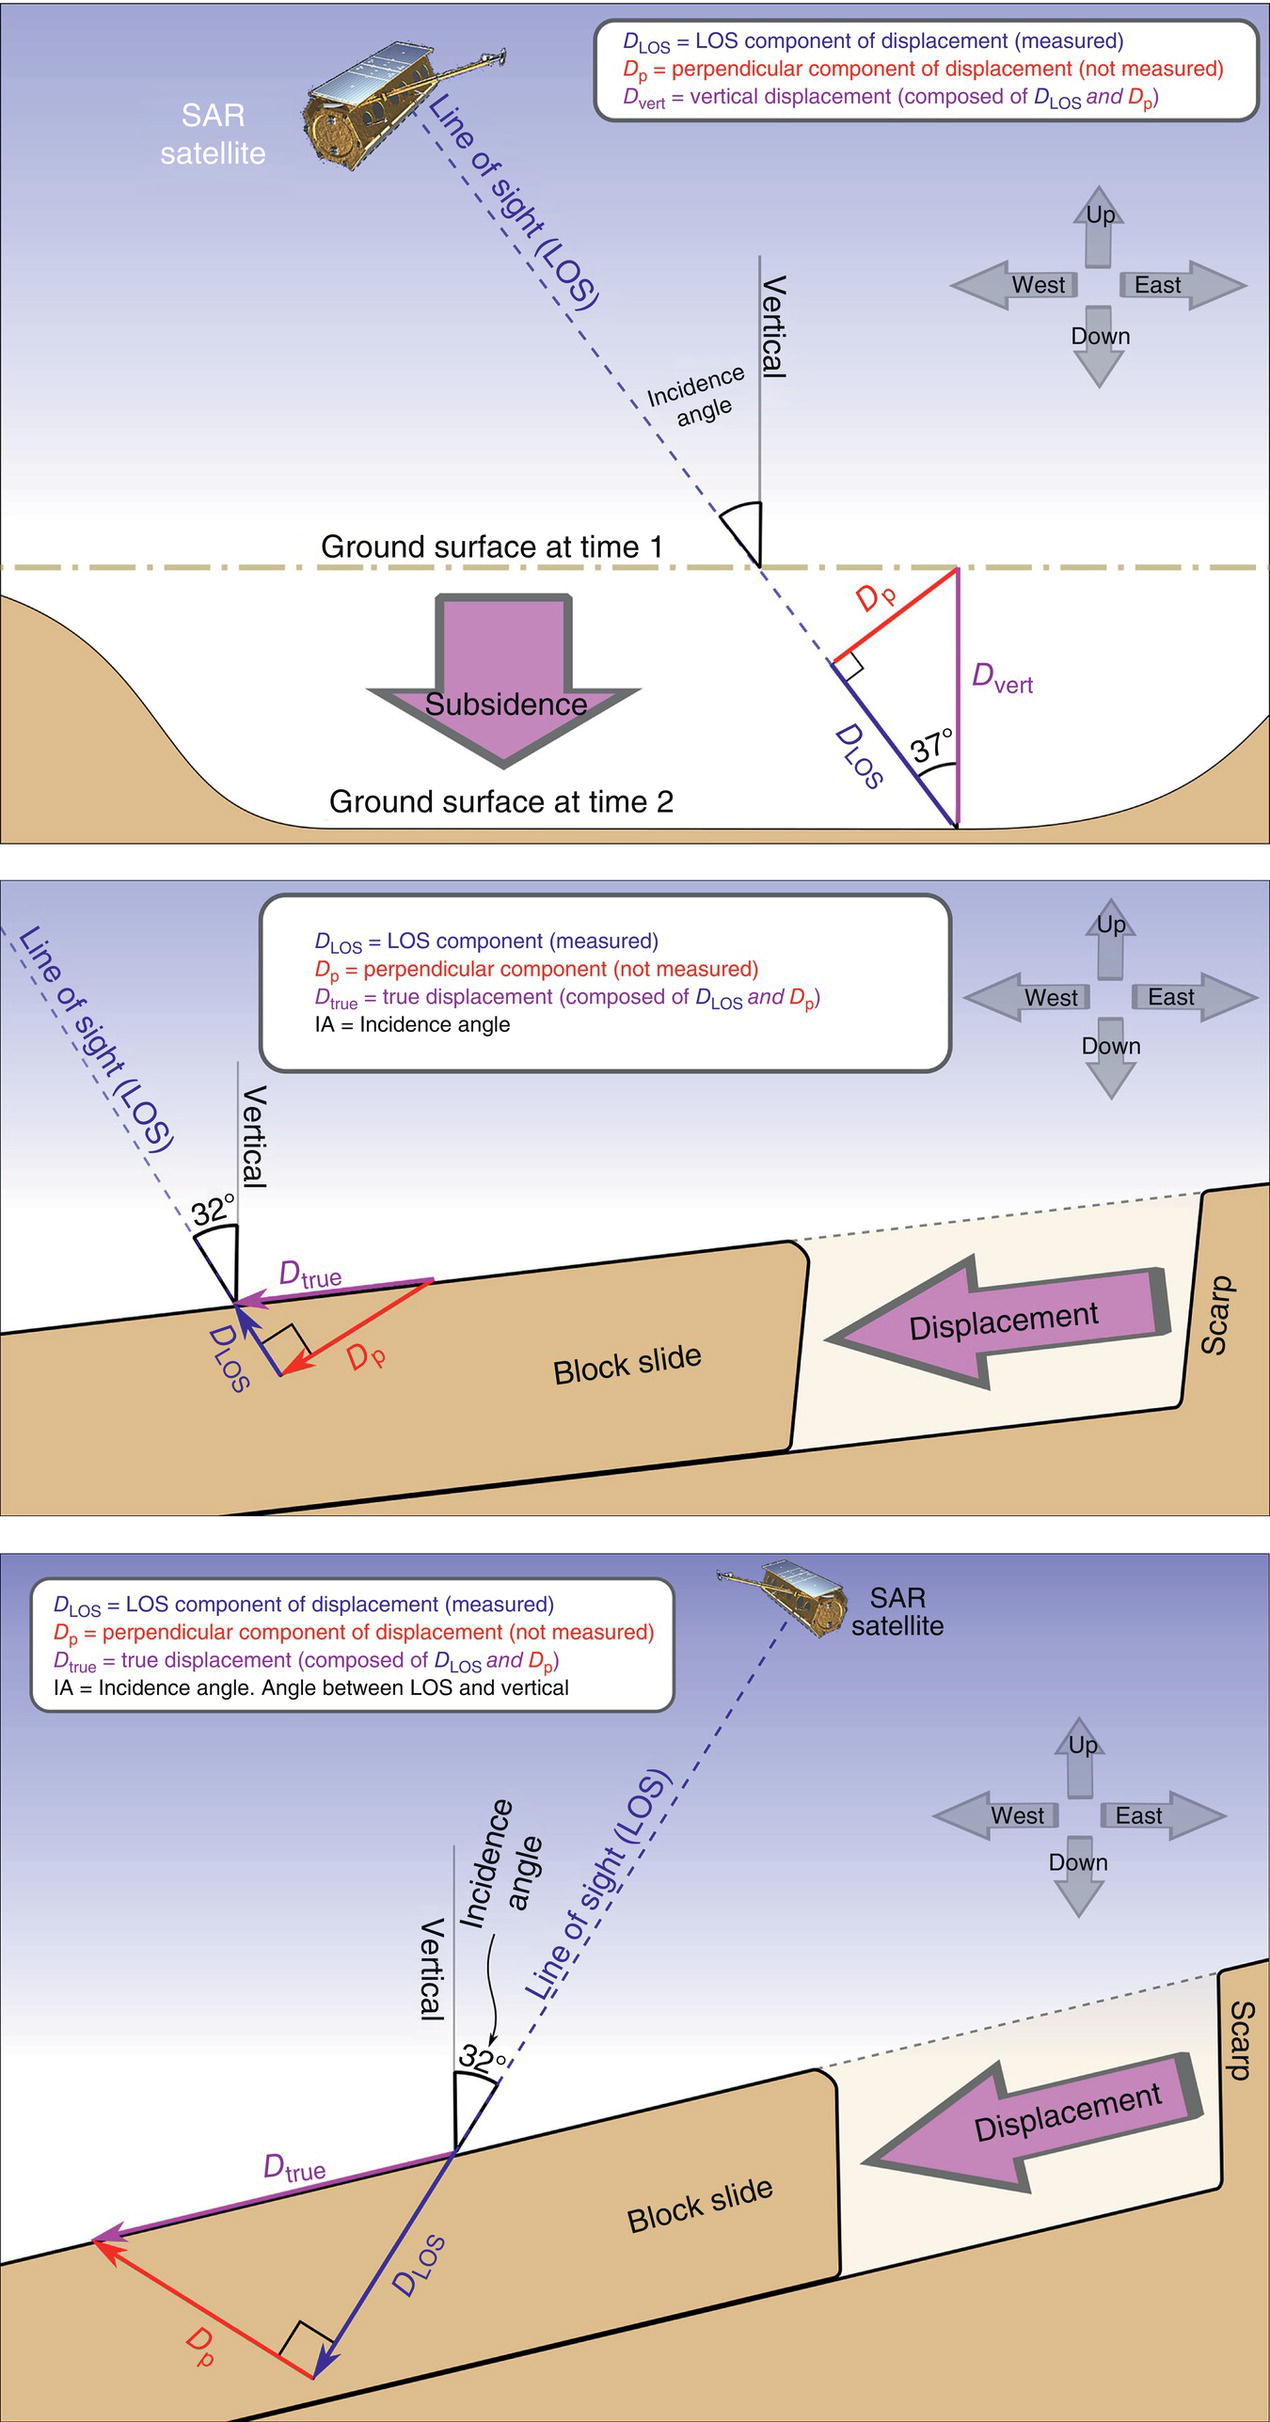
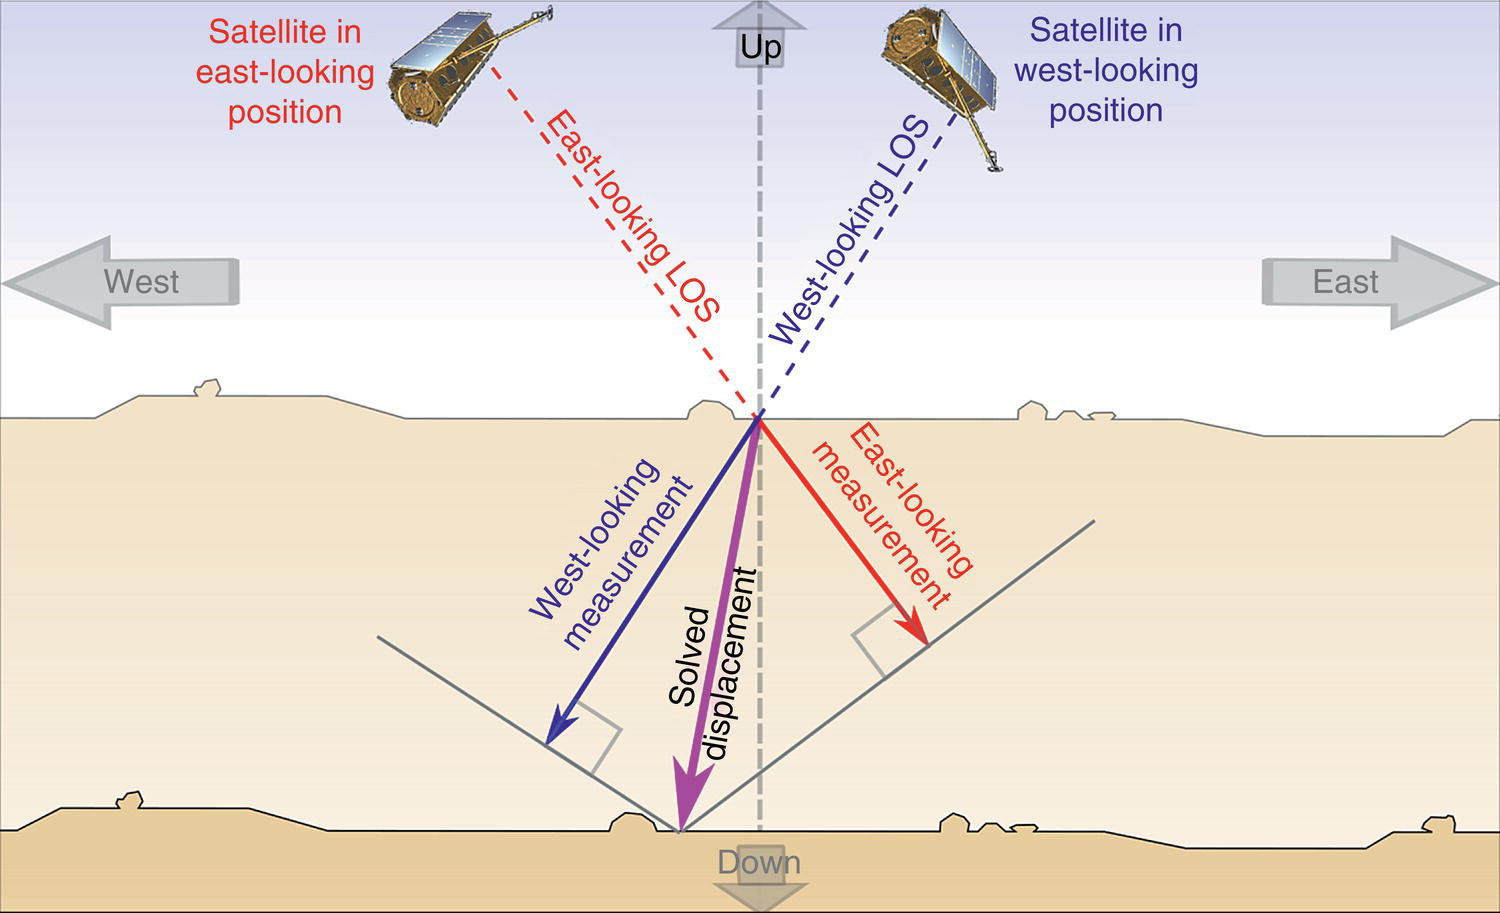
Murray Down and Jon Leighton 3vGeomatics, Vancouver, British Columbia, Canada Vast distances and difficult access present challenges when using traditional monitoring methods to detect and characterize geohazards threatening pipelines. Satellite Interferometric Synthetic Aperture Radar (InSAR) is a monitoring system using radar images to measure displacement of the ground and structures. While InSAR can be performed using ground-based systems, this chapter will focus on satellite-based systems because they are more applicable to network-wide pipeline monitoring. Satellite InSAR, hereafter simply referred to as InSAR, can cover wide areas and requires no specialized equipment on the ground. InSAR can complement other monitoring methods or even function as the sole monitoring method for more remote areas. In addition to identifying and measuring displacement associated with slow-moving landslides or subsidence, the amplitude and/or coherence information can also be used to detect hazards and other changes along a pipeline network. Recent algorithmic advances have enabled earlier detection of ground displacement and accelerated displacement, and faster turnaround times for updates. Radar satellites have proliferated in number and variety making InSAR more available than ever. However, even with the same raw data inputs, InSAR monitoring approaches vary widely in terms of efficacy, depending on the quality of algorithms that are used to process the raw data. Most notably, correctly estimating uncertainty in InSAR is nontrivial due to the interdependence of pixels, but this is key to producing useful displacement measurements with appropriate confidence levels. InSAR is difficult to understand and fundamentally different from other common monitoring technologies. Lack of understanding leads to ineffective InSAR services based on data and methods that are unsuitable for some pipeline monitoring situations. Far from being a one-size-fits-all technology, effective InSAR requires careful choices based on the local ground conditions, the climate, and the specific needs of the pipeline operator. Key specifications discussed here include satellite characteristics (e.g., wavelength, resolution, revisit period, look direction, and satellite perspective options), processing algorithms, and product formats. Processing algorithm choices include uncertainty reduction, filtering, and exploitation of different types of scatterers such as permanent, nonpermanent (temporary), and distributed scatterers. When these specifications are chosen appropriately, they make a significant difference. This chapter is not an exhaustive explanation of InSAR; it is a condensed guide to help pipeline operators understand the basic capabilities and limitations of InSAR, specify requirements in requests for proposals, and evaluate InSAR options based on the most impactful qualities. Satellite-based InSAR measures subtle displacement of the ground or ground-connected structures from space. Satellites supply raw data in the form of synthetic aperture radar (SAR) images, which can be processed interferometrically to measure displacement between consecutive satellite passes. This displacement might be associated with slow-moving landslides, ground subsidence (e.g., from tunneling or settling of deposited material), freezing, thawing, thermal expansion and contraction, structural failure, or other processes. With a sufficient baseline of radar images from an appropriate satellite, InSAR can measure millimeter level displacement between satellite passes. Precision levels are much coarser initially when fewer than 15 images have been acquired. Precision continues to improve with each additional image, but with diminishing returns after around 30 images. Precision is also dependent on radar wavelength; longer wavelengths can produce lower precision but can monitor heavily vegetated areas. Figure 37.1 Screenshot of an InSAR web platform showing a west-looking, long-wavelength InSAR displacement rate map layer. The user-adjustable scale is set at −10 cm/year (red in color version, moving away from satellite, on west-facing slopes, east of river) to +10 cm/year (blue in color version, moving toward satellite, on east-facing slopes, west of river). A time series plot of selected points (light circles in the dark area) shows cumulative displacement over time of each point (thin gray lines) and the average of all selected points (thick line). Displacement detection contours based on SNR (Signal to Noise Ratio) are shown in white surrounding the most significant displacement areas. SAR data is acquired as images, with each pixel corresponding to a particular geographic area on the ground. Depending on the chosen acquisition parameters, the raw sample spacing varies between 0.25 and 40 m, with the most common spacing being 3 m. Displacement measurements from the postprocessed data indicate the weighted average displacement with respect to a reference point or an average of nearby stable areas. Radar images contain millions of pixels, covering a footprint as small as 1 km or as large as 400 km wide, with the most common width being ~50 km. Notably for InSAR, measurements take place in the period between consecutive SAR images, rather than on the image dates themselves. Currently, this period can be as short as a day, or up to several years, but it is most commonly between 1 and 14 days. Subsequent displacement measurements can be shown as time series indicating the cumulative displacement over time for each pixel or for a group of pixels. Alternatively, the changing velocity can be plotted over time to highlight accelerations and decelerations. Spatial representations of the results can also be useful. The displacement rate over a given time period is commonly displayed as a color-scaled map layer using raster formats such as GeoTIFF or KMZ. Further insight can be provided from contours which highlight areas of high displacement signal-to-noise (SNR) as well as areas that have accelerated. Purpose built web platforms can provide a simple and accessible means of displaying all of these deliverables, as shown in Figure 37.1. Users need not concern themselves with data manipulation and storage. Instead, a well-designed web platform pulls results from cloud data storage as needed, while data exporting tools can still provide technical users the results they need for more involved offline analysis. InSAR’s displacement measurements are one-dimensional, capturing displacement along the satellite’s side-looking line of sight (LOS) perspective. When the direction of displacement happens to align with this perspective, InSAR is capable of capturing the full magnitude of displacement. Invariably though, the direction of displacement will not coincide with the LOS and standard InSAR will commonly underestimate the true displacement magnitude. However, for pixels that can be seen from more than one perspective, results from two (or more) 1D InSAR datasets are commonly combined to produce 2D displacement measurements in the up-down–east-west plane, as described in Section 37.2.3, “Single-Look vs Dual-Look.” Even with dual-look data, steep topography can limit InSAR coverage as described in Section 37.2.4, “Geometric Distortion.” Due to a number of constraints related to radar viewing geometry, SAR satellites view the Earth from a side-looking perspective. Commonly, the sideways component of the LOS is perpendicular to the orbital path of the satellite. As of 2023, all commercially available SAR satellites suitable for InSAR operate in near-polar orbits, traveling between the south and north poles with the ability to measure almost any location on the planet. While SAR satellites can aim in various directions, the vast majority of acquisitions are conducted with the LOS “looking” eastward during the ascending (south to north) part of the orbit and “looking westward during the descending (north to south) part of the orbit. The LOS is either down and approximately east or down and approximately west. Because of the near-polar orbit convention, InSAR is not sensitive to horizontal north-south displacement. Displacement on north and south-facing slopes can however still be measured by capturing the non-horizontal and any east-west component that exists. This misalignment between the LOS and the displacement vector are why InSAR displacement magnitudes should always be considered as underestimates of the total displacement magnitude. There are other factors which also limit InSAR’s absolute accuracy (see Section 37.2.5, “Coherence”), but these limitations do not impact what most users view as its strengths: high precision and wide area displacement detection, rather than a full account of the total displacement. In the unlikely but theoretically possible scenario that the net displacement direction vector happens to be perfectly parallel with the LOS, then 100% of the displacement can be measured. However, these two vectors will typically differ and InSAR will underestimate the true magnitude of displacement. Figure 37.2 provides simplified scenarios, vertical displacement (top) and downslope block slide displacement measured from two different vantage points (bottom and middle). In a scenario where the net displacement direction vector happens to be perpendicular to the LOS (Dp in each subfigure of Figure 37.2), then none of that displacement can be measured from that particular LOS. This limitation is greatly improved by monitoring using two different LOS vectors, accomplished by acquiring datasets with opposing ascending (east-looking) and descending (west-looking) LOS vectors, as illustrated in Figure 37.3. When budgets and satellite schedules permit, a second set of one-dimensional measurements can also be acquired from a different LOS direction, and the measurements from two LOS directions can be combined to measure displacement more accurately and in two dimensions. This also greatly improves coverage and sensitivity for sites with significant topography. The extra data also provides independent measurements, which can be used to validate other results. For currently available SAR satellites, the direction of displacement can be solved in the up-down–east-west plane, as shown in Figure 37.3. Note that the two LOS vectors are not necessarily perpendicular since their incidence angles vary, typically between 25° and 50° from vertical, and the relative sensitivity to displacement in the up-down or east-west directions depends on the chosen incidence angles. Dual-look products are always better than single-look products, but how much better depends on the site characteristics, especially on various slope aspects. The benefits of dual-look InSAR are listed below: To illustrate the advantage of dual-look, Figure 37.4 shows an area of displacement, measured by single-look data from each of two LOS vectors independently as well as the dual-look results displayed in three different ways: A SAR uses the travel time of emitted pulses to order pixels in the resulting image. A sensor pointing straight down would receive many return signals at similar times, resulting in data with very little separation between returns, resulting in poor image resolution. With a side-looking orientation, the distance to features on the ground varies more, corresponding to more varied travel times and higher resolution data. This works well on flat ground but there are issues in areas with significant topography. A slope facing away from the satellite, but not steep enough to be occluded from view (or radar shadow), makes an ideal target for InSAR monitoring. Conversely, a slope facing the satellite will suffer from the same issue as a vertically looking SAR; this is termed radar foreshortening. In the most extreme foreshortening scenario, a slope perpendicular to the LOS will return signals from the top and bottom at the same time and the entire slope will be compressed into a single line, precluding any measurement. An even steeper slope will return signals from the top first and bottom last, and the slope will be reversed in image space; this is called layover, also precluding measurement. A third category of geometric distortion involves areas that are simply obscured from view, behind slopes too steep for the viewing perspective. These are said to be in shadow. Areas of foreshortening, layover, and shadow depend on the look angle (the angle between the satellite’s nadir and its LOS) and the local topography. Monitoring an area with significant topography from both ascending and descending passes can greatly improve InSAR coverage compared to single perspective InSAR. Figure 37.2 Three monitoring scenarios are presented; vertical subsidence (top), and downslope sliding measured by an unfavorable look direction (middle) and a favorable look direction (bottom). In any case, InSAR will capture only the component of the displacement coincident with its line of sight. Figure 37.3 Measurements from multiple satellite directions are combined to solve displacement magnitude and direction in the up-down–east-west plane. InSAR is a relative technique; each pixel has a spatial dependency on its neighbors. Lone isolated pixels are not useful unless they are sufficiently proximal and similar so as to be meaningfully compared with other pixels in a consistent way. Coherence is a key measure of InSAR quality, which relates to how well measurements compare locally. A stable area with no noise contributions results in equivalent measurements across a group of pixels, resulting in maximum coherence. An area undergoing displacement contains smoothly changing measurements, resulting in high coherence if noise is low. In contrast, a parcel of stable ground would contain low coherence and would therefore not be measurable in the following scenarios: Figure 37.4 The advantages of multiperspective InSAR. Top left and right: an area of line-of-site (LOS) displacement. Center: When the two LOS measurements are combined, displacement can be separated into east-west and up-down components. Bottom: Absolute displacement is the root-sum-square of the east-west and up-down components, showing the full displacement magnitude regardless of direction. Causes for incoherence are indistinguishable from one another without further information. Important context from local knowledge, historic precedence or other imagery is often used to attribute the cause of low coherence areas. Monitoring paraglacial and periglacial landscapes introduces special considerations due to the limitations of InSAR. As it thaws and refreezes, the active layer of permafrost exhibits seasonally cyclical displacement that can be measured by InSAR, but seasonal snow cover limits the portion of this cycle that can be directly measured. Overlaid on these cyclical patterns are longer term trends associated with year over year net displacement, which can be associated with cumulative thaw being greater than refreezing or can be associated with slope displacement or other causes of subsidence. Despite missing measurements during the winter months, InSAR measurements can support modeling of multiple displacement regimes leading to maps differentiating between areas dominated by cyclical displacement, linear displacement, or areas influenced evenly by both. Below is a guide to specifying requirements in requests for proposals (RFP) and evaluating the merits of proposals for InSAR monitoring programs. Satisfaction with a monitoring program depends on alignment of expectations and capabilities. Well-informed and clearly specified requirements from a pipeline operator will elicit suitable, comparable, and cost-effective InSAR solutions from qualified InSAR providers and will support appropriate metrics for evaluating proposals and subsequent performance. Some key factors are inherently quantitative (e.g., number of images), while others are qualitative (e.g., technical support services). InSAR requirements can be summarized as: Why, Where, When, What, Who, and variants of How. After the reasons, the next thing to specify is the geographical area of interest (AOI). This should be provided in an open geospatial vector format, such as a Google Earth KMZ or ESRI Shapefile. Well-established InSAR service providers should be satellite agnostic, working with all SAR image providers, selecting the most appropriate data source for the project based on technical and economic considerations. InSAR service providers should consider the data’s spatial resolution, expected data coverage, precision requirements, acquisition frequency, operational reliability, and price per image when scoping the project. A selection of some common satellites considered for most projects are given in Table 37.1. Table 37.1 Common InSAR Raw Data Sources Considered for Most Projects Figure 37.5 Circles indicate the archive of ascending (top row, east-looking) and descending (bottom row, west-looking) TSX images. Almost all land areas are covered by some form of historical archive radar data that has already been acquired and can be downloaded and processed immediately. Free raw data are available from the Sentinel-1 satellite constellation over most locations since ~2015. Some locations also benefit from high-resolution historical data, most commonly in major cities, mine sites, or other high-impact regions, where an InSAR service provider has ordered it or a satellite data provider has speculatively acquired it in anticipation of a use case. A SAR dataset’s existence is not necessarily proof of its utility for InSAR. A dataset might be useless for InSAR because the images were acquired for reasons other than InSAR. Despite covering the location and time period of interest, common reasons that a dataset might be unsuitable for InSAR include As an example of a good dataset, Figure 37.5 shows a timeline of two independent but overlapping footprints; one acquired as the satellite travels north, looking east (ascending, top row of dots) and another traveling south, looking west (descending, bottom row of dots). Data acquired in this way provide several benefits, discussed in multiperspective InSAR. Touching circles indicate images acquired at the maximum available frequency. These data can be used to provide a historical InSAR analysis showing displacement that has already occurred. It can also provide a helpful baseline for future ongoing monitoring if new images are acquired with matching specifications. This can improve the precision and reliability of new measurements.
37
Pipeline Geohazard Detection Using Satellite InSAR
37.1 Introduction: Why InSAR for Pipelines
37.2 Satellite InSAR Simplified

37.2.1 Line of Sight
37.2.2 Imaging Perspectives
37.2.3 Single-Look vs Dual-Look
37.2.4 Geometric Distortion
37.2.5 Coherence

37.2.6 Permafrost
37.3 Specifying InSAR Requirements
37.3.1 Data
Satellite
Band
Vegetation Resilience
Max Achievable Precision (mm)
Pixel Spacing Options (m)
Revisit Time (days)
Raw Data Cost per Image
Acquisition Startup Time
TerraSAR-X (TSX)
X
Poor
1–3
0.5 × 0.5 to 3 × 3
4–11
Medium–low cost
Hours–days
Cosmo Skymed (CSK)
X
Poor
1–3
0.5 × 0.5 to 3 × 3
4–16
Medium–high cost
Days
Sentinel-1 (S1)
C
Poor–~Moderate
2–5
~5 × 20
12
Free
Typically already acquiring
ALOS-2
L
Excellent
20–40
3 × 3
14
High cost
Weeks–months
SAOCOM
L
Excellent
20–40
10 × 10
8
High cost
Weeks–months 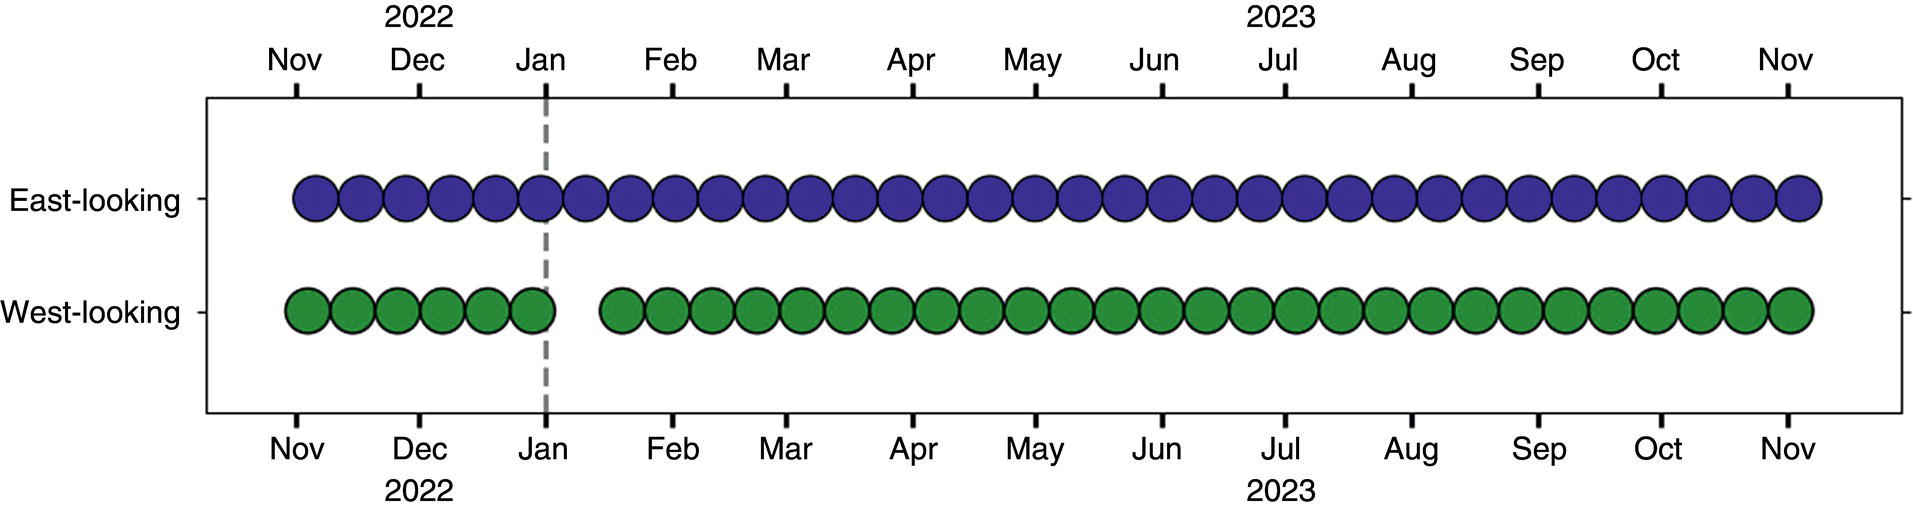
37.3.2 Historical Analysis
Bibliography