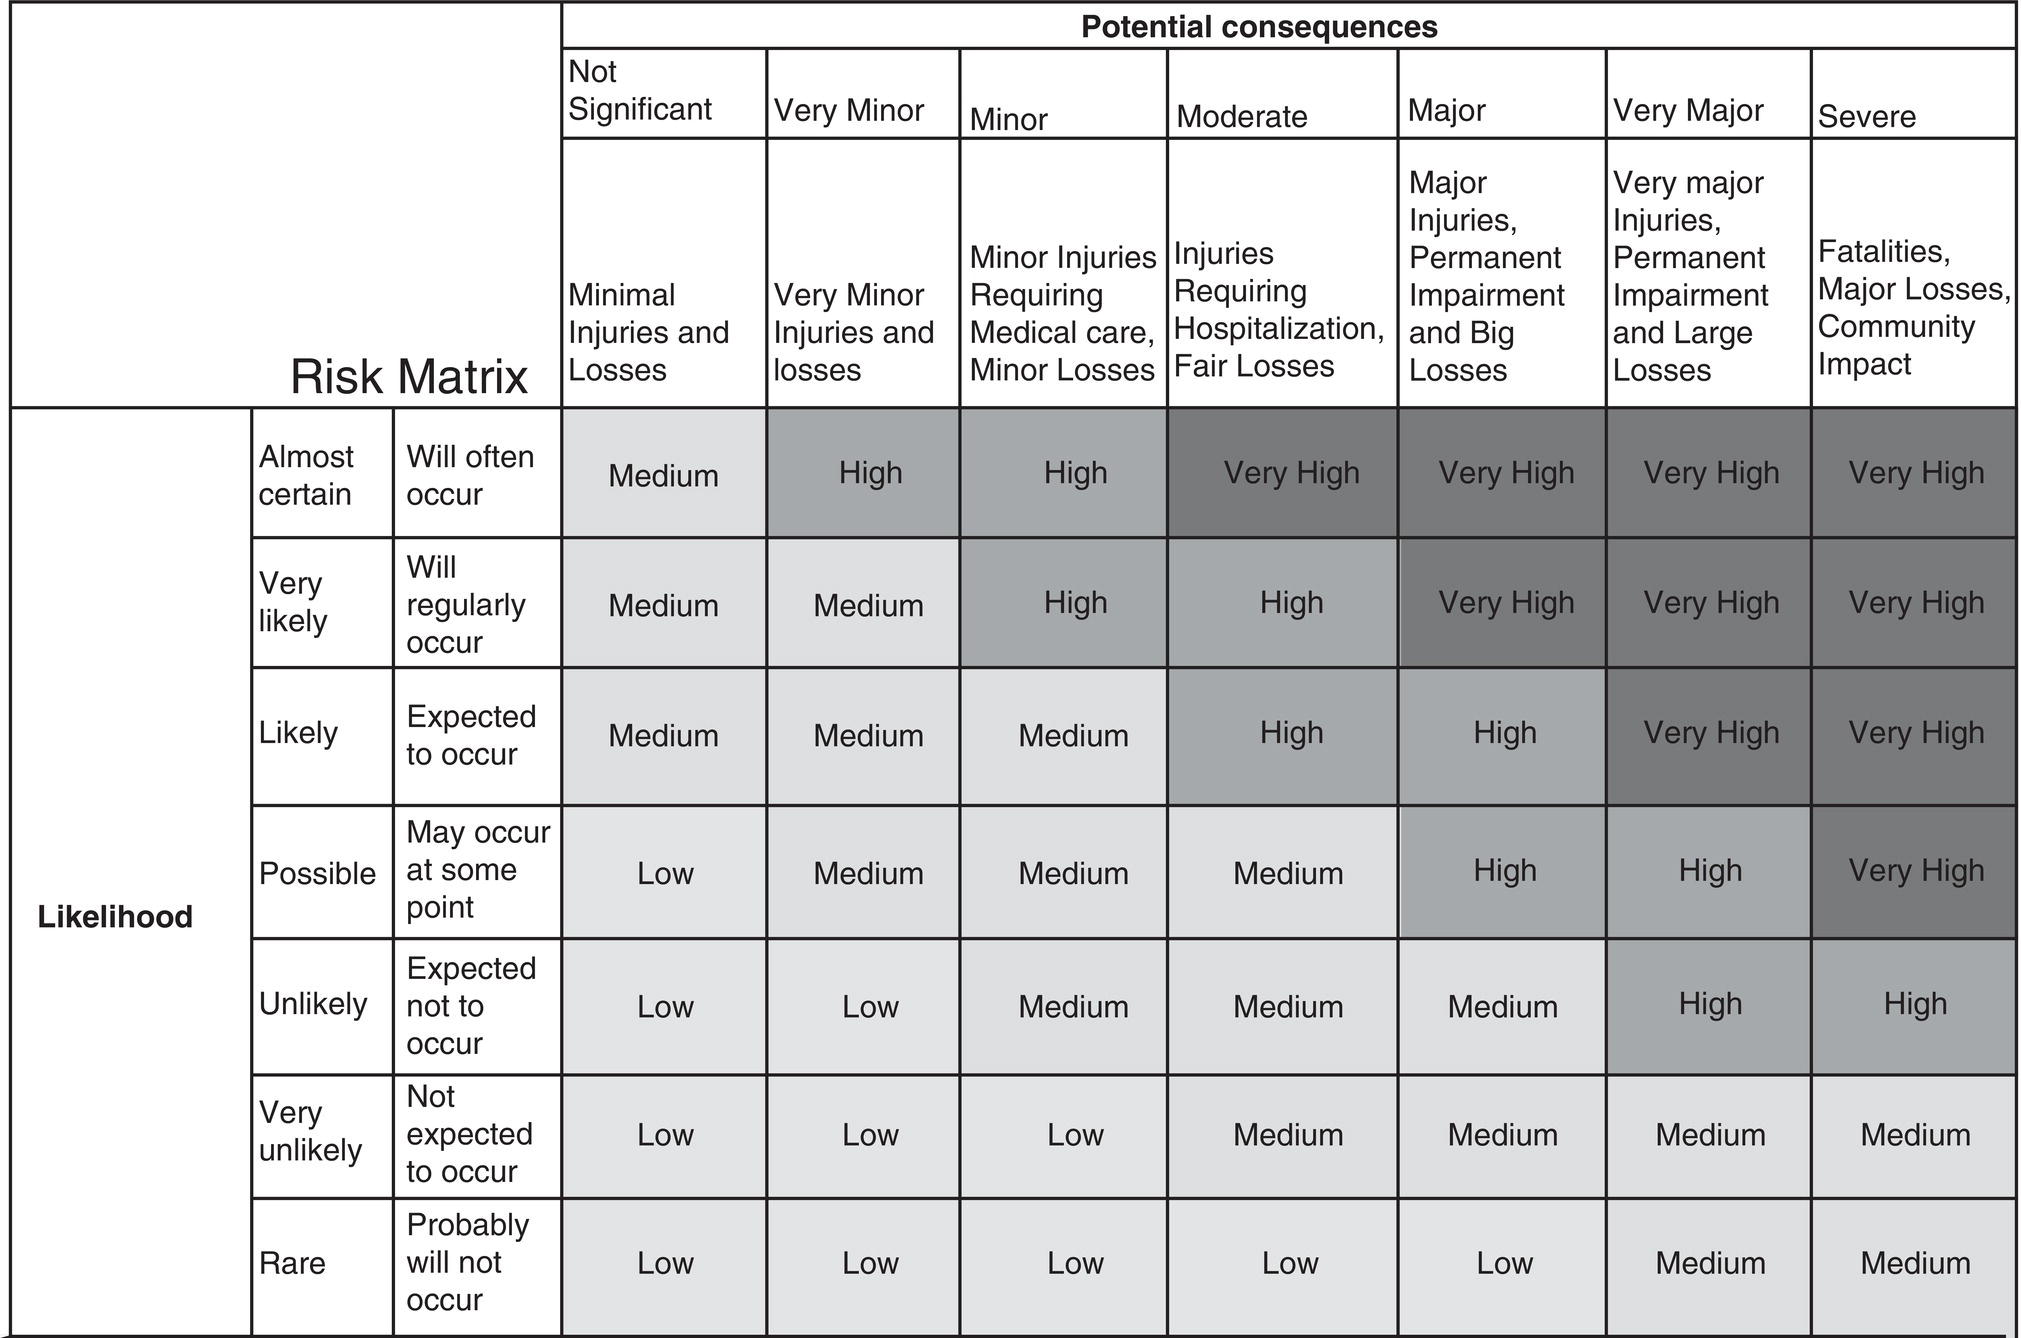
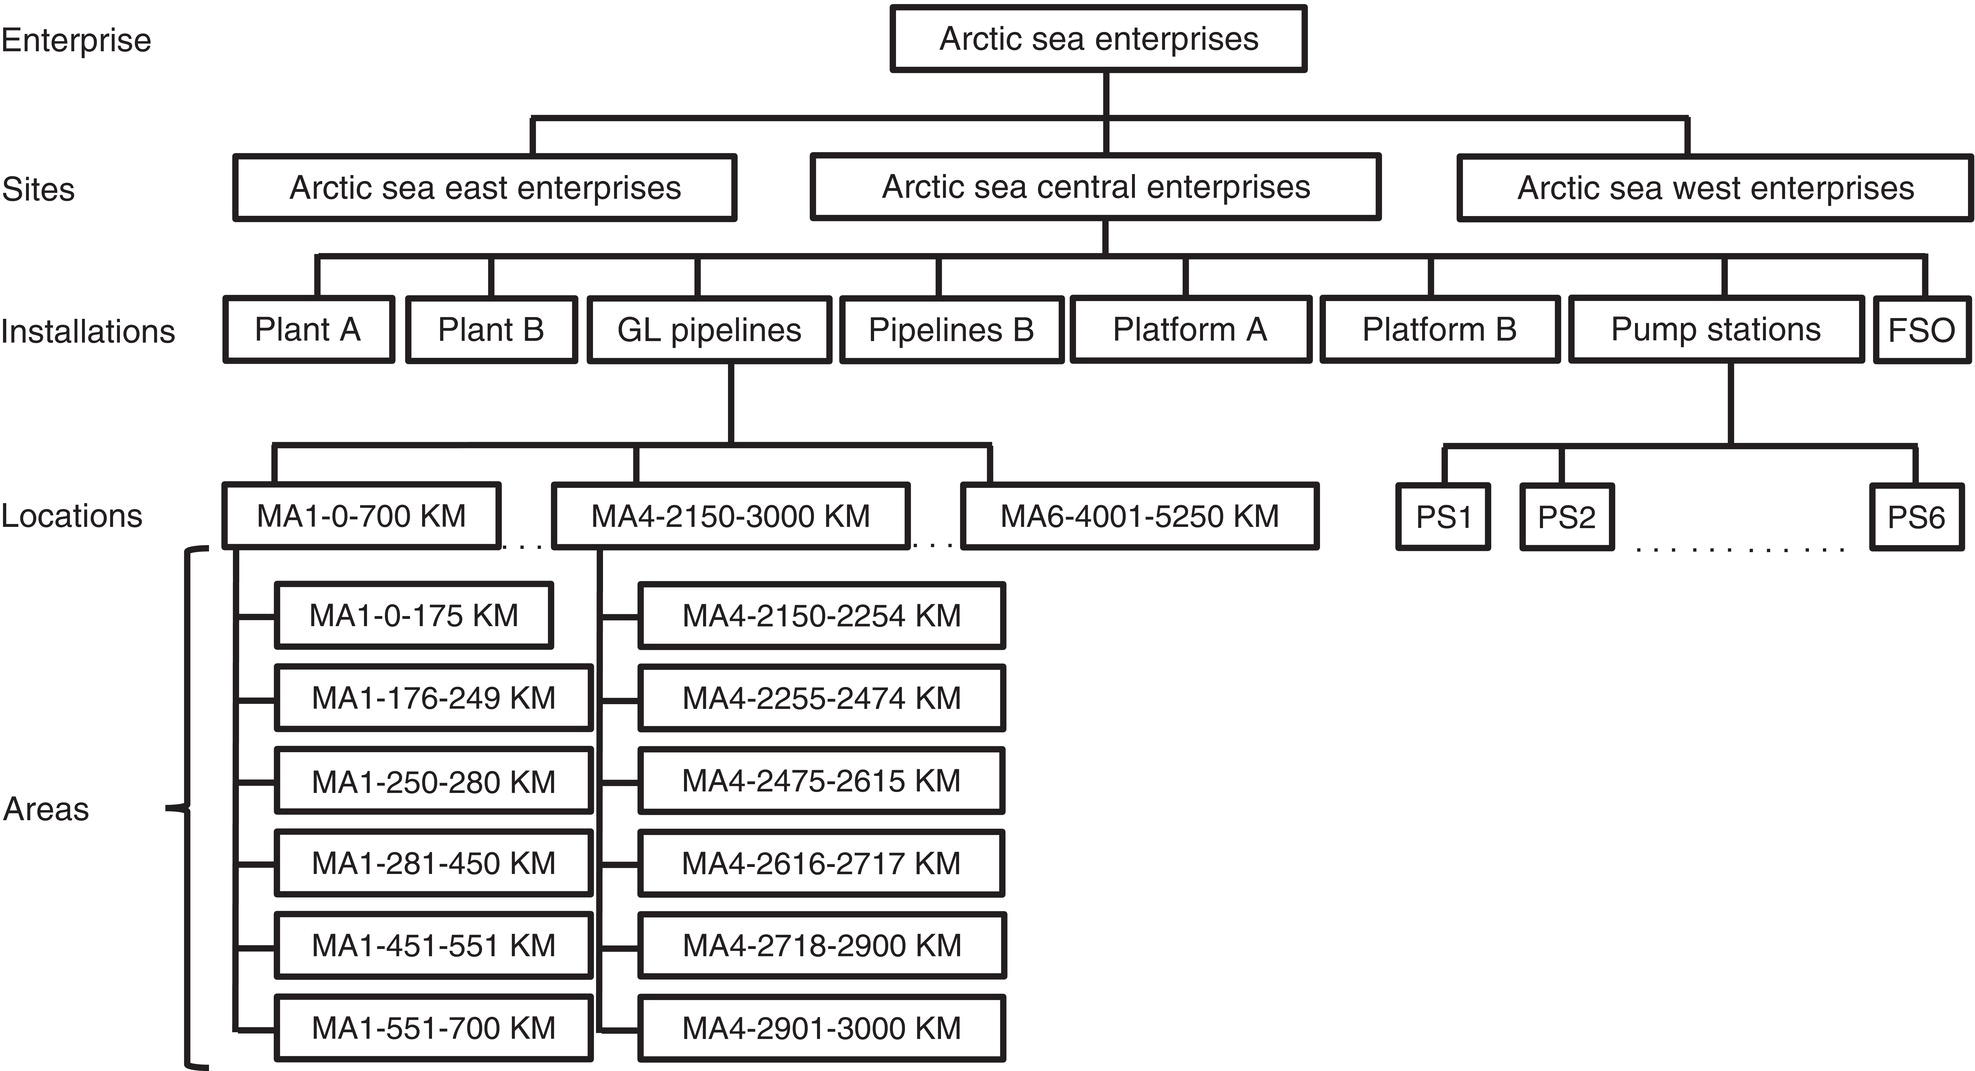
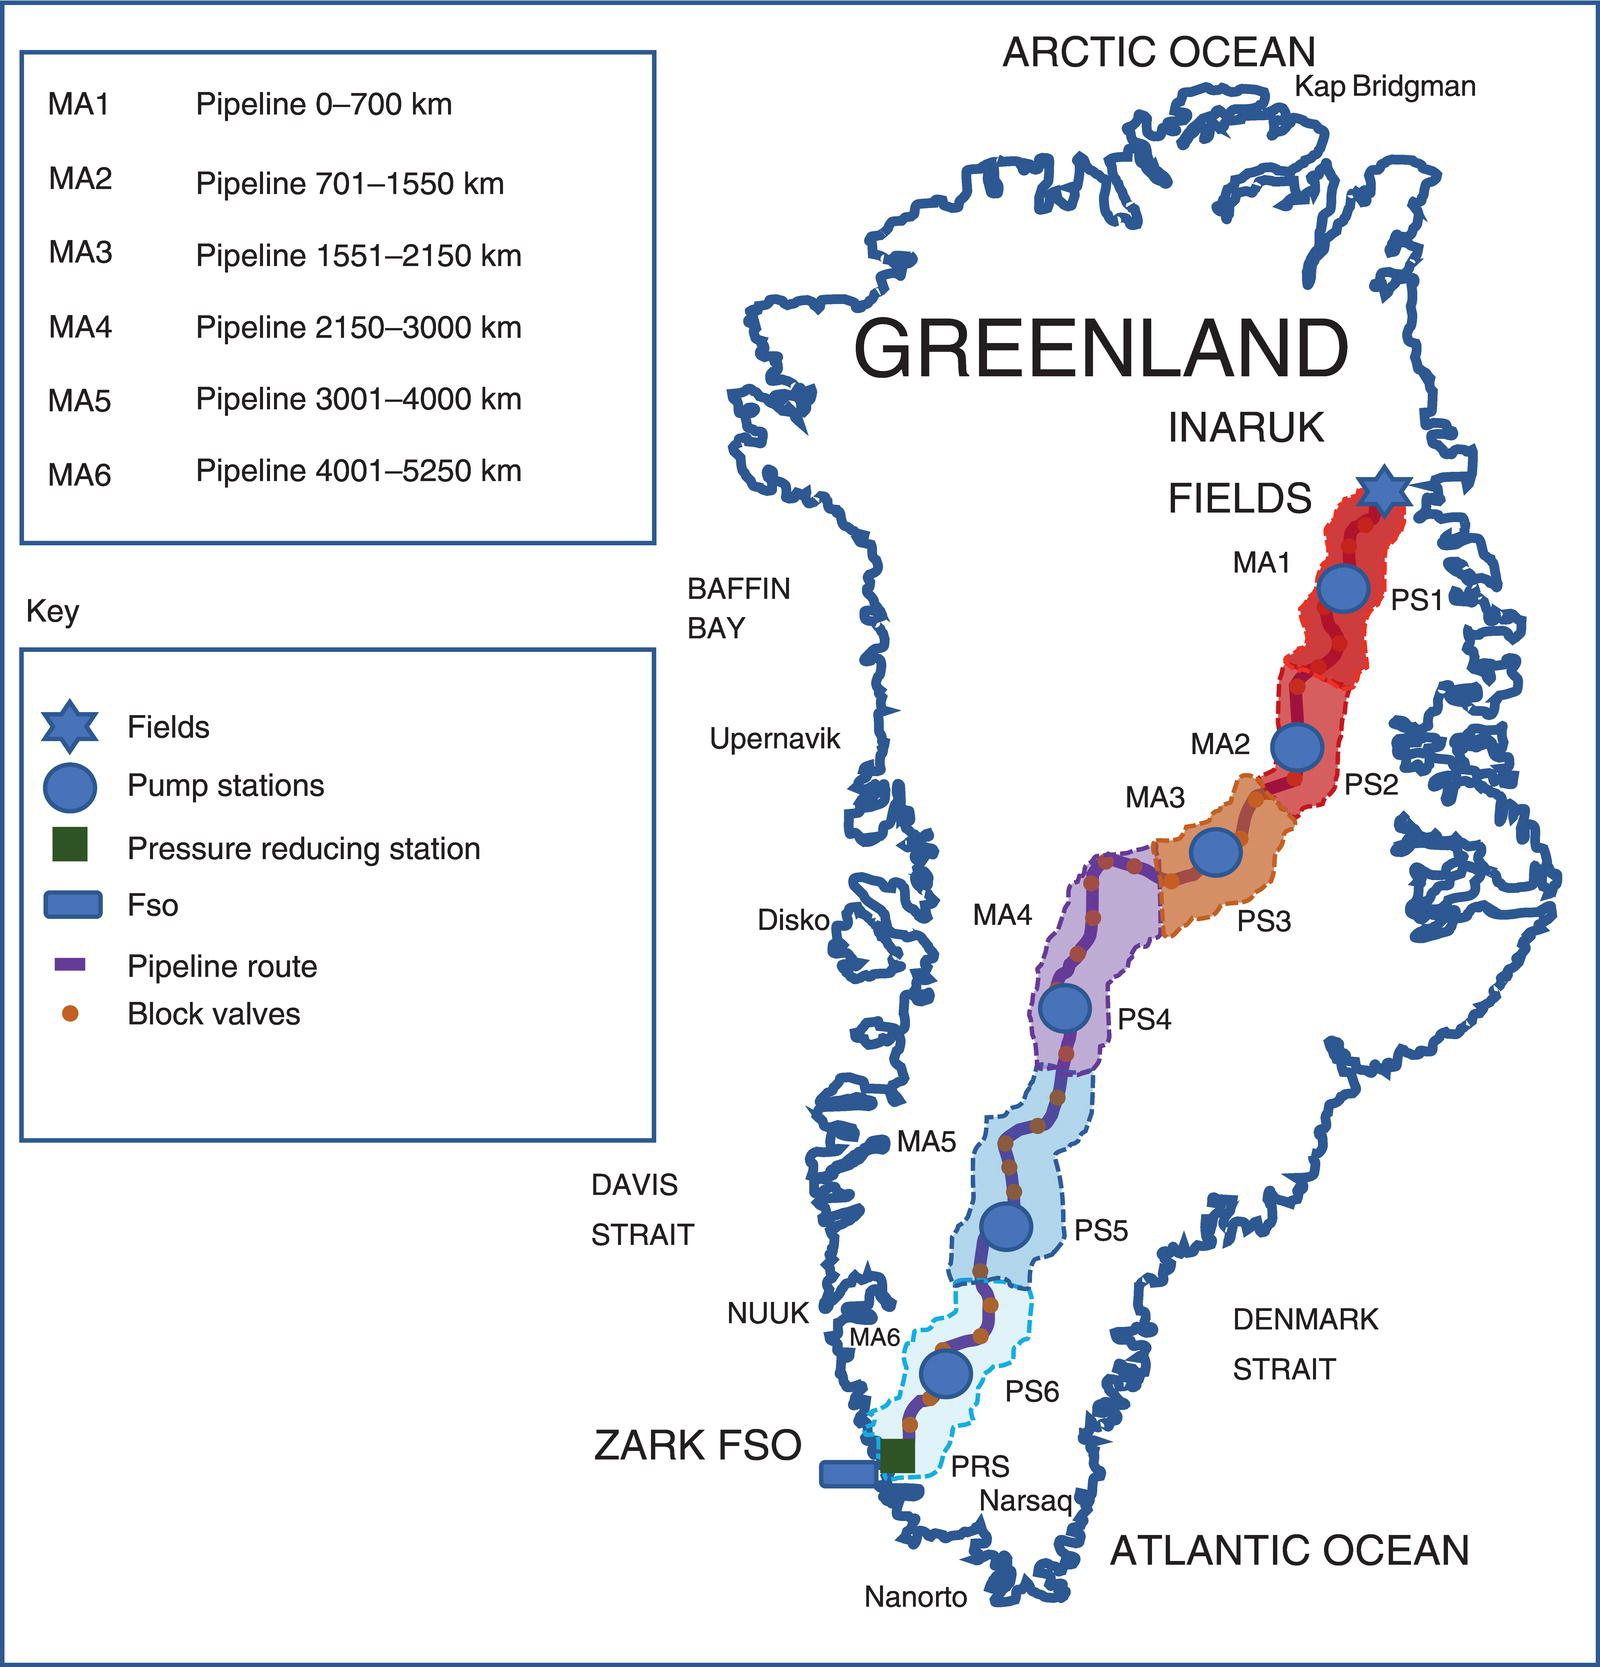
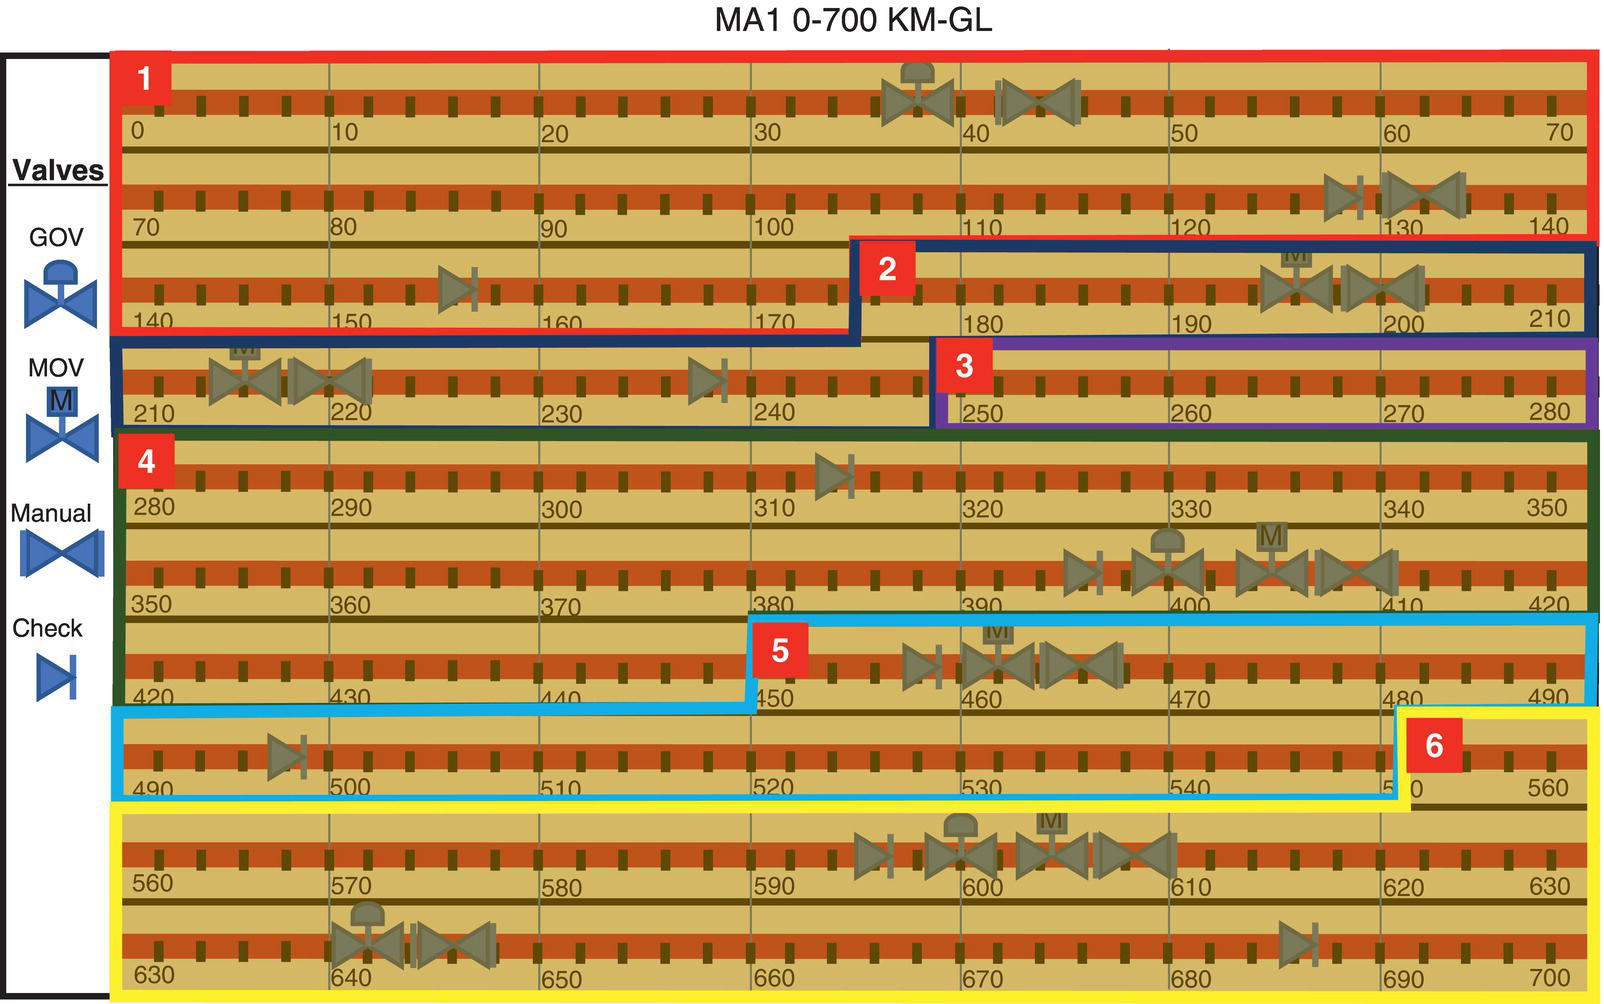
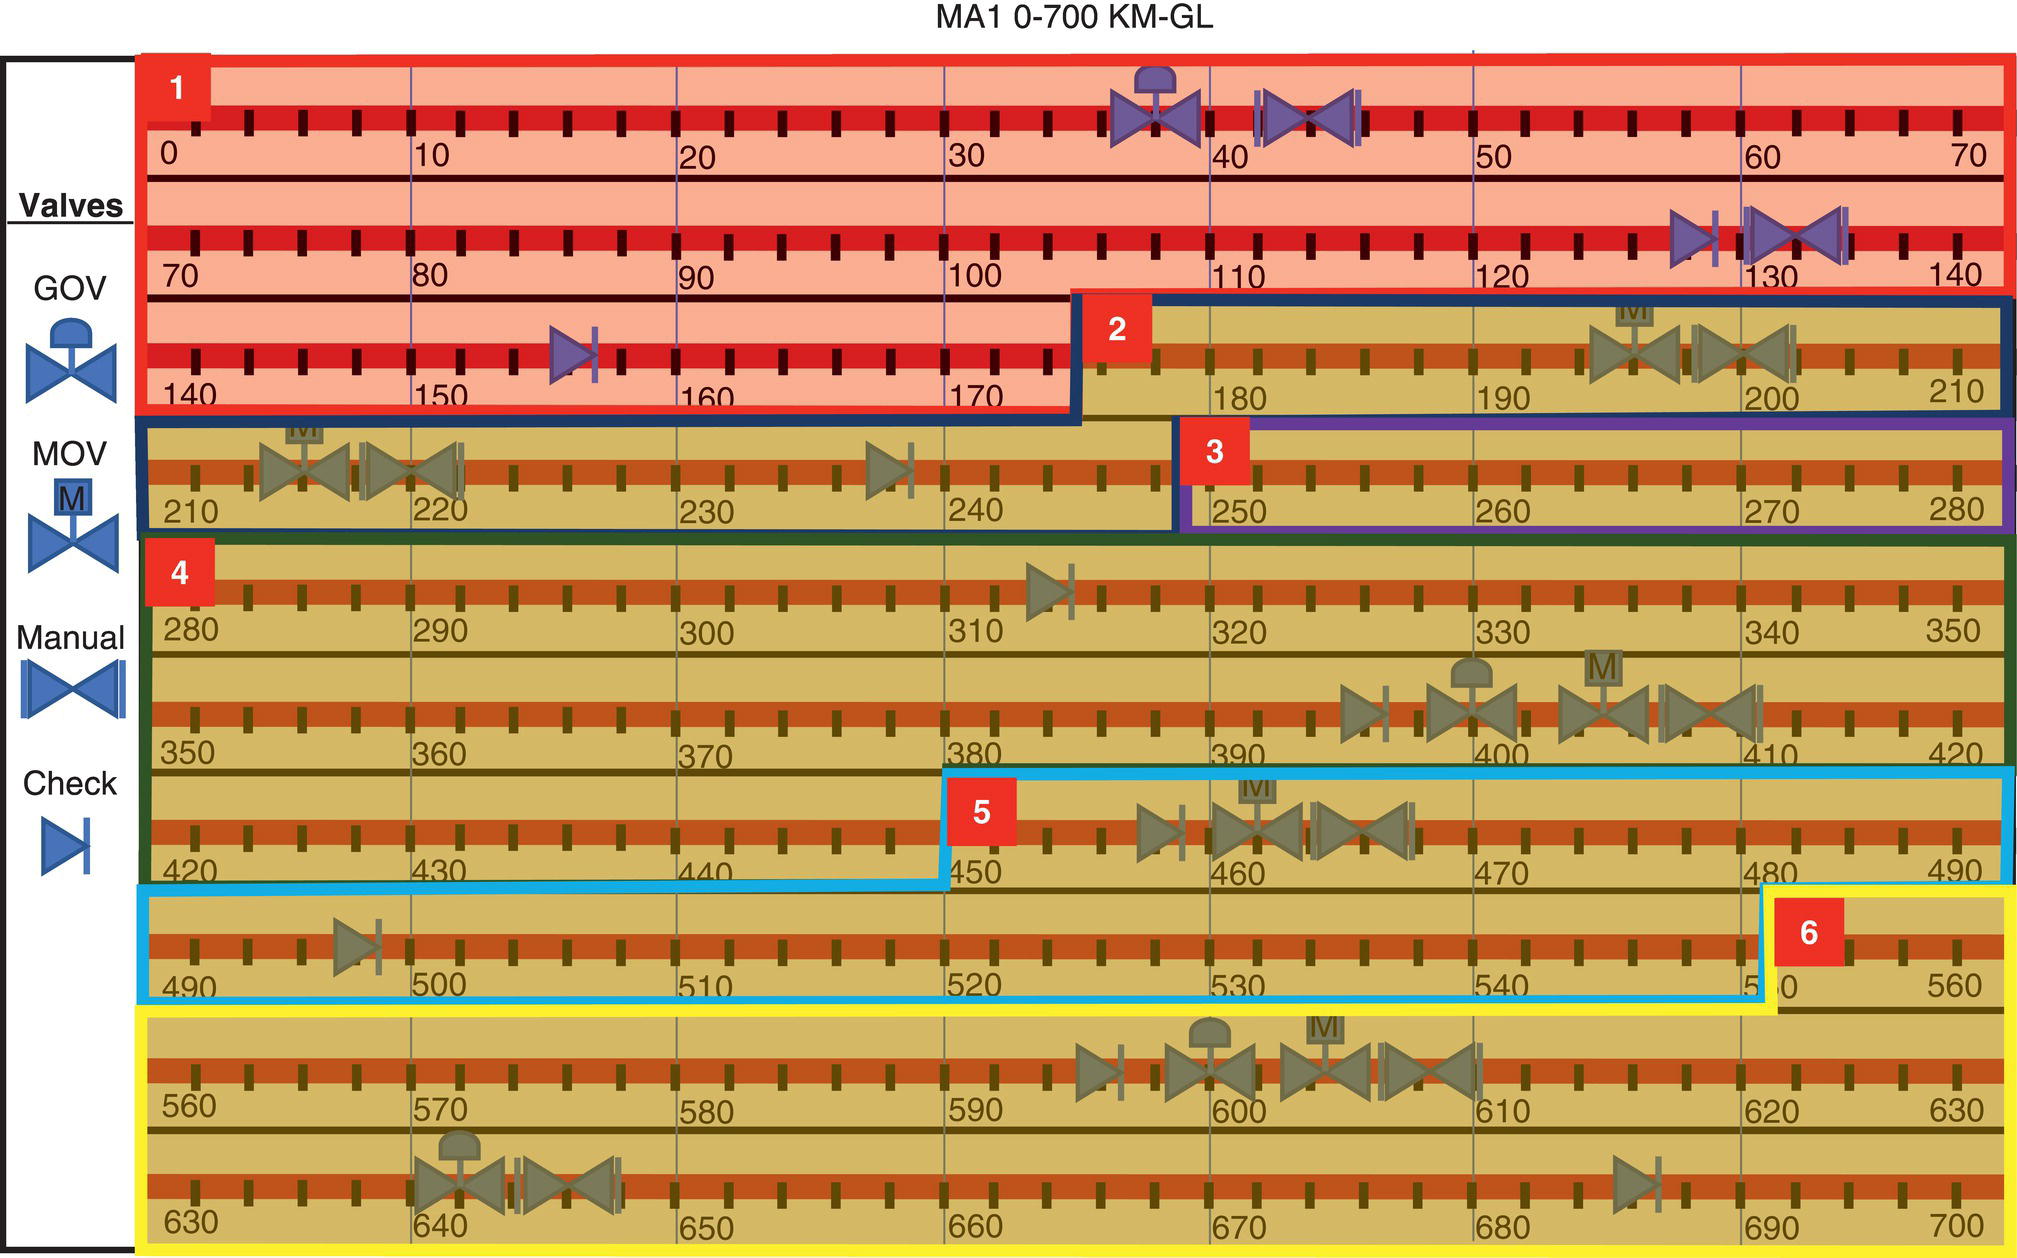
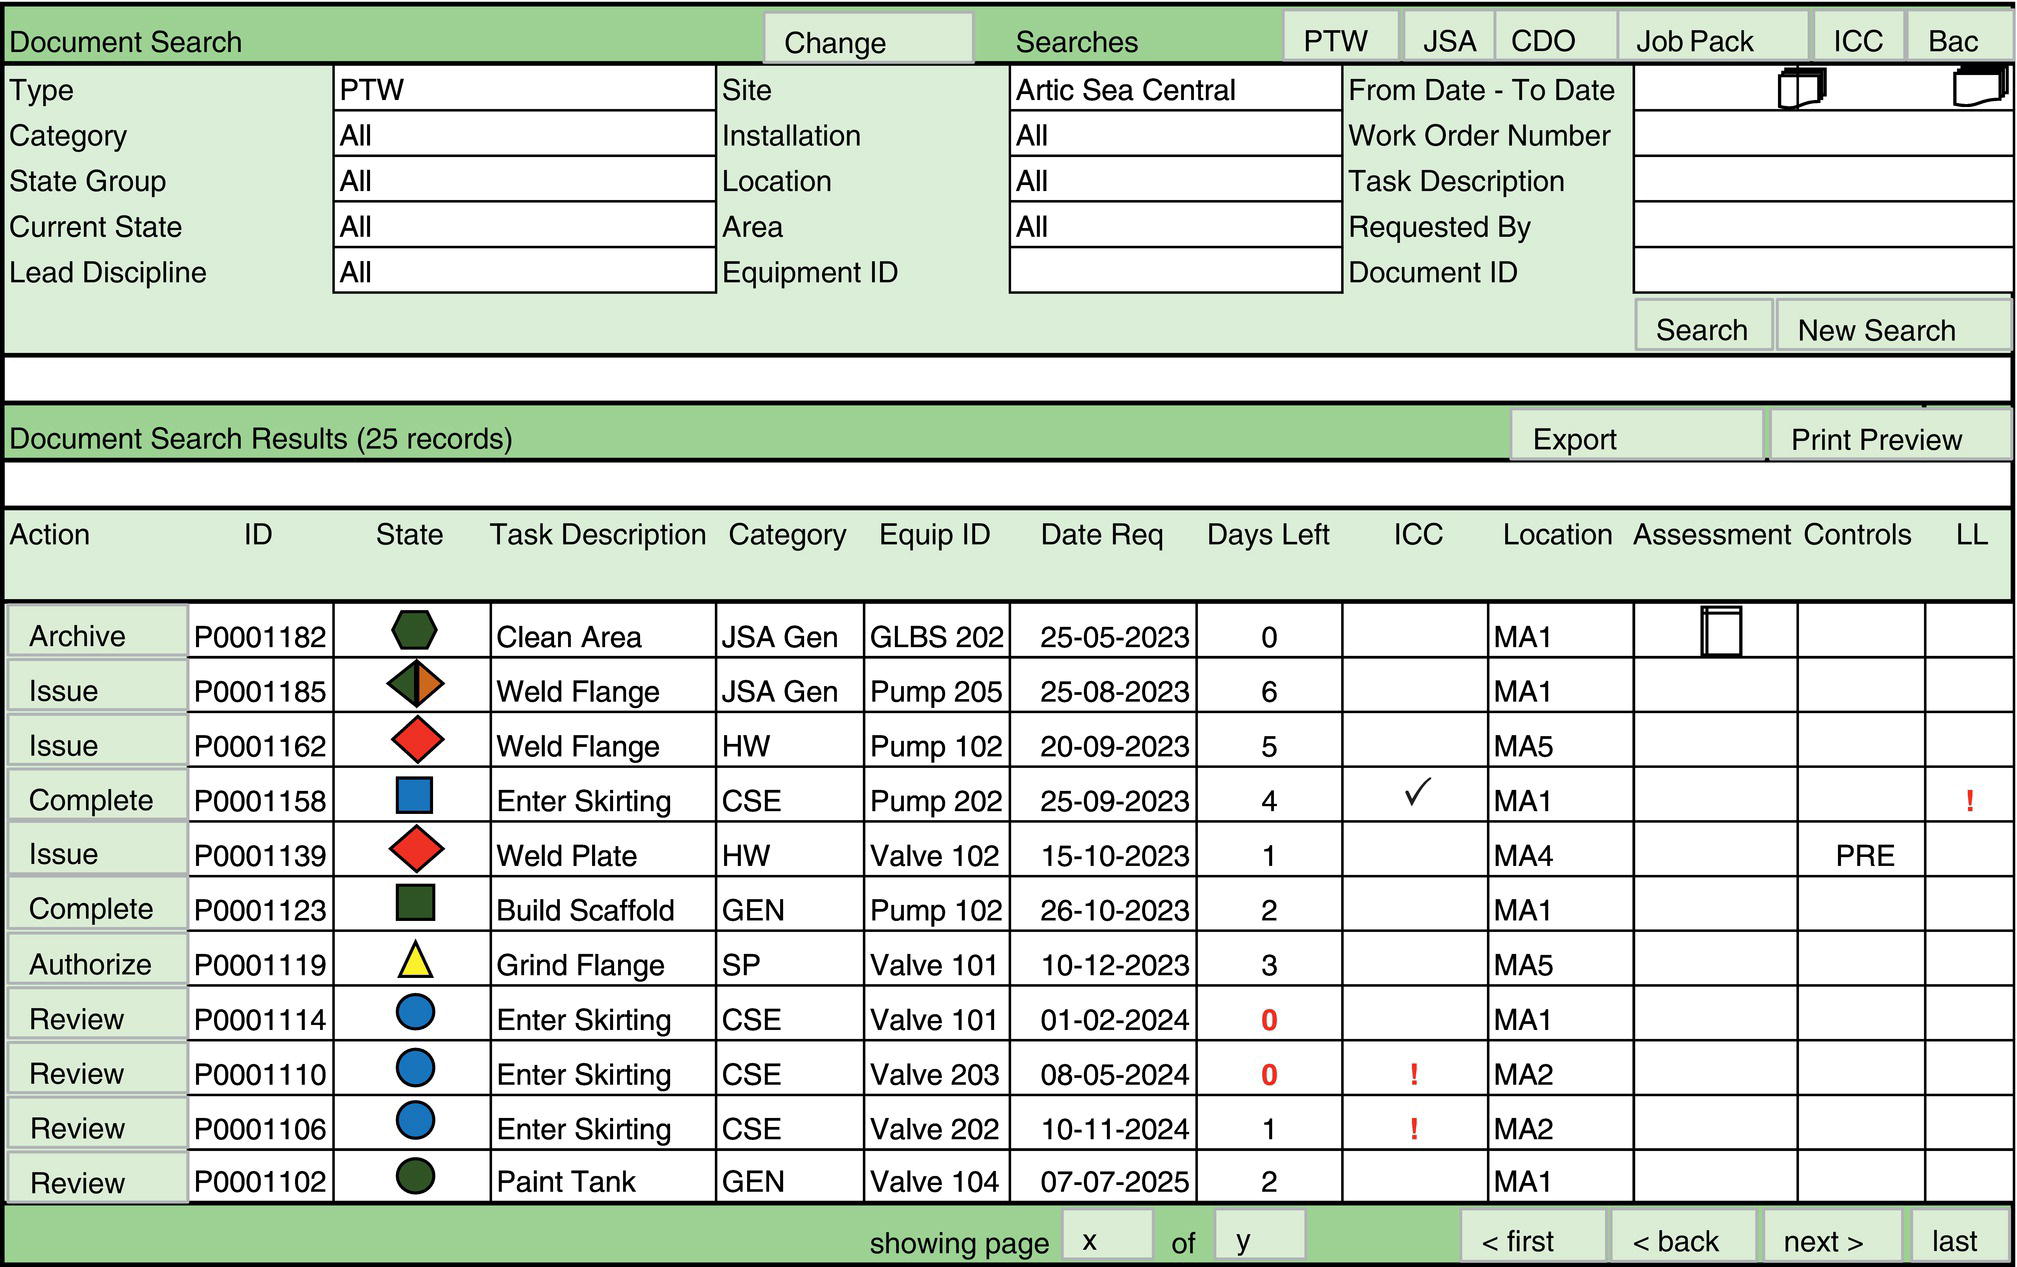
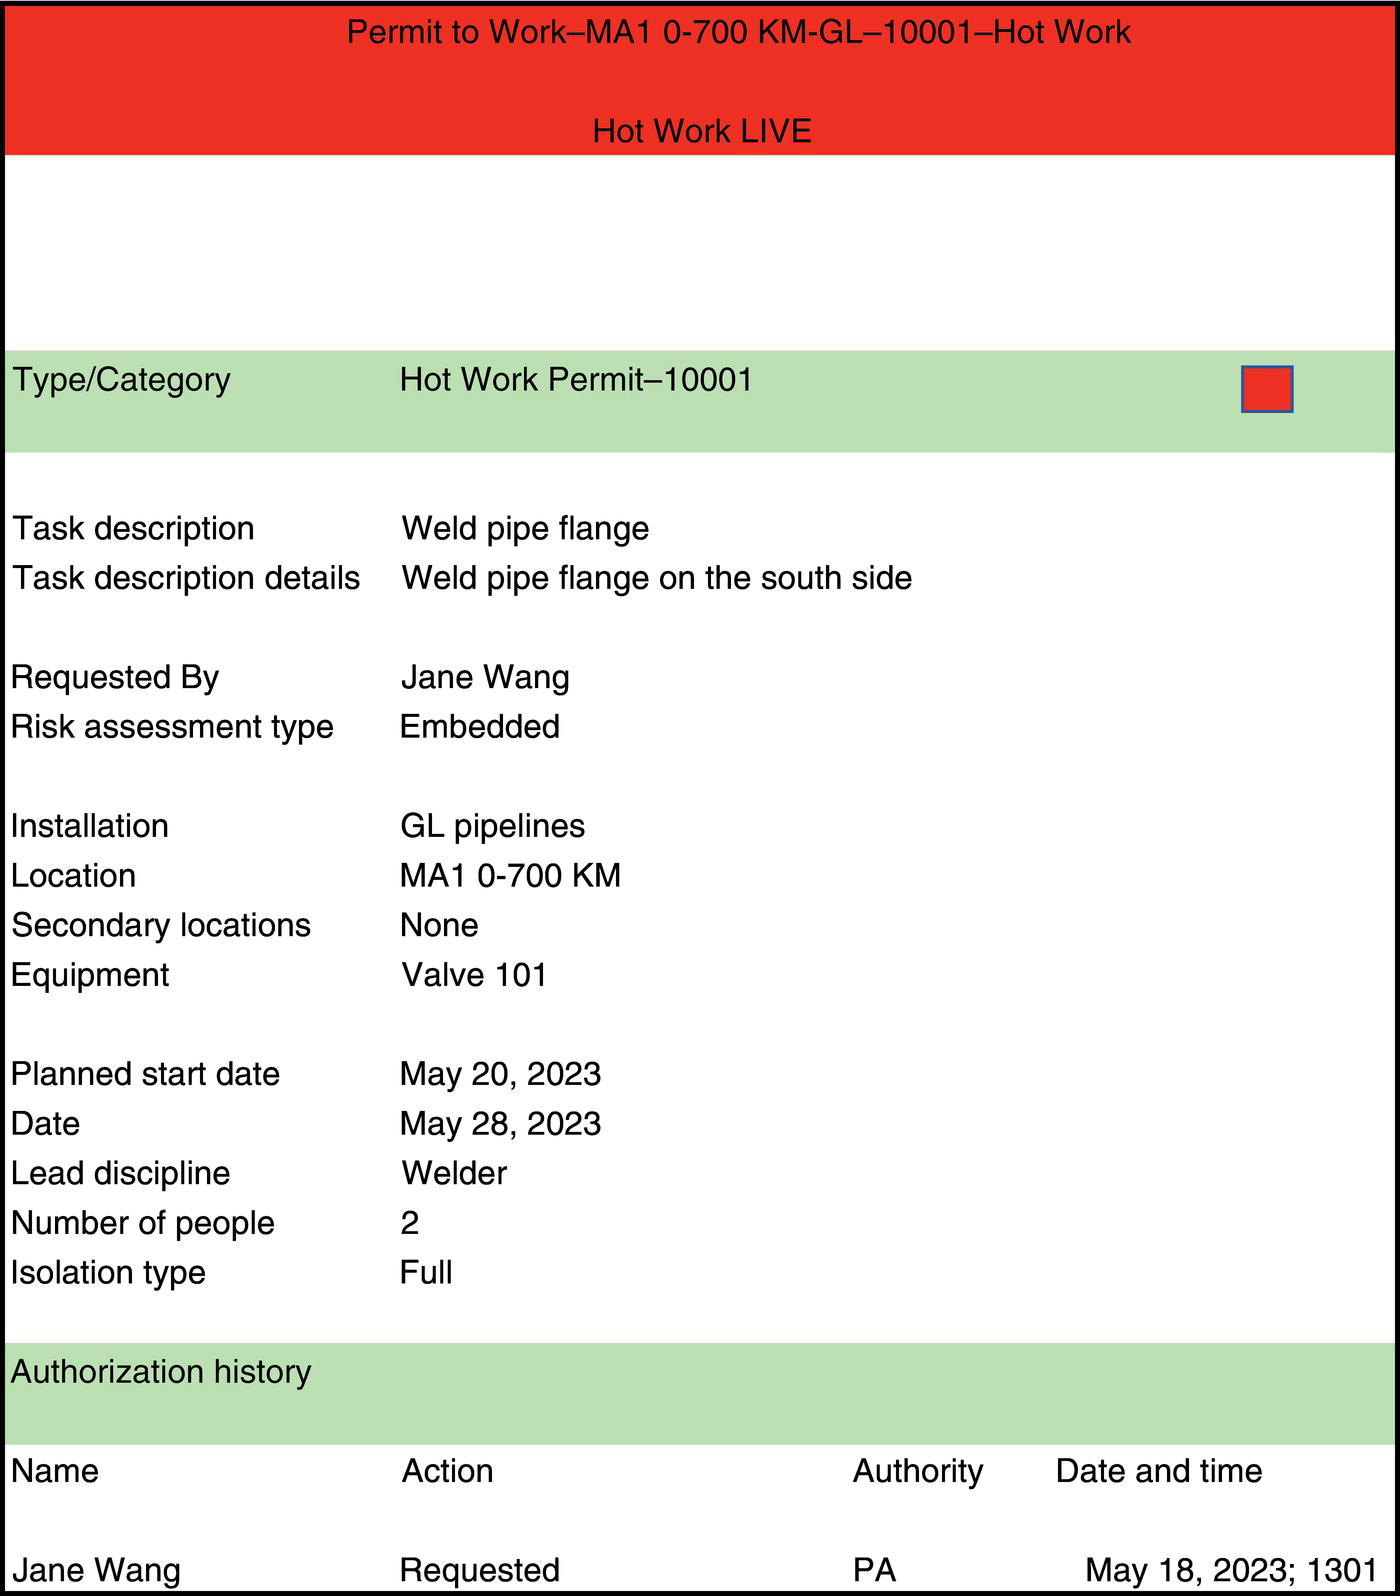
Errol R. A. Eccles Principal Consultant, Risk Slayer ee, Houston, TX, USA Businesses own physical operating assets, whereas operations divisions are in charge of using, operating, and maintaining them. Extraneous, but critical, essential activities, such as maintenance, superimposed on operational processes, may increase complexity, manageability, and risk. When well-managed support processes and systems are in place, operations management improves, leading to excellent operating performance. This is affected by putting controls in place to ensure safety, efficiency, and conformance to production and operational standards. Intrusions into pipeline operations to help ensure excellence include Process Safety Management (PSM), work management, emergency and incident management, competence management, change management, management of change, risk management, and information technology. Of all the intrusion processes in pipeline operations, work management and risk management are the key focus areas of this chapter. The critical and integrated roles of corrosion and integrity management are also discussed. The approach described in this chapter brings the efficiency and safety personnel together and provides a step-by-step approach to achieving work objectives. This approach supports HSE managers, operations managers, and others by providing a framework for implementing changes to make a positive difference in their organizations. By implementing operational intrusions, situational risks are managed, and organizations benefit from improvement in safety and efficiencies, thereby improving productivity, visibility, and reputation. Operations management seeks to convert inputs into desirable outputs in the most efficient manner possible. The operational emphasis is on physical goods in pipelines or pipeline physical processes. Several processes act in support of this or may impact (intrude on) operations management. When these support processes and systems are well-managed, operations management improves, leading to significantly improved operations and reduced costs. In general, even without intrusions, operational processes still need to minimize risks and improve their efficiencies to improve operations and lower costs. This has led some to consider risk management as an opportunity cost, whereby valuable resources could be re-allocated to other activities. However, this is done at the peril of the organization, is ill-advised, and does not lead to appropriate management of operations. There are standards from ASME (ASME B31.4) and ISO (ISO 13623:2017) to help companies design, operate, and maintain their facilities for lower risks. Risks need to be identified and communicated. Risk is managed by using controls to mitigate hazards; e.g., by elimination, substitution, engineering, administration, and protection. Risk management leads to safer operations, a safer workplace, greater efficiencies, and reduced costs as well as environmental protection [1]. That, in effect, is operational excellence. When risks are not adequately considered, there may, and likely will, be accidents or incidents. Major disasters have occurred in industry due to a failure to recognize and/or identify risks and/or remove or mitigate hazards. Some of the major disasters have been These have all had a major detrimental impact on employees (contract and proprietary), the facilities themselves, the companies’ reputations and bottom lines, the environment, and society at large. Asset integrity management (AIM) is based on managing material integrity, which includes corrosion management. Corrosion can be particularly damaging as it may not be directly visible [2]. Risk is calculated as the product of the probability that a specific event will occur multiplied by the consequence of that event. For example, the risk of a pipeline rupture is calculated by multiplying the probability that a pipeline will rupture multiplied by the consequence of the rupture. Consequence is estimated in financial terms and includes all direct and indirect costs, such as cost of cleanup, repair, downtime (non-delivery of energy), legal costs, reparations for damage to life and property, and increased regulation. The US Government, through the Pipeline and Hazardous Materials Safety Administration (PHMSA), contributes to pipeline safety by implementing and enforcing regulations designed to educate employers and employees in responsible work activity. In the larger picture, a study of these regulations through the PHMSA-sponsored courses has directly and indirectly heightened awareness regarding the need for managing risk effectively. Non-intrusional risk assessment may take the form of Front-End Engineering Design (FEED), Pre-Startup Safety Reviews (PSSR), and Process Hazard Analysis (PHA). Further risk assessment constitutes a critical component of operational intrusions and should be required. Risk is assessed by either a quantitative or a qualitative analysis of risk relative to well-defined work or other situation against all identified hazards associated with performing the work. Although qualitative risk assessments can be used for all hazards, a more comprehensive quantitative assessment may be recommended for work and projects involving hazards of greater risk and presumed dangerous to people, property, or the environment, such as when major accident hazards (MAHs) are involved. Three types of risk assessments are It is necessary to address the hazards associated with very critical work activities that have obviously greater risk at a level above and beyond a JSA or a general risk assessment. Work involving entry into confined spaces, open flame hot work, and work on or over live equipment and processes, to name a few, are examples of critical work activities wherein the risk to life, health, and the environment and/or equipment are greater. These are higher-level risks, and so a higher-level of risk assessment (HLRA), quantitative risk assessment, should be undertaken. An independent third-party verification (TPV) by appropriate SME is always recommended for any safety critical element. Quantitative risk assessments are performed by teams of competent persons familiar with the task(s) involved. The team meetings are best reserved to a minimum number of persons attending for the sake of expediency and is led by a facilitator. It is the facilitator’s responsibility to ensure all attendees participate and have an opportunity to voice their opinions and concerns. It is only when a full agreement is arrived at regarding the outcome of the meeting that the assessment can be completed. Quantitative risk assessments require calculations of two components of risk: The risk must be reduced to at least as low as reasonably practicable (normally called ALARP) if the work is to proceed. Then, the risk may be accepted. Otherwise, the work is considered unsafe and is stopped and/or not allowed to proceed. The stop work authority (SWA) must always be formally corroborated as the correct action by a supervisor (as soon as reasonably practicable after the event). For medium-level risks, although a higher-level risk assessment may still be necessary, a medium-level risk assessment (MLRA) is usually sufficient. This may be quantitative or qualitative and will also look at the potential losses and their likelihood. Like a higher-level risk assessment, it will seek to reduce the risks through mitigation measures. Typically, for lower-level risks, a job hazard analysis (JHA), JSA, or other appropriate risk analysis are sufficient. Many risk assessments are considered lower-level risk assessment (LLRA). Although a risk assessment may start as lower level, it may be escalated to a MLRA after a review of the risks. Hazards are anything that can cause harm to people, property, or the environment. Controls are measures put in place to mitigate hazards. One control measure is returning tools to proper storage when not in use. Working at heights is hazardous. Loose tools on elevated surfaces present a hazard to people below. Therefore, a control for working at heights is to secure any loose tools. A risk matrix presents a visual approach to increase visibility of risks and assist with management decision-making. There are several examples of a risk matrix available online, and the type selected should be best-suited to the site preference and easily modified. The risk matrix defines the level of risk by estimating the likelihood or probability and the consequence. A risk matrix is a practical tool that is considered necessary and useful to establish a quantitative level of risk for each identified hazard. An example of a risk assessment matrix is shown in Figure 69.1. On the y-axis, it is shown the probability of an event (how likely or how often an event occurred or can occur) from very unlikely to occur to very likely. The x-axis displays the result in the event that such a probability does occur from mild to severe. Where the two connect on the graph represents a value. An event that is very unlikely to occur (a blowout preventer failure) would be evaluated on the graph as a disastrous result. The two points would meet along the graph at a much higher number for the quantitative score. Note that high likelihood and high consequences lead to a very high risk value. Risk assessments may be periodically reappraised over the life cycle, as operating data are accrued. Typically, this is done via multidisciplined peer review every 1, 3, or 5 years depending on owner company risk aversion and any requirements of asset insurance policies. Figure 69.1 Risk matrix. For more information on risk assessments, please refer to Chapters 67 and 68 in this Handbook and Ref. [3]. The intended goal of efficient pipeline production is to ensure all lines/stations and/or service equipment function consistently and as designed to support the production and operational processes at all times. To manage operations, companies use standard operating procedures (SOPs), shift handovers, shift logs, testing and sampling protocols, etc., all intended to seamlessly communicate for continued smooth and consistent operations. Procedures are a set of step-by-step instructions compiled by the organization to help workers carry out operations. Operating procedures are often transcribed and designated as SOPs, which help ensure consistent equipment operation and pipeline performance among operating personnel while reducing miscommunication, mistakes, and operator error. By definition, SOPs are written by trained and experienced personnel using risk assessment to execute with minimized risk. A checklist is a comprehensive list of actions or steps to be taken in a specific order. Ensuring all required actions are implemented is critical to safety and efficiency. It is critical that checklists include every detail. Checklists help keep important actions at the forefront and are an added layer of protection to ensure that all required actions are completed. Information and data from each shift are recorded in a shift log, which can be described as follows: It is good practice for the shift log to be kept current throughout the work day and updated often to ensure that all important information is included. Shift handover communications provide for continuity of information. The intent is to ensure the shift handover is seamless in providing accurate and up-to-the-minute operational information. The shift log is the primary written communication tool at shift handover, preserving information from being lost if the handover were limited solely to verbal exchanges. In automated venues, the information is more easily, quickly, and correctly communicated so that handover is a more practical and expedient exchange. All elements listed in a shift log format are present in the shift handover when the shift log is utilized. Automating the shift log creates a document within the electronic system. The system design stores the log in its database as a feature of the software capability. Automation makes the shift handover more efficient, without information transfer being dependent on memory. In addition to easy communication and an auditable trail, these are some of the benefits realized through automation: More information on operations management is available in [3]. The overall objective of PSM is to protect life and property. Chemical, petrochemical, and refining operations have adopted PSM, whereas oil and gas producers have more recently moved in that direction after several incidents, including the Macondo disaster on April 20, 2010. The Center for Chemical Process Safety (CCPS) has, for three decades, been a leading process safety organization sharing best practices. The US Occupational Safety and Health Administration (OSHA) 1910.119 define 14 elements of their PSM plan. These 14 elements are interlinked and interdependent. The additional CCPS elements are process safety culture, process safety competency, stakeholder outreach, conduct of operations, measurement and metrics, and management review and continuous improvement. Mechanical integrity requires the on-site employer to establish and implement written procedures for the ongoing integrity of process equipment. Materials must be kept in piping and equipment where they belong, i.e., oil and gas inside the pipe. PSM mechanical integrity requirements apply to the following equipment: Inspection and testing must be performed on process equipment using procedures that follow recognized and generally accepted good engineering practices. The frequency of inspections and tests of process equipment must conform with manufacturers’ recommendations and good engineering practices or more frequently if determined to be necessary by prior operating experience. Each inspection and test on process equipment must be documented, identifying the date of the inspection or test, the name of the person who performed the inspection or test, the serial number or other identifier of the equipment on which the inspection or test was performed, a description of the inspection or test performed, and the results of the inspection or test. Corrosion under insulation is a key inspection item as it is easily missed but is critical. Equipment deficiencies outside the acceptable limits defined by the process safety information must be corrected before further use of such equipment. Work is done by craft personnel (maintenance) and must be managed and controlled. This intrusion into operations is called work permitting. Work permits are control documents authorizing extraneous workers to enter a space to work. This is the essence of work management, also referred to as control of work (CoW). Work management deals with getting work done safely and efficiently. In the past, this was often labelled as “work study” and in the future should have great possibilities for improvement via pipeline artificial intelligence and machine learning) (AI and ML) as applied to both design and operations. Planning can lead to the best use of resources and the most efficient management. Efficient planning needs to account for any and all tasks associated with the planned work so that all work activities and associated resources are considered. Planning should include the entire work scope including supporting work and information, certifications, override of critical devices, confirmations, and associated activities. A key to effective work management is planning work for efficiency and avoiding conflicts. Some work can only be done after other work or tasks are completed. Scheduling is critical for optimal use of resources and adequate safety. Jobs are usually scheduled based on the criticality (priority) of the job, prevailing conditions, and availability of key resources. If there are several jobs to be done, not all may be able to be done simultaneously. In addition, some jobs and tasks are more important than others, and some need to be done before others. Work is managed using a permit to work (PTW) system. A PTW is a control to mitigate the hazards associated with a job by communicating the hazards, ensuring proper vigilance, and executing the work safely. The risk assessment is central to this and may be in the form of a general risk assessment or Job Safety Analysis, embedded in a Job Scope Analysis (JSA), be part of a higher-level risk analysis, or any other fit-for-purpose assessment of risk. Depending on the magnitude and risk level of the work, it may have levels of approval by the owner of the equipment to permit others to come into the work space and work with their equipment. Such work includes those historically found to contribute to fatalities and other incidents of high-consequence risks. Included are hot work, breaking containment, work that has potential to produce sparks, lifting over live equipment, heavy lift, working at heights, excavation and shoring, over-side work, diving work, high voltage electrical, sometimes low voltage electrical, stored mechanical energy, work on live lines, stored chemical energy, etc. The risk is compounded if other work activities are to be planned simultaneously (SIMOPS). A very robust PTW process is needed to manage these situations. In most instances, all risk cannot be eliminated. A decision is taken to accept that the level of risk has been reduced to as low as reasonably practicable (ALARP) to allow work to proceed. If ALARP cannot be agreed upon, the risk must be further evaluated for further mitigation. Without an agreement it is not acceptable for the work to proceed. The work may ultimately not be allowed to proceed. The ALARP condition is readily accepted as a key performance indicator (KPI) although some reluctance to use is still noted. Nevertheless, with fair-minded peer group meetings, important progress can be made, especially when differentiating between alternative material and performance solution options. Quite often deploying the concepts of a SWOT analysis (Strength, Weakness, Opportunity, Threat) within the confines of a FMECA1-type workshop can prove to be extremely valuable. It is imperative to know exactly where the work, certification, override of critical devices, and isolations are occurring to determine the impact, if any, on other work, other certifications, and other operations, etc. This is accomplished by having a graphical representation of the facility, preferably with zooming capabilities. This is most effectively accomplished by employing an electronic system. These names are mapped to the software, so the software can find the desired section. Typically, there is a hierarchy of graphics, which are broken down into enterprise, site, installation, location, and area (see Figure 69.2). In the electronic (digital) system, process hazards/electrical hazards can be shown and colors and shapes can depict where in the lifecycle the documents are. Workers then know what environment they are working in. This is a major feature for work management, PSM, risk management, etc. In this example, Greenland pipelines is the name of an installation. Greenland pipelines can then be subdivided into several locations, one being MA1-0-700 KM-GL. The location can be subdivided into areas such as MA1-0-175 KM-GL, MA1-176-249 KM-GL, and many others. Here, GL is the suffix for uniqueness. The name of the area (zone) is appropriately selected to uniquely represent the geographical area. It is best that process hazards for each area be shown via the graphics. Figure 69.3 shows several locations. The location MA1 can be drawn as depicted in Figure 69.4. It is a good practice to use icons to identify stages of approval of activity (lifecycle) for permitting work and related activities. Icons allow easy identification and communication as to the progress and authorization level in the process. Most of the icon designs are shown in Figure 69.5. Note that a square depicts the LIVE icon—when real activities are taking place. Icons allow for placement of permit locations on the graphics depicting exactly where the work or activity or certification is physically located in a task area. It is suitable to use different colors to distinguish activities and permit types. A key consideration in any activity is the capture, consideration, and application of lessons learned. Reviewing lessons learned from work experience leads to improved quality of work tasks and permit/activity content, enhanced safety performance, and better efficiency. Lessons could be on the documents, the activity, the equipment, etc. When later used, lessons show up as the first thing seen when a permit/activity document is copied if using an electronic (digital) system. Future engineering and testing standards appear to be trending to include lessons learned as nonmandatory addenda. Figure 69.2 Graphics hierarchy. It is very advantageous for a work management system to be IT-based (digital). A web-based and/or cloud-based system can be accessed anywhere a connection is available. Web accessibility provides for transparency, visibility, and control for authorized users. It also allows for easier use and reuse, and significantly improves safety and efficiency by allowing all within an organization to contribute collectively. A wide range of causes lead to and prove the source of accidents and incidents in the course of day-to-day operations. All incidents require managing and response. It is essential for pipeline oversight to be adequately prepared for all emergencies. Incident management is a dynamic and evolving application of input and experiences derived largely from real-life events. In accordance with requirements of the Occupational Safety and Health Administration (OSHA), management must develop and implement an emergency action plan (EAP). The EAP must include procedures for handling releases of materials and energy and the effect on people, the operation, and the greater community. As a secondary goal, it should position the company to recover from any disaster. An emergency plan must be regularly maintained in a structured and methodical manner to ensure it is up-to-date in the event of an emergency. Furthermore, there should be regular drills to ensure that personnel have practiced the response. Employees should have access to these plans so they know what to do in an emergency. By recording incidents in a digital database, lessons can be learned to help make better decisions in the future. A web-based and/or cloud-based system can be accessed anywhere a connection is available and provides for transparency, visibility, and control for authorized users. This significantly improves safety and efficiency by allowing all within an organization to not only collectively contribute but also to have easy access to relevant information. For more information on Emergency and Incident Management, see Ref. [3]. If competence exists, then the ability to deliver is set, subject to errors. Humans make errors, and organizations have to live with them and guard against them. However, organizations do not have to live with incompetence. One cannot just rely on humans to deliver without knowing their competence. Competence and definitely incompetence must be known and be well-managed and certifications assist with this. OSHA defines a competent person as someone who “by way of training or experience, is knowledgeable of applicable standards, is capable of identifying workplace hazards relating to the specific operation and has the authority to correct them.” Figure 69.3 Layout of equipment. Under the OSHA PSM standard, performing MOC is required when making changes that could affect the safety of a facility. It manages equipment, personnel, and operational changes to decrease any negative impact. Typically, equipment changes can be divided into two parts: OSHA 1910.119(l)(1) sets the requirements for MOC as: “The employer shall establish and implement written procedures to manage changes (except for ‘replacements in kind’) to process chemicals, technology, equipment, and procedures; and, changes to facilities that affect a covered process.” Effective MOC involves review of all significant changes to ensure that an acceptable level of safety will be maintained after the change has been implemented. After this review, the proposed change can be authorized for implementation or amended to make it safer. Figure 69.4 Graphical layout on which icons (work locations) can be placed. Figure 69.5 Icons. While MOC is generally used to examine the effects of a proposed permanent change to a facility, it should consider all changes, regardless of the time horizon. Of all of the uncontrolled changes that occur, “temporary” changes are the most frequent cause of accidents and incidents. OSHA 3133 in a clarification says: “MOC procedure should ensure that equipment and procedures are returned to their original conditions at the end of a temporary change.” The “temporary” changes should be managed as “permanent” with special attention to the MOC procedure because they present the highest risk to your business. Eccles [3] has more information on Management of Change. Management of change is a risk assessment appropriate for the change. The basic steps to follow include With Management of Change software, users are able to standardize and streamline the process. Using prebuilt checklists and workflows, steps being missed are unlikely. Instead, the right questions can be asked and all necessary data gathered. A software-based MOC system increases the overall effectiveness of a MOC program. KPIs may include types of changes; number of changes made per month, year, etc. changes made per month, year, etc.; how long the MOC process typically takes to complete. Automated notifications ensure all users are following through with their responsibilities. Centralized access allows workers to hold each other accountable and stay up-to-date on the MOC program. Data reuse is facilitated by the digital database. It is imperative to consider safety risk and its impact on operations, the craft, equipment, and ultimately the cost of operation (hence profitability). The process of assessing overall risk or an overall risk index can be difficult but should be done. A surrogate answer to the determination of the overall risk gives a relative answer. Balancing resources used to mitigate between risks with a high probability of occurrence but lower loss versus a risk with high loss but lower probability of occurrence can be, and often is, mishandled. Oftentimes, safety risk is completely separated from operational risks and costs. This should not be the case, as safety risks are a significant potential cost to the operations and hence the business. Perhaps it is due to the fact that safety risks may not manifest as an actual cost if the risk is appropriately mitigated. It may also be because the safety risk is more challenging to quantify. Perhaps it is because the actual cost is known after the fact when it is, indeed, too late. Risk management also faces the problem of allocating resources. Some believe resources spent on risk management could be spent on more profitable activities. This is done at one’s peril. It is done far too often. Allocating the correct resources to this and being able to assess and see the risk being carried will positively impact safety and hence operations costs. It is prudent to connect and visualize operations, planning processes, maintenance, and engineering with frontline risk mitigation. This likely can only occur using software that provides a risk management functionality and the ability to form the connection and visualization of operational risks. Cumulative risk is the accumulation of risks. Cumulative risk includes all known and reasonable risks from operations and intrusions as shown in Figure 69.6. Using the contribution of all known risks, the total risk is expressed as the sum of all known risks, expressed by the following equation: Practically, this means that it includes all the contributions of permits and types, safety critical device overrides, process hazards, changes, maintenance backlog, emergency preparation, competence position, asset integrity, etc. Each of the contributions can be weighted depending on its importance. The organization should weight them and base them on the practical use of the risks for their environment. The contributions may not be linear but rather could be synergistic (and theoretically contribute to the reduction of risks, through isolations, etc.). If synergistic, the representation becomes Figure 69.6 Cumulative risks. Numbers have to be assigned to maintenance backlogs, emergency preparedness, operations management, MOC, asset integrity, etc. and rated relative to each other. The calculation gives a number or an index that can be normalized to suit the organization. The normalized number gives what the organization considers relatively safe, elevated risks, and high risks. Colors can then be assigned to the normalized numbers as shown in the following example: If under regular operations, it is normally 1–3, then the weightings have been properly set. If it is 1–3 even when there are several hot work permits active in a given operating sphere, then the normalization is not adequate, as it will not give a reasonable account of the risks. If, on the other hand, it is 7–9 (red) under regular operations, then it shows high risks all the time. Note that the proper authority can override the risk by accepting it. If this happens on a frequent basis, the design is incorrect. A balance is reached in the design to properly fit the organization. For more on risk management, see Ref. [3] as well as Chapters 67 and 68 in this Handbook. Once the risk is known, risk mitigation efforts may be undertaken. Risk mitigation measures are usually formulated according to one or preferably more of the following major risk options, which are Closely related to knowing the risks is establishing barriers, or safeguards—barrier management, for risk mitigation. Decision-making is based on the knowledge of the risks. If the barriers to be erected are identified considering the cumulative risks that are involved, the likelihood of the barriers being successful will be improved. In Figure 69.7, Area 1 may not show up as red (index greater than 6) or yellow (index not less than 4) if the risk being carried is normal—a green light. It may show up as red if there are so many activities going on that the risk is elevated to high. The appropriate authority can decide to accept the risk and allow activities to proceed or stop some or all activities and move them to other times so that the risk can be lowered—spread out or removed. The risk information is typically first evaluated by the appropriate authority to decide on whether the risk can be accepted or overridden. If it is 6 or less, operations can continue after consideration of the risks with no need to override. If over 6, the appropriate authority must decide whether to accept the risk and override it or reallocate activities to lower the risk. Referring to Figures 69.2 and 69.7, let us assume that in MA1-0-700 KM Area 1-GL, there is a volatile hydrocarbon, one hot work permit planned, two spark potential permits planned, a confined space entry permit (welding in a skirted facility), one breaking containment permit, the fire water pump is down and hence overridden, a critical controller is out and is not yet on the maintenance priority, and there is a new operator. If all these are active simultaneously for the date and time they were initially planned for, then the area should be a dark color (red, index greater than 6) to show that the risk is very high as shown in Figure 69.7. It would then be prudent to remove most of the activities from that day or shift, until the dark color disappears. In this way, responsible management that is away from the facility can see what is happening at the facility and make better decisions. This is important as catastrophic failures, such as the Piper Alpha disaster, have been attributed to the lack of such near immediate input. Figure 69.7 Barrier management; area 1 is dark (high risk). Intrusions into operations are best supported by systems that are IT-based and combined with the Internet of Things (IoT), increasing safety and efficiency, reuse of information, ability to interact with the supporting software, data mining for KPI, reporting, etc. The IT component should contain the following nonexhaustive components, regardless of the application: The software must be as simple as possible for ease of use and adaptability. Because the platform for any software is ever changing, the platform that is used should be easily changed and updated. In any case, at this point, it is web-based and is best sequel server-based and cloud-based until a better technology appears. The platform should allow the IT department of the client (user company) to ask for relatively small tweaks to fit their business. Future modifications are likely to include AI and ML. The software must provide a level of security commensurate with the company using it. In larger organizations that are more targeted by hackers, the security level needs to be higher with more layers of security. In general, security must be balanced compared with ease of use. Pipeline, pig traps, associated mechanical equipment, integrity management, and associated pressure plant safety issues may also benefit from security advances of software. The software must make key information components visible to users and visitors with access and should be invisible to everyone else. Being web-based, it can be visible from anywhere there is Internet access. The software must allow for a simulated environment where testing can be conducted to determine fitness for purpose and to demonstrate its functionality. The software must allow for a lifecycle that would ensure that only the authorized persons with the correct roles, move that authorization process along from requesting (cradle) to archiving (grave). The software is better when upon inputting the scope of the activity, it determines what are needed. Important full lifecycle record-keeping is therefore vital to ensure smooth transfers of custody as personnel changes occur. The heart of an operational impact document—intrusion document—(permit, JSA, etc.) is the scope and the risk assessment. There are various levels of risk assessments, and the software should be able to perform all. It should also allow for risk assessment to be copied, embedded, or externally referenced (attached). In all cases, it should require acceptance of the risk assessment. If there are disagreements, a FMECA type workshop can be deployed to resolve issues. Such peer group meetings are recommended periodically through the lifecycle. The software must have the capability to add lessons learned. This can pertain to equipment, the process, the documents, the users, or any related activity. These lessons will emerge first when permits are being reused showing the lessons before it can be reused. The latest versions of standards, software, modelling, simulations, etc. must always be used. The software should allow for the archive (library) of used documents. These should be designated good (Archive—can be copied) or not good for reuse (Archive—do not copy). The software should be able to archive automatically if documents are left in certain states for extended periods. Activity documents, including permits, can be easily reused. Reuse allows repeated activities to be much more efficiently applied by taking advantage of information that is readily available. In many instances, easily in excess of 90% of the information can be reused. A software is capable of providing a search feature designed to locate any single document or group pack based on various queries. For example, the documents may be located in the database by unique number, work type, document type, location, requestors, etc. Each copied document is assigned a unique number that sets it apart from all others. Searchability of the software is paramount. It should allow for the search of documents such as permits, JSAs, safety devices override documents, isolations, lessons, risk assessments, equipment, and users. In addition, search screens can be customized for each user. Experience has shown that the search screen is the most used screen for work management. The screen comes with a search query section and a search result section. The screen has a level of configurability—fields can be moved and added. What appears on the screen is limited only by the size of the screen, and hence a choice has to be made as to what should be on the screen. An example of a screen for work management is provided in Figure 69.8. Reporting provides for key periodic sharing of KPIs and other value-added data and have data recorded and evaluated to provide for continuous improvement. A transparent electronic system facilitates reporting processes by making shared information readily accessible by any authorized user throughout the network. In addition, information may be pulled out to make special reports on the success of the system and have this report presented to upper management. When an action needs to be taken to update a document, the system can be designed to prompt the required persons with an email or text, alerting them an action is awaiting their response. The system design can show when the email or text was sent and if/when, it was read. The action itself can then trigger an email or text to confirm that the action has been taken and another action can now be undertaken, if necessary. Figure 69.8 Search screen—one configuration. Every action in the electronic system is recorded in the history. The system will indicate the following: Every step taken leaves an electronic footprint that is critical to maintain the integrity of the operation and provides a transparent trail for management or external regulatory authorities. The software must allow for numbering of the documents. It may be prudent to have different series of numbers for different types of documents. Documents and tags should have barcodes. The software must allow for printing of documents, tags, etc. The printed document needs to include the permits and worksite posttalk signature, etc. Colors and labelling are helpful in demonstrating what activity is being considered. It is best practice to have the document name and number at the top. In addition, it is best practice to have the document color at the top, such as red for a hot work permit. An example is illustrated in Figure 69.9. For more information on IT for all intrusions, see Ref. [3]. Various support processes intrude on operations, which seek to convert inputs into outputs in the most efficient manner possible. The operations are managed by putting controls in place to ensure safety, efficiency, and conformance to production and great operational standards even when impacted by these processes. PSM deals with the safe management of processes by keeping materials where they belong to meet the law and requirements of properly run businesses. PSM was instituted by the authorities to appropriately manage process safety to curtail the loss of life and property. Breakdowns, or anticipated breakdowns, are managed through routine maintenance and other maintenance. The work leads to added risks for operations and maintenance and nearby activities, and must be managed and controlled. This is work management. Graphical display is important in not only work management but also other intrusions, as it shows where the intrusions are and hence the locations of greater risks. Emergency and incident management deals with planning to prevent disasters, planning for disasters, and treating the disasters as soon as they occur. Competence management works to decrease ignorance and the likelihood of people being the reason for accidents and incidents as well as efficiency loss. Management of change involves review of all significant changes to ensure that an acceptable level of safety will be maintained during and after the change has been implemented. Risk management is knowing the risks that are being carried and managing them so that the assets are safe (along with the people and the environment) by using prudent management of data. These are the areas discussed in this chapter, with a view of alerting as many as possible to the consequences and reducing the likelihood of incidents occurring while removing inefficiencies. The process of assessing overall (cumulative) risk can be difficult but should be done. Cumulative risk is determined by considering contributions from all risks to provide an index. A relative measurement of various risks can be developed to provide the index. Such measurement is best done and communicated using an electronic system. Figure 69.9 Sample of a printed document. Intrusions are best supported by systems that are IT-based. This significantly increases the safety and efficiency, the reuse of information, the ability to interact with the supporting software, and the synergies thereof. A B C D E F G H I J L M N O P R S T U V W Writing this chapter would not have been possible without help from many sources. We thank all who assisted in any way including those whose names we have had to leave out for brevity without directly acknowledging them and those we have inadvertently left out. Errol started in this intrusive space with Petrotechnics in 2007. He particularly thanks Richard Hoover as a friend and subject matter expert. Thanks also to William Munro, Randy Brooks, Dorothy Spence, Peter Cowie, Michael Neill, and Simon Jones. Thank you also to Errol’s ExxonMobil colleagues particularly Kieran O’Brien, Nedra Kelly, Tahari Thomas, Rachell Cobb-Valion, Siti Mahmod, and others who helped to sharpen his knowledge. There are many others as well in designing, testing, support, etc. who were outstanding and helpful to him. Throughout the years in this space, the support of friends and family of both of us have been comforting and inspiring, and at times had tangible assistance. We are grateful to Winston Revie for accepting this chapter for this Handbook. We also thank Wiley for their help throughout the publication process. Finally, we would like to thank our family. We love them always.
69
Pipeline Operational Intrusions*
69.1 Introduction
69.2 Operations Management and Risk
69.3 Risk Assessment
69.3.1 Higher-Level Risk Assessment
69.3.2 Medium-Level Risk Assessments
69.3.3 Lower-Level Risk Assessments
69.3.4 Hazards and Controls
69.3.5 Risk Matrix
69.4 Operations Management
69.4.1 Standard Operating Procedures
69.4.2 Checklist
69.4.3 Shift Log
69.4.4 Shift Handover
69.5 Process Safety Management
Process Safety Information.
Process Hazard Analysis.
Operating Procedures.
Training.
Contractors.
Mechanical Integrity.
Hot Work.
Management of Change.
Incident Investigation.
Compliance Audits.
Trade Secrets.
Employee Participation.
Pre-Startup Safety Review.
Emergency Planning and Response.
69.5.1 Mechanical Integrity
69.6 Work Management
69.6.1 Planning
69.6.2 Scheduling and Prioritization
69.6.3 Risk Assessment for Work
69.6.4 Higher-Risk Work—Permitted Work
69.6.5 As Low as Reasonably Practicable
69.6.6 Graphics
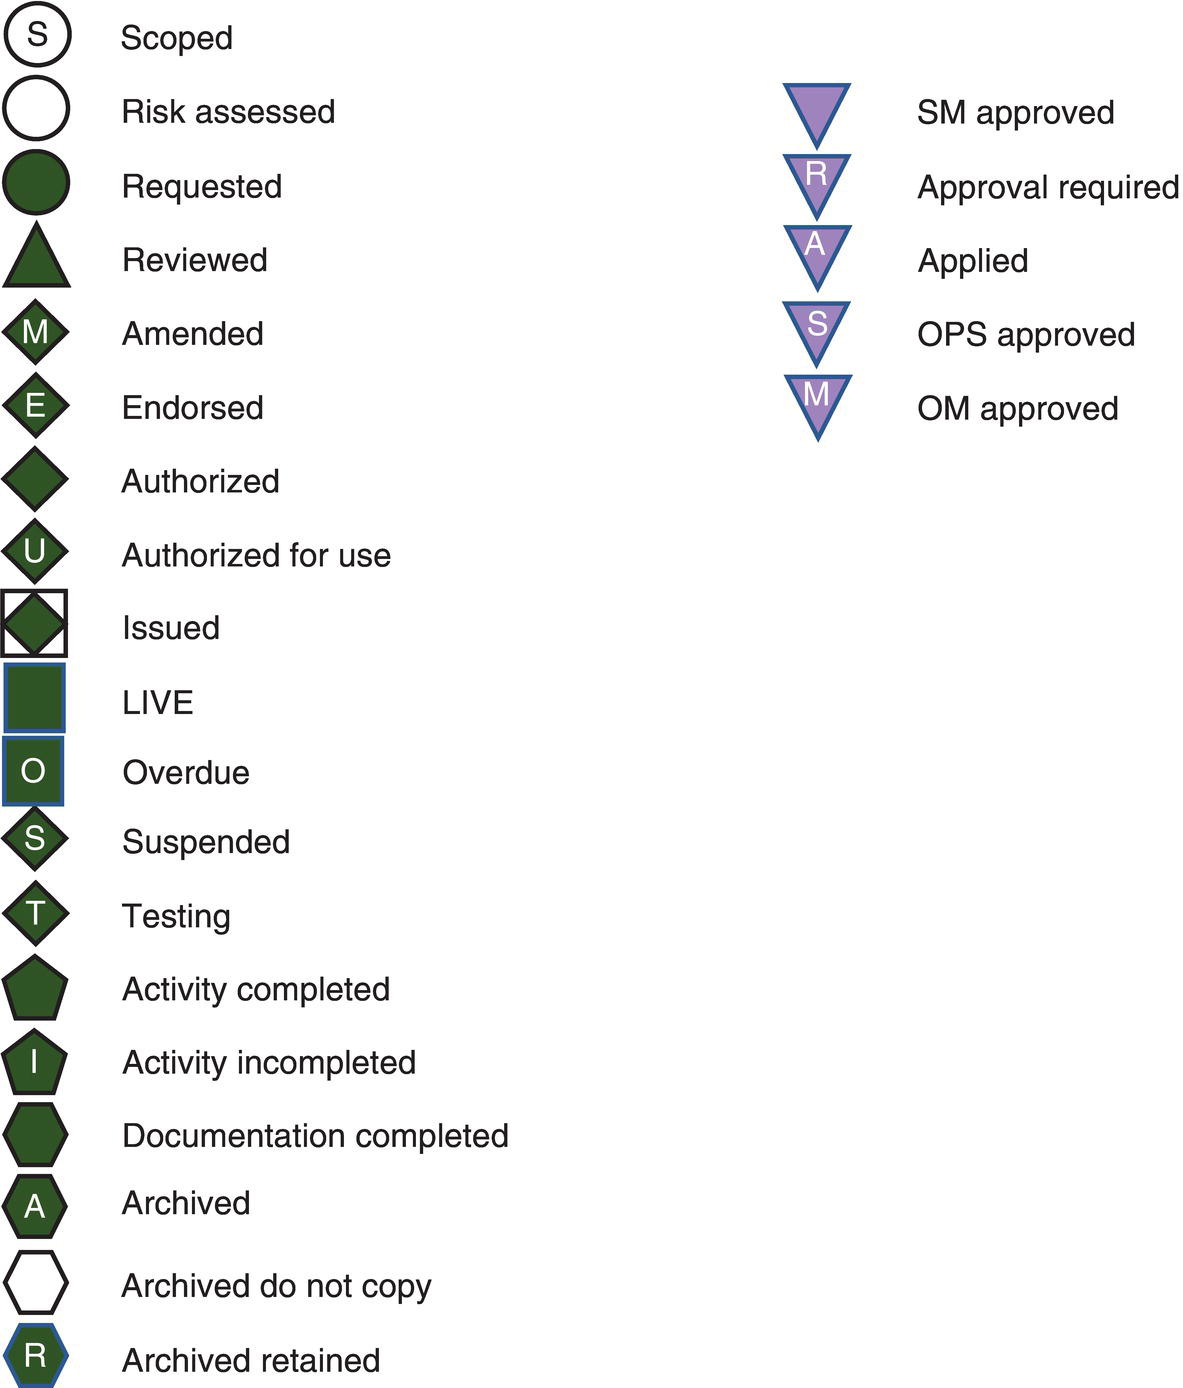
69.6.7 Icons
69.6.8 Lessons Learned
69.6.9 Information Technology
69.7 Emergency and Incident Management
69.8 Competence Management
69.9 Management of Change
69.10 Risk Management
69.10.1 Safety Risk
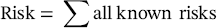
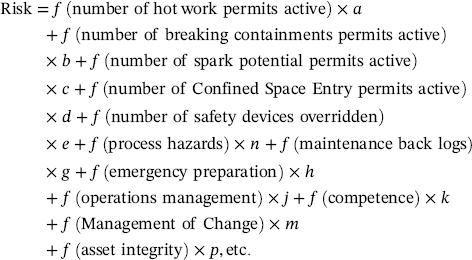
69.10.2 Cumulative Risk
69.10.3 Risk Mitigation
69.10.4 Barrier Management
69.10.5 Example of Risks
69.11 Information Technology
Simplicity
Platform
Enablers
Integrity
Security
Visibility
Testing
Evergreen
Interfacing
Integration
Document upload
User Management
Lifecycle
Risk assessment
Interlocks
Archive
Lessons
Copy and reuse
Speed
Searchability
Spelling
Scalability
OST (on stream time)
Ease of use—user interface
Ease of change
Requested changes
Back-up
Servers
Data management
Data migration
Database
Link to SAP and other systems
Reporting
Audits
Mobility
Email
Texting
History
Duration and days left
Printing
Colors
Numbers
Barcode
External references
Resource center
Action Page
Graphics
Efficiency
69.11.1 Security and Visibility
69.11.2 Digital Risk Assessment
69.11.3 Lessons Learned
69.11.4 Searchability
69.11.5 Reporting
69.11.6 History
69.11.7 Printing
69.12 Summary
Terms and Definitions
Acknowledgements
References
Notes
Pipeline Operational Intrusions
(69.1)
(69.2)