“Sketching is the tool for innovation, and is so vital to the engineering process that it should be taught and used as an essential part of engineering education and professional practice” —(David McCormick, Ref. 317) Our tower malfunction survey (198), summarized in Table 1.1, lists points of transition (tower base, packing distributors and redistributors, intermediate draws, chimney trays, and feeds) as a primary cause of column malfunctions. A good troubleshooting investigation must closely review the relevant points of transition for a possible root cause of the problem. Generating a sketch (or sketches) to scale that will give a clear picture of how this point of transition is supposed to work is the best technique for diagnosing points of transition flaws. Use arrows and colors to show the likely vapor and liquid flow patterns and address the question, “Will it work as expected?” The author does not recommend just looking at the tower drawings. Drawings contain multitudes of details, of which only a few are relevant to the functionality of the point of transition in hand. Too many trees hide the forest. Worse, the important details are often scattered among several drawings, and these details need to be put together to clearly see the full picture. Without a clear picture in your mind, a good evaluation of a point of transition is likely to remain obscure. Clear sketches omit the irrelevant details and focus on the important details. Sketches can be computer-generated or hand-drawn. The sketches need to be drawn to scale. There is no need for high-accuracy, but it is imperative to see the proximity of items to each other. Out-of-scale sketches may mislead. The sketches may include elevation and plan sketches, side views, or whatever is needed to get a good picture of how the point of transition is supposed to work and what the obstructions are in the path of the vapor and/or liquid. In complex situations, a three-dimensional sketch, isometric, a paper, or cardboard model is invaluable. It is important to include all the relevant pieces in the sketches. For example, if a feed pipe is feeding a distributor, it is important to have both on the sketches. Often, the feed pipe as well as the distributor are of good design, but when put together, they generate a problem. Some examples are presented in this section. There appears to be a great reluctance among process engineers to draw sketches. Many clients throw it back at the author. “You do it.” So I draw the sketch. The client sees the sketch and immediately identifies the problem. So what do I get paid for? Drawing sketches. Draw the sketch yourself, and you will figure the problem out and not need an expert. Or if experts are already involved, a sketch will save many of their hours that you are paying for. Drawing sketches should not be used as a “standalone” technique. Once the sketch is drawn, and leads to a suspected issue, it should be combined with other troubleshooting techniques such as field tests, column history and operation experience, hydraulic analysis, gamma scans, temperature surveys, and others. Many of the cases in this chapter illustrate the combination of the sketches with one or more of these troubleshooting techniques. For instance, in the case in Section 8.2, the diagnosis derived from the sketch was combined with hydraulic analysis, gamma scans, and addressing why previous fixes were unsuccessful. Kister, H. Z., T. C. Hower, P. R. de M. Freitas, and J. Nery, Ref. 233. Reprinted Courtesy of the American Institute of Chemical Engineers. In this case study, a flashing feed entering a downcomer bottlenecked an entire olefins plant for 12 years. This bottleneck survived three unsuccessful fix attempts by a major engineering contractor who failed to study plant data, look at gamma scans, and most importantly, draw a sketch. An Olefins plant demethanizer (Figure 8.1a) separated methane and a small amount of hydrogen as the overhead product from C2 and heavier hydrocarbons as the bottom product. The tower had a small-diameter upper section containing 23 valve trays, and a larger-diameter bottom section containing 44 valve trays and also an interreboiler. The demethanizer received four feeds. Three of these entered the upper section above trays 7, 11, and 17. The fourth feed entered the tower swage, just below tray 23. The demethanizer started up in 1978, with the plant producing 46 tons/h ethylene. It operated well at full reflux and an overhead pressure of 30 bars. As the plant’s throughput was increased to 50 tons/h ethylene, the pressure drop in the upper section of the demethanizer (tray 23 upward) rose and the column became unstable. The demethanizer became a plant bottleneck. In an attempt to debottleneck the tower in 1983 and 1986, the following modifications were performed (Figure 8.1a) at the recommendation of a major engineering contractor: The modifications gained nothing. The demethanizer remained bottlenecked at 50 ton/h ethylene. The ethylene losses remained the same. At the capacity limit, there was a rise in differential pressure, massive entrainment (observed as the liquid accumulation in the bottom of the rectifier), and a loss of separation (seen both by an increase in ethylene losses and by warming of the tower top section). These were symptoms of flooding (Section 2.6), initiating somewhere above tray 23 and propagating upward. Figure 8.1 Olefins plant demethanizer bottleneck. (a) Process scheme, showing the fixes attempted; (b) flashing feed arrangement for trays 7, 11, and 17 that brought flashing feeds into downcomers, causing the bottleneck at tray 17. (From Kister, H. Z., T. C. Hower Jr., P. R. de M. Freitas, and J. Nery, “Problems and Solutions in Demethanizers with Interreboilers,” Proc 8th Ethylene Producers Conf, New Orleans, Louisiana, 1996. Reprinted with permission. Copyright © American Institute of Chemical Engineers (AIChE).) As the feeds were mostly liquid (by weight), the peak hydraulic loads in the upper section of the demethanizer were between trays 17 and 23. To debottleneck this section at the 1986 turnaround, a line was connected from the tray 17 feed into the tray 23 feed (Figure 8.1a). A portion of the tray 17 feed was diverted into the lower feed point, so that it bypassed the small-diameter section. With the diversion valve 50% open, a plant throughput of 57 ton/h ethylene was achieved. Although the feed diversion line was effective, it was a control nightmare and an inefficiency. In the next debottleneck, the plant wanted to raise throughput by about 20% with the feed diversion line closed. A debottlenecking study by a major engineering contractor recommended replacing all the demethanizer trays by random packing. A critical evaluation by the plant revealed that in the large-diameter (bottom) part, the existing trays had plenty of capacity and there was no need to replace them. On the other hand, the top section was a bottleneck, so replacing trays by packing appeared justified. Just prior to the modifications, the plant became aware of field data (229) of low random packing efficiencies at the top section of a demethanizer, under conditions of good vapor and liquid distribution. The low efficiency was attributed to the high hydrogen concentration (Case 4.8 in Ref. 201). The plant naturally became concerned. A task force was formed to critically evaluate the need for packing in all upper sections of the demethanizer. A hydraulic analysis showed that at the debottleneck throughput, trays 1–10 and 11–16 would operate at 40% and 55%, respectively, of the closest flood limit. They were capable of handling double the current throughput. Replacing trays 1–16 by packings, therefore, would achieve no capacity gain, would lose separation, and would cost money. Plans to replace trays 1–16 by packings were therefore scrapped (even though the packings and distributors have already been purchased). At the debottleneck throughput, trays 17–23 approached the downcomer choke (Section 2.3). With the packings already purchased, it was decided to proceed with replacing these trays by packings. A minimal loss of separation was expected both because this section contained only a few stages and because this section had the least hydrogen concentration. The hydraulic analysis reopened the search for the root cause of the bottleneck. While the downcomer choke on trays 17–23 was the closest flood limit, it was not expected to be reached until the throughput was raised by 20% and the feed diversion line was closed. In practice, the bottleneck was observed without raising throughput and with the feed diversion line 50% open. Calculations showed that at these loads, trays 17–23 should have been operating at 60% of the downcomer choke and nowhere near any other flooding limit. Another strong argument against the downcomer choke was that in 1983, enlarging the downcomer top area by 14% did not affect the column bottleneck. Had the bottleneck been a downcomer choke, the larger downcomer top area should have led to an improvement. Tower gamma scans were closely examined. The scans showed flood initiation around tray 17, not tray 23. This was unexpected since the hydraulic loadings on tray 23 were higher than on tray 17. Had the tower encountered a tray or downcomer limitation, it should have initiated in the higher loading region, i.e., tray 23. Tray 17 was a feed tray. Points of transition, like feed trays, are spots where major tower bottlenecks often initiate. A drawing review (Figure 8.1b) showed flashing feed entering the downcomer. The literature (192, 198, 285) recommends against this feed entry for flashing feeds. For the tray 17 feed, the vapor content may appear small, about 0.6 wt%, but, 0.6 wt% is 10 vol%, a vapor fraction far too large to be entered into a downcomer. This vapor disengaged from the downcomer liquid and impeded the descent of tray liquid into the downcomer. This in turn brought about a premature downcomer choke limitation. The tower bottleneck, therefore, turned out to be neither the tray nor downcomer capacity. It was a poor introduction of feed. The problem was not unique to tray 17. The feed entries on trays 11 and 7 were just as poor. However, trays 7 and 11 had not encountered a bottleneck yet, possibly due to their large margin away from the downcomer choke. The feed arrangements on trays 7, 11, and 17 were replaced by well-designed feed arrangements. In addition, trays 17 to 23 were replaced by 2-in. modern random packings. Upon return to service in May 1995, the bottleneck completely disappeared. The feed diversion line never needed to be opened again. The 12-year-old feed entry bottleneck ceased to exist. Takeaway This bottleneck could have been eliminated 12 years earlier had a sketch of the relevant point of transition (feed to tray 17) been drawn. In one amine regenerator (63), an upward slot in the flashing-feed distributor caused impingement on the bottom of the seal pan that collected liquid from the trays above. A crack developed at the clamp and propagated, leading to shearing of a portion of the seal pan. Seal loss led to flooding in the top trays and reflux surging into the reflux drum. These were solved by a new seal pan and adding stiffener plates at both sides of the clamping lengths. Upward velocity components of flashing feeds should be avoided. At the least, strong shields should be added to protect internals from their impingement. In the following case study, a participant in the author’s seminar class drew the point of transition sketch that correctly diagnosed the separation problem in a debutanizer tower in his refinery gas plant. This tower separated C3 and C4 hydrocarbons as the top product from C5, C6, and other heavier gasoline components as the bottom product at a pressure of about 150 psig. The tower could not achieve a satisfactory separation. There was a strict purity specification (Reid vapor pressure; essentially, C4 content) on the bottom product which they could not violate. Due to the separation issue in the tower, keeping the bottoms on-spec came at the expense of over-reboiling and sending heavies to the top product. They tower was experiencing 8–10 mol% C5’s in the overhead product, which was an economic loss, and gave a C4 product that was difficult to sell. Figure 8.2 shows the sketch of the feed point of transition, with dimensions in mm. The bottom section of the tower was 10 ft in diameter and contained 4-pass trays. The top section of the tower was 8 ft in diameter and contained 2-pass trays. The region shown is where the feed entered and also where the number of passes was switched from two to four. The following describes how this design was meant to work with reference to one half-tower. The other half was a mirror image of the first. The side downcomer from the last upper tray (tray 19) terminated a short clearance above the floor of a seal pan mounted 460 mm above the deck of the first lower tray (tray 18). The seal pan was extended all the way to about midway between the tower wall and centerline. Flashing feed from the 6 in. pipe, 2/3 liquid by weight, was discharged via slots directed at 45° toward the downcomer external wall. The downcomer wall redirected the feed vapor upward and the feed liquid downward. Liquid from the downcomer would flow under the downcomer wall, join the feed liquid, and together overflow the seal pan weir into a trough underneath. The trough would split the liquid equally between the side and center panels of the 4-pass tray 18 below. At least this is the way it was meant to work. Figure 8.2 Maldistributed feed arrangement to 4-pass trays. With the sketch in Figure 8.2, it does not take long to see why this arrangement would not work. The seal pan would deflect the vapor from the side panel of tray 18 horizontally, and its horizontal momentum would blow the descending liquid into the center panel, just like wind blows the rain sideways. The additional liquid reaching the center panel would generate a higher liquid head there, causing more vapor to break through the side panel. This will intensify the wind, which will blow even more descending liquid to the center panel. A self-accelerating process will initiate, resulting in most of the liquid blown to the center panel of tray 18 and most of the vapor from tray 17 below rising through the side panel of tray 18. The question is whether this maldistribution would only affect tray 18. To answer, consider that the larger liquid flow through the center panel of tray 18 will continue to the center panel of tray 17, again channeling the vapor to the side panel of tray 17 and therefore 16. So this maldistribution would propagate through many trays before it evened itself out, if it evened itself out. This channeling would give uneven L/V ratios on the panels of the lower section, and poor efficiency, resulting in the poor separation experienced in the tower. Another, more subtle issue can also be seen by a close review of Figure 8.2. The bottom of the feed pipe is vertically only 144 mm above the top of the seal pan overflow. This short distance does not give the vapor enough length to change direction and disengage, and it would blow on the liquid in the seal pan. This would shoot more liquid into the center panel, aggravating the maldistribution. Alternatively, some of this vapor may even penetrate under the downcomer wall. Vapor penetrating the downcomer is unlikely to have been the issue here, as it would have caused downcomer flood, which was not observed in this tower. However, vapor penetrating a downcomer by this type of mechanism was observed in another tower (381). In a new tower, it is best to avoid this design. A good practice is to rotate the upper trays 90° compared to the lower trays (192). In an existing tower, rotating is usually not practical, and the least troublesome solution is replacing tray 18 by a chimney tray, adequately designed to provide good liquid distribution to the 4-pass trays below. The disadvantage is the loss of 1 tray, as a chimney tray does not perform mass transfer. However, in the author’s experience, losing 1 tray out of 40 hardly ever makes a difference in performance. When it is important to avoid losing this tray, a clever piping arrangement can be devised and can be feasible with a vertical height of 5 ft like in this tower. However, such piping arrangement can be tricky, especially when the vertical height is 3 ft or less. Additive Maldistribution Many towers contain nozzles to add anti-fouling or anti-corrosion inhibitors. These should be reviewed to provide effective distribution of the additive to 4-pass trays. In one 4-pass C2 splitter tower (266), inadequately distributed methanol injection just above the tower feed was only partially effective for dissolving hydrates. Takeaway The author has been using the Figure 8.2 sketch as a class exercise in his seminars, asking participants to identify the problem after describing the tower. The author has not had a class in which the participants (who never saw this sketch before) have not correctly identified the problem. This shows you the power of a sketch. Figures 8.3 and 8.4 show situations in which feed pipes too close to the downcomer entrance obstructed liquid descent, which stacked up liquid on the tray, prematurely flooding it. The Figure 8.3 case was part of a tower revamp with high-capacity trays that failed to achieve high capacity because the downcomer obstruction by the feed pipe bottlenecked tower capacity. The fate of the tower in Figure 8.4 was much better, because the bottleneck was discovered by an engineer that drew this sketch, used it to identify the problem, and changed the feed pipe design before it would run into the same bottleneck as in Figure 8.3. Reference 104 describes one more similar case in which feed pipes too close to the downcomer entrances became capacity bottlenecks. The tower had five alternate feeds, each with the same piping arrangement. The problem was diagnosed by gamma scans that noticed liquid stackup not only on the tray where the feed entered during the scans, but also on the four alternate feed trays that had no feed going in at the time. Figure 8.3 Feed pipe blocking entrance to downcomer. Figure 8.4 Another feed pipe blocking entrance to downcomer. Reference 406 describes an even worse scenario in which the feed pipe distributor was inside the downcomer, reducing its cross-section area by 60% and bottlenecking the tower. Case 1 (based on Ref. 18) Following a revamp in which internal vapor rates were raised in a fluid catalytic cracker (FCC) main fractionator (MF), fractionation throughout the column degraded. The gasoline top product had an excessive and erratic concentration of heavies (end point varied erratically between 450°F and 520°F). Flooding was suspected. One tower gamma scan showed the column flooding from tray 13 all the way to tray 1 at the top of the column, while other gamma scans showed no flood. The revamp changed all the column internals except for trays 12–14, which were determined to have sufficient capacity. A thorough pressure survey measured a pressure drop of 0.23 psi/tray across the top 13 trays. No pressure points were available to narrow it further. However, vapor sensitivity tests, similar to those described in Section 2.7.1 identified the problem area. In the first test, the vapor load to trays 1–9 was lowered by raising the condensation rate in the light cycle oil (LCO) pumparound (PA). The LCO PA was drawn from tray 12 and returned to tray 10, and increasing condensation there would lower the vapor load on trays 1–9. This did not reduce the pressure drop. In the next test, the vapor rate entering tray 14 was lowered by condensing more in the lower pumparounds, and this effectively reduced column pressure drop and the heavies in the gasoline. The tests clearly indicated flooding starting on trays 10–14, that could be eliminated by reducing the vapor flow to these trays. Both the flooded gamma scan and the field tests focused on trays 10–14. The relevant point of transition, the LCO draw arrangement, was examined using a sketch (Figure 8.5a). It clearly showed the LCO draw box on tray 12 restricting the active area on tray 13 and choking the liquid flow into the tray 13 center downcomer. This was the likely root cause. Case 2 One 8.5 ft ID tower experienced flooding initiating one tray below the 4″ draw in Figure 8.5b as seen by the gamma scans. The draw sump extended to an elevation of about 6″ above the outlet weir of the tray below and choked the entrance to the downcomer. The draw was sized for self-venting flow. Here again the draw sump choked the liquid flow into the downcomer. Case 3 The likely cause of premature flooding in a tower containing 4-pass trays was obstruction of the downcomer entrance by the seal pan and I-beam (Figure 8.5c). The problem was diagnosed by thorough gamma scanning (327). The author is familiar with a retray of a tower handling a foaming system in which lengthening the support I-beams hanging above the center downcomers restricted the downcomer entrance areas and lost tower capacity. Re-shortening the I-beams recovered the lost capacity. Other Cases Ref. 236 and Case 9.9 in Ref. 201 describe another case in which a downcomer entrance choked by a draw sump caused a premature entrainment which bottlenecked a tower. Reference 112 describes a related case in which trusses over the outlet weirs restricted vapor disengagement from downcomers in a high-pressure system, causing premature flooding. Figure 8.5 Draw boxes choking downcomer entrance. (a) Draw box restricting the active area above tray 13 and choking the center downcomer entrance; (b) draw box choking side downcomer entrance; (c) seal pan and I beam choking downcomer entrance. (Part (a): From Barletta, T., Hydrocarbon Processing, p. 69, November 2003. Reprinted with permission. Part (c): Based on Mosca, G., E. Tacchini, S. Sander, D. Röttger, A. Wolff, A. Rix, and G. Schilling, “Upgrading a Super-Fractionator C4s Splitter with 4-Pass High Performance Trays at Evonik Degussa, Marl, Germany”, in Distillation 2009: Topical Conference Proceedings, p. 229, AIChE Spring National Meeting, Tampa, Florida, 26–30 April, 2009. Lack of liquid seal on downcomers or overflow pipes can lead to premature flooding or entrainment propagating up the column. In the froth and emulsion regimes, the outlet weirs usually hold a frothy liquid pool on the trays that keeps the downcomers from the tray above sealed, preventing vapor entry into downcomers. In the spray regime, where the liquid pool may not form due to the low liquid rate (Section 2.11), and in many high-capacity trays that have truncated downcomers, downcomer sealing is achieved by restricting the downcomers exit areas. To seal the bottom downcomer, or the downcomer above a chimney tray, a seal pan is usually used. Alternatively, but far less frequently, this downcomer is extended into the bottom sump or chimney tray liquid and immersed in the liquid. When reviewing bottom sump and chimney tray sketches or inspecting them, it is important to check for adequate sealing of bottom downcomers. When the downcomer is submerged in the bottom sump or chimney tray liquid, it is important to check for excessive submergence. Unsealed downcomers or excessive submergence can lead to premature flooding as illustrated in the following. Case 1 (Figure 8.6a) During the startup of a sour water stripper column (385), the feed flow rate was gradually increased toward the 35 m3/h (154 gpm) design rate. At approximately 60% of design feed rate, the pressure drop suddenly rose and the reflux drum flooded. These are symptoms of flood (Section 2.6). The flood was sensitive to vapor loads but not to liquid loads. Reducing the feed rate or the stripping steam were the only ways of bringing the tower back under control. The column was shut down and inspected. Tray 18 was found bowed downward and had detached from its support clips, as shown by the dashed lines in Figure 8.6a. Other trays in the tower top section were also bowed but remained in place. The damage is believed to have been caused by an excessive step-up in the cold water feed during the startup while the column was full of steam. The cold step-up rapidly condensed steam at the inlet, causing a low-pressure region that sucked the upper trays downward. At the inspection, it was observed that the seal of the tray 19 downcomer had been lost as the side panel of tray 18 (under the downcomer from tray 19) was also bent downward. It is believed that the steam flow from tray 17 traveled preferentially through the tray 19 downcomer rather than through the fixed valves of tray 19. This explained why the top section of the column quickly flooded (evident from a sudden increase in tray differential pressure) and flooded the reflux drum, as well as the vapor sensitivity of the flood. Figure 8.6 Floods due to unsealed downcomers or downpipes. (a) Downcomer unsealed due to tray damage; (b) unsealed chimney tray overflow due to shortened overflow pipe. (Part (b): From Vail, R., and G. Cantley, “Pinch Points: Commonly Overlooked Pieces of Equipment which Result in Flooding and Unit Constraints,” Topical Conference Proceedings, Kister Distillation Symposium, AIChE Spring Meeting, Houston, Texas, March 12–16, 2023. Reprinted with permission.) Case 2 (Figure 8.6b) A refinery vacuum tower (489) had a history of heavy gas oil (HVGO) showing entrainment breaking through the packed (“wash”) bed below the draw. Entrainment was consistent throughout the operating cycle and not associated with coking. A pressure survey showed a liquid head of 450 mm of liquid on the chimney tray, suggesting that the liquid was backed up and covered the chimney opening. A turnaround inspection showed that the overflow pipe (shown in red) was short and unsealed. This allowed vapor to ascend and back up the liquid on the chimney tray. The high liquid level on the chimney tray resulted in entrainment through the bed above into the product, as illustrated in Figure 8.6b. Other cases of seal pan issues observed during inspections are described in Section 10.3.7 and Figure 10.21. Figure 8.7 shows a water removal tray in a gas plant stabilizer (based on Ref. 472). The feed rate to the tower was bottlenecked at 7800 BPD (design 15,000 BPD) by severe carryover from the top of the tower. The liquid on the chimney tray is degassed, and its density is that of the actual liquid. In contrast, the liquid in the inlet downcomer is aerated with vapor bubbles. With a typical downcomer aeration of 60%, the hydrostatic head of the submerged height (about 31 in.), will lift 31/0.6 = 52 in. of aerated liquid in the downcomer. In addition, the pressure drop of the tray above plus the friction of liquid flowing under the downcomer bar will add another 10 in. or so of aerated liquid, causing a downcomer backup to exceed the 60 in. tray spacing and initiating downcomer backup flood. Shortening the outlet weir height of the chimney tray from 33 to 11 in. solved the problem and the stabilizer reached its design capacity. Reference 265 describes a similar experience. This was an olefins condensate stripper with an internal head forming a sump for water removal. The top of the overflow weir was about 3 ft below the tray above, and the submergence of the downcomer in the tray liquid was about 5.5–6 ft. There was enough density difference between the degassed sump liquid and the aerated downcomer liquid to back up liquid all the way to the tray above. Removing the tray above, which raised the spacing above the overflow from 36 to 57 in., along with tray changes in the section above the chimney tray, solved the problem. In a third case, a primary absorber in a refinery coker unit experienced premature flooding right above a large chimney tray that was collecting liquid to be drawn for a cooling loop. Here, the downcomer submergence in the chimney tray liquid was 23 in., and the space between the top of the overflow weir and the tray above was 27.5 in. The aeration of the downcomer liquid in this case may have been slightly less than 60% as the system tends to be slightly foamy. Here too, the degassed liquid on the chimney tray pushed the aerated liquid in the downcomer to the tray above. A fourth case (125) is described in Section 9.2.6 and in Figure 9.20b. Here, the high submergence of a downcomer in a seal pan drawing liquid to an intercooler loop in an FCC hydrocarbon absorber caused tower premature flooding. The author has a number of other similar experiences. Another type of problem is liquid vaporization in downcomers or downpipes submerged in hotter bottom sump liquid. In one case (489), such vaporization choked a line from a chimney tray to a once-through thermosiphon reboiler that passed through the hotter bottom sump. The choke backed up liquid above the chimneys, which in turn flooded the column. Figure 8.7 Downcomer submergence in chimney tray or sump liquid can bring about premature downcomer backup flooding on the tray above. Kister, H. Z., B. Blum, and T. Rosenzweig, Ref. 236. Reprinted Courtesy of Hydrocarbon Processing. As part of a revamp to maximize capacity of an FCC main fractionator, the light cycle oil LCO and heavy cycle oil (HCO) draw/pumparound off-take trays were replaced by total-draw chimney trays. The purpose was to minimize reflux to the tower section below. Excess reflux induces additional liquid and vapor recycle that consumes capacity. The reflux was minimized by careful monitoring and control while avoiding any fluctuating leakage or overflow from the chimney tray above. Each chimney tray was to be seal-welded. A schematic of either chimney tray is shown in Figure 8.8a. Liquid, from the two-pass tray above, descended via side downcomers, which terminated in seal pans. All liquid from the chimney tray was drawn from a sump (not shown) located right beneath the chimney tray. The downcomers from the chimney tray to the tray section below were converted to overflows by raising outlet weir heights to 612 mm. Normal liquid level on the chimney trays was about 300 mm and the overflow downcomers were inactive. However, should an upset occur and the chimney tray liquid level exceed 612 mm, the liquid would overflow into the downcomers. At the design stage, the seal pans and the chimney tray were on different drawings, which had been approved for fabrication. A last-minute drawing review put together the sketch in Figure 8.8b, which revealed a major flaw. The vapor issuing from the outside chimneys and blowing toward the tower wall would blow liquid descending from the seal pan directly into the overflow downcomers. Thus, despite the seal welding of the chimney tray, liquid would bypass it. Figure 8.8c shows how the problem was circumvented. The openings of the outside chimneys that would blow vapor toward the wall were closed. A 25-mm vertical drain lip was installed at the bottom of each seal pan to prevent the issuing liquid from crawling underneath and ending in the overflow downcomers. Figure 8.8 “Leak-proof” total draw chimney tray. (a) Initial design; (b) expected flow patterns; (c) modifications to circumvent liquid bypassing the chimney tray. (From Kister, H. Z., B. Blum, and T. Rosenzweig, Hydrocarbon Processing, p. 101, April 2001. Reprinted Courtesy of Hydrocarbon Processing.) Takeaway For troubleshooting points of transition (feeds, drawoffs, bottom sumps, chimney trays) you do not need an expert. You need a sketch. Without a sketch, even an experienced troubleshooter can miss a key issue. Case 1 In an FCC main fractionator (see Figure 8.9a), the tower bottoms (“decant oil”) was a small heavy, carbon-rich stream used as feedstock for battery production. The quality of this stream is often expressed as API gravity, with a typical value of −1. The first distillate stream drawn from the fractionator was LCO, which was also the most valuable product from the fractionator. In between the LCO draw and the bottom, there were two fractionation sections (one trayed, the other packed) as well as two PA sections in which heat was removed by direct contact with externally cooled circulating streams. Following a revamp in which the trays in the HCO PA section were replaced by packings to increase capacity, the fractionator experienced low LCO yield. The trays below the HCO draw appeared to work well and did not dry up, as seen by the temperature indicator at the bottom tray, which was always relatively cold. The decant oil product flow rate, about 3000 BPD before the revamp, more than doubled to 7000 BPD after the revamp, and its API gravity was around 6 to 7, making it too light and unsuitable as battery production feedstock. It appeared that the lost LCO yield ended in the decant oil. Figure 8.9b shows the HCO PA draw. It was a chimney tray with submerged side sumps from which the HCO pump took suction. Liquid to the distributor below descended via a center downcomer. The downcomer rose 24 in. above the chimney tray floor, so that it only took the overflow. The chimneys were 29 in. tall. The center downcomer stretched from one wall to the opposite wall, so liquid could not cross it from side to side. The chimneys had considerable gaps between them, allowing liquid equalization on each half-tray. Attempts to raise the LCO draw rate led to cavitation of the HCO PA pump. Cavitation of the pump means that the level on the chimney tray was lost, but during this time, liquid still appears to be descending down the tower, as suggested by the cold wash temperature and the high decant oil API gravity. Figure 8.9 Liquid getting past another “leak-proof” chimney tray. (a) Bottom section of FCC main fractionator; (b) how the liquid bypassed. A close observation of the sketch in Figure 8.9b shows that while the chimneys have hats, the downcomer does not. This means liquid from the bed above rained into the downcomer. The cross-section area of the center downcomer was 10% of the tower cross-section area. Assuming the liquid rained equally from the packed bed above, 10% of the flow at the bottom of the bed would rain directly into the downcomer without overflowing the weirs. The PA circulation rate was 60,000 BPD, not including condensation, so at least 6000 BPD directly rained into the downcomer, and most would end in the decant oil. There are a number of ways of solving this problem. An umbrella over the downcomer is a simple solution, but its engineering can be tricky. Alternatively, since the LCO is far more valuable than the decant oil, there is incentive for maximizing it. This will best be achieved by bringing reflux back as flow-controlled pumpback from the discharge of the HCO PA pump, and eliminating the downcomer. A participant in the author’s seminar class struggled with the problem for a few months. At the author’s recommendation he drew the point of transition sketch overnight, and the next morning had the problem correctly diagnosed. Magic. Case 2 A refinery vacuum tower had problems with liquid getting past the light vacuum gas oil (LVGO) collector chimney tray. As a result, much of the LVGO ended up in the lower middle vacuum gas oil (MVGO) cut. The chimneys were rectangular, about 5 ft long, and had sloping hats (Figure 8.10). The hats did not have any overflow weirs on any side. So liquid dripping on the hats flowed along the slope, with nothing stopping this liquid from wrapping around the hats and dripping into the chimneys. The slopes were very small, about 1 in. per 5 ft. The high, narrow edge of each hat, as well as the sides, were open. During a turnaround, the engineers noticed water marks showing liquid flowing down the slope of one of the middle chimneys and pouring into the open high, narrow end of the chimney in front. The narrow end openings were then closed, but this gave only a small improvement. The main path of liquid descent was by wrapping itself around the hats and pouring into the chimneys. Figure 8.10 Liquid getting past yet another “leak-proof” chimney tray. Liquid collected on one hat flowing into the space between the chimney and hat in front. Case 3 A (Section 7.3.4) A refinery atmospheric crude tower experienced instability at the jet fuel draw and loss of jet fuel to a lower product. The root cause was some of the liquid overflow from the seal pan above falling into the wrong compartment. This was identified by the sketch in Figure 7.39. Case 4 Watching out was recommended (429) for liquid dumping through overflow pipes located right beneath seal pans, overflow pipes with no hats under packed beds (similar to Case 1 above), chimneys with flat hats (Case 9.5 in Ref. 201), or hat diameters not larger than the chimneys. Chimneys (risers) blocking liquid flow toward the draw sump on chimney trays incur excessive hydraulic gradients. This may lead to overflows and allow liquid bypass getting past the chimney tray to the section below. Figure 8.11 Overflow due to hydraulic gradients on chimney trays. (a) High hydraulic gradient causing overflow; (b) good design, no hydraulic gradients and no overflow. (From Kister, H. Z., B. Blum, and T. Rosenzweig, Hydrocarbon Processing, p. 101, April 2001. Reprinted Courtesy of Hydrocarbon Processing.) Case 1 (236) In a packed refinery vacuum tower, valuable HVGO was drawn from a total draw chimney tray. The tower experienced HVGO loss to the residue leaving from the bottom. The lighter gas oil lowered the viscosity of the residue, making it unfit for asphalt. Penetration (a test in which a standard ball is dropped into a container of product, and the distance it penetrates is a measure of the viscosity) was high (∼20 in., compared to ∼2 in. for good asphalt). Figure 8.11a shows the chimney tray. The long edges of the chimneys perpendicular to the liquid flow narrowed the flow area around each chimney. This generated a large hydraulic gradient. On the opposite side from the outlet draw, the liquid rose to the chimney height and overflowed into the chimneys and then onto the tower bottom, lowering the viscosity of the residue. A good chimney tray design (Figure 8.11b) minimizes hydraulic gradient. In this existing tower, an easier and cheaper solution was to rotate the tray in Figure 8.11a by 90°. This solved the problem, eliminating the HVGO loss to the residue, and restoring good penetration of the residue. In a related case, the same issue occurred and was resolved by raising the heights of the chimneys on the side opposite of the draw at the high end of the hydraulic gradient. Other cases The author was involved in numerous incidents where chimneys obstructed liquid flow, causing excessive hydraulic gradients and overflows. An additional case is described in Section 4.6.3. The system limit flood (Section 2.2) occurs when the upward vapor velocity exceeds the terminal velocity of the large drops. At a point of transition, piping and column internals consume a significant portion of the tower cross-section area, leaving a restricted passage area for the rising vapor. In the restricted space, the vapor velocity may exceed the system limit. For as long as only vapor flows through this restricted passage, there is no problem. However, if liquid attempts to descend into this passage, the vapor velocity will prevent it from doing so. Instead of going down, the liquid will accumulate above, initiating flood. A system limit flood at a point of transition will give the same symptoms of a regular flood (Section 2.6): pressure drop rise due to the liquid accumulation above, massive entrainment from the top of the tower, a possible reduction in bottom flow rate, and loss of separation. Symptoms unique to this type of flood include the trays or packings in the tower operating well below the calculated flood point, and gamma scans showing the initiation of flooding at that point of transition. System limit flood at a point of transition can be vapor- or liquid-sensitive. Being a system limit flood would inherently make it vapor sensitive. However, often the vapor velocity at the restricted passage area is well above the system limit. As long as no liquid enters the restricted passage region, there will be no system limit flood. So the flood will occur only when liquid attempts to enter the area, regardless of the vapor rate. In this case, it will be liquid-sensitive with no vapor sensitivity. So there may or may not be a liquid sensitivity. This will be further discussed in relation to the cases described below. The possibility of a system limit flood should be checked whenever there is a restricted passage space at the point of transition for which both liquid and vapor compete. The check is a system limit calculation based on the restricted passage area. The system limit criterion in Section 2.16, i.e., a C-factor of 0.45 ft/s, is an excellent approximation for hydrocarbon and organic systems at less than 100 psia and when the liquid flow through the restricted opening is less than 20 gpm/ft2. Outside of this range, it is best to check using the Stupin and Kister correlation (463), which can be found in Perry’s Handbook (245). It is important to note that the above criteria for system limit flood are based on large liquid drops. However, in many points of transition, the liquid downflows not as drops but as sheets of liquid along the wall. Sheets are more difficult to entrain. In this case, both the Stupin and Kister correlation and the C-factor criterion above will give conservative predictions. When looking at the sketch, it is important to evaluate whether the liquid descent is more likely to be drop-like or sheet-like, and apply the criterion accordingly. The Diehl and Koppany correlation (85) is for flooding in vertical heat exchanger tubes, where the liquid tends to descend as a film along the tube walls, and is therefore suitable for sheets of liquid descent pattern. The author has had excellent experience with this correlation, which is also found in Perry’s Handbook (245). Case 1 Packing distributor overflows When a packing distributor, or redistributor, or a chimney tray overflows, liquid enters the vapor passages. The typical vapor rise area is 50%, 25%, and 25% for trough distributors, pan distributors, and chimney trays, respectively. With C-factors of high-capacity packings often approaching 0.4 ft/s (Section 2.16), a pan distributor or chimney tray overflow is likely to induce system limit flooding. Trough distributors have a better chance to remain unflooded when an overflow occurs, especially when they contain well-designed overflow guide tubes that keep the overflow out of the vapor passages. Further, the overflowing liquid often descends as sheets along the trough walls, which is beneficial. So trough distributors may or may not flood upon overflow. Figure 4.6 shows a turnaround water test of a packing pan redistributor in a caustic absorber that overflowed at below the design liquid rates. In the absence of vapor, the overflowing water had no problem descending into the riser. During operation, the vapor velocity through this riser was far too high to allow the liquid descent, and upon overflow, the tower flooded with caustic carryover from the top. A flood resulting from distributor or redistributor overflow is always liquid-sensitive. Without an overflow, there is no flood. Once the liquid rate is raised, the liquid head in the distributor rises and overflows upon reaching the top of the risers. Lowering the liquid rate makes the flood go away. With trough distributors and redistributors, there is often also vapor sensitivity. If the vapor load is not very high, the overflowing liquid will descend, but raising the vapor load will initiate flooding. Case 2 Vapor space at a seal pan overflow A tower flooded at 80% of the calculated tray flood rates, seen by an increase in tower pressure drop. Gamma scans also showed flood, starting at the bottom tray. Downcomers from the bottom tray terminated in two wide seal pans, from which the liquid flowed to two once-through thermosiphon reboilers (Figure 8.12a). The reboiler return nozzles were located below the seal pans. The wide seal pans blocked much of the tower cross-section area, leaving a restricted passage space between them. The reboiler draw nozzles were undersized, and unable to take down all the liquid descending from the bottom tray, so some of the bottom tray liquid overflowed the seal pans. Ascending vapor and descending liquid competed for the restricted passage space between the seal pans. Applying the system limit correlation (463) showed that the tower flood coincided with the exact rate at which the vapor velocity at the restricted passage space reached the system limit flood velocity. Figure 8.12 System limit troubleshooting at points of transition. (a) Premature flooding in tray tower, due to system limit between the overflowing seal pans; (b) premature flooding initiating at redistributors hats, as C-factor between hats exceeded the system limit. The bottleneck was eliminated by increasing the size of the draw nozzles and rundown line. The larger pipes took all the liquid to the reboilers, eliminating the overflow and, therefore, also the system limit. Case 3 Large redistributor or chimney tray hats Figure 8.12b shows a redistributor between two packed beds. Liquid from the upper bed descends into the redistributor, no collector. The redistributor risers are covered with hats a short distance above to prevent liquid from the bed above from raining into the risers. A common hat design is shown on the lower plate in Figure 4.22. Liquid collected on the hats descends over the short edges, with a short lip protecting it from being blown by the vapor. Short weirs (typically 2 in. tall) avoid liquid downflow along the long edges of the hats to prevent it from being reentrained by vapor exiting the risers. Vapor from the risers competes with the liquid descending from the bed above in the restricted passage space between the hats. The rectangular hats occupy some of the cross-sectional area, often 20–30% of it. This means the C-factor between the hats will exceed the C-factor in the bed by 20–30%. When the bed is operated at high C-factors, premature flooding may initiate between the hats. A similar situation will develop above chimney trays in packed towers, where the hats consume a considerable fraction of the cross-section area. There is a moderating factor in this situation. The weirs on the hats are short, so some liquid can find its way down. In addition, unlike the two previous cases, some of the accumulating liquid upon flooding will be directly above the hats. The hat channels are not full, so they can catch the accumulating liquid and run some of it down. Both effects result in additional capacity compared to the usual system limit criteria of the C-factor of 0.45 ft/s or the value calculated from the system limit correlation (463). The author’s experience as well as that of many of his colleagues has been that the system limit between the hats above a redistributor or a chimney tray usually occurs at C-factors between 0.56 and 0.7 ft/s based on the most restrictive open area between the hats. Other cases of premature flooding due to oversized hats were reported (112), but the C-factor was not specified. Case 4 This case is similar to those described in Case 3 above and Figure 8.12b. A packed tower was erected to strip a small amount of carbon dioxide and organics from a wastewater stream, purifying it into a cooling water makeup. The entering wastewater poured above the oversized hats of the liquid distributor. The oversized hats consumed most of the cross-sectional area, leaving little space for vapor ascent simultaneous with liquid descent. The resulting high vapor velocities between the hats blew the incoming water upward, causing flooding. Two different consultants studied the problem, the first offering an incorrect diagnosis and a failed fix, the second, after an extensive simulation study, incorrectly concluding that a larger-diameter tower was needed (a puzzling conclusion, the C-factor was 0.12 ft/s in 1.5″ Pall rings, compare to Section 2.16). The plant gave up and junked the tower, with the wastewater still going to the sewer. Good troubleshooting and a nickel-and-dime job of modifying the hats or feed pipe would have produced good water and avoided turning a good tower into scrap metal. Case 1 Figure 8.13a shows a monoethanolamine (MEA) contactor vapor inlet arrangement. The tower experienced a premature capacity bottleneck. The sketch clearly shows that more vapor ascended on the half tray near the vapor inlet nozzle. This maldistribution created a capacity bottleneck and did not help separation either. Lieberman (285) reports a similar case in a packed tower, but instead of the center downcomer, an I-beam supporting the bed caused the vapor maldistribution. Section 4.11 item 8 provides a guideline for sufficient vertical height between the bottom of the downcomer or I-beam and the liquid level. Case 2 (Ref. 393) Massive I-beams were used to support the packed bed above a chimney tray in a 16 ft ID refinery vacuum tower. Figure 8.13b shows that the I-beams would interfere with the vapor distribution to the bed. Vapor from the side chimneys was blocked by the I-beams and preferentially ascended around the periphery. The maldistributed vapor profile was displayed as a carbon deposit on the surface of the bottom packing. The deposit formed an annular ring about 5 ft wide, extending about 1 in. into the bed. In that case, liquid was known to overflow the chimneys for several months due to an incorrect location of level taps. The overflow caused liquid entrainment, and some entrained droplets ultimately carbonized on the base of the bed. Had the vapor profile been uniform, entrainment and deposit laydown would have been more uniform. An uneven liquid overflow could have further aggravated the maldistribution. Cases 3 and 4 (Ref. 275) A recommended rule of thumb by Lieberman (285) for the distance from the chimney tray hats to the packed bed above is to fully cover the bottom of the packed bed above with vapor expanding at a 30° angle (Figure 8.13c). Lee (275) describes a case where the angle for vapor to fully cover the bottom of the bed was 70°. In reality, the vapor expands at 30°, not 70°, which leaves large portions of the bed inlet with little vapor, causing the observed poor separation. Rao et al. (390) described another case where the 30° rule was violated. The authors stated that “the chimney tray collector below the top bed was installed with little space between the top of the risers to the packed bed above.” From the diagram in their article, it looks like the angle was wider than 70°. Needless to say, the bed above performed inefficiently. Case 5 (Ref. 144) The feed region (“flash zone”) of a refinery atmospheric crude tower (Figure 8.13d) receives high-velocity, partially vaporized hot crude feed, typically about 50% vapor by weight (>90% vapor by volume). Often, the feed enters via a tangential entry (“vapor horn”). The trays above the feed (“wash section”) operate at very low liquid flow rates. Figure 8.13 Maldistribution of vapor feed. (a) Center downcomer causes vapor maldistribution and capacity bottleneck at the tower bottom. (b) Long I-beams cause vapor maldistribution at a chimney tray. (Courtesy of D. W. Reay, ret., BP Oil, private communication.) (c) Lieberman’s (285) 30° minimum hypothetical angle rule for good vapor distribution above chimney tray riser hats. (d) Center downcomer deflecting high-velocity flashing feed toward the bottom right quadrant of the tray above, causing fouling there. (Based on Guarda, C. F., E. Lieberman, and N. Lieberman, “The Lost Art of Tower Internal Inspection: A Practical Guide for the New Generation,” in Kister Distillation Symposium, Topical Conference Proceedings, p. 64, AIChE Spring Meeting, Virtual, April 18–22, 2021.) Figure 8.13d shows feed obstruction by the center downcomer and seal pan from tray 41 above. Some of the feed would be deflected upward by the seal pan, but most of it would underflow the seal pan and attempt to rise on the opposite side. The downcomer and seal pan would prevent the rising vapor from returning to the inlet side. The feed vapor would then preferentially channel into the shaded quadrant of the tray above. The high-velocity hot feed would dry up this quadrant and deposit some entrained crude there, both of which would cause severe fouling and plugging even of plug-resistant trays, as was observed (144). The solution was to take out tray 41 and its downcomer and install seal pans on the tray 40 side downcomers. Takeaways Look for obstructions to vapor passages. Troubleshoot points of transition (feeds, drawoffs, bottom sumps, chimney trays) using to-scale sketches. Gallery distributors are frequently used for flashing feeds into packed towers. A common gallery distributor design is shown in Figure 4.22 and described in Section 4.13. Following a revamp, one stripper experienced instability initiating at its gallery distributor. The stripper seemed to puke every one to two hours. The problem was initiated upon return to service, so fouling was an unlikely cause. The tower diameter was larger at the bottom than at the top (Figure 8.14a). The flashing feed entered via an 8″ nozzle into a gallery distributor. The centerline of this nozzle was 22 in. above the floor of the gallery (Figure 8.14b). The feed entered via a rounded V-baffle. Gamma scans showed buildup of frothy liquid right above the gallery distributor. Calculations using the orifice equation (4.2) (Section 4.6.2) gave a liquid level of 10 in. at normal operation, assuming pure liquid and no aeration. A sketch (Figure 8.14b) shows the geometry of the entry together with the gallery distributor. The V-baffle width was twice the nozzle diameter (a common design practice), so the bottom of the V-baffle was 8 in. below the centerline of the feed nozzle, or 14 in. above the gallery floor. This is only 4 in. above the liquid level. With turbulence and aeration likely, the gallery liquid would rise above the bottom of the V-baffle, and the incoming vapor would entrain it or cause waves on this liquid, initiating the observed instability. Figure 8.14 Tower experiencing instability initiating at the gallery distributor. (a) Overall arrangement; (b) gallery distributor sketch, showing vapor entry only 4 in. above the liquid level assuming no aeration. A 78″ ID debutanizer experienced some quick cycling of the overhead liquid product rate. Figure 8.15 is the to-scale sketch that diagnosed the root cause. Liquid from the bottom tray descended into the tower base via two side downcomers, each terminating in a double seal pan. An overflow baffle divided the bottom sump into a reboiler feed compartment and a bottom draw compartment. All the liquid from the left-side downcomer, as well as the liquid from the reboiler return, would be collected by the reboiler draw compartment. The reboiler return entered the tower via a 12″ feed pipe with an 18″ half-pipe cutout, terminating in a vertical 18″ square target plate that defected the return mixture downward into the reboiler draw compartment. Only the liquid from the right-side downcomer would descend directly into the bottom draw sump. With most of the liquid going into the reboiler compartment, the baffle would keep a constant liquid head for the fired-heater reboiler. Liquid not consumed by the reboiler overflowed the baffle into the bottom draw sump. At least this is the way we believe it was meant to work. Figure 8.15 Downward deflection of reboiler return causes instability in a debutanizer. Figure 8.15 shows the flaw in this reasoning. The reboiler return two phase mixture traveled at 44 ft/s through the 12″ pipe, then was deflected downward at 19 ft/s. This means that it would travel 19 ft downward in the first second if not stopped. The liquid level at the top of the baffle is only 20.5 in. below the top of the cutout. This strong downward wind would blow the liquid from the reboiler compartment into the bottom draw compartment. This would starve the reboiler of liquid, reducing the amount of vapor produced. The starvation of reboiler liquid is likely to increase the fractional vaporization, possibly leading to mist flow in the hotter tubes, which would further reduce the amount of vapor generated. Reducing vaporization would lower vapor flow through the tower and the overhead product rate. Once the level in the reboiler compartment falls, less liquid would be blown into the bottom draw compartment, the reboiler liquid would return, the boilup would pick up, and both tower vapor rate and overhead product rate would rise. When the reboiler compartment filled up again, the same cycle would repeat. Takeaway A to-scale sketch is a powerful analytical tool for diagnosing point of transition issues. Case 1 Figure 8.16a shows the bottom sump of a chemical tower. A vapor feed entered near the bottom. A baffle split the tower bottom sump into a reboiler draw compartment and a bottom draw compartment. All the liquid from the bottom 2-pass tray went to the reboiler draw compartment. Reboiler return entered the tower via a pipe that passed through the reboiler draw compartment. It then discharged against a downward-directed channel baffle. The tower flooded prematurely, as shown by a pressure drop rise and by gamma scans. The gamma scans showed that the flood propagated right through the tower, having a foamy appearance, characteristic of the system. Calculations and gamma scans showed that the trays were not close to flooding. The downcomer velocities were of the order of 0.11 ft/s, which were about two to three times less than the design criteria of the major chemical company. The cause of the premature flood was the impingement of reboiler return vapor on the liquid surface, generating liquid entrainment that flooded the bottom trays. Gamma scans showed that indeed the flood initiated in the bottom sump, supporting this possibility. Further, when the tower operated without the reboiler, there was no flooding. Case 2 A 12-ft ID refinery deethanizer stripper had two thermosiphon reboilers in service, one heated by hot naphtha, the other by steam. The tower could not remove enough ethane from the bottom product. When the reboiler hot naphtha flow was raised, the ethane concentration in the bottom went up. The ethane ended up in the downstream tower, the debutanizer, and overpressured it. To prevent overpressuring, the naphtha flow needed to be cut back well below design duty. The steam reboiler had its steam valve fully open to try to make up the duty. Figure 8.16b shows the naphtha reboiler return entry. The sump contained a baffle that preferentially diverted the tray liquid to the reboilers, and kept a constant liquid head in the reboiler compartment. Liquid overflowing this baffle became the bottom product. The naphtha reboiler return discharged its vapor–liquid mixture against a second baffle that was inclined at 45o. This inclined baffle generated a vertical downward velocity component, which blew some of the reboiler compartment liquid into the bottom draw compartment. This starved the reboiler of liquid, inducing excessive flow into the bottoms product. Per the component balance, as the bottoms flow rate exceeded the amount of heavies entering the column, the balance of the bottoms flow rate would be ethane. Figure 8.16 Downward deflection of reboiler return or vapor feed. (a) Causes premature flood in a chemical tower. (b) Induces lights into the bottoms of a refinery deethanizer. (c) Causes hydrogen blistering in an amine absorber. (d) Causes premature flood and level instability in an amine absorber. Case 3 Vapor feed to an amine absorber was saturated with semi-lean amine in a static mixer before entering the tower (Figure 8.16c). At high vapor velocity, the vapor feed line caused impingement of this amine on the tower wall, leading to corrosion. To correct the problem, the vapor feed line was directed upward (Figure 8.16d), terminating in an inverted bell that deflected the vapor downward. The idea was to prevent impingement on the wall. The new arrangement caused level instability and premature flooding in the tower. Stopping the lean amine injection into the static mixer stopped the flood, but the level instability remained. Here, vapor impingement on the liquid level caused the problem. The problem was finally solved by revamping the vapor feed line with a vane distributor. V-baffles (Figures 8.14b and 8.17) are used to reduce the inlet velocity of the reboiler return, a vapor feed, or a vapor/liquid feed, and to redirect it along the tower walls. The baffle is closed at the top and at the bottom, open on the sides, and is usually sloped downward at a small angle. The baffle can be rounded (Figure 8.14b) or segmental (Figure 8.17a–f). A good troubleshooting investigation should explore for undesirable flow patterns produced by the baffle using a to-scale sketch. The sketch can identify interferences with other tower internals as illustrated in the following. Case 1 Following a retrofit with high-capacity trays, a tower experienced excess bottom product, reboil shortage, and high lights content in the bottoms, which bottlenecked the reboiler and tower. A sketch (Figure 8.17a) identified the problem. An overflow baffle divided the bottom sump into a reboiler draw compartment and a bottom product draw compartment. Liquid from the bottom tray descended directly into the reboiler draw compartment. The reboiler return liquid also entered the reboiler draw compartment. Whatever liquid was not needed by the reboiler would overflow the baffle into the bottoms product draw compartment. Initially, it was thought that the problem was due to tray weeping into the bottom product draw compartment, but gamma scans showed no significant weep. The scans showed the product draw compartment was full while the reboiler draw compartment was not. The reboiler return nozzle had a V-baffle in front. At low reboiler return rates, the liquid dropped into the reboiler draw compartment as intended. At high rates, however, the mixture’s momentum carried it to the bottom draw compartment. The problem was cured by adding a cover above the product draw compartment that diverted the reboiler return liquid into the reboiler draw compartment (Figure 8.17b). Case 2 (279, 280). Following a revamp from 1-pass trays to 2-pass high-capacity trays, a solvent recovery tower experienced extremely unstable reflux drum level, inability to control tower pressure and reflux flow, and unsteady operation. The problem was traced to the addition of a V-baffle in the revamp (Figure 8.17c,d), which directed reboiler return liquid into the upper level tap. The seemingly high liquid level in the draw sump would lead to a boilup increase or reflux decrease, and unsettle the tower. The solution was to install a shielding baffle in front of the level tap. Case 3 Case 6.1 in Ref. 201, contributed by R. F. Olsson, describes an irregularity in the temperature profile of a packed bed as measured by a surface temperature survey. On the north and west, temperatures were steady and in line with expectations. In the south, temperatures were 10–20°F lower than expected. In the east temperatures varied ±50°F in cycles. Figure 8.17e shows the cause. The tower had two equal reboiler return inlets, each equipped with its own V-baffle. The baffles were separated by an 8 in. gap. Assuming an equal split of the reboiler return fluid by each V-baffle, about half the reboiler return vapor would attempt to rise into the restricted space between the baffles on the east side (Figure 8.17e) of the tower, causing a vapor jet to rise up the tower in the east. This was the side of the tower where the temperatures cycled. Figure 8.17 V-baffles produce unexpected flow pattern at tower base. (a) At high rates, reboiler inlet V-baffle would deflect liquid into the bottoms product draw compartment, starving the reboiler of liquid. (b) Problem solved by adding a cover over the bottoms product draw compartment. (c, d) Adding a V-baffle in a revamp from one to two pass trays led to reboiler return liquid entering the upper-level tap, which destabilized the tower. (e) Original V-baffle arrangement that led to temperature instability in the packed bed above. (f) Modification that overcame the problem. (g) Absence of a reboiler return impingement plate that caused the tower to flood. (Parts (c, d): From Lenfeld, P., and I. Buttridge, “High Costs of Quick Turnarounds and Erroneous Procedures,” in Distillation 2013, Kister Distillation Symposium, p. 455, AIChE Spring Meeting, San Antonio, Texas, April 28–May 2, 2013. Reprinted with permission. Parts (e, f): From Olsson, R. F. in Kister, H. Z. “Distillation Troubleshooting,” Wiley, 2006. Reprinted with permission. Part (g): Based on Lieberman, N. P., “Understanding Process Equipment for Operators and Engineers,” Elsevier, Amsterdam, 2019. A uniform temperature profile was achieved after the V-baffles were modified by installing a vertical partition plate between them and a plate over the top of the gap (Figure 8.17f) to keep the two reboiler return streams from jetting up the east side. Case 4 (290) In this case, the absence of a V-baffle (or an impingement plate, as it was referred to in Ref. 290), which was part of the design but was not installed, led to premature flooding in a naphtha stabilizer tower. The reboiler return nozzle was 180° away from the bottom tray seal pan, and at a slightly lower elevation (Figure 8.17g). The impingement converted the velocity of the vapor–liquid reboiler return mixture into a static pressure at the seal pan that backed liquid up the downcomer, causing the tower to flood. Pressure measured at point P1, right across from the reboiler return, was 165 psig, while at point P2, it was only 160 psig, measured by the same gauge. The localized pressure difference was more than enough to push liquid up the downcomer. Installation of the impingement plate solved the problem. A similar impingement was reported (292) even though the upper level tap was 2 ft above the reboiler return inlet. Case 5 A V-baffle in a packed steam stripper experienced repeated damage episodes at the shell attachment. The tower liquid was much colder than the steam. The temperature cycles caused the damage. With recirculating thermosiphon reboilers, preferential baffles are often used to split the bottom sump into a reboiler draw compartment and a product draw compartment. The bottom tray liquid is preferentially diverted into the reboiler draw compartment. The reboiler return liquid also enters the reboiler draw compartment, but near the baffle, it overflows into the product draw compartment. The idea is to recirculate some of the reboiler return liquid to the reboiler, with the balance overflowing into the bottom product compartment. Figure 8.18 shows common arrangements. Many additional variations together with good practice guidelines are described in Ref. 109. Figure 8.18 Preferential baffle arrangements for bottom sumps. (From Kister, H. Z., Chemical Engineering, July 28, 1980. Reprinted with permission.) These baffles should be avoided where the bottoms product stream is much smaller (<100 times) than the liquid to the reboiler. This is because for every gallon overflowing into the product compartment, there are >100 gallons going to the reboiler. Under these conditions, the overflow is likely to be intermittent and cause instability in the bottom sump. If this is troublesome, the bottom hatchway in the baffle can be removed, and the product and reboiler compartments become one. Case 1 Is the baffle configured correctly? Figure 8.19 (133) shows a poorly configured baffle arrangement that did not work. A temperature survey (Figure 8.19) showed the cold tray liquid preferentially going to the product compartment, with most of the reboiler return liquid going into the reboiler draw compartment. Presumably, the center downcomer deflected the reboiler return liquid into the reboiler side of the baffle. At the same time, it deflected the reboiler return vapor preferentially to the tray panel on the right-hand side of Figure 8.19, generating a vapor-deficient region with liquid weeping on the left-hand panel in the elevation sketch. Much of this weeping ended in the product side. Figure 8.19 Preferential baffle arrangement that worked poorly. (From Golden, S. W., J. Moore, and J. Nigg, Hydrocarbon Processing, p. 75, September 2003. Reprinted with permission.) Case 2 Does the Baffle Work as Intended? (Ref. 198) The H2S concentration in the bottoms of a debutanizer was 500 ppmw versus <5 ppmw as per the design. The H2S concentration was reduced to 10 ppmw by spiking the feed with 2000 BPD of butane (light key, about 5% of the feed) to establish adequate reflux/lift as described in Section 3.2.8. 10 ppmw was still above the acceptable concentration. Temperature measurements and sketching the bottom sump baffle (Figure 8.20a) are key to diagnosing this problem. The debutanizer bottoms product and the reboiler outlet temperatures were both designed for 620°F, but the measured bottoms temperature was about 20°F colder. This can only happen if some cold liquid from the chimney tray at a temperature of 520°F finds its way to the bottoms draw compartment. Likewise, the bottom tray temperature was designed for 520°F and the reboiler draw for a slightly higher temperature. The measured reboiler inlet temperature was much higher, 570°F, indicating considerable mixing with the hot reboiler return liquid. The high temperature frequently caused seal failure of the reboiler circulating pump. The baffle therefore did not work as intended. Figure 8.20a shows that the downcomer from the bottom chimney tray terminated only about 2 ft below the top of the reboiler compartment overflow baffle. The 2 ft difference was not enough to prevent mixing of the cold fluid from the chimney tray with the hot reboiler return liquid. Consequently, the bottoms product became cooler and the reboiler feed became hotter than expected. Extending the downcomer by about 8 ft (Figure 8.20b) minimized the hot/cold liquid mixing, brought the two temperatures close to design, and reduced the H2S concentration to the acceptable <5 ppmw range. Case 3 Does the Baffle Work as Intended? Section 7.2.7 and Figure 7.27 describe another baffle dividing the bottom sump into reboiler and product draw compartments not working as intended. Case 1 The naphtha bottoms product from a naphtha H2S stripper had 5–15 ppm H2S, which was above the acceptable concentration. By maximizing preheat, the plant managed to reduce the H2S in the bottom to about 5 ppm. The stripper was a licensed unit, and the licensor reported experiencing no similar problems in their other units. The 10 ft ID tower had one packed bed above the preheated feed and two 20 ft tall beds below the feed, all containing random packings. Between the two bottom beds there was an orifice redistributor. The tower flashing feed entered via a gallery distributor. Liquid from holes in the gallery floor dripped into the middle bed liquid distributor (Figure 8.21) around the periphery. Liquid leaving the top bed was collected on a chimney tray from which it descended via three downpipes into the middle bed distributor. The pipes were generously sized for self-venting flow. A close study of the sketch of the middle-bed liquid distributor (Figure 8.21) identified the problem. The distributor had closely spaced square chimneys, so liquid movement between them was severely restricted. This resulted in high liquid heads where the pipes entered, and much lower heads elsewhere, generating maldistribution and highly uneven liquid flow down the bed. Gamma scans confirmed gross maldistribution in the middle bed. Figure 8.20 Debutanizer bottom sump baffle. (a) Before modification; (b) modified. (From Bu-Naiyan, A., and K. Kamali, “Troubleshooting Debutanizer at Ras Tanura Refinery’s Hydrocracking Unit,” Asian Refining Technology Conference (ARTC) 6th annual meeting, Singapore, 2003. Reprinted with permission.) Case 2 Figure 8.22 (based on Ref. 417) shows the chimney and down box arrangement in a collector. The down boxes fed a main parting box that supplied liquid to a trough distributor underneath. Separation in the packed bed was poor. During an outage, an in situ water test measured nonuniform water heights in the distributor troughs, with troughs in some regions, especially toward the liquid draw, having twice the liquid heights of others. A CFD study verified that this was caused by the long chimneys closeness to the down boxes, creating “shadow” regions. The down boxes in these regions had flows far below the average. Figure 8.21 Flow obstruction causes liquid maldistribution and poor separation in a packed tower. Figure 8.22 Long edges of long chimneys obstruct liquid movement toward adjacent down boxes, causing a skewed liquid flow profile. The generated maldistribution continued to the bed. (Based on Schnaibel, G., A. C. Bellote, A. V. S. Castro, C. N. Fonseca, M. E. P. L. Marsiglia, G. A. S. Torres, K. Ropelato, A. S. Moraes, and F. Feitosa, “The Jet Fuel Problem Strikes Again,” in Distillation 2009: Topical Conference Proceedings, p. 89, AIChE Spring National Meeting, Tampa, Florida, April 26–30, 2009.) Case 3 In a 16 ft ID refinery fractionator, there was a loss of distillate to the lower, less valuable products below and poor separation in the packed bed below. The cause was excessive hydraulic gradients on the collector (Figure 8.23). The center sump contained tall down boxes through which liquid descended to the parting box below. These interfered with the forward flows. There were also supports that were perpendicular to the liquid flow and obstructed forward flow. As a result, the down boxes near the end of the sump on the left of the sketch received more liquid. The draw nozzle and the down box on the right were starved of liquid. The parting box below could not adequately even up the maldistribution. Figure 8.23 Collector that experienced excessive hydraulic gradients, causing maldistribution in the distributor below. Case 4 A chemical packed tower with an upper and lower beds containing structured packings experienced poor separation. The bottom bed distributor was a trough distributor (Figure 8.24). Liquid to the distributor was supplied by a parting box. Liquid from the top bed was collected by a collector, and descended into the center of the parting box via a rectangular downcomer. The subcooled feed entered at one end of the parting box. Figure 8.24 shows very poor mixing in the distributor between the subcooled feed and the liquid from the bed above, which led to the separation problem. Case 5 Figure 8.25 shows the liquid distributor to the slurry bed of an FCC main fractionator described in Refs. 124, 132. There were two parting boxes that received cooled, nonvolatile circulating slurry feed at 238°C via two perforated pipes. Entering the opposite end of the parting box was bubble point volatile liquid at 343°C from the tray above. Figure 8.25 shows that the two liquids had no chance of mixing. The volatile liquid descended on the left-hand side of the diagram, quickly vaporized in the hot bed below, and the dry, hot region coked up as was observed during an inspection at the next turnaround. There was no coke in the rest of the bed, only on the left side that preferentially received the volatile tray liquid. The column internals were modified to properly mix the liquids, after which no further coking occurred (124, 132). Figure 8.24 Poor mixing of feed and reflux in a tower, showing reflux liquid from packed bed above descending into middle of parting box, while cold feed entering the end of the box. (From Kister, H. Z., W. J. Stupin, and S. Stupin, TCE, p. 44, December 2006/January 2007. Reprinted with permission.) Figure 8.25 Poor mixing of cooled slurry feed and volatile liquid from tray above in the parting boxes to a slurry bed distributor. The region on the left that preferentially received the volatile liquid dried and coked. (Based on Golden, S. W., N. P. Lieberman, and G. R. Martin, Oil & Gas Journal, 92, p. 72, November 21, 1994.) Case 1 One ED tower in chemical service was revamped with new packings and distributors. The solvent distributor gave poor mixing, and as a result, the separation was poor and led to an undesirable component in the overhead. Liquid to the distributor was provided by two parallel parting boxes. The solvent was fed into the middle of the parting boxes, while reflux from the tray above entered one end of the parting boxes (Figure 8.26a). This created the distribution pattern shown in Figure 8.26b. The region that did not receive the solvent did not extract the component. Figure 8.26c shows the modified arrangement that solved the problem. The feed pipe and parting boxes were not changed. The reflux piping was modified by adding a central trough with laterals spreading it evenly along the length of the parting boxes. Case 2 One chemical ED tower used to have trays and performed well. In a debottleneck, the trays below the solvent entry point were replaced by packings. The result was a very poor separation. Figure 8.26 Poor mixing of solvent and reflux in ED tower. (a) Reflux entering parting boxes at one end, solvent in the middle; (b) flow pattern generated in packed bed below; (c) problem solved by adding a trough and laterals to spread the reflux along the parting boxes. The solvent distributor was of a design similar to Figure 4.1b. The vapor openings between the troughs had downward-sloping hats to divert any liquid descending from above into the troughs. The solvent entered from pipes into two parting boxes (instead of the one parting box in Figure 4.1). Reflux from the trays above was not distributed, but allowed to drop directly from the seal pan (Figure 8.27; for clarity, the parting boxes are not shown). The sketch shows that the liquid preferentially descended into the two troughs right under the seal pan and parallel to it. As a result, the reflux/solvent mixing was very poor, causing poor separation. Case 3 (257). Solvent feed and reflux from the bed above entered via two parallel distributors without mixing in one benzene–toluene–xylene (BTX) ED tower, so the reflux and solvent did not mix until several feet down the packed bed. Liquid from the bottom of this bed rained directly into the redistributor of the next bed without remixing. That redistributor was a pan type, unsuitable for distributing two liquid phases that could have separated in the pan. The unit failed to meet design rates and recoveries. Rectifying these deficiencies enabled the tower to achieve its objectives. Figure 8.27 Poor mixing of solvent and reflux in ED tower, showing reflux liquid from trays descending into only two troughs. (a) Elevation; (b) view from the top. Contributed by M. E. Harrison, Eastman Chemical, Kingsport, TN. A 2-ft diameter scrubber was designed to remove acetic acid from a process off-gas stream. Water, the scrubbing fluid, was fed to the top of a single packed bed. The tower experienced excessive acetic acid emissions that caused unacceptable losses and odors. Varying the water flow to the scrubber between 20% and 200% of the design did little to improve scrubbing efficiency. There were no indications of flooding. A higher scrubbing efficiency was expected based on packing heights and water rates of similar columns. Consequently, poor liquid distribution was suspected. A separate review of column specifications and internal drawings did not suggest any problems. Figure 8.28a is a simplified sketch of the feed pipe entry, showing liquid discharged onto the center of the distributor. Figure 8.28b is a simplified sketch of the distributor plan, featuring a center, hatless chimney. Each individual sketch shows a sound design. Combining the two (Figure 8.28c) readily shows the design oversight. The scrubbing liquid was discharged right down the chimney and bypassed the distributor. The inspection confirmed this conclusion. Figure 8.28 Two seemingly well-designed pieces combine to make an arrangement that does not work. (a) Feed pipe, OK; (b) distributor plan, OK; (c) combining (a) and (b), not OK. (From Harrison, M. in H. Z. Kister, “Distillation Troubleshooting,” Wiley, 2006. Reprinted with permission.) Solution Calculations showed that the annular vapor space around the distributor was capable of handling the vapor flow. Therefore, the riser was blanked off. Of course, alternative solutions included relocating the feed pipe or the riser or putting a hat on the riser. When started up again, the scrubber removed essentially all the acetic acid with the design water rate. Takeaway When putting together the sketches, include all the relevant details, both of the internals and the feed piping, on the same sketch(es). This was an amine absorber that was retrofitted from trays to random packings. Upon restart, the absorption was poor, requiring a higher amine circulation, which in turn bottlenecked the regenerator. Figure 8.29a is a sketch of the lean-amine entry point when the tower contained trays. A feed pipe dumped liquid behind an inlet weir, which distributed the amine to the top tray. This worked well, confirming that the feed pipe was of good design. Figure 8.29b shows the orifice–pan packing distributor plan. The circles are the risers. The distribution holes were in the floor of the distributor. This was a standard orifice–pan distributor. Nothing suspicious here. Figure 8.29c and d shows what happens when the tower was retrofitted with packings. The new distributor was installed, but the feed pipe was not changed. Instead of going into the distributor, the lean amine went straight down the chimney. It would have been a miracle if that tower worked. A sketch or a process inspection would have revealed this problem prior to startup. Figure 8.29 Another two seemingly well-designed pieces combine to make an arrangement that does not work. (a) Feed pipe, as was used to bring lean amine to the top tray, OK; (b) orifice–pan distributor plan, used when trays were replaced by packings, OK; (c) combining (a) and (b), not OK; (d) a close-up of (c). Figure 8.30 Maldistribution of internal reflux below a side draw. (Based on Lee, S. H., PTQ, Q2, p. 59, 2016.) Figure 8.30 shows a side draw configuration from an atmospheric crude tower. Liquid from the upper bed was collected on a chimney tray, which contained two product draw sumps. Liquid not drawn descended via a multitude of downpipes, all flush with the chimney tray floor, to two separate parting boxes that fed liquid to the troughs below (similar to Figure 4.1, except with two parting boxes). The troughs distributed the liquid to a packed bed below. The packed bed experienced poor fractionation efficiency. Two flaws were identified. One flaw has been described earlier as Case 3 in Section 8.12 (this is the same chimney tray). The second flaw was that the downpipes were flush with the tray floor, so liquid rate to each downpipe was uncontrollable. The descending liquid was therefore nonuniformly split among the downpipes and, therefore, among the distributor parting boxes and troughs. The problem was solved by redesigning the chimney tray with raised overflow pipes. A chemical plant experienced a separation problem in one of their packed towers. Their gamma scans showed massive maldistribution below the feed. The author’s recommendation of drawing a sketch of the feed inlet met with reluctance from the client, who preferred to contract the author’s company for a consulting assignment. Figure 8.31 One sketch shows it all – vapor feed blowing liquid onto wall causing poor distribution and entrainment. So the author drew the sketch (Figure 8.31) and emailed it to the client. Upon reviewing the sketch, the client quickly figured out the issue. The vapor feed will blow the liquid from the distributor to the opposite tower wall. The liquid arriving at the bed will never be properly distributed. So the client paid consulting rates – solely for drawing a sketch. The takeaway from this story and all other stories in this chapter: when it comes to troubleshooting points of transition (feeds, drawoffs, bottom sumps, chimney trays) you do not need an expert. You need a sketch.
Chapter 8
Point of Transition Troubleshooting: You Do Not Need an Expert, You Need a Sketch
8.1 GUIDELINES FOR POINTS OF TRANSITION SKETCHES
8.2 FLASHING FEED ENTRY CAUSING A 12-YEAR BOTTLENECK
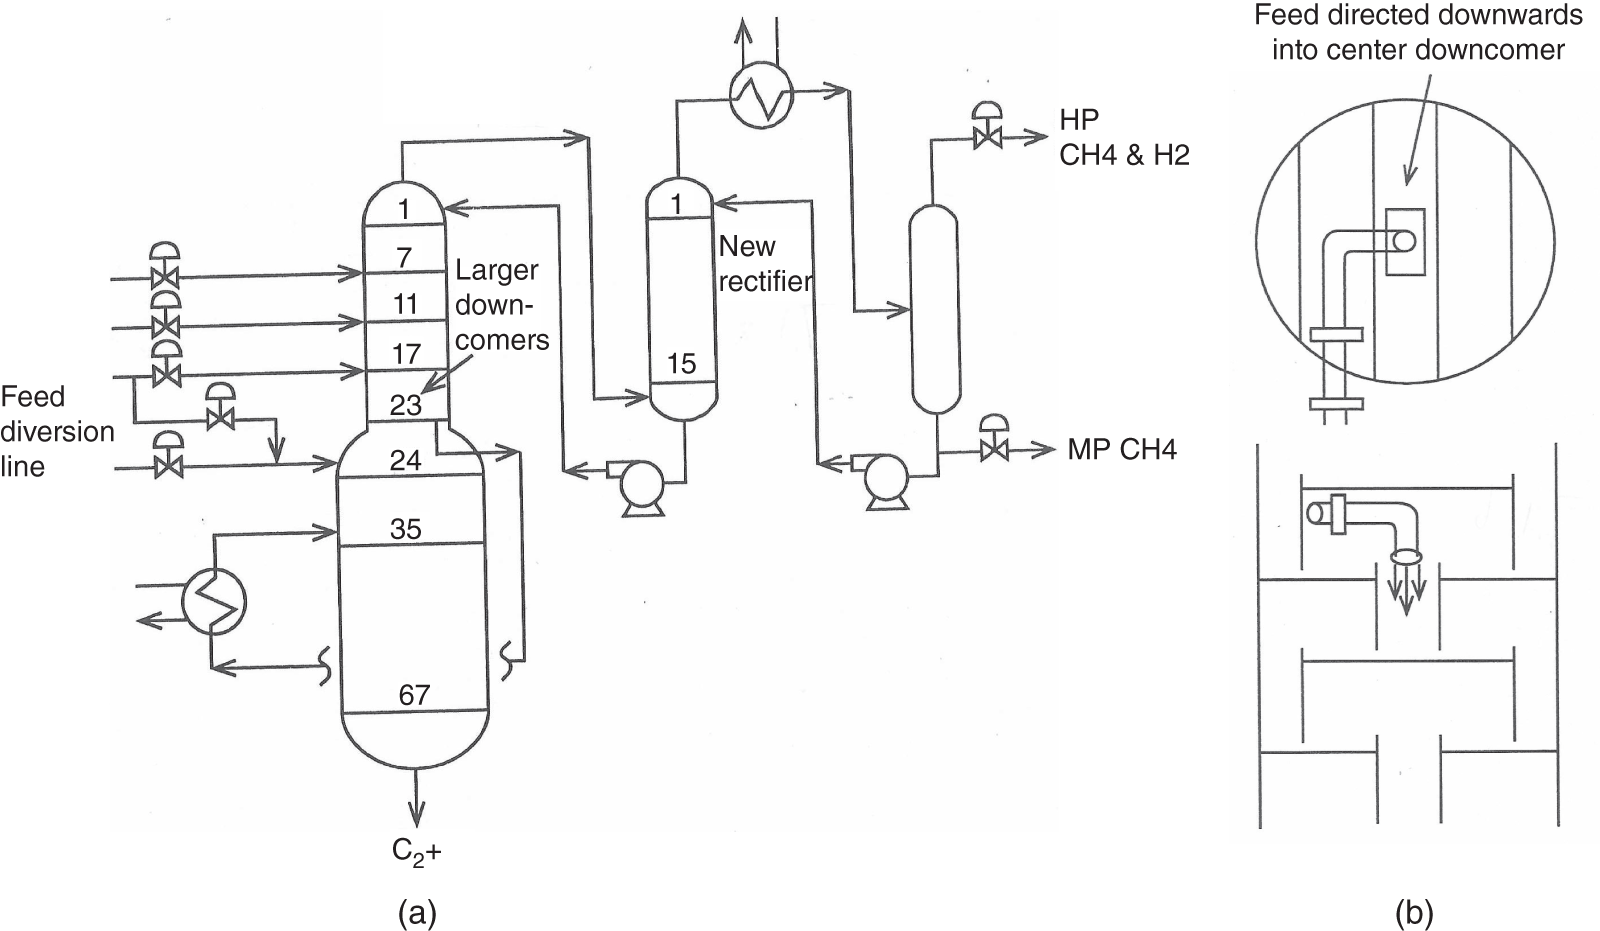
8.2.1 Upward Component of Flashing Feed Entry Causes Damage and Flooding
8.3 FEED MALDISTRIBUTION TO 4-PASS TRAYS CAUSING POOR SEPARATION
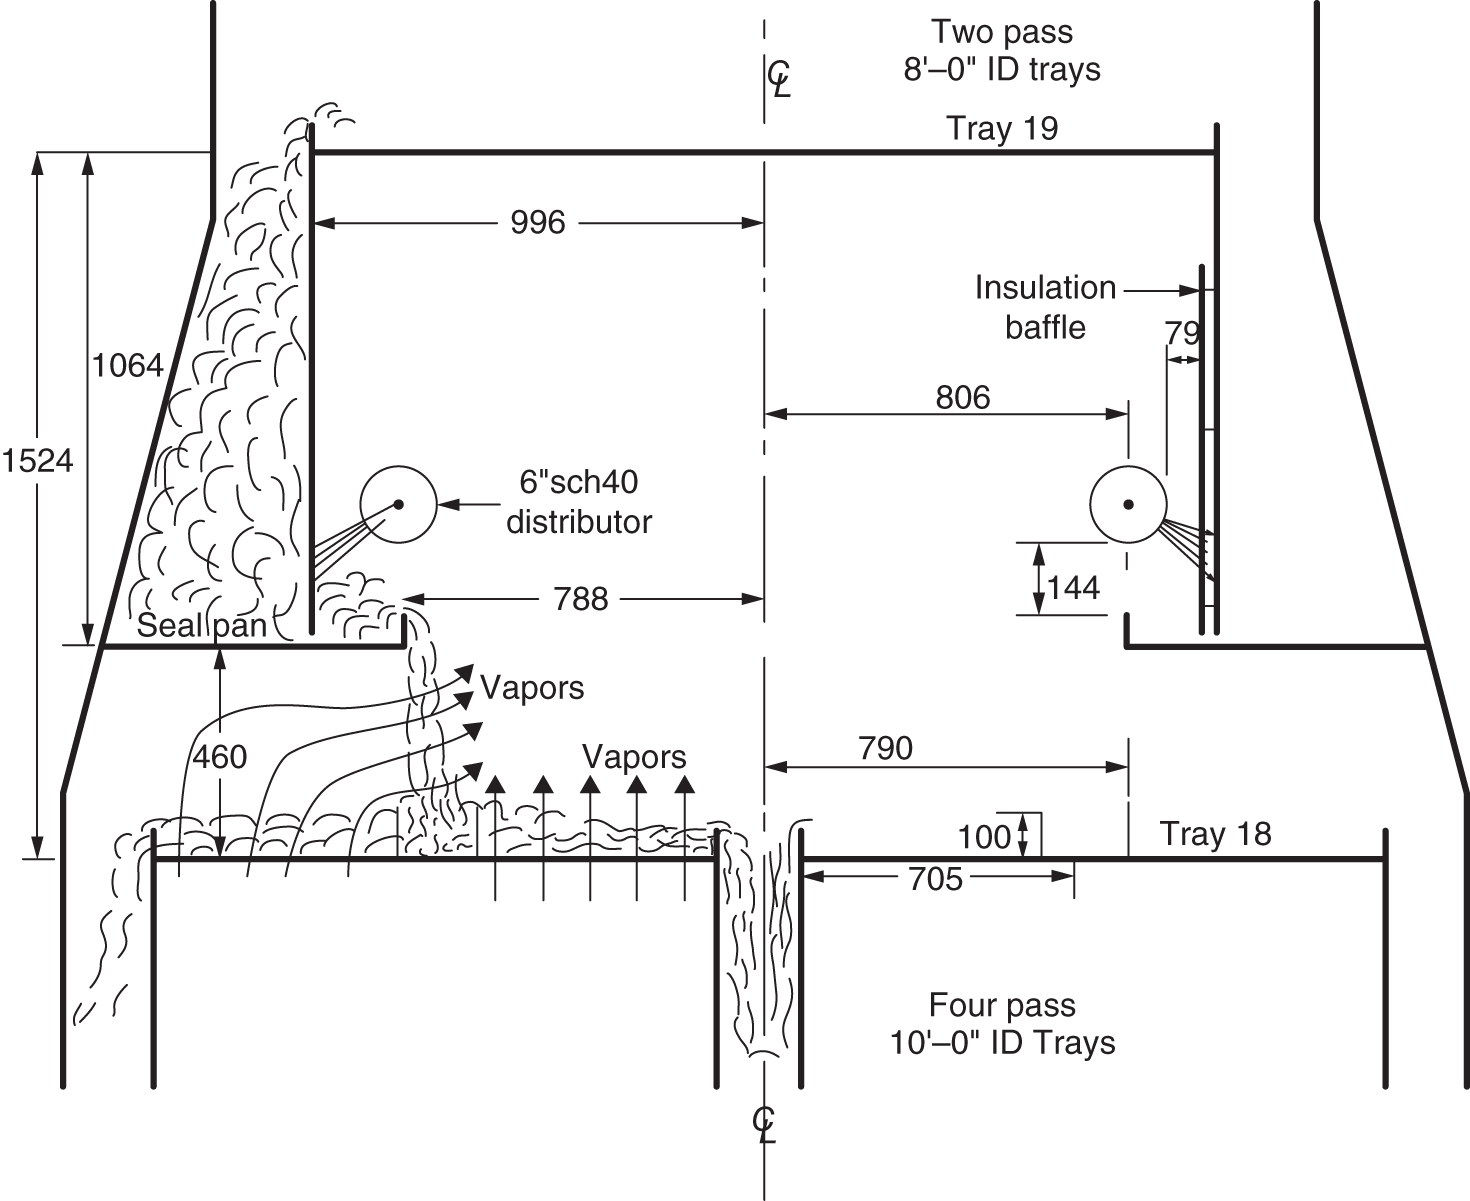
8.4 FEED PIPES BLOCKING LIQUID ENTRANCE TO DOWNCOMERS
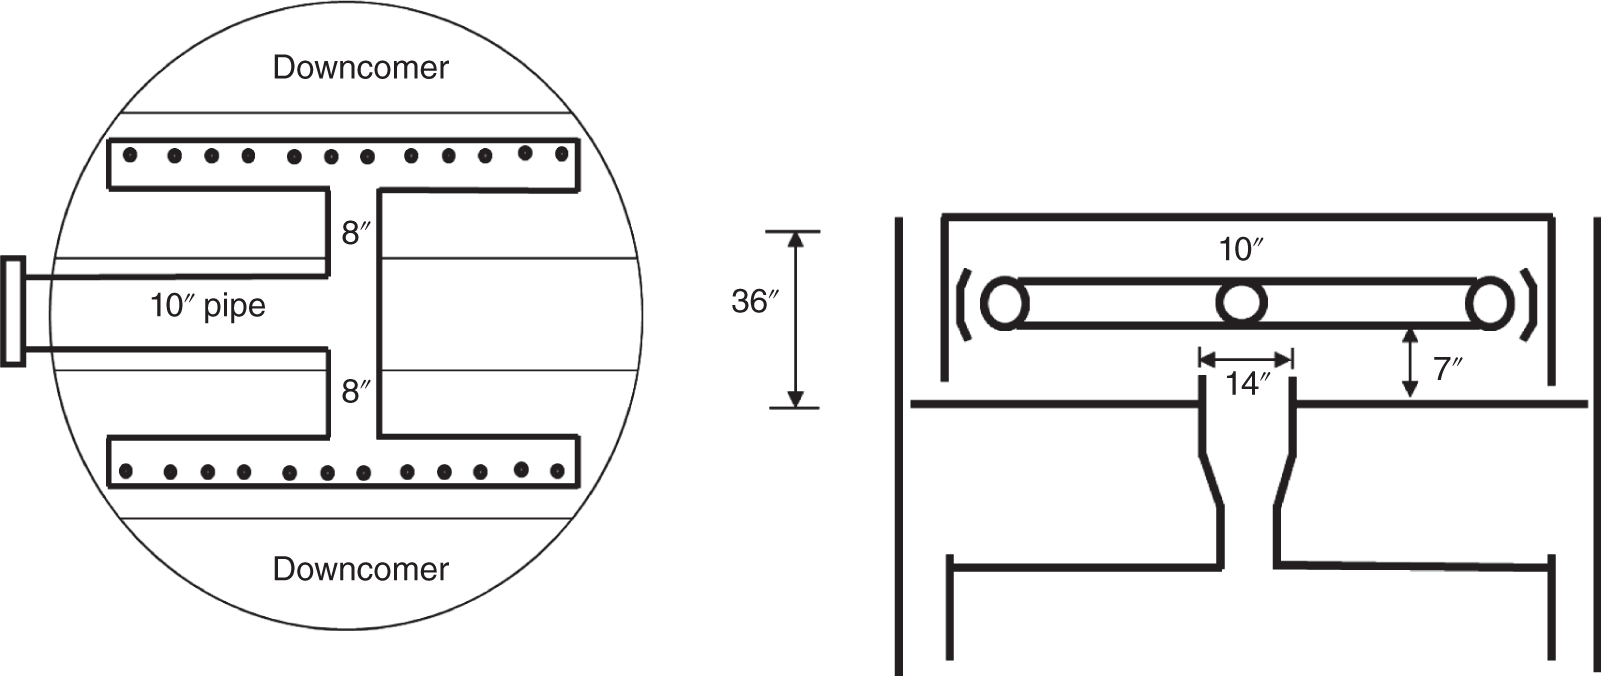
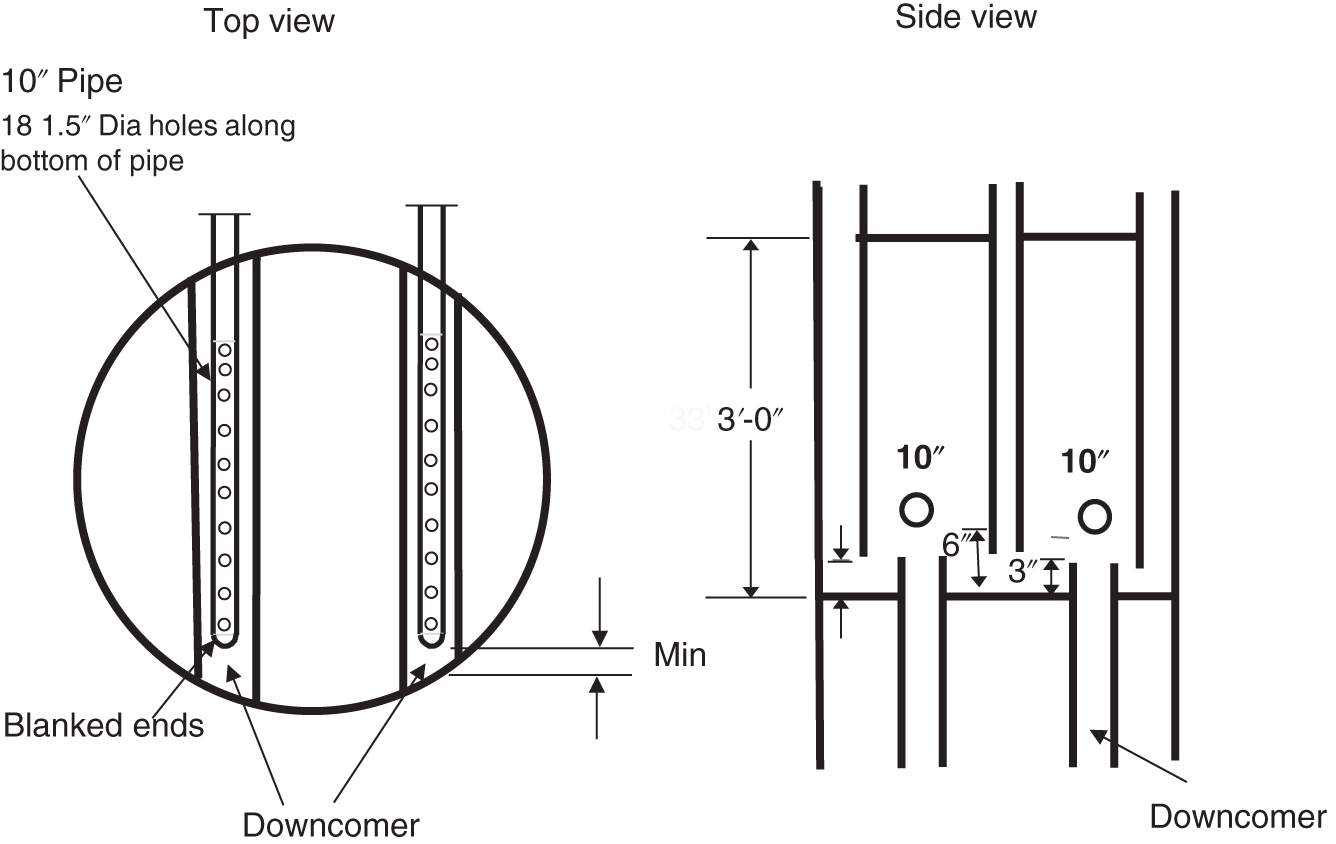
8.5 DRAW SUMP BLOCKING LIQUID ENTRANCE TO DOWNCOMERS
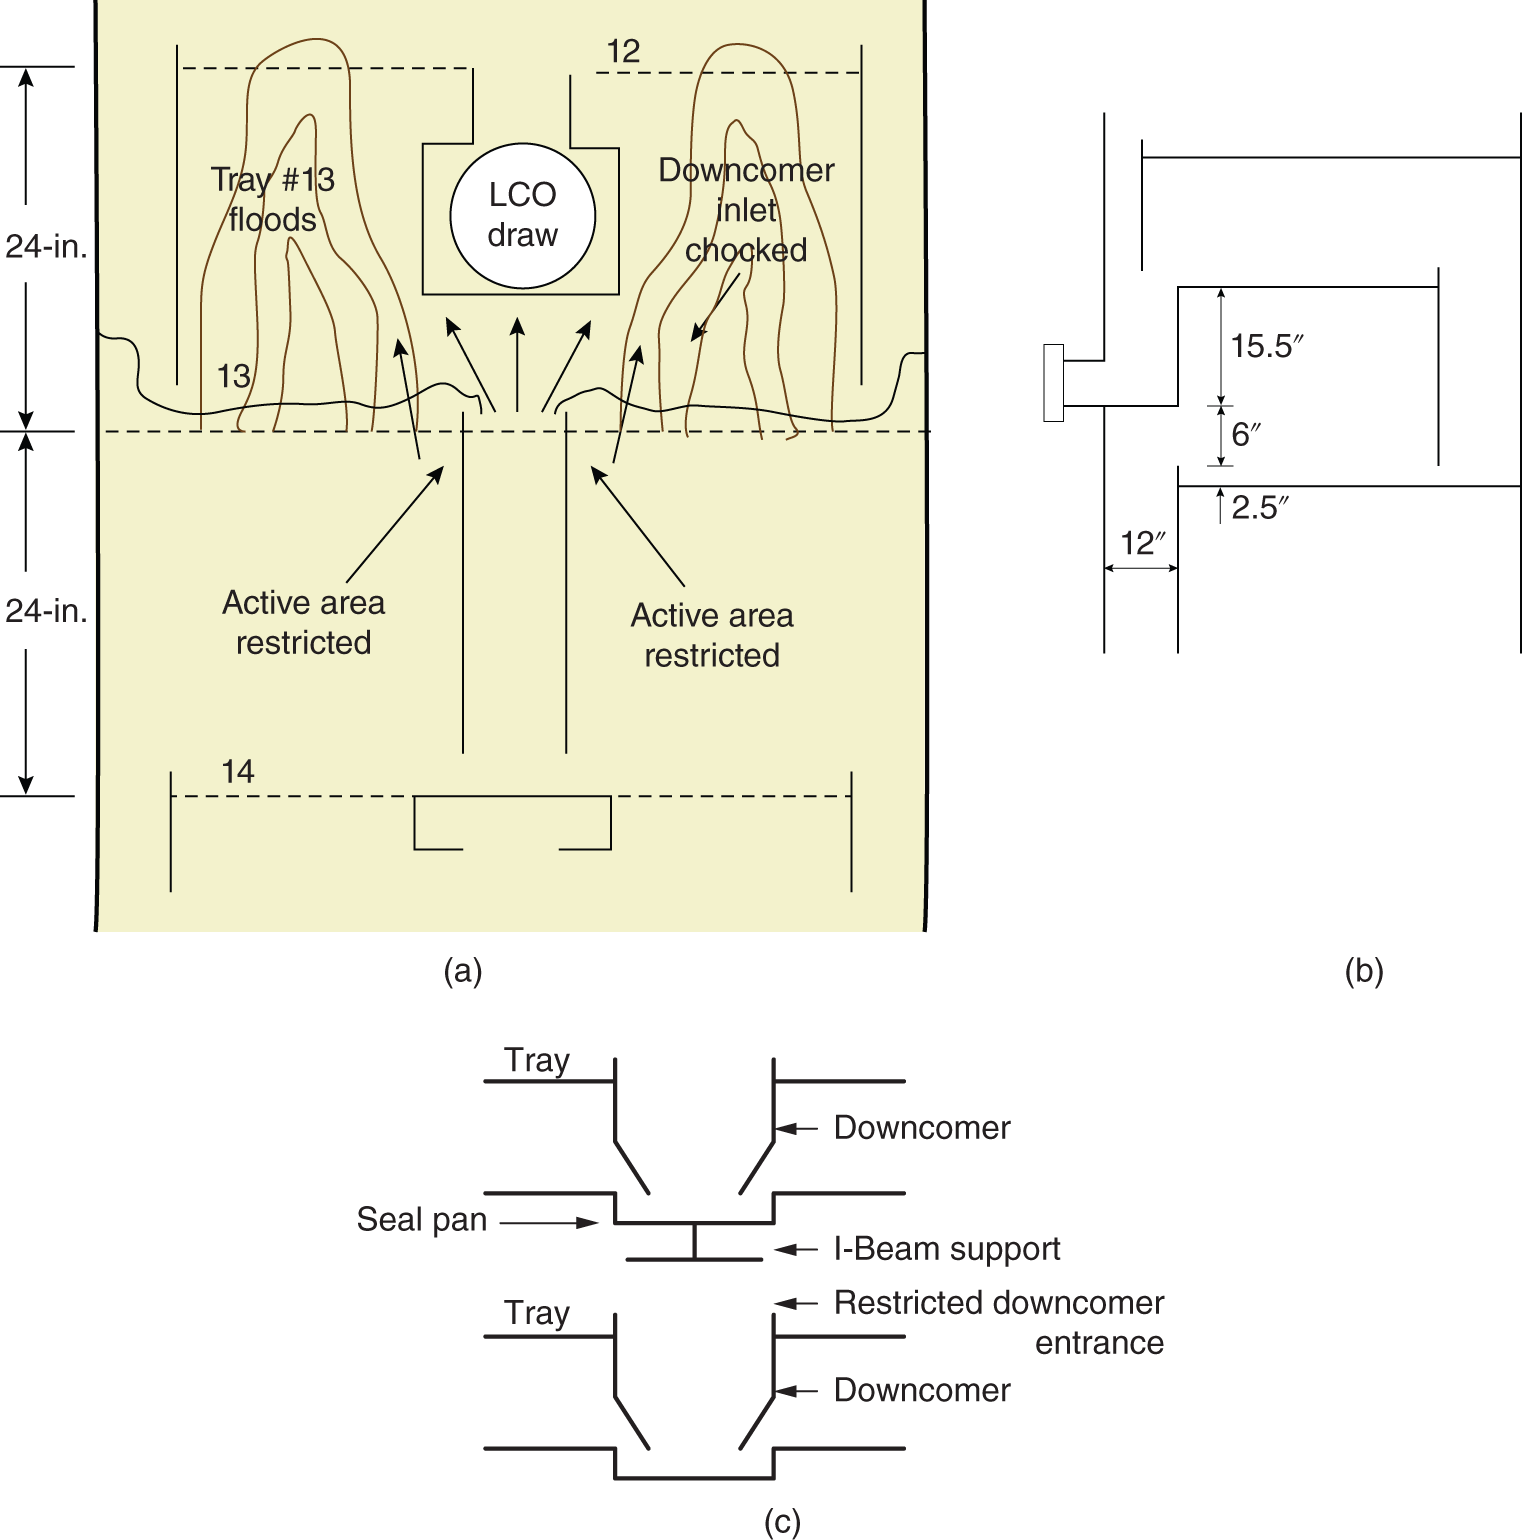
8.6 UNSEALED DOWNCOMERS OR OVERFLOW PIPES CAN LEAD TO PREMATURE FLOOD
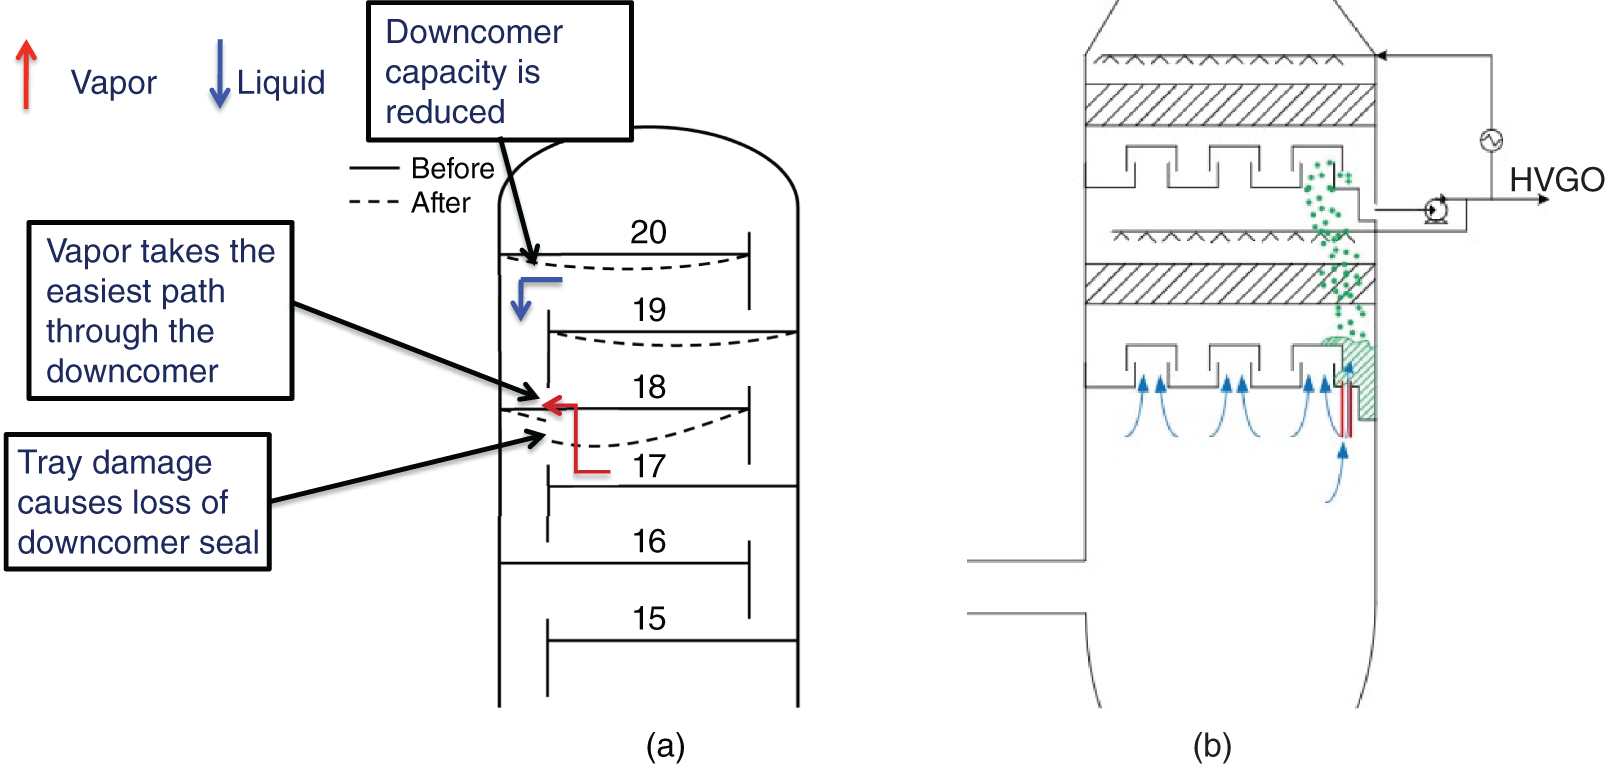
8.7 EXCESSIVE DOWNCOMER SUBMERGENCE CAN LEAD TO PREMATURE FLOOD
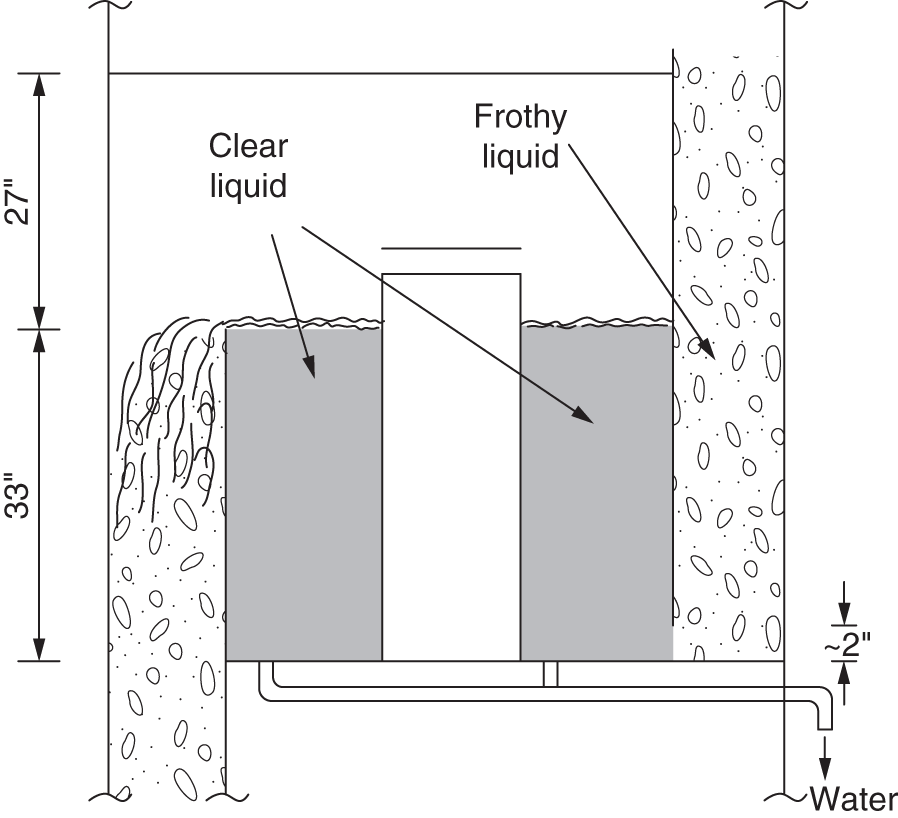
8.8 “LEAK-PROOF” CHIMNEY TRAYS IN AN FCC MAIN FRACTIONATOR
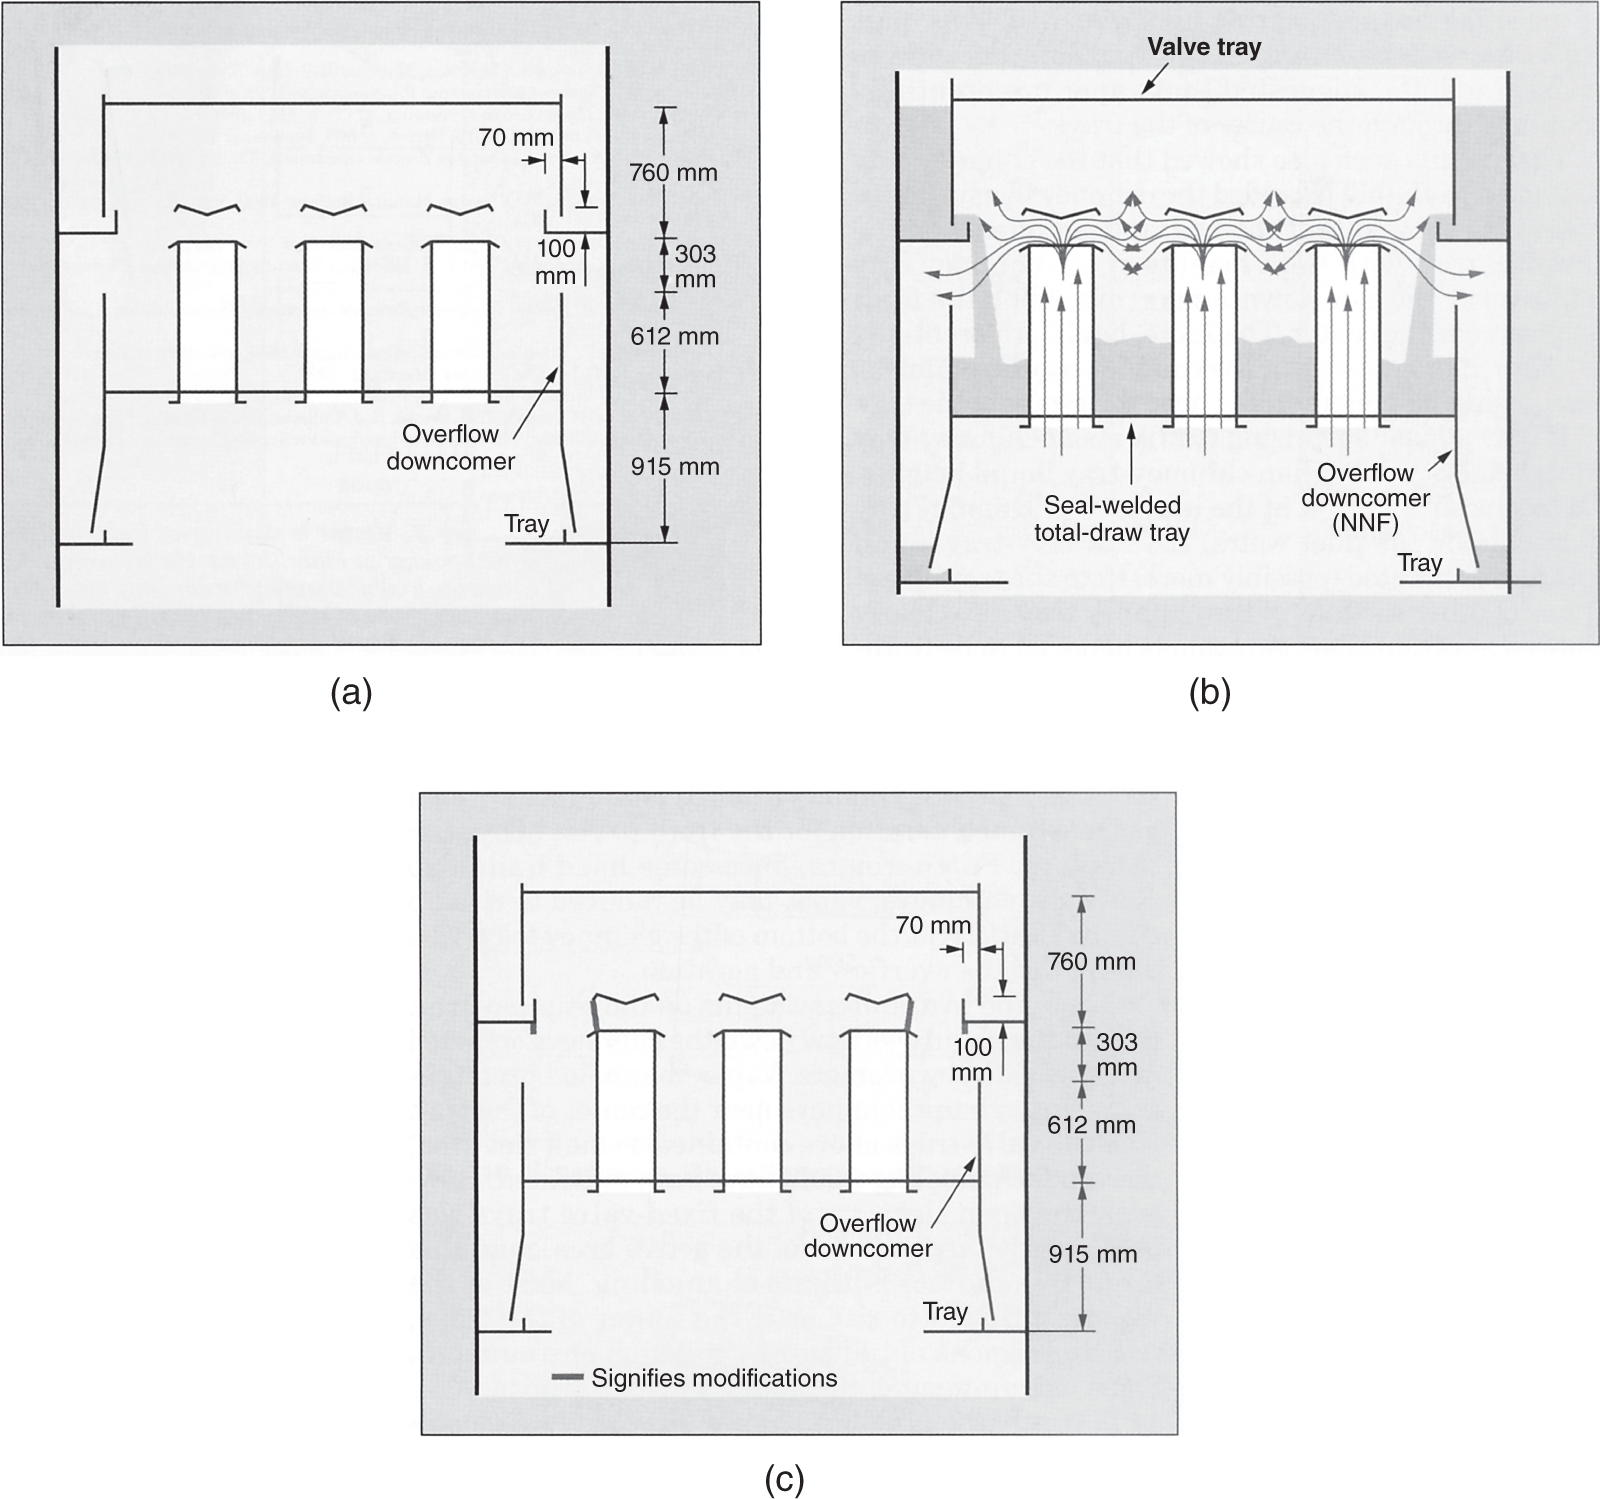
8.9 MORE “LEAK-PROOF” CHIMNEY TRAYS
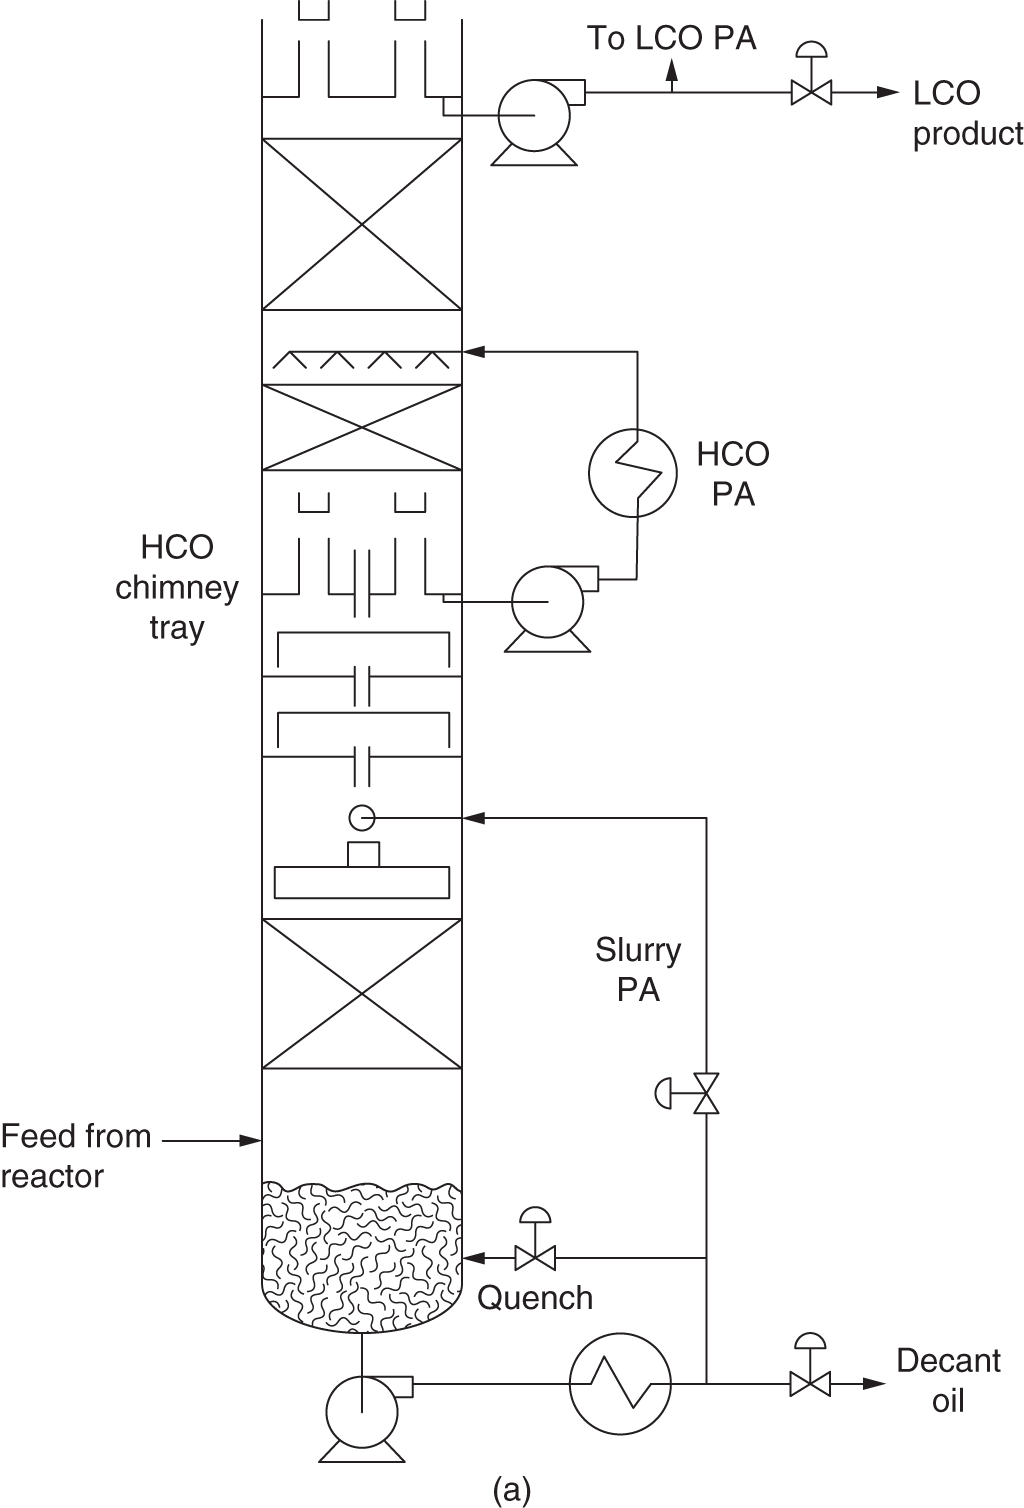
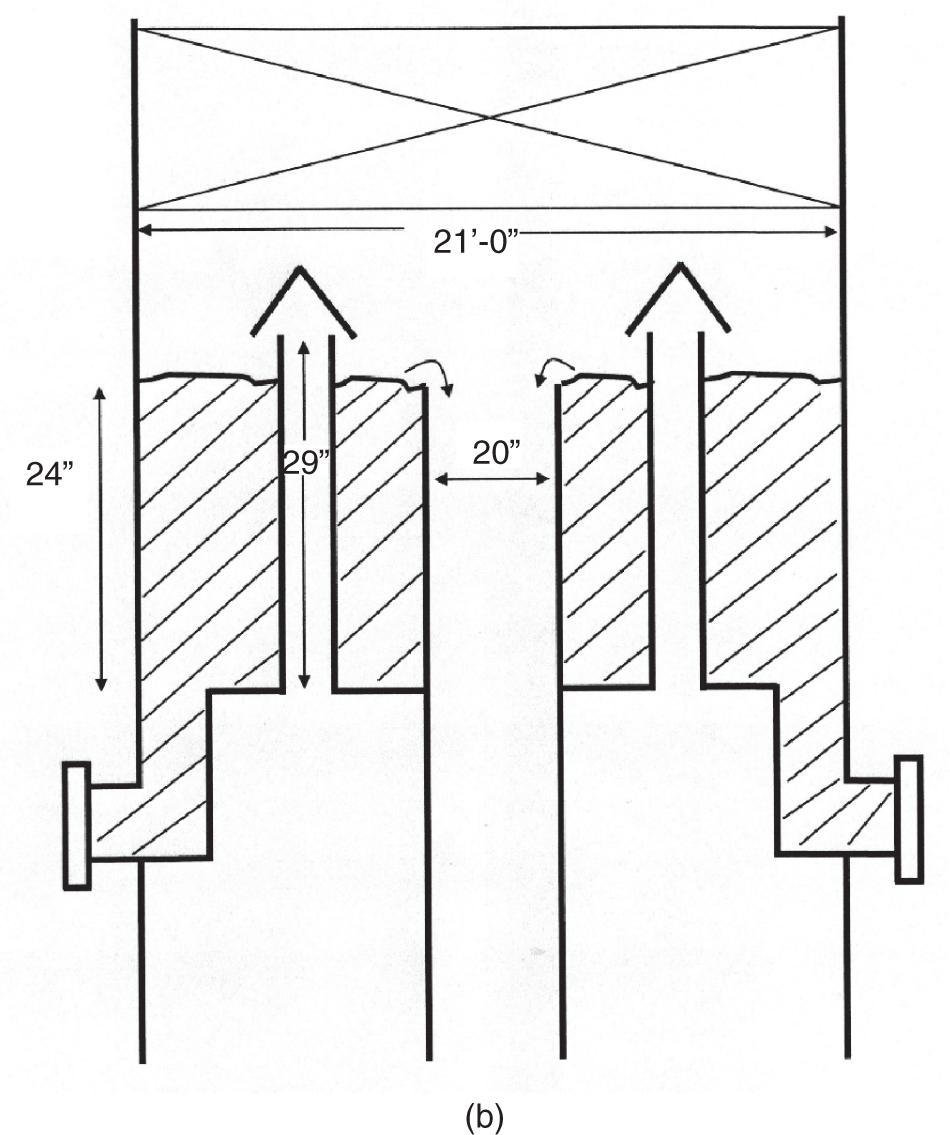
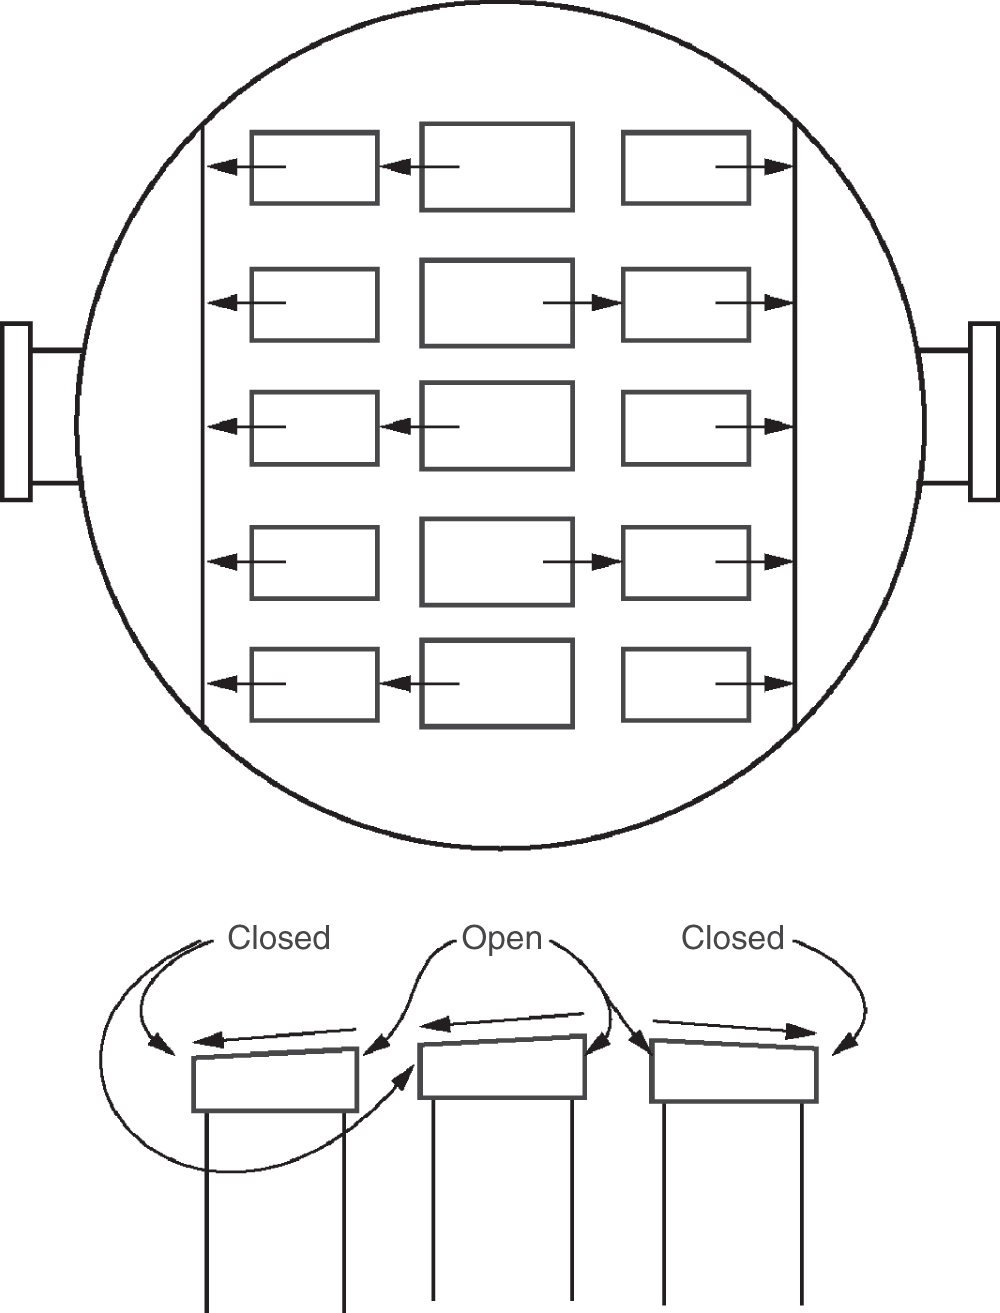
8.10 HYDRAULIC GRADIENTS GENERATING CHIMNEY TRAY OVERFLOWS
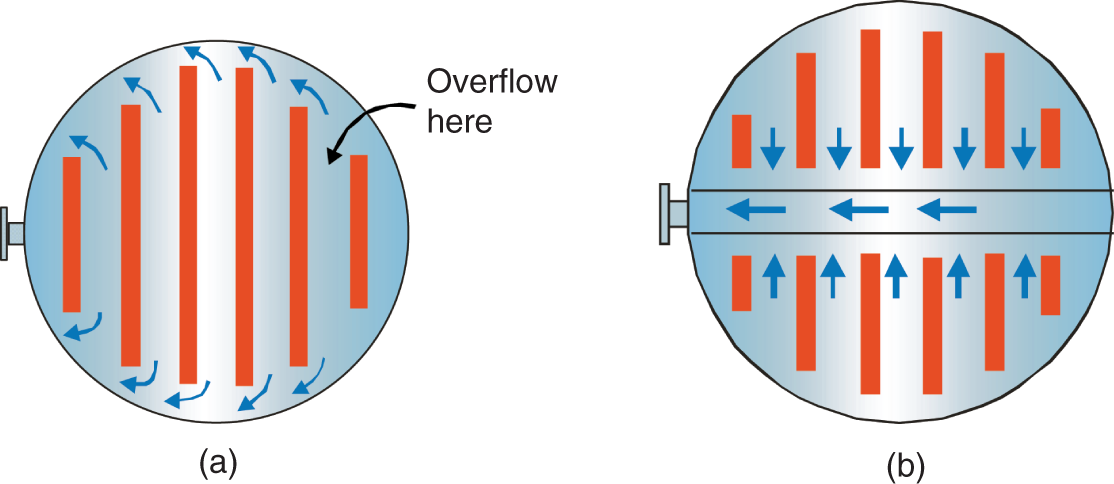
8.11 LOOK FOR THE POSSIBILITY OF A SYSTEM LIMIT SETTING IN
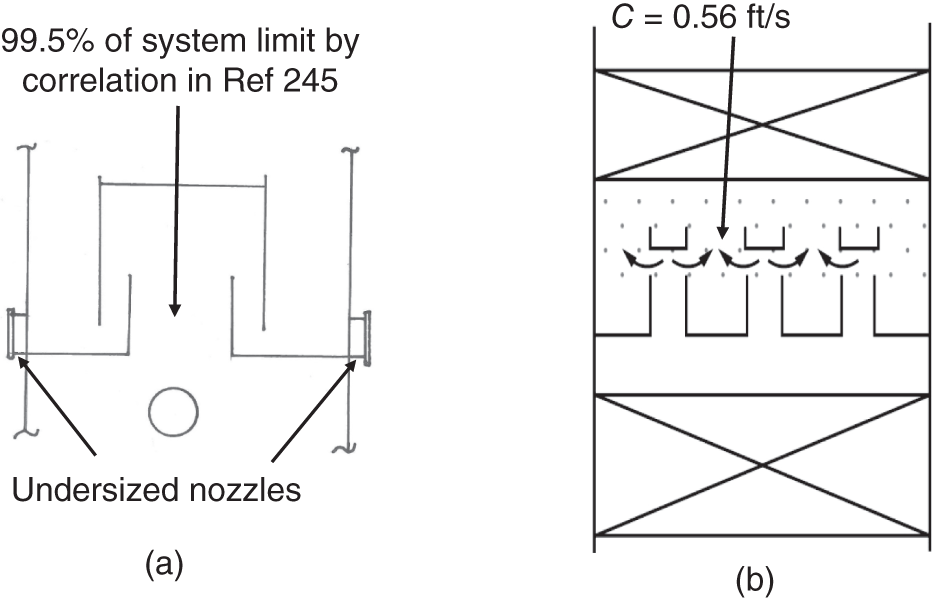
8.12 VAPOR MALDISTRIBUTION AT THE TOWER BASE AND CHIMNEY TRAY
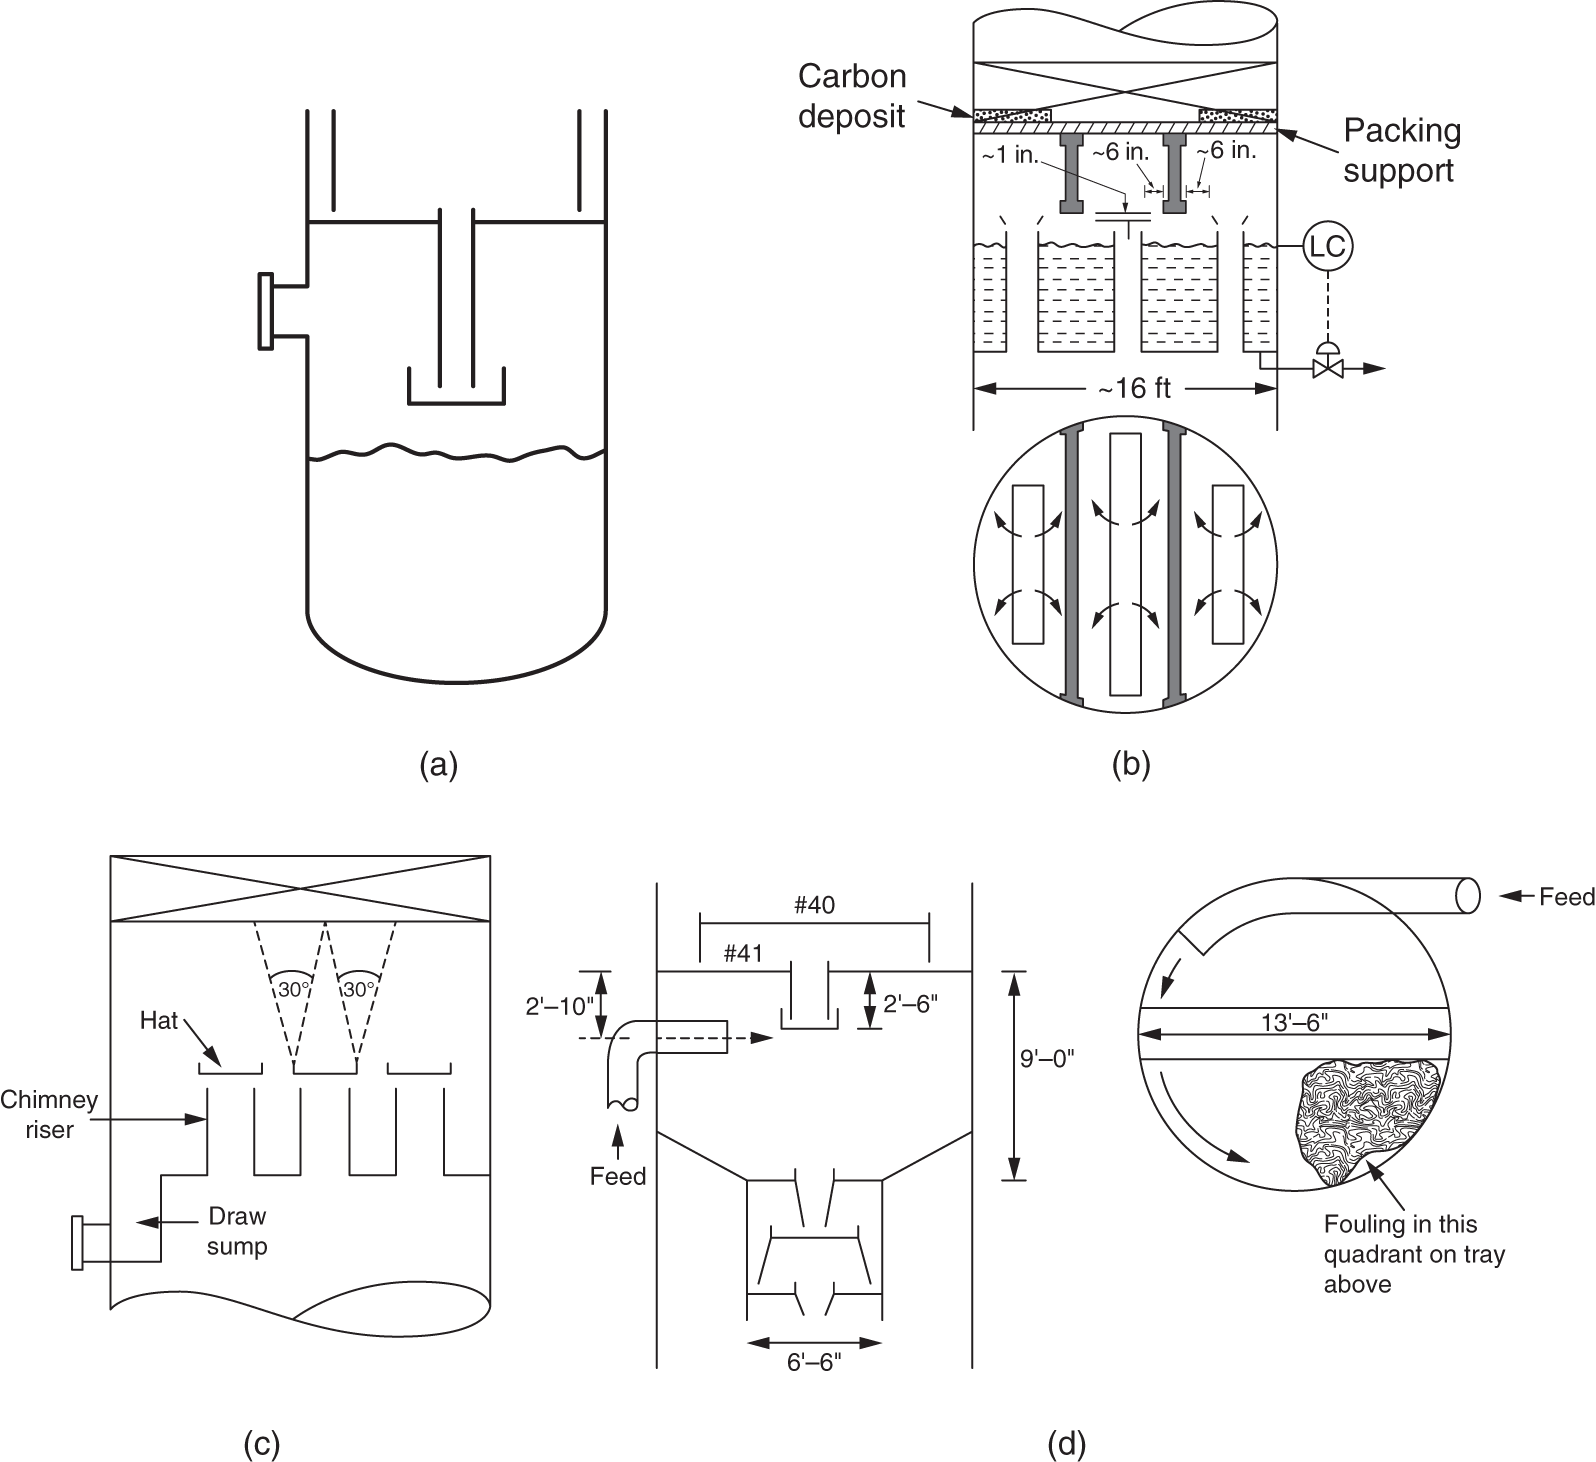
8.13 ENTRAINMENT FROM A GALLERY FLASHING FEED DISTRIBUTOR
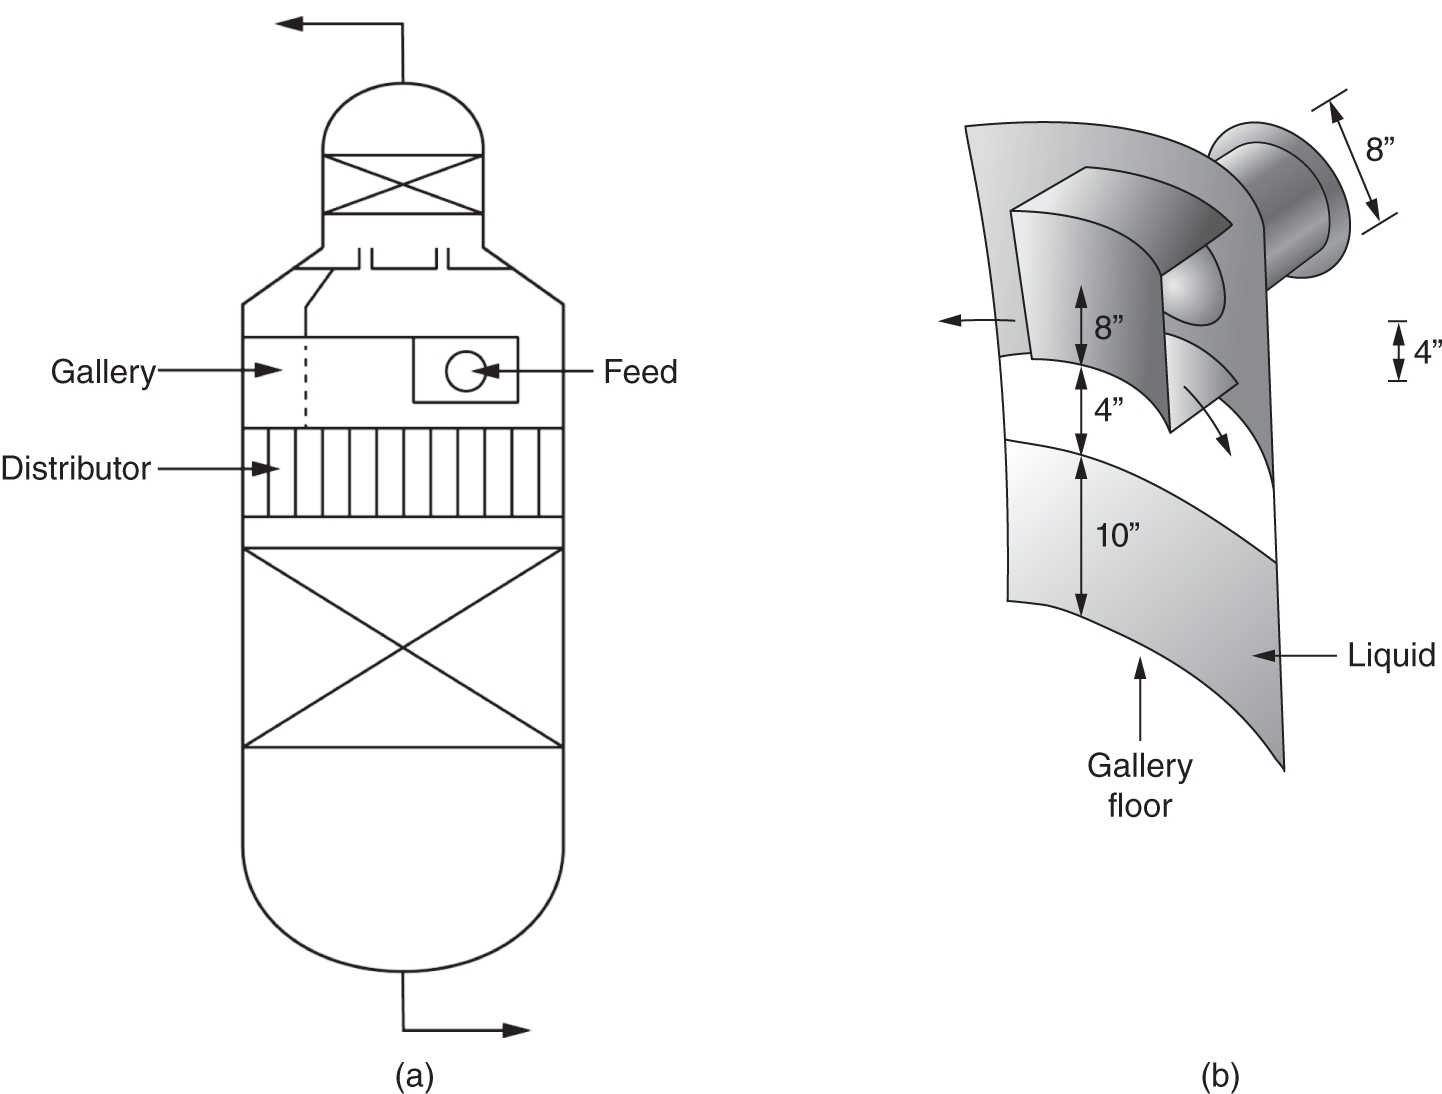
8.14 VAPOR IMPINGING ON LIQUID AT THE TOWER BASE
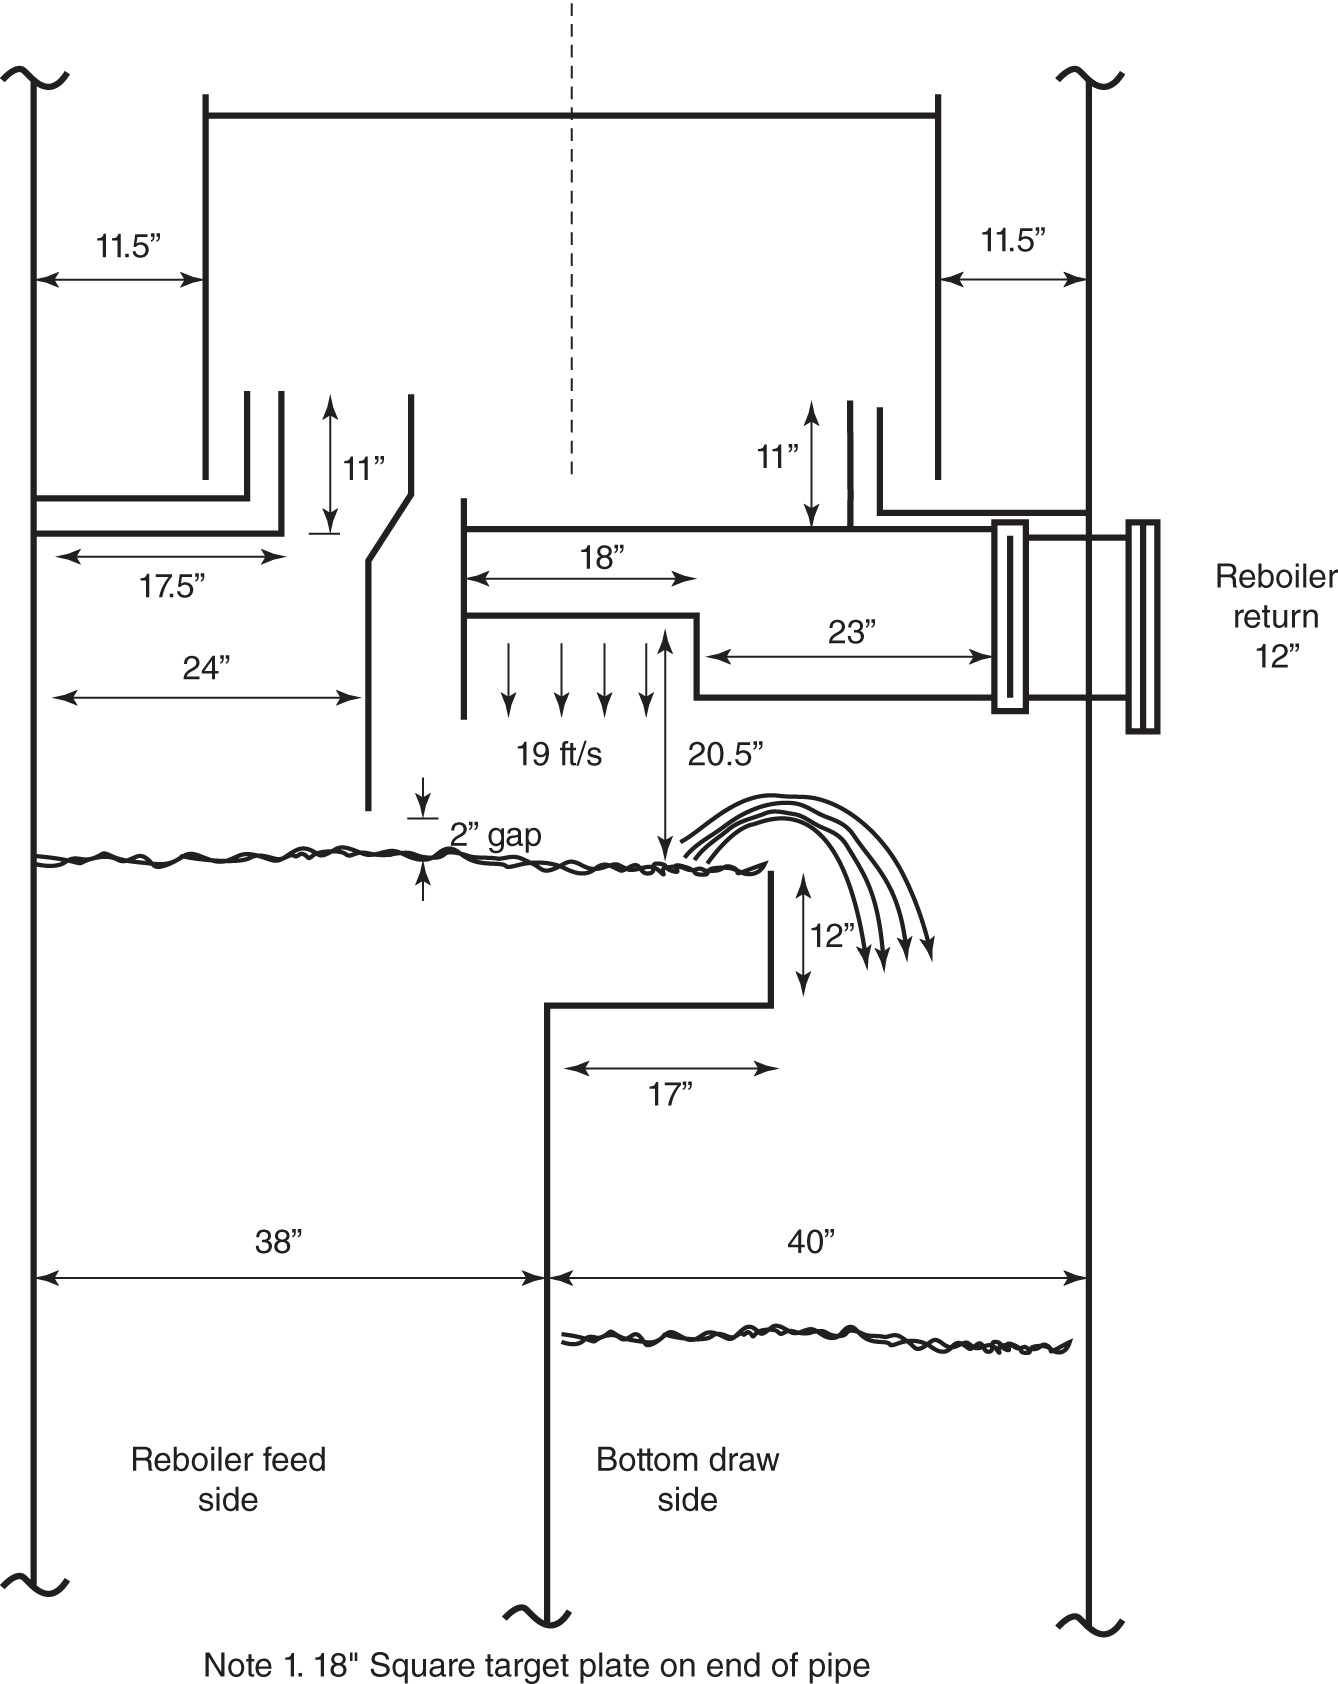
8.15 MORE VAPOR IMPINGING ON LIQUID AT THE TOWER BASE
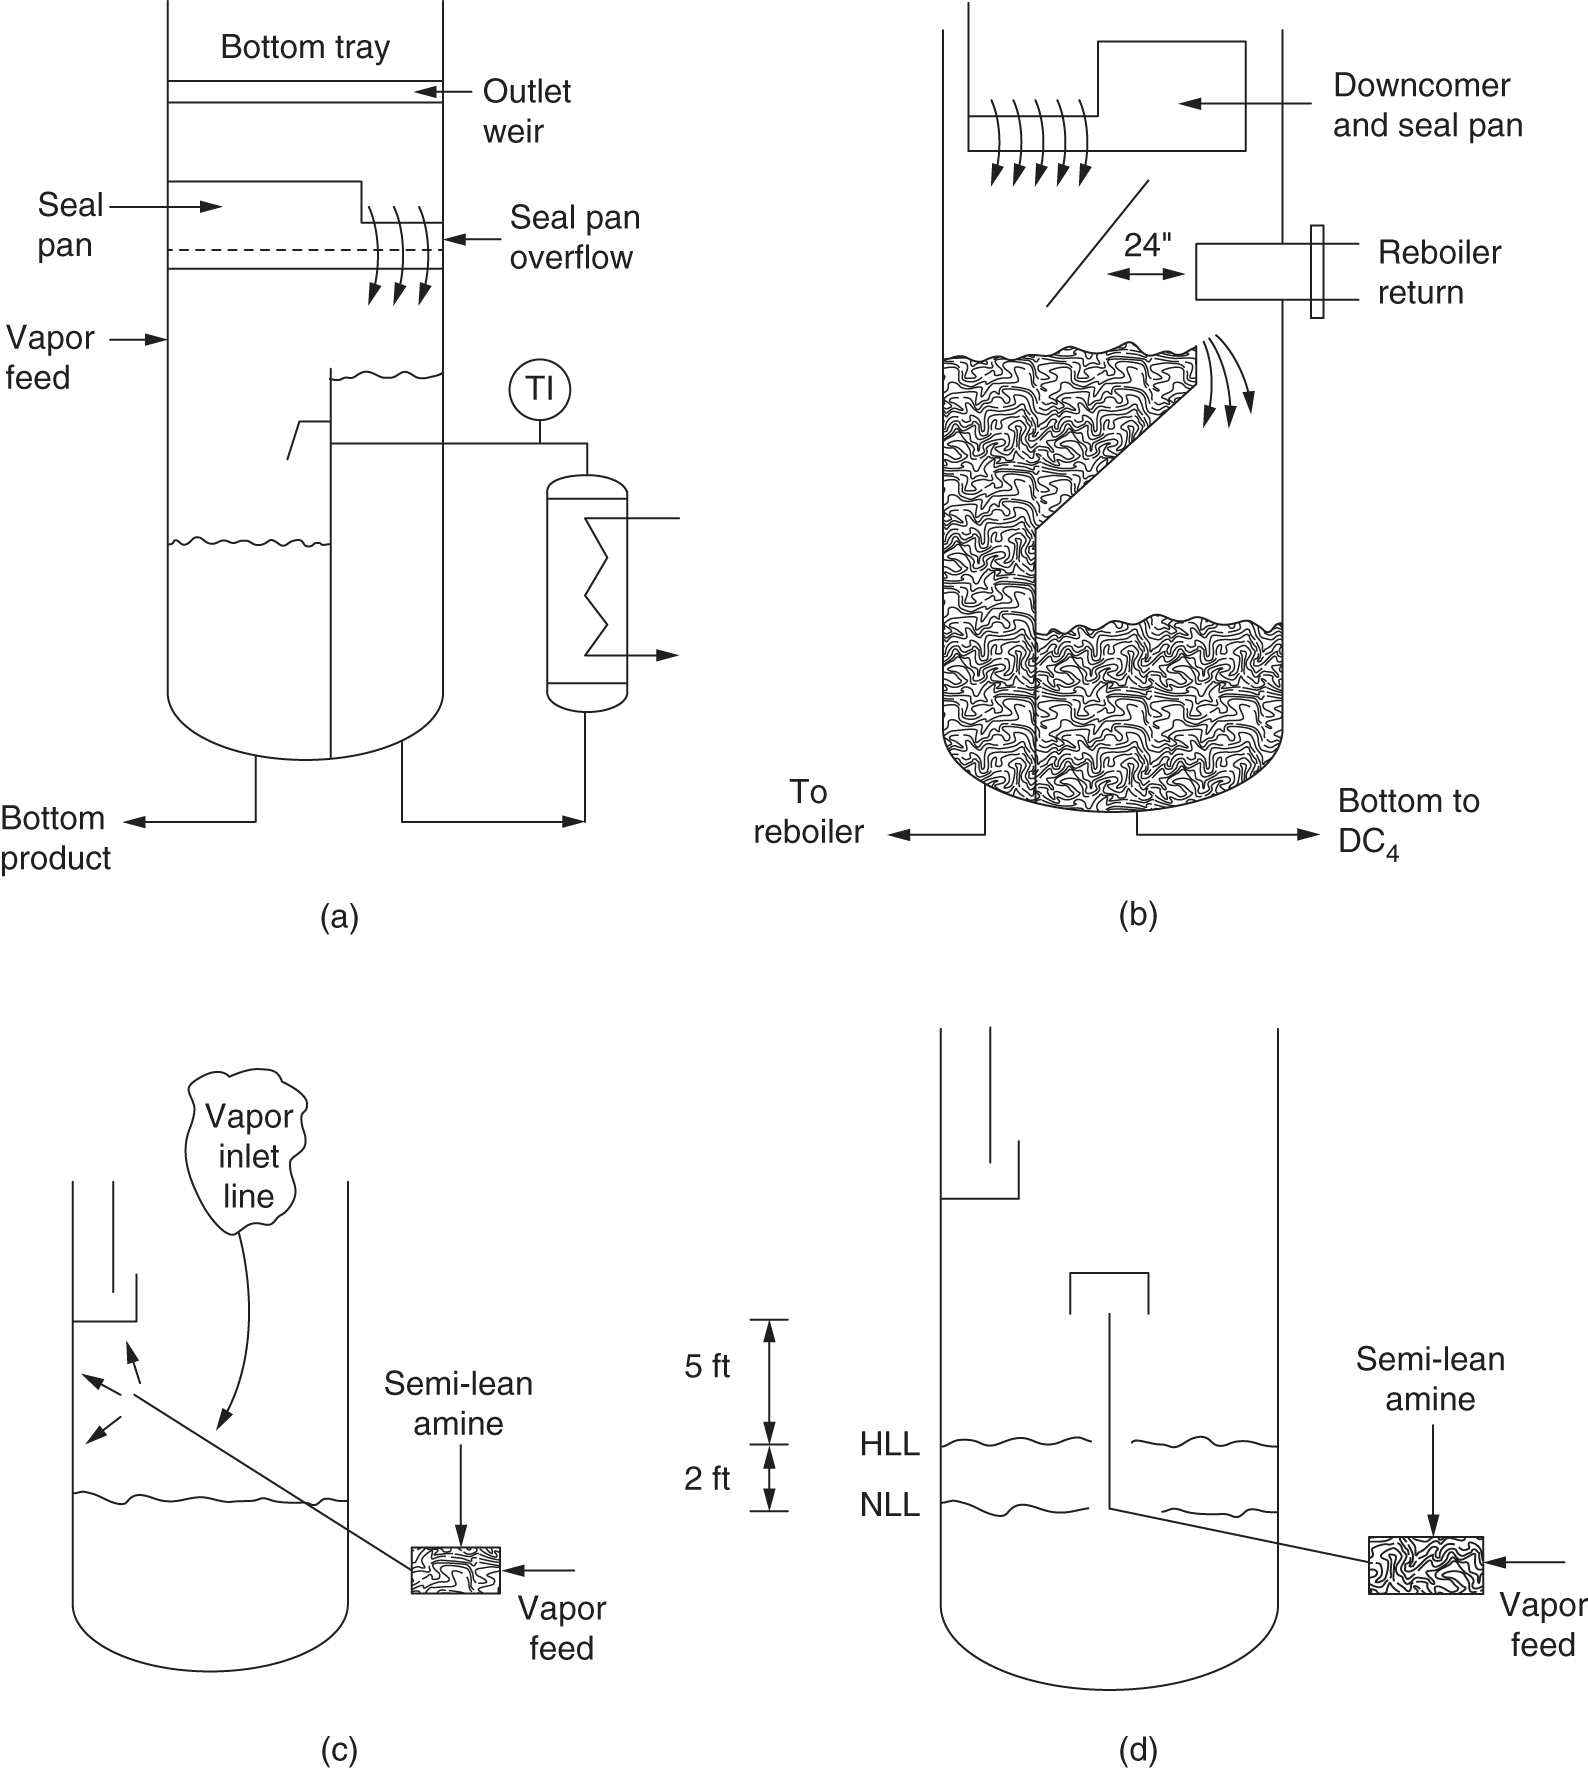
8.16 V-BAFFLES PRODUCE UNEXPECTED FLOW PATTERN AT THE TOWER BASE
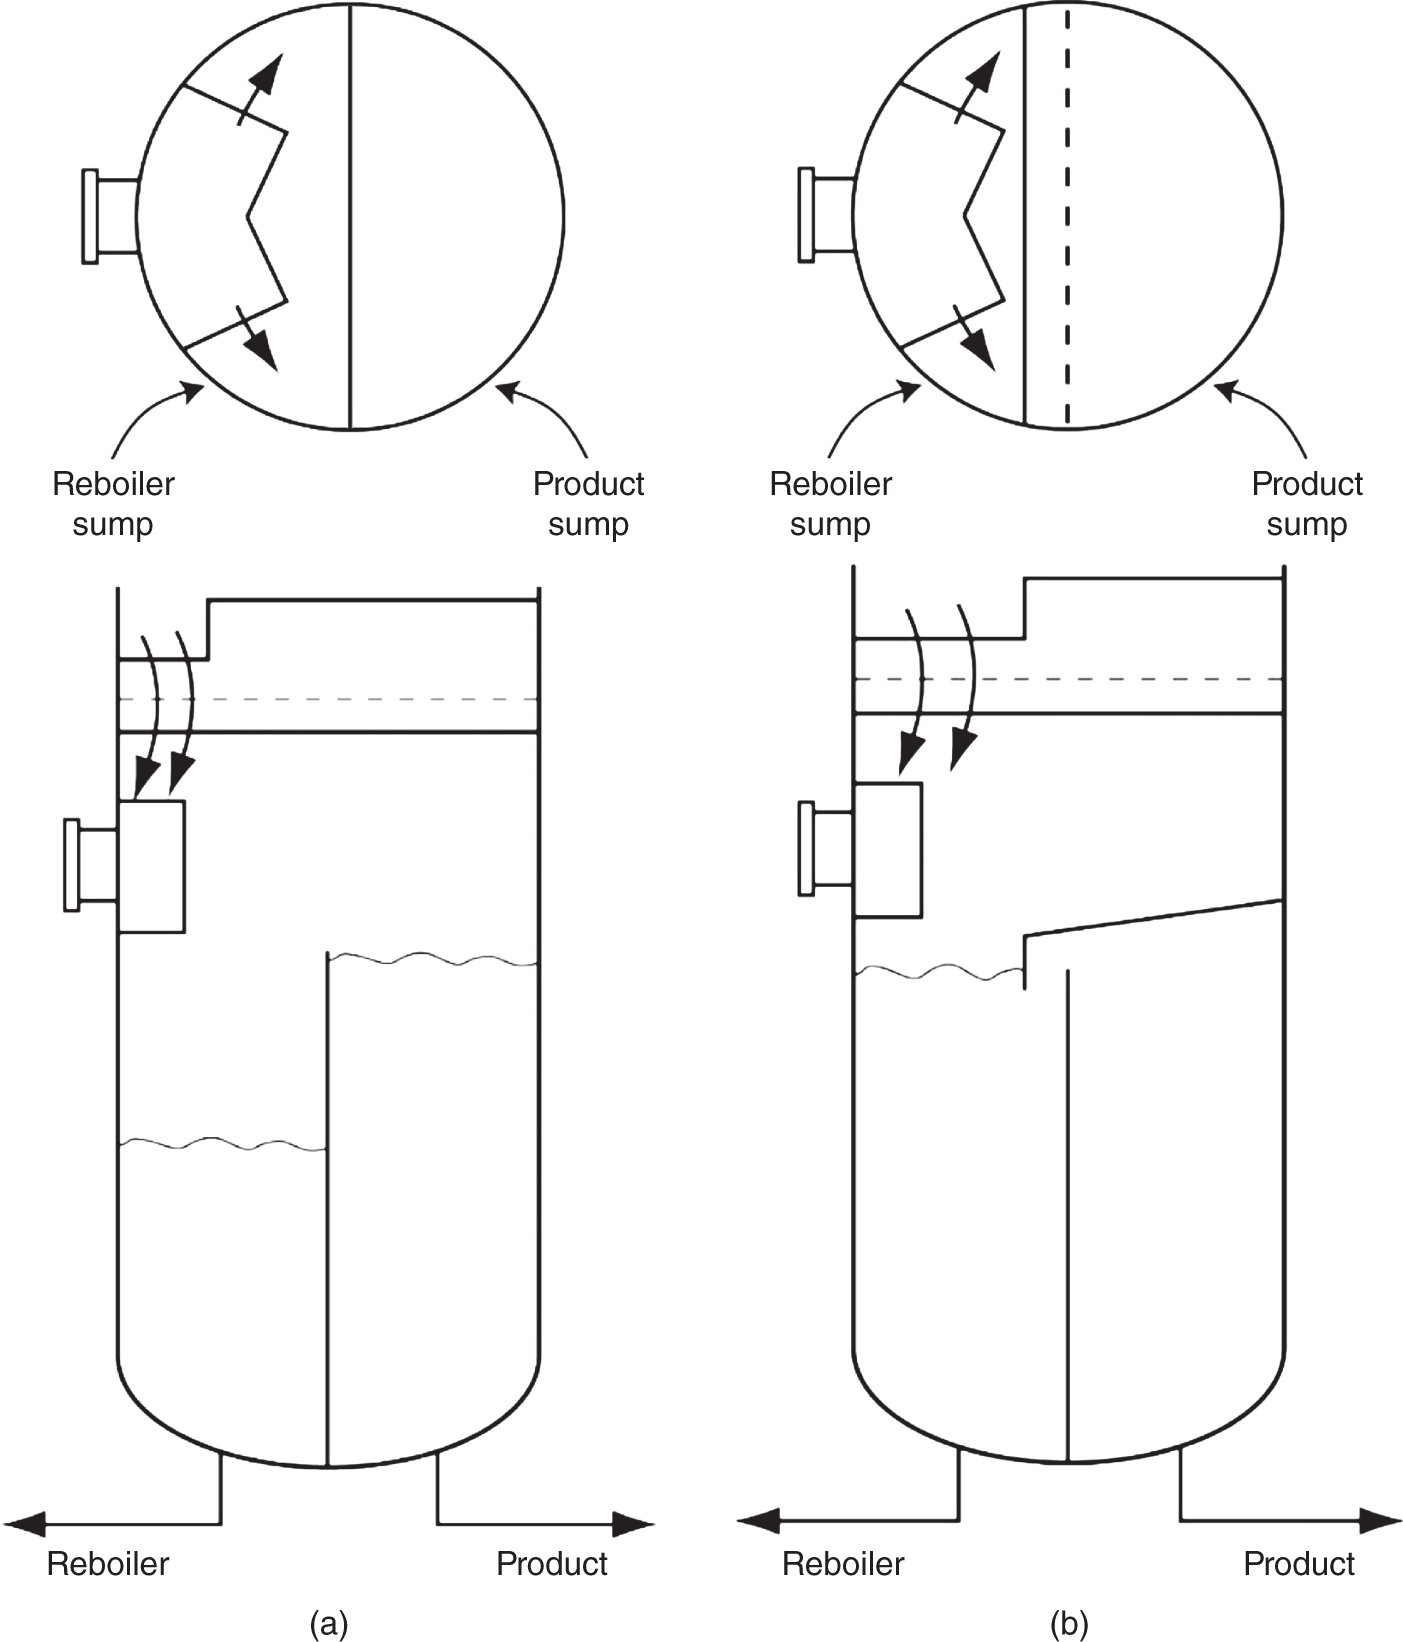
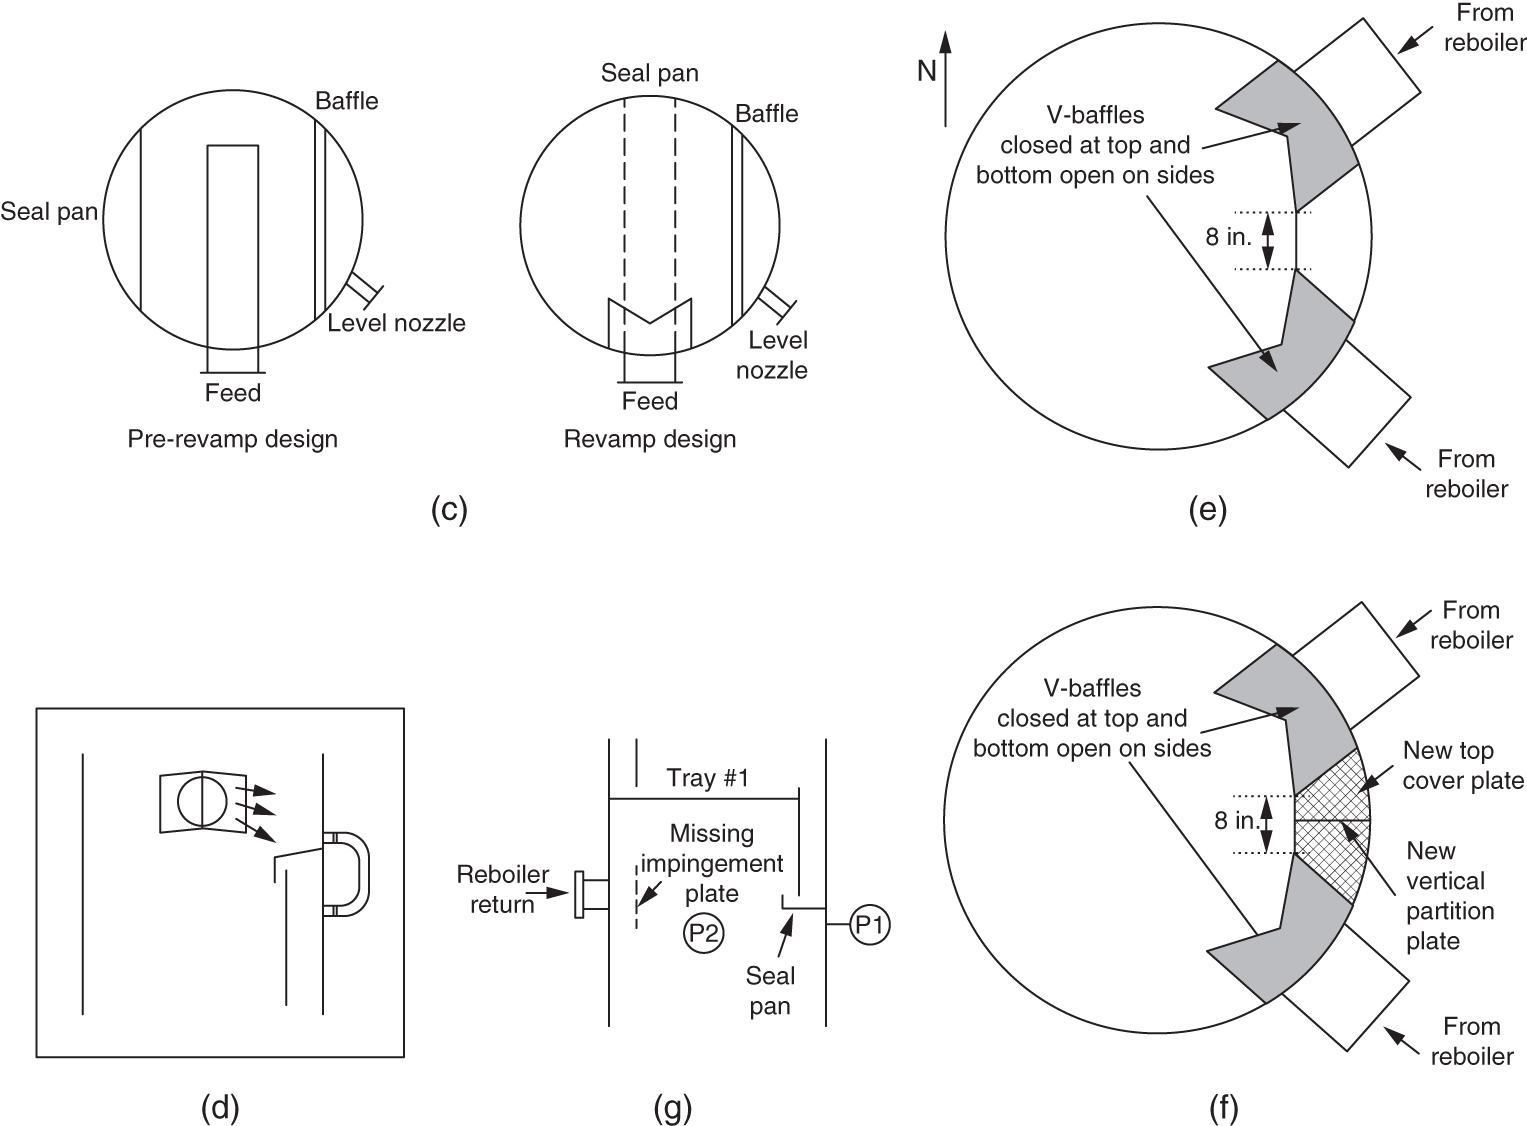
8.17 BAFFLING TOWER BASE BAFFLES
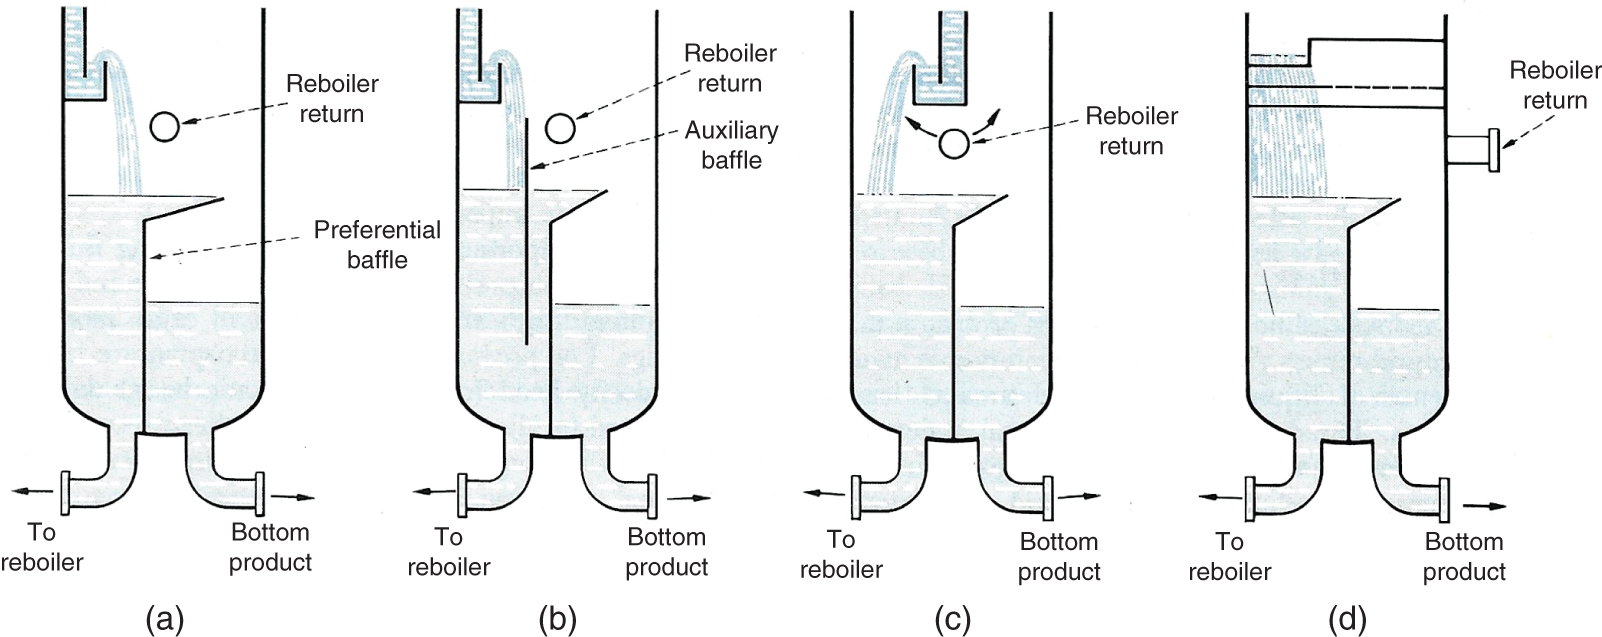
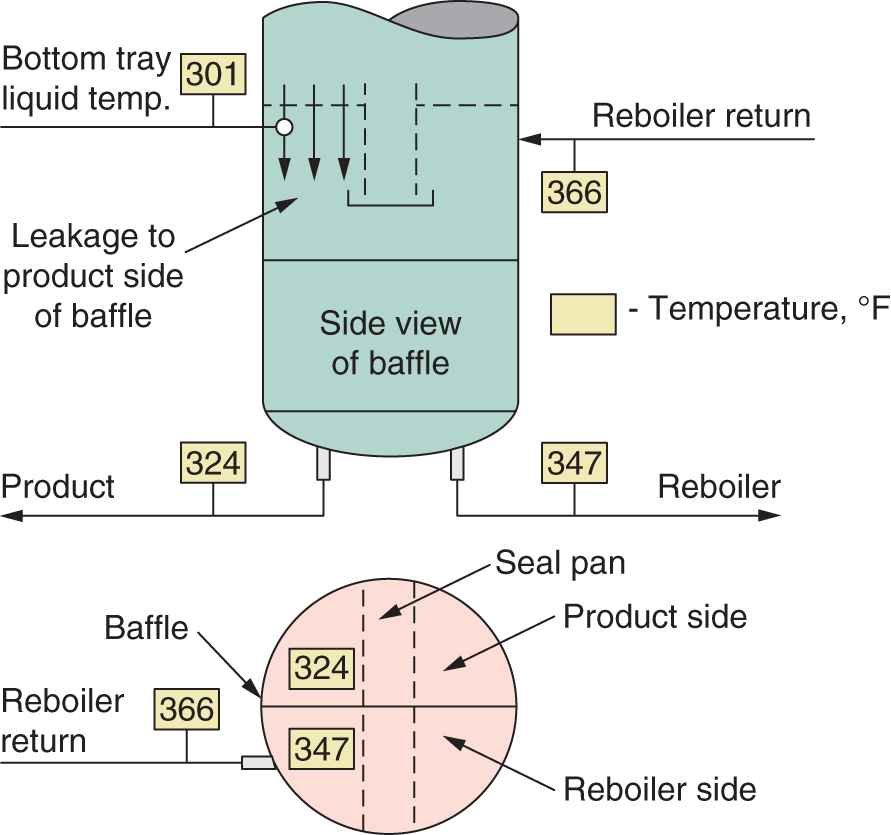
8.18 LIQUID MALDISTRIBUTION AT A FEED OR A PRODUCT DRAW
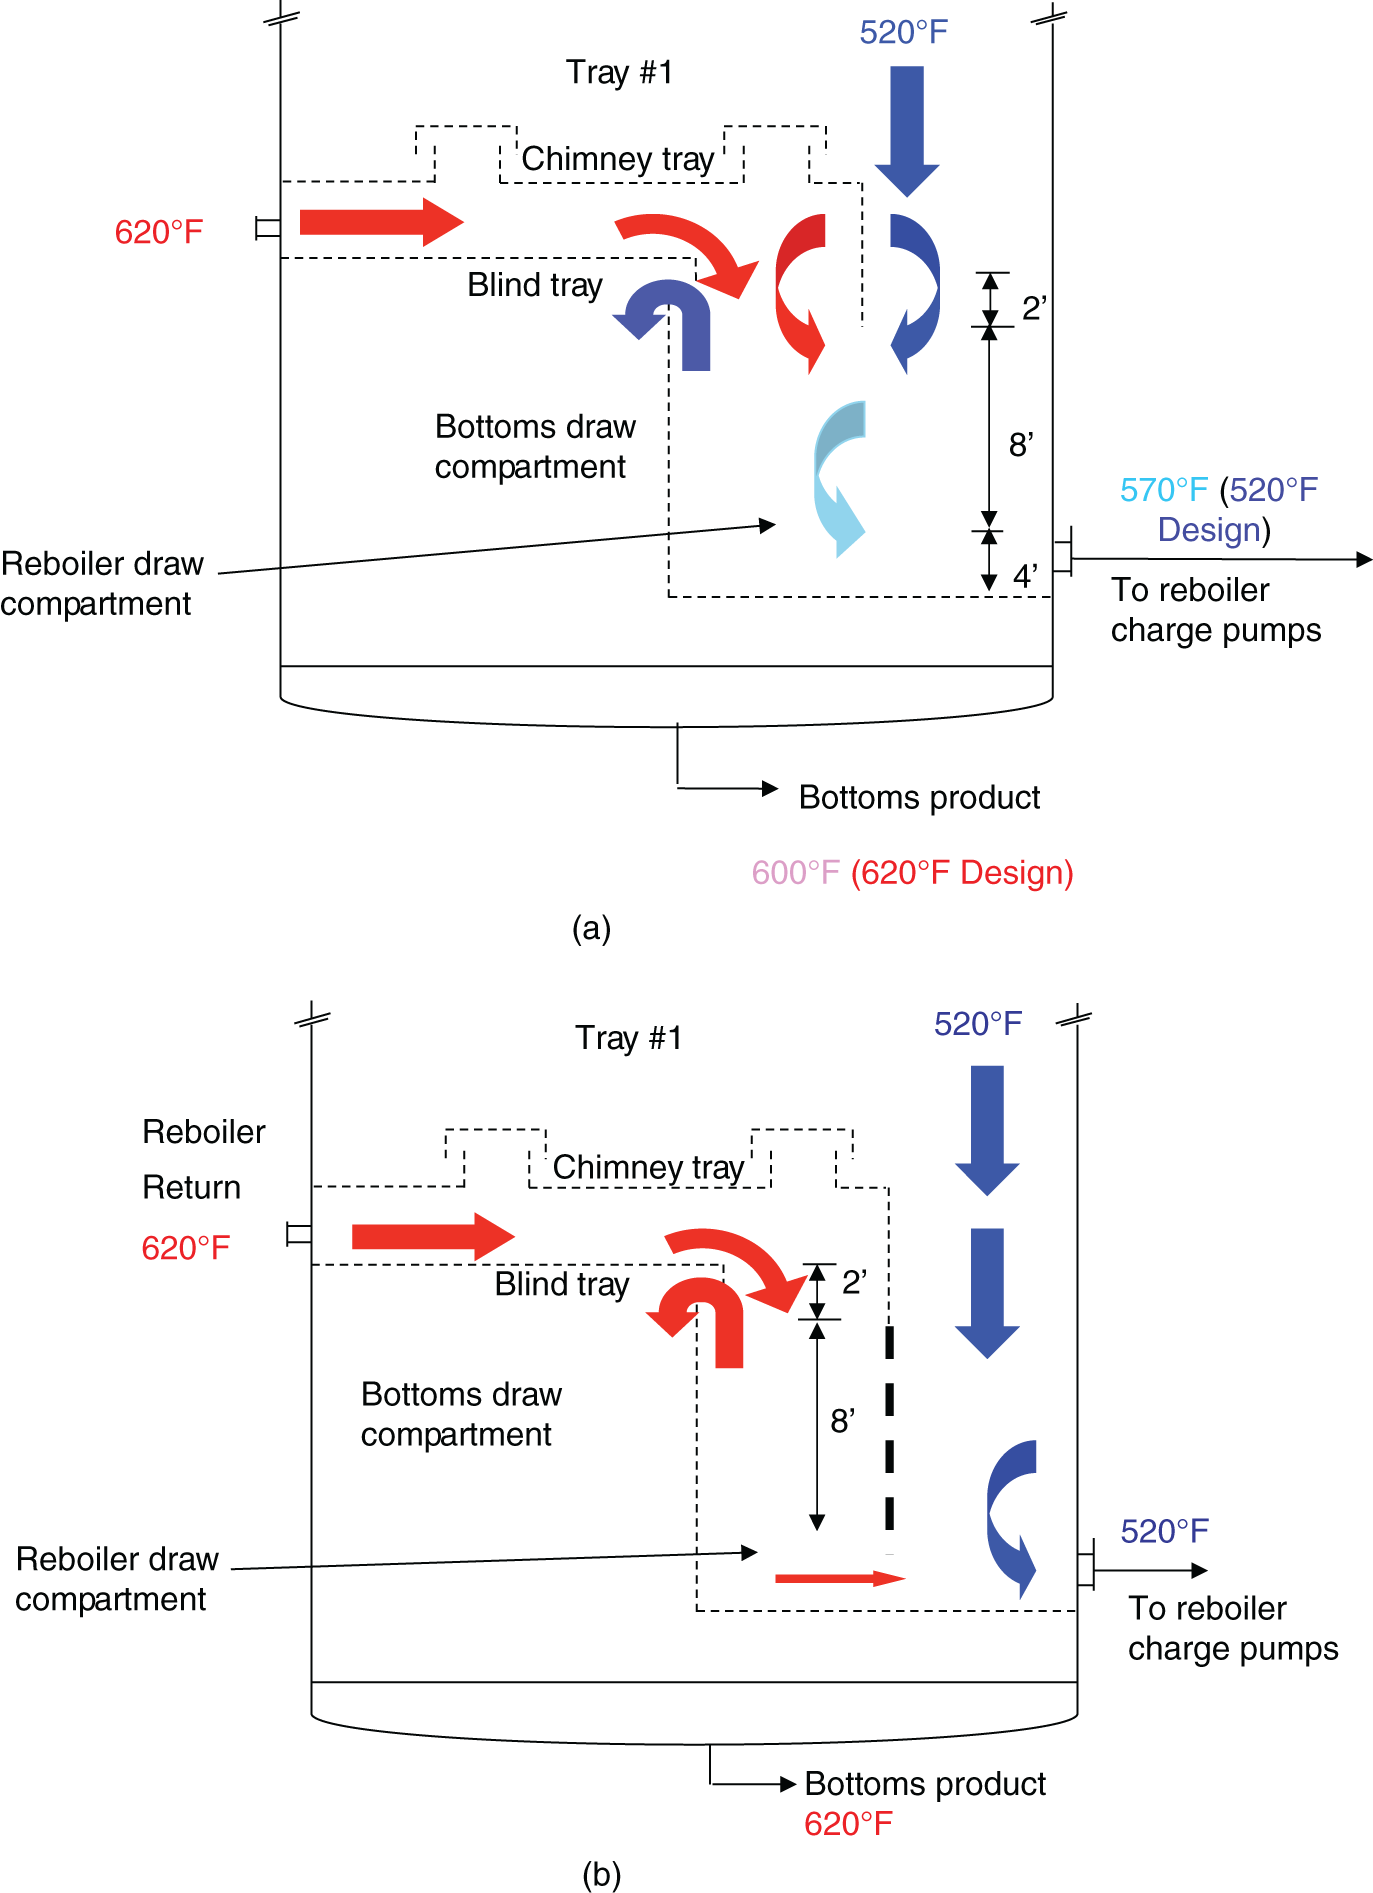
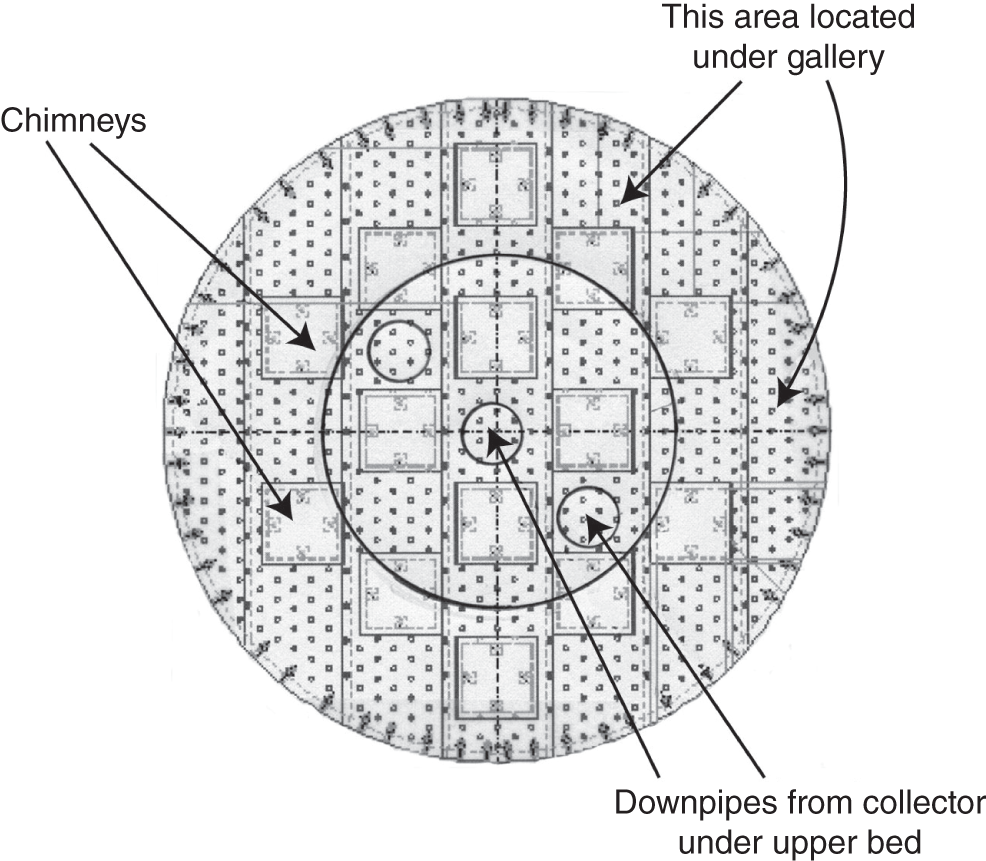
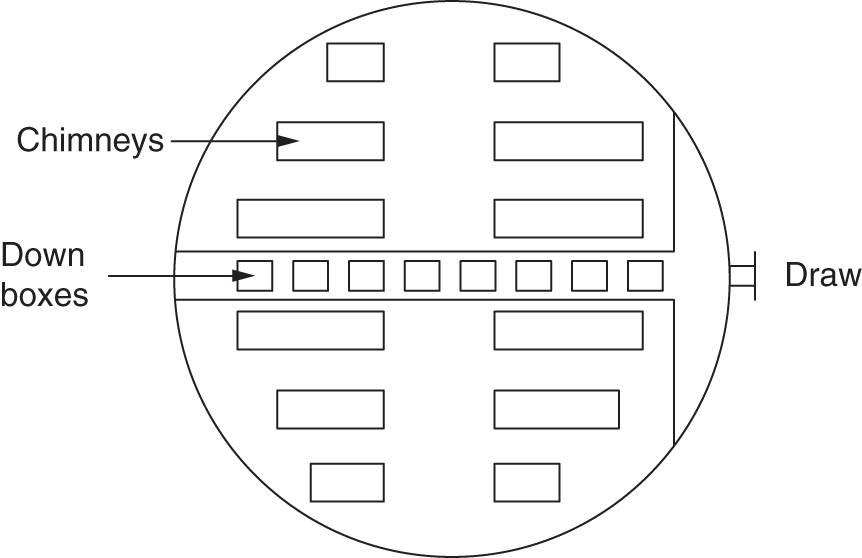
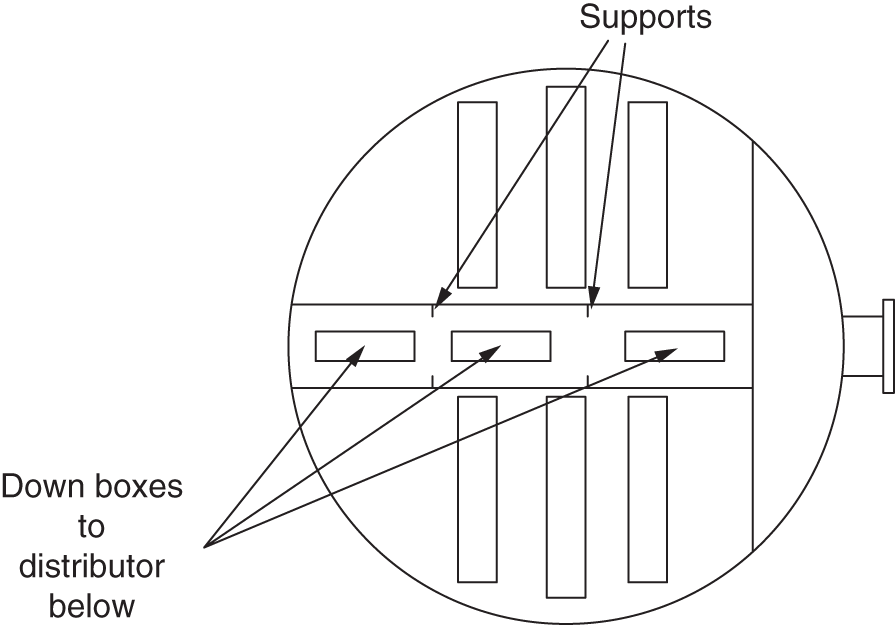
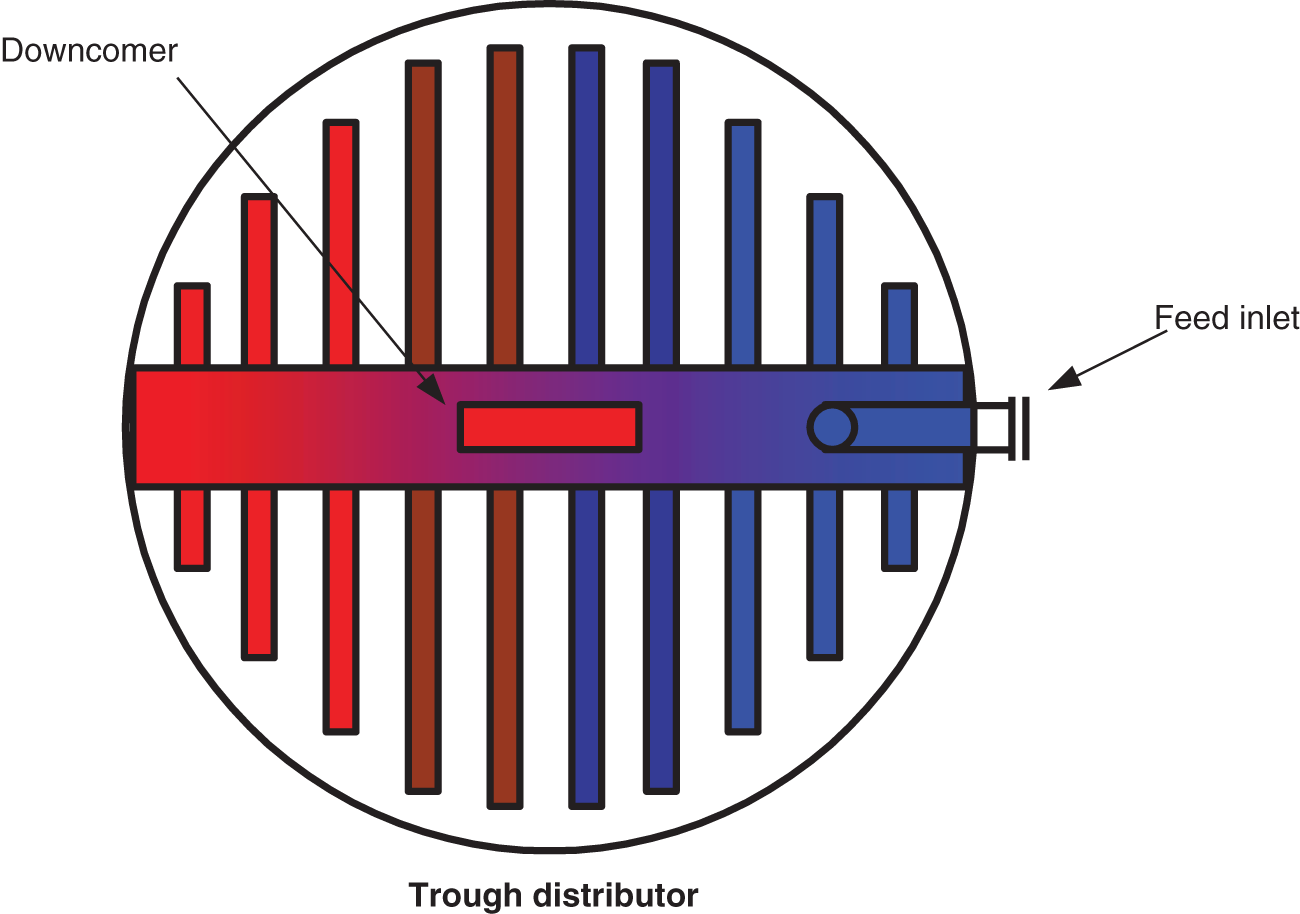
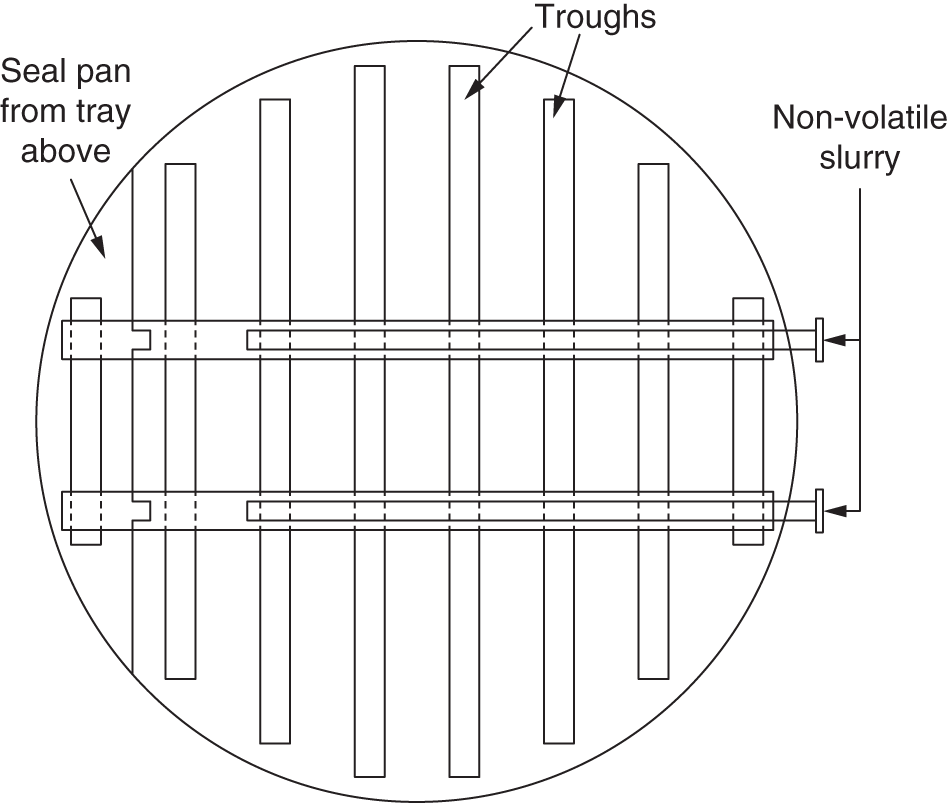
8.19 POOR SOLVENT/REFLUX MIXING GIVES POOR SEPARATION IN EXTRACTIVE DISTILLATION (ED) TOWER
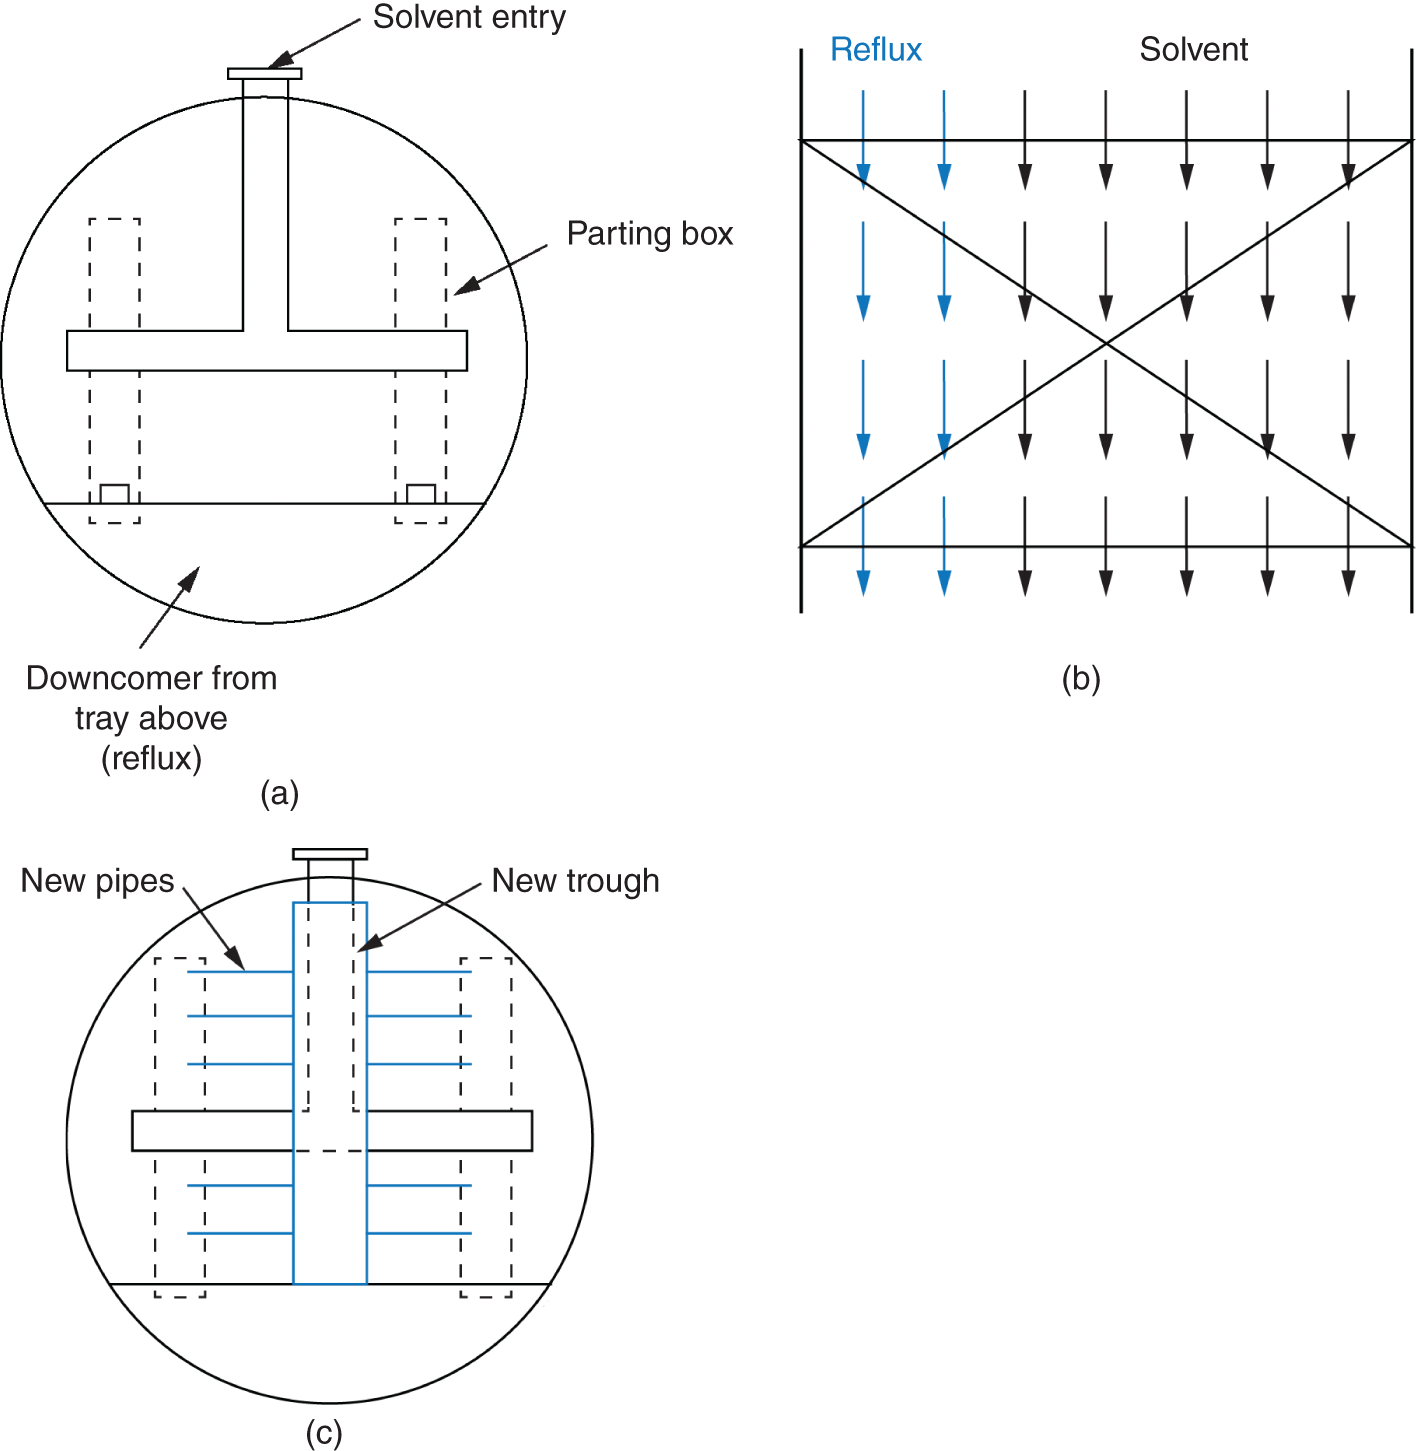
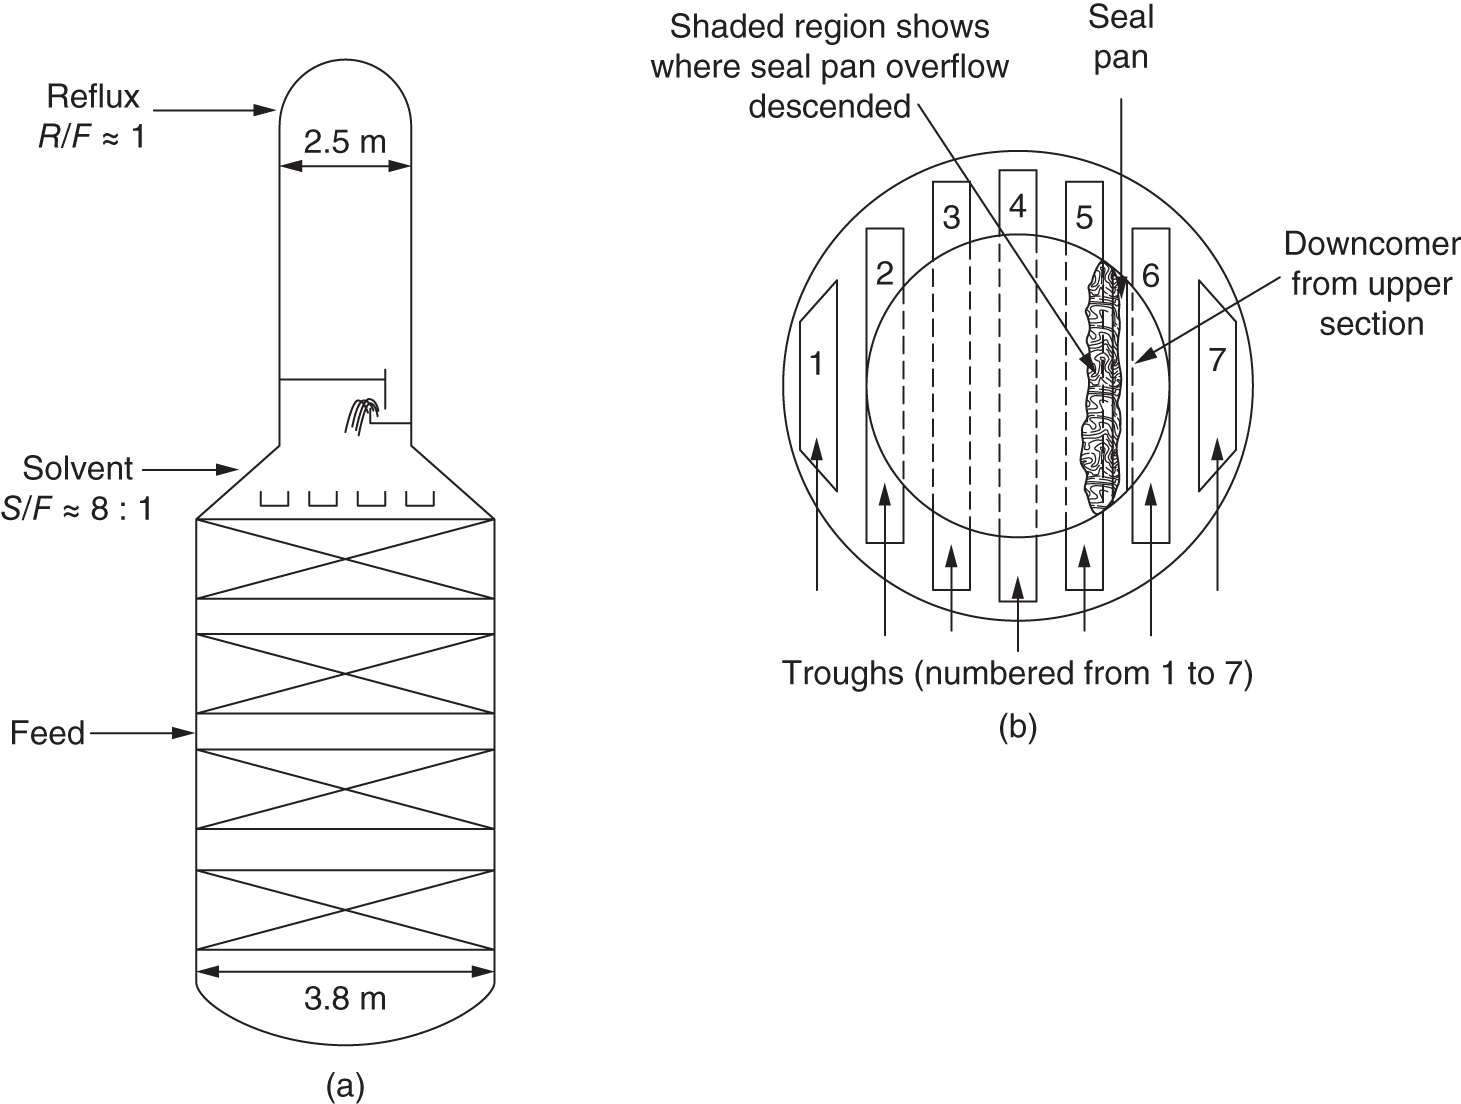
8.20 TWO SEEMINGLY WELL-DESIGNED PIECES MAY NOT WORK WELL WHEN COMBINED
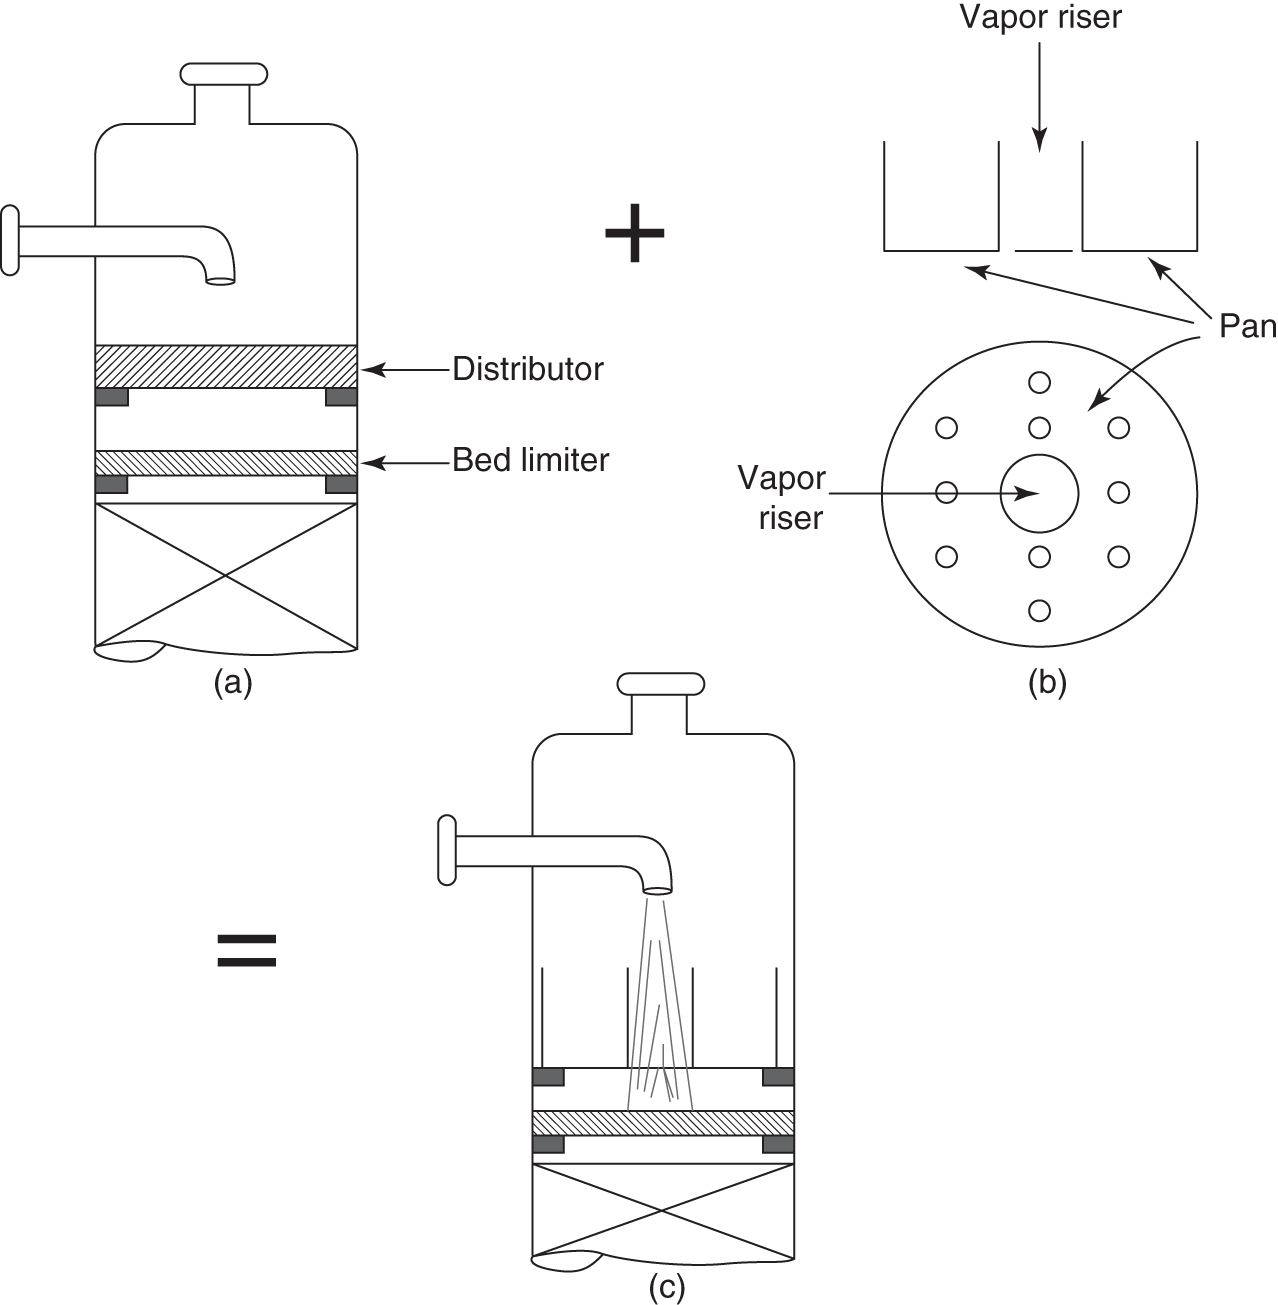
8.21 ANOTHER TWO SEEMINGLY WELL-DESIGNED PIECES THAT DID NOT WORK WELL WHEN COMBINED
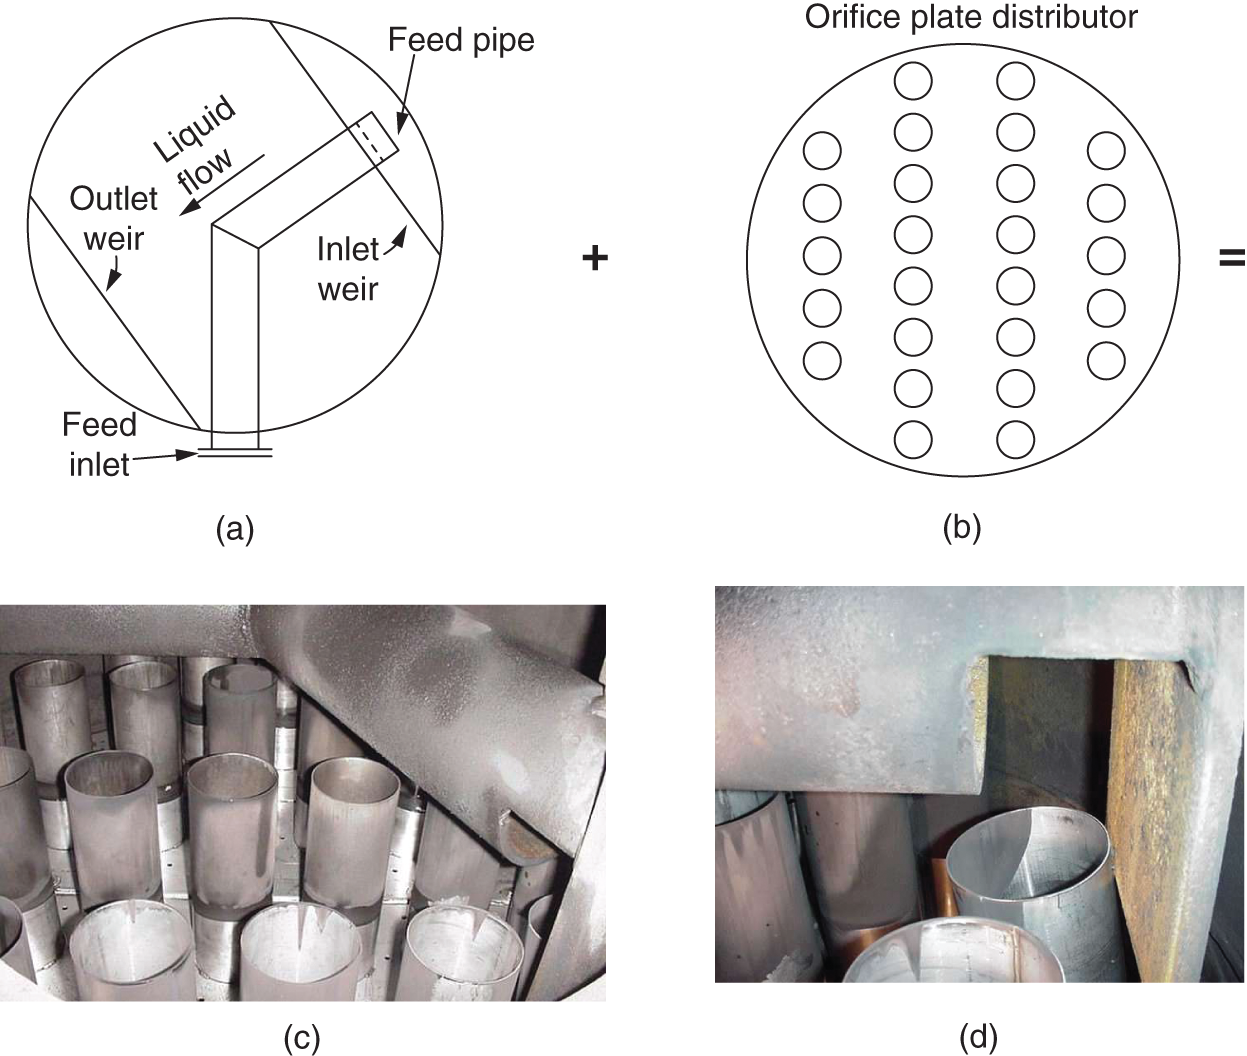
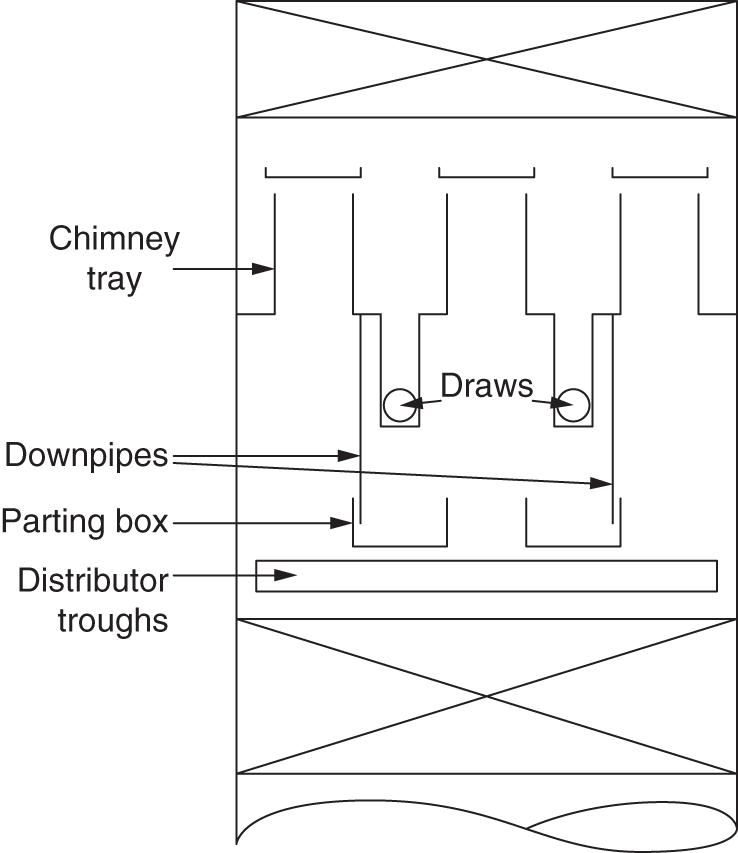
8.22 LIQUID MALDISTRIBUTION OF INTERNAL REFLUX BELOW A SIDE DRAW (275)
8.23 WOULD YOU BELIEVE THIS WAS A REAL TROUBLESHOOTING ASSIGNMENT?