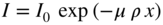
“Gamma scans for distillation are analogous to X-rays in medicine. The process engineer is analogous to the doctor, the gamma scan expert is analogous to the X-ray expert. Until you bring the two resources together, you do not have a good diagnosis.” —(Henry Kister, author) Distillation column gamma scans employ radioactive sources in the 500- to 2500-keV range (66). Compton scattering is the prime process responsible for the attenuation of these rays. The radioactive source usually used is cobalt-60, and less frequently cesium-137. A summary of the principles follows; a detailed description is available elsewhere (66). When gamma rays pass through a medium from a radioactive source to a detector, some of their radiation is absorbed by the medium. The amount of radiation that is transmitted (not absorbed by the medium) is given by (66, 67, 423) where I is the radiation intensity in counts per second, as measured at the detector; I0 is the radiation intensity of the source, in counts per second; ρ is the density of the medium; x is the thickness of the medium; and μ is the absorption coefficient, which depends on the gamma-ray source and the medium material. When the gamma-ray energy exceeds 200 keV, μ becomes independent of the chemical composition of the medium, and the absorption becomes a function of the product of the medium density by the medium thickness (66, 67). For a horizontal chord of fixed length (Figure 5.1a), the intensity of radiation received at the detector is therefore a function of the density of the medium. If the gamma ray passes through metal (very high density) or liquid (high density), the intensity received by the detector is relatively low, but if the ray passes through a vapor space (low density), the detector reading is high. The source and detector are lined up on the same horizontal plane, positioned some distance above the top tray (or the upper tray of the desired scan), and a reading is taken (a gamma ray is “shot”) either across the tray active area or across the downcomer (as desired). Both the source and detector are then simultaneously lowered to the next vertical position, where the next reading (gamma-ray shot) is taken. The source and detector are thus simultaneously moved vertically straight down the column. Metal guides attached to the column and mechanized systems that move the detector and source synchronously down the guides are used for this purpose. Radiation intensity reaching the detector is recorded at each vertical position. High recorded intensities indicate vapor spaces along the ray’s path; low recorded intensities are interpreted as passage through liquid or solid. The vertical intensity profile thus obtained provides information on column behavior and identifies the location and nature of column irregularities. Figure 5.1 Good gamma scanning practices, shown in reference to 2-pass trays. (a) Active area scan and terms of reference; (b) side downcomer scan; (c) center downcomer scan; (d) active area scan looking for maldistribution. This is the most common and least expensive gamma scanning technique, accounting for over 80% of the gamma scan applications. In tray towers, shots are typically taken every 2 in. of vertical height. The shooting continues to the bottom of the tower or to the bottom of the section of interest. After completion of the scan, additional chords can be shot. Often, a second chord is shot through the downcomers (Figure 5.1b or c) or through another pass of the tray to look for channeling (Figure 5.1d). Figure 5.2a (66, 67, 283, 503) and 5.2b (283, 503) include fault-condition diagrams illustrating how different types of irregularities show up on a gamma scan. Figure 5.3 (45) illustrates a typical evaluation of tray active areas. The y-axis shows elevations in reference to a certain point in the tower. Typically, the top tangent line is marked as zero height, and the y-axis shows distances below it. The x-axis shows the radiation picked up by the detector in counts per unit time, plotted on a log scale. In some scans, Eq. (5.1) is applied to convert the counts to a relative density scale. The absolute values of the densities thus obtained are likely to be inaccurate unless reference scans through pure liquid at the same chord are available. Marked on the plot are tray locations and sources of external interference (e.g., welds, supports, nozzles, and insulation rings). The actual scan data, i.e., the connected dots from the measurements taken every 2 in., form the solid plot. The “clear vapor” line on the right side of the plot is a reference line giving the transmission of gamma rays through clear vapor. To reliably determine this line, the scan needs to pass through a region where clear vapor exists (typically above the top tray, above the reboiler return inlet, or above a chimney tray, in the absence of flooding or weeping in this region). The “froth height intensity” line provides a simple, approximate empirical measure of froth heights by averaging the radiation counts of vapor and liquid. In Figure 5.3, the vapor and liquid radiation counts are 3800 and 200, respectively, so the froth line is at their average (about 2000). The froth height is approximated by measuring the distance from deck to spray, as shown for Tray 2 in Figure 5.3. For this tray, the froth height is 9 in. (225 mm). A more accurate method for determining froth heights (160) is discussed in Section 6.1.1. Gamma scan contractors often use their proprietary methods for froth height determination. Froth heights are expressed either as linear values or as percentages of the tray spacing. Figure 5.2 Illustrative gamma scans, depicting various types of column irregularities. (a) Tray column; (b) packed column. (Part (a): From Charleston, J. S., and M. Polarski, Chemical Engineering, January 24, 1983. Reprinted with permission. Part (b): From Leslie, V. J., and D. Ferguson, Plant/Operation Progress, 4(3), p. 145, July 1985. Reprinted with permission.) Figure 5.3 A gamma scan illustrating typical evaluation of active areas of trays based on measured froth heights. (From Bowman, J., Chemical Engineering Progress, p. 25, February 1991. Reprinted Courtesy of Chemical Engineering Progress (CEP). Copyright © American Institute of Chemical Engineers (AIChE).) In Figure 5.3, all the vapor space peaks reach clear vapor, indicating little or no entrainment. When some of the spray approaches the tray above, the vapor space peaks do not reach the clear vapor line. This condition is reported as “entrainment.” The degree of entrainment can be qualitatively inferred from the proximity of the top of the peak to the clear vapor line. The arrows above tray 1 show the commonly used terminology, ranging from “slight” to “heavy” entrainment and finally “flooding.” This is further discussed in Section 5.2.2. Qualitative gamma scans can readily detect gross abnormalities such as flooding, missing trays, collapsed trays, excessive liquid level in the bottom sump, or heavy foaming. This technique can also help diagnose a flood mechanism and shed light on more subtle abnormalities such as high or low tray loadings, foaming, excessive entrainment, excessive weeping, blockage, and multipass liquid maldistribution. Gamma scans performed on a routine basis can also be used to monitor deterioration in column performance due to fouling, corrosion, damage, and other factors. Both entrainment and weeping show liquid in the vapor space, yet their appearance differs. Figure 5.4 (485) shows illustrative active area scans that highlight the differences. Generally, entrainment vapor space peaks (Figure 5.4a) show dense material near the tray floor, becoming less dense as one ascends the vapor space, terminating in a single point before the next tray is encountered. This appearance characterizes the shape of a spray: there are more, larger drops and froth near the tray floor, which show on the scan as high-density material. The entrained drops that reach higher elevations become progressively smaller and fewer. This in turn progressively reduces the concentration of liquid in the vapor space, which shows progressively lower densities as one ascends from the tray floor. Figure 5.4a illustrates peaks typical of different degrees of entrainment. The uppermost tray, just above the 4 ft mark, shows 6–8 in. froth height with no significant entrainment, as the peak gets close to the clear vapor line. The second tray, just above the 6 ft mark, is holding 10–12 in. of froth and has a peak 85–90% below the clear vapor line, which classifies it as slight entrainment (485). Notice the point of inflection in the slope of the froth, suggesting a spray zone developing above the tray froth. The third tray, just above the 8 ft mark, is holding 16–18 in. of froth or spray and has a lower single-point vapor space peak. When the vapor space peak is at about 70–80% of the clear vapor line, it is often classified as “moderate entrainment.” The fourth tray, just above the 10 ft mark, has 20–22 in. froth height and is close to the jet flood point. The vapor space peak is at about 50–60% of the clear vapor, and the entrainment is classified as “severe.” Figure 5.4 An active area gamma scan illustrating (a) entrainment and (b) weeping. (From Tru-Tec Division, “Sample Scan Brochure,” 1998. Available from Tracerco, Pasadena, Texas. Reproduced Courtesy of Tracerco.) Figure 5.5 (510) provides a pictorial illustration of how active area gamma scan peaks vary as internal rates are increased in a tower. Figure 5.5a shows operation at the design rates, which for this tower were well below flood, with froth heights less than half the tray spacing. Figure 5.5b and c shows how the peaks increase as rates were progressively raised to 120% and 130% of design, respectively. At 130% of design, the froth height on the feed tray approached the tray above, with some entrainment to the tray above, as evidenced by the absence of clear vapor above this tray. The trays below the feed still had some margin from flood. Note that the entrainment classification from the gamma scans does not coincide with the amount of liquid entrained or carried over from one tray to the next. The entrainment reported by gamma scanners is a measure of how much liquid is present at the vapor space peak. Gamma scans do not measure how much of this reaches the tray above. One case history was presented (377), and the author experienced many similar cases, in which a column performed well despite severe entrainment from many of its trays. Figure 5.4b illustrates different degrees of weeping. As distinct from the point vapor space peaks that entrainment gives, weeping gives flat peaks. Weeping is liquid raining from the tray above, and it will have the same uniform liquid concentration (and therefore the same density in the scan) at any elevation in the vapor space. Another distinguishing feature is that weeping usually occurs at lower vapor loads, where the froth heights are low, while entrainment is most severe at high vapor loads. Likewise, if scans are performed at different vapor loads, the entrainment will increase, while weeping will diminish, with higher vapor loads. Finally, look closely at the top tray. Entrainment will show up above the top tray, weeping will not (as there is no tray above from which the weep comes). In Figure 5.4b, the uppermost tray, just above the 4 ft mark, is holding 6–8 in. of liquid and has a vapor peak underneath of about 80–90% of the clear vapor. This is classified as “slight weeping.” The second tray, just above the 6 ft mark, is holding 4–6 in. of liquid and the vapor peak underneath is at about 70–80% of the clear vapor. This is classified as “moderate weeping.” The third tray, just above the 8 ft mark, shows very little (about 2 in. or less) liquid on the tray, characteristic of dry or damaged tray (485), and the vapor space peak underneath is at 50–60% of the clear vapor. This is classified as “severe weeping.” If the scan indicates moderate or severe weeping, it is worthwhile to check the amount of weeping that should be expected by calculation. Good procedures for weep calculation are available in the literature (74, 179, 193, 245, 300). If the calculation predicts only a small amount of weep while the scan shows severe weeping, then there is a good possibility of corrosion, damage, manways left open, or some unexpected hydraulic mechanism (such as channeling or leakage at the support rings) that may cause the weeping. See Section 3.2.2 for troubleshooting for tray weeping. In packed towers, a “grid” of four equal chords is often shot, one chord after the other (Figure 5.6a). For each chord, the source and detector are moved simultaneously down the bed, taking shots every 2–4 in. This “grid” gamma scan looks for maldistribution and channeling, which are by far the main causes of packed tower efficiency loss (Section 4.1). When liquid distribution is good, the four chords give the same detector readings, so their plots fall right on top of one another (Bed 1 in Figure 5.7). Differences between the chords are interpreted as bed maldistribution. For instance, one of the chords in Bed 2 of Figure 5.7 shows more radiation transmission than the other three, indicating less liquid flowing through the bed along this chord. The higher transmission initiates immediately under the distributor, indicating less liquid issuing from the distributor along this chord, and therefore a distributor problem. In this case, the problem was out-of-levelness. Gorrochotegui and Portillo (137) presented a very similar out-of-levelness scan, with two chords showing more radiation transmission than the other two. Figure 5.5 Active area gamma scans as the tower rates are raised and the froth heights increase. (a) Lowest rates, for which the tower was designed; (b) 120% of the design rates, froth heights increase, and the dispersion approaches the tray above; (c) 130% of the design rates, dispersion reaches the tray above, getting close to flood at the feed tray. (From Xu, S. X., C. Winfield, and J. D. Bowman, Chemical Engineering, p. 100, August 1998. Reprinted with permission.) Figure 5.6 Gamma scanning chords used in packed towers. (a) Grid scan, recommended for diameters 4 ft or larger; (b) triangle scan, used for diameters 2–4 ft (c) + scan, used for diameters <2 ft. The packing chords are usually oriented such that two intersect the other two at an angle of 90°. This arrangement is considered optimal for the verification of the presence and integrity of liquid distributors and collectors. Judicious setting of the chords can also provide a measurement of liquid height and frothiness in collectors, parting boxes, and distributors, and identify trough or pan overflows or level unevenness causing liquid maldistribution or premature floods. Overflows and plugging (which too will cause overflows) were identified as major troubleshooting issues in packed towers (Sections 4.5 and 4.6). FRI’s tests (382) show that commercial gamma scans can provide excellent measurements of liquid levels in the distributor troughs of a test tower. In addition, grid scans can normally detect the position of the bed, the disappearance of some of the packings (e.g., by being corroded away), significant blockages, and local flooded regions. Figure 5.8 (64) shows a single chord scan in the FRI 4 ft ID tower containing fourth-generation random packings with the C6–C7 test system at 24 psia at total reflux under excellent distribution conditions as verified by FRI. The various curves are for different loadings through the bed, ranging from a dry bed to 102% of the maximum useful capacity (MUC). At 100% of the MUC the HETP was good, and at 102% it doubled. Figure 5.8 shows that up to 79% of MUC, the bed appeared only slightly denser than in the dry scan. The density significantly increased at 100% of MUC. It follows that the relatively high density in the scan implies the proximity of flooding. Figure 5.9 shows the corresponding distributor liquid level, showing clear increases as the liquid loads were raised. The horizontal lines show how the liquid levels were determined. The liquid levels measured in the distributor were in excellent agreement with the bubbler measurements (64) conducted by Fractionation Research Inc. (FRI). Vidrine and Hewitt (493) discussed some limitations that constrain the accuracy of the liquid maldistribution diagnostics. For instance, with an 8 ft diameter tower, packing density of 15 lb/ft3, and low liquid wetting, the liquid accounts for only 1.5 lb/ft3. In this case, a 50% maldistribution results in a radiation variation similar to that produced by a 1.25″ shift in both source and detector positions (e.g., due to a platform disturbance or by wind). In addition, the statistical error in radiation counting typically alters the calculated density by about twice the square root of the count rate, which in the cited example is equivalent to a 50% liquid maldistribution. Finally, Vidrine and Hewitt point out that the error rapidly escalates with reduced source strength and wider towers. In large-diameter towers (>15–20 ft diameter) the source needed for obtaining a reliable liquid maldistribution diagnostics may be too strong to be practical. Figure 5.7 A packed tower gamma scan, illustrating excellent liquid distribution in the top bed, gross liquid maldistribution initiating at the distributor in the middle bed, and mediocre liquid distribution in the bottom bed. (From Tracerco, “Process Diagnostics – TRU-SCAN® Case Studies,” 2010. Available from Tracerco, Pasadena, Texas. Reproduced Courtesy of Tracerco.) Whenever possible, grid scans should be preferred. In smaller columns (<4 ft diameter), a grid scan may not be practical, and is often substituted (376) by a triangular scan (2–3.5 ft diameter, Figure 5.6b) or by a “+” scan, which means two chords perpendicular to each other (<2 ft diameter, Figure 5.6c). Refer to Section 9.2.8 for a discussion on an issue with + scans. Figure 5.8 A single-chord gamma scan of a bed of fourth-generation metal random packing under excellent liquid distribution in a 4 ft ID test column. The curves show scans for total reflux operation ranging from a dry bed to a 102% of the maximum useful capacity. (From Chambers, S., L. Pless, R. Carlson, and M. Schultes, “Gamma Scan and CAT-Scan Data from a Distillation Column at Various Loadings,” The Kister Distillation Symposium, Topical Conference Proceedings, p. 119, the AIChE National Spring Meeting, San Antonio, TX, April 29–May 2, 2013. Copyright © FRI. Reprinted Courtesy of FRI.) Figure 5.9 A single-chord gamma scan of the distributor in the 4 ft ID test column of Figure 5.8. The curves show scans for total reflux operation ranging from a dry bed to a 102% of the maximum useful capacity. Legend is the same as for Figure 5.8. (From Chambers, S., L. Pless, R. Carlson, and M. Schultes, “Gamma Scan and CAT-Scan Data from a Distillation Column at Various Loadings,” The Kister Distillation Symposium, Topical Conference Proceedings, p. 119, the AIChE National Spring Meeting, San Antonio, TX, April 29–May 2, 2013. Copyright © FRI. Reprinted Courtesy of FRI.) In this application, a number of strategically placed stationary gamma-ray sources are placed along the column shell at elevations coinciding with vapor spaces inside the column. A stationary detector is placed right across from each source at the same elevation. Starting in the unflooded condition, all these detectors will read high as the gamma rays travel through vapor. The rates (reflux, boilup, feed, or whatever variable is studied) are raised until the amount of radiation transmitted sharply falls in one of the vapor spaces, indicating liquid accumulation and therefore flooding. The location where the radiation transmitted initially drops off is where flooding initiates, and the rates at which it occurs are the flood rates. The author has had extensive excellent experience with this technique, and many other successful applications are described in the literature. In one case study (509), regular gamma scans at high rates identified flooding in two regions, one region near the top and another near the bottom. It was required to determine which floods occurred first. Stationary source and detector pairs were placed between the top two trays, above the bottom tray, and below the feed point. As rates were gradually raised, these points were continuously monitored. This test conclusively showed that the top point flooded first. In another case (146), a stationary monitor was set up 15 in. above the feed tray, this time using neutron backscatter (Section 6.3) instead of gamma scans. When feed rates were raised, the detector saw liquid accumulation well before the pressure drop in the tower started rising, verifying flood initiation at the feed tray. Stationary monitoring is useful for determining the initial point of flooding, for calibrating liquid level instruments, for detecting entrainment and overflow from packing distributors, and for detecting floods due to high bottoms level. Stationary monitoring is also valuable for accurately determining the flood rates, permitting engineers and operators devise a strategy for pushing the tower to its limits without flooding (45). One limitation is that the vertical positions of the stationary sources cannot be too close to each other (typically about 6 ft) to avoid radiation interference. This can be overcome by repeating the test after moving the stationary monitoring a short distance up or down. In one case, stationary monitoring detected no flooding on the bottom tray, even though flooding occurred a few trays above. The test was repeated after moving the bottom monitoring one tray up. This time flooding was observed. This suggested flooding by downcomer backup, as the hydraulic loads were slightly higher on the bottom tray, so the only conceivable explanation for no flood at the bottom tray and flooding on the next was that the bottom downcomer was much longer than those above and could tolerate a higher backup. Gamma scans can detect plugging, presence of vapor in liquid lines, and presence of entrained liquid in vapor lines. This technique can give reliable quantitative numbers when performed properly. The basis of the method is Eq. (5.1). For best results, a piece of pipe of the same diameter, thickness, and material as the pipe to be checked is cut in the workshop. A flat plate is welded or flanged to one end, forming a cylinder closed at the bottom and open at the top. The empty cylinder is then gamma scanned. The cylinder is then filled with water and scanned again. From these, the constants in Eq. (5.1) are evaluated. Next, the pipe to be checked is scanned at one or several spots. The density of the material inside the pipe can be interpolated using Eq. (5.1). It is a good practice to scan in a + formation (in a horizontal pipe, top to bottom and left to right). As an additional check for liquid pipes, it may be desirable to scan the pipe to be checked, or a similar pipe carrying a similar process liquid, at a location where plugging and vapor bubbles are unlikely. This check should yield the density of the process liquid, which should equal that from the simulation. Our experience with this type of scanning in liquid pipes, both for determining plugging and vapor bubbles, qualitatively and quantitatively, has been excellent. With scanning vapor pipes for liquid entrainment, our experience has been good qualitatively, but the quantitative results did not always match our expectations. Ferguson (Case 6.8, Ref. 201) reports a clever application of this technique to check for slug flow in a tower feed pipe. They positioned a source and detector across the upward elbow of the feed pipe at the bottom of the vertical section and monitored the intensity of radiation passing through it over time. Rapid cycling of this intensity indicated that liquid was collecting and disappearing, as in slug flow. Garcia et al. (118) reported successfully applying this technique to verify vapor presence and measure density in a liquid product rundown line. Pitfalls must be avoided, as they can degrade the invaluable information produced by gamma scans into inconclusive, even misleading, diagnostics. The guidelines below can help avoid common pitfalls that adversely affect the validity and quality of information supplied by gamma scans: Distillation troubleshooting is analogous to medical diagnostics. The best way to work with gamma scanners is like a good doctor working with an X-ray specialist. Remember, it is the doctor, not the X-ray specialist, who does the diagnosis on the patient. While the X-ray information is very important, often the doctor cannot diagnose the ailment without it, it is only one piece of the puzzle that needs to fit in with the other pieces. And if it does not, you do not have a diagnosis. Just like a good doctor in this situation, you will need to perform more tests and checks until you can reconcile what you know about the tower with what the gamma scanners tell you. Sections 5.5.9, 5.5.20, as well as Ref. 18, describe case studies where gamma scans used as the sole basis for troubleshooting led or could have led to misdiagnosis. Figure 5.10 Bad downcomer gamma scanning practices, not recommended, shown in reference to 2-pass trays. (a) Side downcomer scan; (b) center downcomer scan; (c) center downcomer diagonal scan; (d) side and center downcomer scan, terrible practice. Tray towers are not immune to problems with overflowing collectors, and it is valuable to measure liquid levels on them, as described in Section 5.5.19. There is much that the scanners do to contribute by good choice of the sources used and the degree of collimation. Gamma radiation does not propagate as a perfectly collimated beam. It tends to scatter, at times producing “fuzzy” pictures. In most of the author’s investigations, the scanners’ reviews made beneficial changes to our plans. Adding scans increases costs. However, the main cost of gamma scans is the transportation and travel time of the scanners and their equipment to the site, getting through the required safety and work permits, and marking up the column and setting up the equipment. While the scanners are already on site, the cost of performing additional scans is relatively low. Still, this is an expense that should be saved if the scans are unnecessary. This additional cost needs to be considered against the potential benefits. These scans are conducted at the turnaround or during an outage in which the liquid is drained from the trays or packings. The benefit of dry scans is that they provide a reference where there is no liquid in the tower. These scans are most beneficial in the following situations: In most other situations, there is less incentive to perform a dry scan. These scans are conducted a short time after the tower returns to full production rates following a turnaround in which the tower was cleaned. The initial operation scans provide a reference when the internals are clean and undamaged. In the following situations these scans are invaluable and therefore frequently performed: To track changing conditions inside the tower (fouling, damage, corrosion), it is useful to shoot gamma scans of the tower or the affected region at regular intervals. If damage due to upsets is suspected, a new scan can be performed following every suspected damage episode. These scans are invaluable for The gamma scans cost usually dwarfs the savings from achieving any of the above objectives. The information provided by the gamma scans monitoring is invaluable for optimizing the process and implementing the correct, optimal temporary and/or permanent solution. The author’s experience is that at least half the time downcomer scans can contribute enough to the diagnostics to justify their costs. Typically, we see downcomer scans performed about 10% of the time. Failure to cure a problem due to misdiagnosis can bear tremendous costs, and good downcomer scans can go a long way to avoid such failure. Downcomer scans are generally not performed often enough in the industry. In order to make an educated decision as to whether to proceed with a downcomer scan, consider the following: The “bottleneck” referred to may be a hardware bottleneck, or it may be a bottleneck induced by fouling, damage, corrosion, or foaming. Brown Burns et al. (52) demonstrated the value of additional scans for diagnosing the nature of a bottleneck. The fractionator under investigation experienced bottlenecks in three different regions, all of which were associated with fouling or corrosion. Once the initial scan identified the bottleneck regions, Brown Burns et al. judiciously varied the vapor and liquid loads throughout each bottlenecked section of the tower. In some sections, the liquid loads were slightly changed, while in others, they were quite drastically changed. The result was a much better diagnosis, leading to measures that optimized operation and guided turnaround modifications. Scanning costs can be minimized if these additional scans are performed right after the original scan. In many investigations, there is a proposed expensive solution on the table, but there is uncertainty about its effectiveness. There may even be concerns that a proposed modification will make the tower worse. An opportunity may arise to inexpensively change only a few trays, and once back in operation, gamma scan the tower to evaluate. A team led by the author found this approach invaluable when troubleshooting a 300-tray tower that did not work too well. Initially, only 10 trays were replaced. After gamma scans demonstrated much better performance for these 10, the rest were confidently changed. A similar approach was applied by Harrison (160) and Fulham and Hulbert (114). In this section, we present several case studies that address some frequently asked questions, and illustrate some key considerations when interpreting qualitative gamma scans. The gamma scan report contains both facts and interpretations, and often the two are not clearly distinguished. Failure to distinguish fact from interpretation has been the cause of many incorrect diagnoses and failed fixes. Any theory developed to diagnose column problems must be consistent with the facts. If a theory is inconsistent with the facts, it should be discarded. Measurements reported by the gamma scans are facts, within the accuracy limits of the measuring device. They are not any different than a temperature, pressure, or flow measurements and should be treated the same way. Below are listed measurements usually supplied by the gamma scans For instance, refer to Figure 5.3. For these peaks, the froth heights are reported as 9″. Measurement of the froth height is not highly accurate, typically varying by plus or minus 20–30%. So, if 9 in. are measured, it could be as high as 12″ or as low as 7″, but it is highly unlikely to be 20″. That is a fact. Again, refer to Figure 5.3. In the vapor spaces, the peaks between the trays reached the clear vapor line. This means there is no liquid there. A gamma ray was shot and reached the detector at full strength, signifying it traveled through vapor only. Had there been liquid in the path, it would not have reached clear vapor. A large absorption of gamma rays means dense material. This can be liquid or solid. Distinguishing solids from liquids will be an interpretation, not a fact. All that the scans can factually determine is the presence of something dense in the path. Vapor spaces consistently filled with dense material indicates liquid accumulation, i.e., flooding. Typical accuracy is plus or minus 10%. So the dP may not have risen yet, but the scans can already detect the initiation of the liquid accumulation. In Bed 2 in Figure 5.7, one chord clearly and consistently shows higher transmission than the others. This means it is seeing less liquid. In Bed 1, all the chords fall together, which means good distribution. While maldistribution is a fact, before concluding that distribution is good, one needs to consider the possibility that the liquid rate is too low to give a good indication of maldistribution, as discussed by the quotes from Vidrine and Hewitt (493) in Section 5.2.3. One also needs to consider that the scans in Figure 5.6 are unlikely to show a condition in which there is more or less liquid pouring into the column center zone. Gamma scans were shot through a packed bed and should see metal. If they reach the detector at full or almost full strength (like Bed 3 in Figure 5.2b), it indicates that the packings are not there. Gamma scans were shot through trays should see liquid sitting on the trays. If they reach the detector at full or almost full strength, the trays do not hold liquid. This means that the trays are either not there, or they are damaged, or they are dry (due to too little liquid flow or too low vapor flow). The scans cannot distinguish between these issues, all they can tell is that the trays are not holding liquid for some reason. Interpretations Everything else is an interpretation. Interpretations range all the way from the very conclusive interpretation, nearly a fact, to the very inconclusive interpretation bordering on fantasies. The challenge for process and operation engineers is to evaluate how conclusive each interpretation is. Plugging, missing trays, foaming, call of jet versus downcomer flooding, are examples of interpretation. In the forthcoming examples, we will carefully distinguish the facts from the interpretations and evaluate the conclusiveness of the interpretations. Following a major retrofit, one column (483) experienced poor separation, a higher than normal pressure drop, and liquid carryover at the design rates. Theories included poor design or damage during recommissioning. Two gamma scans were conducted. Figure 5.11 (483) shows the top seven trays. The green dashed scan was at design rates, the blue heavy scan at rates slightly reduced to the point of getting the column out of trouble. The heavy scan shows all trays holding liquid, with froth heights about 8–10 in. and clear vapor spaces above (all peaks reaching clear vapor). The dashed scan showed little difference from the heavy scan on trays 5–7. From tray 4 up, it showed considerably taller froths, growing progressively taller from tray 4 to tray 1. There was no clear vapor above the top four trays, with progressively more liquid in the vapor spaces as one ascends from tray 4 to tray 1. The appearance on trays 2 and 3 will often be called “flood” by the scanners. The flood criterion varies with the scanners but is always based on the froth heights and the liquid content in the vapor spaces. Flood is the accumulation of liquid, and this happens in the vapor spaces and is the reason for the high liquid content of the vapor spaces above trays 1–4 in the dashed scan. So this scan sees flooding in the top 3–4 trays. Everything up to this point has been facts. The reply to the question of jet flood or another type comes from a very conclusive interpretation. In Section 2.2, jet flood was defined as follows: “As the vapor velocity is increased, froth or spray height on trays rises. When the froth or spray approaches the tray above, some of the froth or spray is aspirated into the tray above as entrainment. Upon further increase in vapor velocity, massive entrainment of the froth or spray begins, causing liquid to accumulate on the tray above and flood it.” The unflooded scan (heavy curve) was shot just below the flood point, i.e., when the flood was approaching. The froth heights in this scan were 8–10 in., well below the tray spacing of 30 in. (the tray spacing can be inferred from the scan as the distance between successive trays), and the vapor spaces were clear, without any signs of liquid aspiration into the tray above. Therefore, it can be concluded with confidence that the trays were nowhere near jet flood, and the flood was caused by another mechanism. The scan findings denied the theories of poor design and damage. The investigation looked elsewhere and found that the flood was caused by an improperly installed orifice plate in the reflux line, causing the meter to grossly understate the reflux rate. As a result, the plant ran the tower with too much reflux, which caused a downcomer or a reflux entry point flood. Adjusting the reflux established good operation and circumvented the need for a shutdown. Kister, H. Z., and C. Winfield, Ref. 227. Reprinted Courtesy of Chemical Engineering Progress (CEP). Copyright © American Institute of Chemical Engineers (AIChE) A large stabilizer equipped with 4-pass valve trays was operating right at its maximum throughput limit and bottlenecked the capacity of an entire gas plant (227). Any increase in rates would generate flooding in the bottom section of the stabilizer, as was seen by instability and high pressure drop. With a turnaround approaching, it was desired to debottleneck the stabilizer to raise the capacity of the plant by 25%. The economics were such that any modifications external to the tower (e.g., adding a preheater) were out of the question. Downtime was at a premium, so the revamp was a one-shot deal: a failure would mean five years or more at the failed conditions, with a huge economic penalty. Figure 5.11 An active area gamma scan, illustrating normal operation in the unflooded scan (blue, heavy) and flooding near the top of the tower (green, dashed). (From Tracerco, “Process Diagnostics – TRU-SCAN® Case Studies,” 2010. Available from Tracerco, Pasadena, Texas. Reproduced Courtesy of Tracerco.) Table 5.1 Hydraulic calculations. There was a debate on the flood mechanism, with some calculation methods suggesting a jet flood, while others suggested a downcomer choke. Correct determination of the limiting flood mechanism was central to achieving an effective debottleneck of the tower. It therefore became necessary to positively identify the flood mechanism. Results of our hydraulic calculation at the rates where flood was observed are shown in Table 5.1. The concept behind Table 5.1 is similar to that of Table 2.1 in Section 2.3. We advocate always performing a hydraulic calculation such as in Table 2.1 or Table 5.1 prior to gamma scans (see Section 5.3, item 1). Table 5.1 shows results from our calculations, which were challenged by other team members. To positively determine the flood mechanism, three scan chords were shot: one through the active areas, another through the center downcomers, and the third through the off-center downcomers. All scans were shot parallel to the downcomer walls, as recommended in item 9 of Section 5.3. Side downcomers were not scanned due to concerns about interference from thick tower walls, as described in Section 5.3, item 10. Each of the downcomer scans was shot twice: a “flooded” scan at the loads where flood was observed to initiate and an “unflooded” scan at loads about 3% below that point, with the tower operating at stable conditions. The active area scan was shot only in an unflooded condition. Figure 5.12 shows an overlay of the unflooded scans of the center downcomers (red scan) and the active areas (blue scan) near the bottom of the tower. The active area froth heights were 10–12″ out of 24″ tray spacing, and the vapor peaks approached the clear vapor line. This means that the active areas were nowhere near jet flood, similar to the heavy blue scan in Figure 5.11. When a tray approaches jet flood, the spray heights get close to the tray spacing, and one cannot see clear vapor. Another interesting observation is that the peaks above the downcomers from trays 2 and 4 are very similar to those above the active areas, which validates the scan quality. The downcomers from trays 2 and 4 were full of froth nearly to the top and were getting close to a limit. This strongly supports a downcomer flood mechanism. Figure 5.13 shows an overlay of the center downcomer scans for the flooded (red scan) and unflooded (blue scan) conditions. There is a clear change from the unflooded to the flooded scan: in the flooded scan, the downcomers from trays 6 and 8 were full of froth and have begun to flood. The downcomers from trays 12, 14, and 16 look normal and were not flooded in either scan. In the flooded scan, the froth in the downcomers from trays 6 and 8 began to back up into the vapor space areas above them, and the peaks above these downcomers no longer approached the clear vapor line. This is all a clear indication of flood initiating in the downcomers and propagating into the active areas. Overall, the gamma scans conclusively showed that the tower was flooded by downcomer flooding in the lower 8 trays. While downcomer scans can distinguish jet flood from downcomer flood, they cannot distinguish downcomer backup from downcomer choke flood. Both these downcomer mechanisms show up as full downcomers. The distinction can be drawn by calculation (Table 5.1), which in the stabilizer case favored downcomer choke. Also, as stated in Section 2.2, downcomer choke is common in high-pressure distillation, such as in a stabilizer. Further, in the absence of fouling and foaming, downcomer backup is uncommon in well-designed trays of 24″ spacing and higher. All these strongly supported downcomer choke. Figure 5.12 Stabilizer unflooded active area scan and center downcomer scan overlay, with the tower operating at stable conditions at rates 3% below flood. (Reprinted Courtesy of Quantum Technical Services, LLC.) Based on this diagnosis, the downcomer top areas were largely increased. To maximize throughput and minimize the loss in the active areas, the downcomers were heavily sloped, with the downcomers’ top areas being three times their bottom areas. The debottleneck solution exceeded expectations, with a capacity gain of 29%. For several years, the gas plant of a fluid catalytic cracker (FCC) unit was bottlenecked at a throughput of 57,000 BPSD by the debutanizer column (238). Raising charge rates or reflux would lead to flooding, accompanied by high pressure drop, instability, and poor separation. With an FCC turnaround coming up, a task force was gathered to diagnose the bottleneck and offer a solution. As in Case 5.5.3, the first step was performing a hydraulic analysis (Table 5.2). The concept behind Table 5.2 is similar to that of Tables 2.1 and 5.1. Table 5.2 shows that the trays operated nowhere near jet flood and that the froth heights in the downcomers were low. There was no history of fouling or foaming in that tower, and the bottleneck was experienced at the same charge rates at any time, confirming unlikely foaming or fouling. The only mechanism nearing a limit was downcomer choke. The downcomer entrance velocity exceeded the good practice guideline (193, 245) of 0.45 ft/s maximum, and one correlation suggested the bottom trays were at flood. As downcomer choke correlations are notoriously unreliable (193, 245), we checked by interpolating measured test data by FRI for a similar system. The interpolation showed that these trays operated at only 72% of downcomer choke. Table 5.2 therefore discounts jet flood and downcomer backup flood, but marks for further study the possibility of downcomer choke flood. If downcomer choke indeed bottlenecked this debutzanizer, the bottleneck would be experienced at the very bottom per Table 5.2. Figure 5.13 Overlay of center downcomer scans under flooded and unflooded conditions. (Reprinted Courtesy of Quantum Technical Services, LLC.) Table 5.2 Hydraulic calculations. There was another theory on the table. Liquid from the bottom tray was collected by a chimney tray collector, from which it flowed to a once-through thermosiphon reboiler. The line to the reboiler was undersized for self-venting flow, so it was theorized that liquid on this chimney tray backed to the top of the chimneys and was then entrained and blown onto the bottom tray by the rising vapor, initiating flooding. The refinery had gamma scans that were shot six years earlier. Gamma scans do not age as long as the process conditions remain identical, which was the case. The six-year old scans (Figure 5.14) were therefore satisfactory for the investigation eliminating the need to rescan. The red heavy scan is the flooded scan, while the blue dashed scan is the unflooded scan. In the bottom section, the flooded scan was shot at vapor and liquid loads 3–5% higher than the unflooded scan. The trays closest to downcomer choke were the bottom trays (Table 5.2), so if the flood was caused by downcomer choke, the flood would initiate at the tower bottom. Likewise, if the flood was due to entrainment from the chimney tray, the flood would initiate at the bottom trays. However, the gamma scans showed no flood on the bottom trays. Furthermore, although the scans showed that the liquid on the chimney tray was at the top or just below the top of the chimneys, they showed no liquid or entrainment in the vapor space above the chimney tray. The scans therefore invalidated both the downcomer choke theory and the chimney tray entrainment theory. The scan (Figure 5.14) shows flooding in the tower, but this flood initiated near the feed, where it was not anticipated by either theory. It therefore steered the diagnosis away from downcomer choke and chimney tray entrainment to focus on the feed entry. A calculation showed that the flashing feed came out of the feed pipe slots at a huge downward velocity of 33 ft/s (or rho vee squared of 6000 lb/ft s2) pointing straight at the valve tray floor. This entry arrangement (Figure 5.15a) is likely to have caused excessive turbulence on the tray, re-entrainment of the feed, and penetration of the flashing mixture through the valves on the tray floor into the downcomer below, as depicted in Figure 5.15b. These actions are likely to produce a premature flood on the trays below the feed, and this flood would propagate up the tower like the scans show. Based on this analysis, the feed arrangement was modified. Although the other bottlenecks (downcomer choke in the bottom and entrainment from the chimney tray) have not yet been reached, they appeared to be approached, so a good debottleneck needed to cater for them as well. The hardware changes are described elsewhere (238). The end result was the elimination of the flood and an increase in the charge rate from 57,000 BPSD to 72,000 BPSD with no limit in the debutanizer even at 72,000 BPSD. The active area scan in Figure 5.16 (485) shows a foam-flooded amine absorber. What gives away foaming is the uniformity of the dispersion. For all trays in Figure 5.16, there are very small differences between the transmission reading near the tray floor and the transmission reading further up in the vapor space, all the way to the tray above. This means a very uniform froth density on the tray. Foams are uniform, like shooting scans through a bubble bath or through the head on a glass of beer (these are foamy dispersions). Contrast this appearance with a non-foaming flood, such as the flood on trays 2 and 3 in Figure 5.11. In the flooded scan in Figure 5.11, the transmission at the tray floor is much lower than further up in the vapor space, indicating a density gradient, with dense froth at the tray floor and much less dense froth further up. This is typical of non-foaming floods. Figure 5.14 Debutanizer tray active area gamma scans. The blue (dashed) scan is at unflooded conditions, while the red (heavy) scan shows flooding initiating near the feed. (From Kister, H. Z., D. E. Grich, and R. Yeley, PTQ Revamps and Operation, 2003. Reprinted Courtesy of PTQ.) Figure 5.15 Debutanizer feed entry arrangement that caused tower and gas plant bottleneck. (a) Geometrical arrangement; (b) flashing feed issuing downwards at the very high velocity of 33 ft/s onto the tray floor, causing entrainment and downcomer choke at the feed point that led to a premature flood. (Part (a): From Kister, H. Z., D. E. Grich, and R. Yeley, PTQ Revamps and Operation, 2003. Reprinted Courtesy of PTQ. Part (b): From Kister, H. Z., “Practical Distillation Technology,” Course Manual. Copyright © 2013. Reprinted with permission.) Another thing that supports foaming in this case is the service. Foaming is a service-specific phenomenon (198, 201). Some services have high foaming tendencies, others do not. As has been pointed out (Section 2.10), acid gas absorbers and regenerators are foaming systems. On the other hand, debutanizers do not foam (unless some foam-generating impurity like caustic gets in, an infrequent occurrence). So an appearance like Figure 5.16 in an amine absorber is a very conclusive foam diagnostic. On the other hand, if there are three trays in a debutanizer with a uniform froth appearance, it will be a very inconclusive foaming diagnostic. The author was involved in three troubleshooting investigations in which gamma scanners interpreted debutanizer scans to indicate foam. Three times they were wrong. In all three, there was a uniform dispersion for 2–4 trays, which misled the interpretation. Figure 5.16 An active area gamma scan illustrating foaming in an amine contactor. The red (heavy) line shows the trays foam-flooded. The blue (dashed) line is an unflooded scan of the same active area, showing that the active areas are not heavily loaded. (From Tru-Tec Division, “Sample Scan Brochure,” 1998. Available from Tracerco, Pasadena, Texas. Reproduced Courtesy of Tracerco.) In Figure 5.16, note the unflooded scan (blue, dashed). Froth heights are very low, suggesting the trays are nowhere near jet flood. In fact, the flat peaks showing liquid in the vapor spaces not far from the clear vapor line suggest weeping (see Figure 5.4b). Foams generally do not bottleneck trays. They usually bottleneck downcomers, as described in Section 2.10. Just before the flood, the active area looks clear. A scan through the downcomers just below the flood point would have shown the downcomers close to full. Combining downcomer scans with active area scans is a powerful method to evaluate foaming as well as the effectiveness of antifoam addition. As foams usually bottleneck downcomers rather than trays, it is of utmost importance to scan downcomers when troubleshooting for foam or evaluating the effectiveness of antifoam addition. This is shown in the next case study (227). There are other experiences reported (1, 469) of foaming towers in which active area scans below the flood did not show foaming signs. A chemical tower was experiencing reduced throughput with very poor separation. Gamma scans of the trays active areas and even numbered downcomers revealed that foam was present throughout the height of the column. The foam was recognized by the uniform dispersion on the flooded trays as seen in Figure 5.17a (red); this scan is very similar to Figure 5.16, with absorption of gamma radiation near the tray floors much the same as near the top of the vapor spaces. The scan of the even-numbered downcomers in Figure 5.17a (blue) shows much the same, with uniform dispersion through the scanned downcomers. The foamy uniform dispersion in each downcomer extended all the way to the tray above. Both the active area and downcomer scans provided conclusive evidence for foaming. Figure 5.17 (a) Gamma scans show foaming on active areas and in downcomers. (b) Gamma scans show effectiveness of antifoam on active areas and in downcomers. (From Kister, H. Z., and C. Winfield, Chemical Engineering Progress, p. 28, January 2017. Reprinted Courtesy of Chemical Engineering Progress (CEP). Copyright © American Institute of Chemical Engineers (AIChE).) An antifoam injection was initiated. The success of antifoam treatment depends on the agent used and its concentration. Antifoams are surface-active agents, and too much antifoam can be worse than too little (Section 2.10). Several trials with different agents and concentrations are sometimes required. Gamma scans through the active areas and downcomers are powerful for evaluating the effectiveness of an antifoam injection. Figure 5.17b shows the active areas (red) and downcomers (blue) gamma scans used to evaluate the effectiveness of an antifoam injection into the tower. The scans no longer showed foam on the trays. Once the foam was eliminated, the active areas of the trays were not highly loaded, with froth heights well below half the tray spacing and clear vapor spaces above (similar to the dashed scan in Figure 5.16). The downcomer scans still show some foam in the downcomers, but the foam heights had subsided and there was good clearing near the very top of the downcomers. Although the foam was gone from the trays and no longer bottlenecked the tower, there was still a good height of foam in the downcomers that could build up to the tray during changes or upsets. So the antifoam effectively alleviated the foam in the downcomers, and removed the foam from the active areas. Kister, H. Z., and C. Winfield, Ref. 227. Reprinted Courtesy of Chemical Engineering Progress (CEP). Copyright © American Institute of Chemical Engineers (AIChE) Downcomer gamma scans can reveal what calculations would not, but only if performed and interpreted correctly, as illustrated in the following case (227). A petrochemical tower in a fouling service, equipped with 2-pass valve trays at 36″ spacing, experienced flooding mid-way through the run. The flooding showed up as high pressure drop and loss of separation. To plan modifications for the next turnaround and to devise an operation strategy for the rest of the run, it was necessary to understand the nature and location of the flood. Both active area and downcomer scans were shot. The flooded active area scans showed large froth accumulation on the top tray. On the lower trays, froth heights were low, and clear vapor was reached less than 12″ above the trays. Since the flooding occurred on the top tray, it was essential to scan the downcomers from that tray. The challenge was that these were side-downcomers, and practical difficulties precluded scanning them parallel to the weir. Fortunately, this was one of the few cases in which one could get away with a chord that intersects the downcomer wall at a small angle (about 30°). Usually, when a chord crosses the downcomer wall into the active area, it is impossible to decouple the downcomer dispersion from the tray dispersion (Section 5.3, item 9). But here the tray dispersion terminated well below the tray above, so from 12 in. above the tray and up to the next tray there were 24 in. in which the scan saw only the downcomer dispersion. Figure 5.18 shows the scans for the two side downcomers. The two downcomers from tray 1 showed widely different dispersions. The blue curve shows a dense dispersion on the top half, with a gradually decreasing froth density as one descends the downcomer. At the downcomer bottom, the froth density was about the same as the tray froth density above tray 3. The red curve showed a low-density dispersion throughout the downcomer, very similar to the tray froth above tray 3 below. This suggests that this downcomer passed vapor, just like a tray does. Returning to the blue chord, the initial interpretation of the density gradient was of a seal loss in this downcomer impeding the descent of liquid from the tray above. A close check of the scan chord against the drawing revealed that this was a misinterpretation. The side downcomers were sloped (Figure 5.19), and below the top 18 in., the scan chords passed through progressively shorter lengths of downcomer as one descended. Near the bottom of the downcomers, the chords missed the downcomers altogether, catching only the tray dispersion (Figure 5.19). The switch from dense to highly aerated dispersion did not indicate loss of seal; rather, it indicated the downcomer chord becoming progressively shorter due to the slope. It is therefore likely that the downcomer through which the blue chord passed was all full with the dense liquid seen in its upper part. Putting the information together, tray 1 appeared to be plugged, incurring a very high pressure drop that in turn led to a downcomer backup flood. The plugging was nonuniform, with most of the liquid descending via the side downcomer that showed high dispersion density (blue scan). Due to the high pressure drop across the top tray and the liquid maldistribution, it appears that the vapor managed to break the seal of the opposite downcomer, causing its dispersion to appear like part of the active area (red chord). This vapor breakthrough would channel more liquid to the downcomer that had the high dispersion density. Figure 5.18 Scans of two side downcomers reveal very different behavior for the side downcomers from tray 1. (From Kister, H. Z., and C. Winfield, Chemical Engineering Progress, p. 28, January 2017. Reprinted Courtesy of Chemical Engineering Progress (CEP). Copyright © American Institute of Chemical Engineers (AIChE).) Figure 5.19 Scan chords passing through progressively shorter lengths while descending sloped side downcomers. (From Kister, H. Z., and C. Winfield, Chemical Engineering Progress, p. 28, January 2017. Reprinted Courtesy of Chemical Engineering Progress (CEP). Copyright © American Institute of Chemical Engineers (AIChE).) This interpretation supported the theory that reflux maldistribution in the tower contributed to the plugging problem. A turnaround inspection later confirmed the nonuniform nature of the plugging, and there were additional water marks pointing to the maldistribution. An existing tower experienced a premature flood near the bottom (241). The tower bottom section contained 4-pass fixed valve trays, in an equal bubbling area arrangement. The trays had split downcomers, with a gap for supporting I-beams between, which also provided full vapor equalization and partial liquid equalization. To balance the liquid flow to the passes, the side weirs were swept back, and the side outlet weirs were shorter (1.5″) than the center weirs (3″). Maldistribution between the passes was one of the theories to be tested. Chords were shot through the outer (red) and inner (blue) active areas (Figure 5.20a) at steady, unflooded operation. The scans (Figure 5.20b) show denser froth on the outer (side) panels than on the inside (center) panels. At face value, the difference between the peaks looks rather small on Figure 5.20b, but one must keep in mind that the chord through the inside panels was 30% longer than the chord through the outside panels, so it sees 30% more material. Using the same calibration, the inside chord should have produced a lot more absorption, not less. A subsequent analysis by the scanners, which compared tray froth densities on the inner scan paths and the outer scan paths taking into account the respective scan path distances, determined that the outer panel froth was 22% denser. This gamma scan provides conclusive evidence that the L/V ratio on the outside panels was considerably higher than that on the inside panels. In another tower containing 4-pass trays (327), nine scan lines were shot, giving full mapping of all active areas and downcomers. This ideal mapping pattern showed uneven loadings of active areas, and high and uneven loadings of downcomers. There were even large differences between the scans of the two opposite side panels in one section of the tower. These scans identified maldistribution between passes and obstruction of the downcomer entrance area by sumps and I-beams (see Section 8.5) as the major factors leading to premature flooding and poor separation in the tower. Fouling that preferentially plugs one panel more than other panels can produce maldistribution between the panels in 2-pass trays. Such maldistribution is not always addressed in scan reports, but it can be visible in the scans. When observed, it provides a valuable diagnostic. Figure 5.21 illustrates this appearance. In a refinery atmospheric crude tower, trays 10–13 were a heavily liquid-loaded pumparound section. The pumparound liquid was drawn from a sump located beneath the downcomer from tray 10. Some of this liquid was drawn as the diesel product; the rest was cooled externally and returned to tray 13. Trays 6–9 were a lightly loaded fractionation (wash) section. In the normal (“unflooded”) scan, the only flooded tray was tray 10. Both the trays above and below were not heavily loaded. The flooded scan shows the propagation of the flood up the tower. Both scans conclusively verify flood initiation on tray 10. The taller and denser froths observed on the southwest (SW) side of trays 6–9 in the flooded scan persisted on tray 9 in the “normal operation” scan. They became much less pronounced on trays 6–8. In the flooded scan, the northeast (NE) side of trays 6 and 7 approached drying. This maldistribution observation tied in with the temperature indicator on the NE reading 15°F hotter than the temperature indicator on the SW, both under “normal” and “flooded” conditions. In previous runs, when tray 10 was not fouled, the two temperature indicators read the same. Together, the scans and temperature difference verified maldistribution between the SW and NE panels, with more liquid descending on the SW. Downcomer scans (180) established flood initiation in the center downcomer from tray 10. Vapor/liquid sensitivity tests (Section 2.7.1) determined the flood to be sensitive to both vapor and liquid, leading to the conclusion that the flood was a downcomer backup flood. Putting the pieces together established the plugging of tray 10 as the root cause of the downcomer backup flood, with the plugging occurring unevenly on the SW and NE panels. This finding denied alternative theories and guided the troubleshooting team to the best path forward. Figure 5.20 Gamma scans exploring multipass maldistribution. (a) Scan chords. Note that the inside chord (blue) is longer than the outside chord (red). (b) Gamma scans comparing the inside and outside chords. (From Kister, H. Z., R. Dionne, W. J. Stupin, and M. R. Olsson, Chemical Engineering Progress, April 2010. Reprinted Courtesy of Chemical Engineering Progress (CEP). Copyright © American Institute of Chemical Engineers (AIChE).) Figure 5.21 Active area gamma scans under “flooded” (dashed scans) and “normal” (continuous scans) operation showing fouling-induced maldistribution in 2-pass trays (SW = Southwest, NE = Northeast). A depropanizer in a refinery alkylation unit experienced flooding and poor operation mid-way through the run. The gamma scan at normal operating conditions is the heavy scan on Figure 5.22 (483). For trays 1–8, the scan shows liquid in the vapor spaces (fact). The liquid in the vapor spaces of trays 1–8 is weeping (conclusive interpretation). The following three pieces of evidence put together make the weeping diagnosis conclusive: The scan shows dense liquid between trays 11 and 29. This is not an ordinary flood; an ordinary flood is the flood shown in Figure 5.11. This is a column of very dense liquid, or as one of my class participants put it, a “solid liquid.” Figure 5.22 An active area gamma scan, illustrating missing trays, weeping and dense liquid accumulation. The heavy curve is “normal operation” scan, with dense liquid accumulation. The dashed curve is the unflooded scan showing missing trays. Both scans show weeping in the upper trays. (From Tracerco, “Process Diagnostics – TRU-SCAN® Case Studies,” 2010. Available from Tracerco, Pasadena, Texas. Reproduced Courtesy of Tracerco.) As stated earlier, the flooded scan shows what is happening. The unflooded scan shows why. To gain better understanding, the rates were reduced and the unflooded scan (dashed curve in Figure 5.22) was shot. In this scan, trays 1–8 did not change much. The liquid column receded to trays 28–29, exposing trays 9–27. Trays 9–18 looked much the same as 1–8. Trays 19–25 were missing. It appeared that debris from the missing trays collected on tray 29, blocking the liquid descent and causing the dense liquid to pile up. When the tower was opened, trays 1–18 were found to have suffered severe corrosion damage, which accounted for the weeping. Trays 19–28 were blown out and were found on top of tray 29, blocking liquid passage and causing the dense liquid column to build up. Diagnosing missing trays is not always straight forward. One refinery crude atmospheric tower was experiencing poor removal of diesel (valuable product) from the bottom residue. A gamma scan (209) concluded that the stripping trays were missing. Tray dislodging is a common experience in this service. The appearance was much the same as that of trays 19–25 in Figure 5.22. Based on this, the refiner shut down the crude unit and opened the tower, just to find all the trays there in good condition with no signs of damage, corrosion, or fouling. A postmortem showed that the stripping steam rates (and therefore the vapor loads) in the stripping section of this tower were low. The C-factor calculated from the tower simulation for the active area (Eq. (2.1)) was 0.03 ft/s, compared to a typical flood C-factor in this application of around 0.4 ft/s (Rule 1, Section 2.16), so the trays operated at about 7–8% of flood. At this low C-factor, trays do not hold much liquid (unless specially designed to do so, which they were not). The scans were shot every 2 in.; the trays’ thickness was 0.075 in., so it was easy for the scans to miss the trays altogether. On gamma scans, dry or empty trays can look the same as missing trays. This hydraulic calculation should have been performed before the scan, not after it (Section 5.3, item 1). Had the low vapor load been appreciated prior to the scan, it would have been easy to triple the steam rate for a second test. In this second test, the C-factor would have been 0.09 ft/s, about 20% of flood, and the gamma scans would have easily seen froth on the trays. An expensive and unnecessary shutdown would have been circumvented. In other experiences (one described in Section 5.5.20), a scan concluded there was tray damage. Before shutting down for repair, the author was requested to review the scanners’ conclusions. Rough hydraulic estimates based on plant meters showed very low liquid rates through these trays, again raising the question of whether the trays were just dry or damaged. Here, the test was to double the liquid rate and rescan. The rescan was similar to the original scan, confirming damage rather than just drying out. A refiner experienced a high pressure drop and an off-spec gasoil side product in their atmospheric crude tower. Gasoil is the first side draw above the tower feed. Between the draw and the feed point, a bed of structured packings (the “wash bed”) used a small reflux (“wash”) stream to remove heavies from the vapor. Economics favor running this reflux at the minimum that will keep the gasoil on-spec. Any excess reflux ends up in the far less valuable tower bottom (“atmospheric resid”) product with a severe economic penalty. A grid scan (Figure 5.23a) showed a large buildup of dense material throughout the bed. The dense material rose past the 150 mm vapor space between the distributor and the bed. The distributor (located right above the bed) was full of massive, dense liquid, probably entrained from the bed. This indicated severe flooding in the bed. The very high density can only be explained by severe plugging. The wash bed was plugged solid. All these are facts based on the scan data, not on any interpretation. Figure 5.23 Gamma scans of atmospheric tower wash bed. (a) Plugged and severely flooded after years in service; (b) following a chemical wash, attempting to clear the fouling. (Reproduced Courtesy of Tracerco.) In an attempt to circumvent a total shutdown, the refiner temporarily interrupted the feed and performed a chemical wash on the bed. Figure 5.23b shows a scan of the bed following the wash. There was a major improvement in the upper part of the bed. There was little improvement in the bottom part of the bed. It appears that there was residual fouling in the bottom part of the bed that the chemical wash was unable to remove. This part remained plugged and flooded. Note the difference between the chords in the upper parts of the bed. It appears (interpretation) that the chemical wash was more effective along some chords than along others. The tower was shut down shortly after. The packing near the bottom of the bed was heavily fouled, and to remove some of the bed, the packing needed to be literally torn apart. Packings at the top of the bed (inspected a short time after the chemical wash) were fairly clean. The bed was replaced with in-kind. Anticipating fouling, a monitoring program by performing grid scans about once per year was started. Figure 5.24a shows the grid scan immediately after the tower returned to service following the packing replacement (year 2009). There is no sign of fouling. The liquid distribution looks excellent. Figure 5.24b shows yearly shots of one chord of the grid scans over the next five years, taken at comparable hydraulic loads. Per good practice, all four chords of the grid scan were shot each time. Figure 5.24b shows gradual buildup of fouling material at the bottom of the bed over time. The dark blue curve on the right is the same as the blue curve in Figure 5.24a and shows the scan immediately after returning to service. The red curve shows that as little as a year later fouling started at the bottom 200 mm of the bed, but the rest of the bed remained unaffected. A year later (2011, green), the fouling at the bottom expanded. In the 2011 scan, a higher absorption can be seen throughout the bed. The fouling at the bottom of the bed, and the absorption of radiation in the upper part of the bed, intensified over the next three years. In these three years, there appears to be flooding in the bottom 200–400 mm of packing. Figure 5.24 Gamma scans of the atmospheric tower wash bed in Figure 5.23 over the next five-year run. (a) Shortly after returning to service following bed replacement; (b) yearly shot of one chord of the grid scan over the next five years; (c) comparison of the full grid in January 2014 (before replacement) and in July 2014 (after replacement with similar packing). (Reproduced Courtesy of Tracerco.) The higher radiation absorptions in the upper part of the bed merit discussion (all interpretation, but quite conclusive). One possibility is fouling in the upper part as well. A counter-argument is that this absorption is uniform with bed height, while fouling is likely to be more intense near the bottom, which would have produced a density gradient, not a uniform profile with height. A stronger argument is based on Figure 5.23b. Following the chemical wash, in which some of the fouling matter was removed, the south and east chords showed considerable radiation absorptions in the upper part of the bed, which were quite uniform with height (especially the south chord), similar to those in Figure 5.24b. When the tower was opened, the packings in the upper part of the bed were fairly clean; nothing that can explain the observed high absorptions there. Historically, the fouling was always observed in the bottom of the packings. The possibility of higher liquid loads in the bed can also be discounted, as the reflux rates used in the wash bed were very low and could not account for the absorptions in the upper part of the bed, nor for the south curve in Figure 5.23b. This leaves one conceivable mechanism: flooding due to plugging in the bottom of the bed generated large liquid entrainment, which propagated throughout the bed and eventually descended. As the flooding at the bottom gets worse, so does the entrainment, liquid recycle in the bed, and the liquid retention in the upper part of the bed. In Figure 5.23b, following the chemical wash, the liquid entrainment/recycling channeled preferentially along the south and east chords. Figure 5.24c compares the grid scans before and after bed replacement with a similar packing in 2014. It shows that before bed replacement there was liquid accumulated above the bed and backing up into the distributor in the south and north chord (black and green curves). The monitoring was valuable for the refiner for providing a better understanding of the mechanisms involved and for planning the next turnaround. A chemical column containing structured packings experienced fluctuating pressure drops and off-spec overhead product. Figure 5.25 shows a scan of this column. The lower bed shows good liquid distribution and normal operation. The upper bed shows high density and flooding. The absorptions are irregular. The dashed black chord shows much higher density than the others. The dotted purple chord returns to normal bed density at an elevation of about 43 ft. There are irregularities among the chords at elevations of 42–44 ft. All observations so far are facts. The irregular density profile, with some chords showing more radiation absorption than others, suggests plugging rather than regular flooding (inconclusive interpretation). The fact that the flooding begins at the bottom of the upper bed and tends to clear, at least to some degree, near its top suggests that the plugging begins and is most severe at the bottom of the bed (conclusive interpretation). Upon entering the tower, the plant found a layer of polymerized material had formed on the support plate of the upper bed. This polymerized material was responsible for the flooding. The plugging backed up several feet of liquid in the upper bed, giving the observed absorptions. Another case (480) Grid packing in a plugging chemical service was replaced by an alternative grid packing in an endeavor to increase run length, but with the new grid the run was drastically shorter. Comparing gamma scans showed that with the old grid solids filled the bed from top to bottom before there was an operational issue. With the new grid, the solids accumulation point shifted deeper in the bed, with the upper sections of the bed not plugged. Upon inspection, it was noticed that large chunks of solids had come off the packing and were clogging the flow channels, leading to a premature flood. Figure 5.26a is a scan of a tower immediately after returning to full-rate operation following a turnaround where the packings were replaced with in-kind. At this time, it was meeting all expectations on product specifications, capacity, and pressure drop. An unusual feature is a density gradient through the bed. The density gradient may indicate higher liquid loads or compression of the packings as one descends the bed. The bottom of the bed appears closer to flood than the upper portions. Figure 5.25 Plugging-induced flooding at the top packed bed of a chemical tower. (From Tru-Tec Division, “Sample Scan Brochure,” 1998. Available from Tracerco, Pasadena, Texas. Reproduced Courtesy of Tracerco.) Figure 5.26b is a scan shot just prior to the turnaround, when the tower was experiencing problems. The density gradient intensified. The bottom of the bed was flooded. Liquid maldistribution is apparent in the flooded bottom region, probably connected with the flood. From 9 ft elevation down to the bottom of the bed, the density of the bed was higher than at equivalent elevations in Figure 5.26a. The packed height was about 2 ft shorter than it should have been, indicating (conclusive interpretation) crushed or damaged packings in the bottom of the bed as the cause of flooding. Figure 5.26 Flood due to crushed random packing. (a) Shortly after returning to service following packing replacement with in-kind; (b) just before the turnaround showing flooding at the bottom due to crushed or damaged packings. (From Xu, S. X., and L. Pless, Chemical Engineering, p. 60, June 2002. Reprinted Courtesy of Chemical Engineering.) A 2 ft diameter hydrogen fluoride stripper was experiencing poor separation. Due to the small diameter, a + scan (Figure 5.6c, Section 5.2.3) was performed (Figure 5.27). In the top two beds, the uniform density profiles and the two chords traveling together indicate that these beds were operating normally with good liquid distribution. The low-density readings in the upper 8.5 ft of the bottom bed, where radiation transmission reached the clear vapor line, indicates that the packings were not there. At the bottom of the bottom bed, there was a small region of high density, indicating flooding or dense material. These are all facts. When the column was opened, a piece of the support grating was found bent and holding a pocket of packings in place. A lot of the packings in the bottom bed migrated out through the damaged support. Figure 5.27 Gamma scans indicate the top and middle beds appeared to be in place but the bottom bed was missing approximately 8.5 ft of packings. (Reproduced Courtesy of Tracerco.) During startup, a high liquid level was observed in the bottom of a refinery vacuum tower. Once operation was stabilized, the tower experienced problems meeting the color and metal specs on the lowest side product, the heavy vacuum gasoil (HVGO). To achieve a product of acceptable specs, the unit was forced to reduce the HVGO yield, losing considerable HVGO to the far less valuable bottom residue product. The tower is shown in Figure 7.2. Figure 5.28a shows a scan of the “slop wax” (or “wash”) packed bed, located between the tower feed and the HVGO side draw. This bed uses a very small liquid reflux to remove heavy color bodies and heavy and entrained metallic compounds from the HVGO side product. The bed contained grid packing at the bottom, with structured packings mounted above them. Throughout the bed, the east chord (black curve) shows high density. The south chord (red curve) shows clear vapor at the top two feet of bed, suggesting some packings are missing. On the north chord (blue curve), and to a lesser extent on the east chord, there appear to be some dense absorptions above the bed. As the distributor was a spray distributor and the liquid rate was quite low, these unequal heights at the top of the bed could not be explained by liquid maldistribution. They most likely suggest packing displacement. The chimney tray under the wash bed (the “slop wax” chimney tray) appears lightly loaded and operating dry (compare to the HVGO chimney tray in the next paragraph). The absorptions are probably due to the chimney metal. This tray is usually designed for dry operation, as any liquid sitting on the tray at high tower temperatures is likely to turn into coke. The level indicator on this tray showed dry operation. So the light density for this tray in the scan should not be interpreted as damage. As with normal trays (Section 5.5.9), it is difficult to distinguish a dry tray from a damaged tray. Above the wash bed there was an HVGO chimney tray, which collected the liquid from the HVGO bed above. Some of this liquid became the HVGO product, some was refluxed to the slop wax bed below, and the rest was cooled externally and sprayed at the top of the HVGO bed above (Figure 7.2) to condense the HVGO by direct contact heat transfer. Figure 5.28b shows the HVGO chimney tray in place and holding liquid. Figure 5.28b shows displaced packings in the HVGO bed. On the north (blue curve), the top two feet of the bed show clear vapor. On the west (green curve), there is a shorter distance of clear vapor. On the east (black curve), there is about 1 ft of packing displaced above the bed. When the tower was opened, packings were found displaced both in the wash and HVGO bed, as shown by the scans. This is the same chemical vacuum tower discussed in Section 2.9.1. The bottom section of the tower had two beds containing high-efficiency structured packings, with a vapor side draw between them. The tower was operated at about 60% of flood and experienced a high heavy impurity in the side product. In a test, the reboiler duty and reflux rates were raised to the anticipated flood point to explore for possible hydraulic issues or fouling. The pressure drop versus C-factor curve (Figure 2.24a) showed no point of inflection, which is often used to identify flood, even when the expected flood point C-factor (Eq. 2.1) of 0.37 ft/s at the bottom of the bottom bed was exceeded. Raising vapor and liquid loads reduced the temperature spreads in the bottom bed (Figure 2.24b), as often experienced with wire mesh packings, like the packings in this bed (193). At a C-factor of about 0.36 ft/s, the middle temperature of the bottom bed abruptly shot up, becoming the same as the bottom temperature, indicating loss of separation between the two points. The packing efficiency sharply dropped, which indicated flooding. The unsolved mystery was why the flood was not accompanied by a rise in pressure drop. The gamma scans explained this behavior. Figure 5.28 Packing displacement in refinery vacuum tower. (a) Wash bed. (b) HVGO bed. (From Duarte Pinto, R., M. Perez, and H. Z. Kister, Hydrocarbon Processing, April 2003. Reprinted Courtesy of Hydrocarbon Processing.) Figure 5.29 Gamma scans of vacuum tower. (a) C-factor of 0.3 ft/s, good distribution in bottom bed. (b) C-factor of 0.36 ft/s, showing liquid accumulation and maldistribution in the bottom 2 ft of the bottom bed. (From Kister, H. Z., R. Rhoad, and K. A. Hoyt, Chemical Engineering Progress, September 1996. Reprinted Courtesy of Chemical Engineering Progress (CEP). Copyright © American Institute of Chemical Engineers (AIChE).) Figure 5.29a and b shows the gamma scans at C-factors of 0.30 and 0.36 ft/s, respectively. Both scans show good liquid distribution in the bottom bed down to the bottom 2 ft. In the 0.30 ft/s C-factor scan, the good liquid distribution persisted all the way to the packing support. However, in the 0.36 ft/s scan, maldistribution appears to have set in the bottom 2 ft or so of bed, with liquid accumulating along two of the four chords. This accumulation is a symptom of flooding. Figure 5.29b suggests that the liquid accumulation generated channeling; the liquid accumulated only along two chords. Presumably, the vapor kept rising freely through the regions in which the liquid did not accumulate. This means that the vapor did not need to penetrate through a static head of liquid, which explains why no steep rise in pressure drop was apparent even though the packing flooded (well-supported interpretation). A 9 ft diameter stripping tower in a synthesis gas plant contained two random packed beds with three trays above. The tower has a history of fouling, with several episodes detailed with gamma scans in Ref. 377. The episode below focuses on a scan (Figure 5.30) shot in September 1997 (377), a short time after the tower returned to full-rate operation following a turnaround in which the fouling material was removed. Figure 5.30 Grid scan of stripping tower showing significant liquid maldistribution in both packed beds and that the liquid distributor and redistributor were liquid-full and overflowing. (From Pless, L. and B. Asseln, PTQ, p. 115, Spring 2002. Reprinted Courtesy of PTQ.) Figure 5.30 shows both beds operating with significant liquid maldistribution with the south side in both (red scan) receiving less liquid. The problem appeared to initiate at the top of each bed, suggesting distributor problems. The liquid level in the distributor above the top bed was uneven. The liquid heights of the south (red scan) and west (green scan) chords were 50 and 20 cm, respectively, taller than those on the north (blue scan) and east (black scan). The levels of liquid measured on the south and west were high enough to have the distributors liquid overflowing into the vapor passages. Likewise, the redistributor between the two beds was liquid-full and overflowing. Overflowing liquid is never properly distributed (Section 4.6.1) and would account for the maldistribution in the beds in Figure 5.30. Another observation is that the packed height in the lower bed was about 40 cm below the bed limiter. The top of the packing of the upper bed was not even, varying from 75 cm to 1 m below the upper bed limiter. The lower bed heights could be due to either under-filling of the beds or settling of the packings (which is not unusual). There is no indication of crushed packings that would have shown up as a density gradient like it did in Case 5.5.12. Despite the issues reported, the tower operated stably and there was no flooding. An ammonia plant absorber–stripper system experienced excessive slip of carbon dioxide from the top of the absorber. The absorber and stripper were studied using hydraulic calculations, temperature surveys, and gamma scans. One of the major bottlenecks found was the flashing feed distributor that brought the rich solvent to the top of Bed 2 in the stripper. The hydraulic calculations showed that the random packings near the top of Bed 2 should have been operating at 88% of flood. The temperature survey showed severe maldistribution throughout Bed 2. Figure 5.31 is the 2-chord gamma scan for Bed 2. It was intended to perform a full grid scan, but strong winds and issues with scaffolding prevented shooting two of the chords. The x-axis is expressed in relative density units, with the clear vapor line taken as zero density. The density for other locations can be inferred from Eq. (5.1) in Section 5.1. Figure 5.31 shows that the density at the top six feet of the bed was 50–100% higher than the density in most of the bed, suggesting flooding. There is a definite maldistribution in the bottom 15 ft of the bed. There is also a high-density region at the bottom three feet of the bed, also suggesting flood. The flooding in the bottom of Bed 2 may be due to compression or some fouling of the packing (the packing type in this tower was prone to either). There is severe overflow and flooding on the top of the distributor, with froth height well above 60 in. A large amount of liquid is present even well above the feed pipe. A close review revealed that the flashing rich solution entry was highly nonstandard. The flashing feed entered the tower via a sparger pipe with downward-pointing holes, exiting the holes with a downward velocity of 10 ft/s. At that velocity, it would have taken half a second to reach the liquid level in the distributor below with substantial impingement. This, in turn would froth up the distributor liquid, similar to Figure 4.8, with froth overflowing over the top of the distributor. Some of the vapor jets would penetrate right through the distributor holes into the top of Bed 2. The recycle vapor would then disengage and turn upward, increasing the vapor load, and would flood the top of the bed. Both the vapor penetration and the distributor frothing would account for the maldistribution. Figure 5.31 Frothing and entrainment from flashing-feed distributor. The main bed, below the distributor, is “Bed 2”. A tower experienced flooding, thought to be due to a tray limitation. Retraying the tower was being considered. Prior to the retray, the tower was gamma scanned. The scan showed flooding (Figure 5.32) but provided a different story about the cause. The scan shows no clear vapor space below the bottom tray. It also showed the bottom sump liquid level reaching the reboiler return inlet nozzle. The tower had a kettle reboiler, so the liquid level in the tower bottom sump was not controlled but was set by the pressure drop in the kettle reboiler circuit. When this liquid level exceeds the reboiler return elevation, the reboiler return vapor will entrain massive quantities of this liquid into the trays, initiating flood (Section 2.13). Therefore, the tower flooding was caused not by a tray bottleneck, but by excessive pressure drop in the reboiler circuit. An excessive pressure drop in kettle reboiler circuits is a common cause of high bottom levels that initiate flooding in towers (Section 2.13). Figure 5.32 Gamma scan showing high bottoms liquid level generating flood throughout the tower. When a packing distributor, redistributor, or a chimney tray overflows, liquid enters the vapor passages. The vapor rise area is typically 50%, 25%, and 25% for trough distributors, pan distributors, and chimney trays, respectively. With C-factors (Eq. (2.1)) of high-capacity trays and packings often approaching 0.4 ft/s (Section 2.16), a pan distributor or chimney tray overflow is likely to induce system limit flooding. This is further discussed in Section 8.11, with typical examples in Cases 1 and 2 of this section. Gamma scans are powerful for identifying such bottlenecks. A liquid level reaching or exceeding the top of the chimneys indicates a likely overflow. The gamma scans can also detect whether flood initiates at that point, or whether there is liquid descending to the section below via the chimneys. In three different columns (118, 330, 489), gamma scans showed liquid level at the top of the chimneys of a chimney tray. In two of these columns (330, 489), the liquid going to a kettle reboiler overflowed the chimneys. In one of them (330), the liquid descended through the chimneys, bypassing the reboiler and inducing lights into the bottom product; in the other (489), the vapor velocity through the chimneys was too high to allow the liquid descent so the liquid was entrained, flooding the trays above. In the third column (118), the liquid backed up, some descending through the chimneys and contaminating the bottom product, the rest entrained initiating a premature flood of the trays above. When scanning for overflow, it is essential to judiciously set the scan chords. Poor scan chord selection may lead to inconclusive results. The scan chords should be able to clearly distinguish the liquid level from the chimney metal. Generally, a chord that passes through liquid only is best, while chords that intersect too much metal should be avoided. Figure 5.33 is an enlargement of the gamma scan in Figure 5.14 at elevations from 68 to 88 ft. The troubleshooting investigation (238) in the tower in Section 5.5.4 needed to test a theory that attributed the tower flood to overflow of the chimney tray collecting the bottom liquid and feeding it to a once-through thermosiphon reboiler below. The theorized high liquid level was attributed to insufficient residence time to degas the liquid with the reboiler feed line undersized for self-venting flow (Section 2.15). Figure 5.33 confirms that the liquid level on the chimney tray reached the top of the chimneys (18 in.) both at the normal and increased reflux scans. However, trays 29 and 30 showed clear vapor spaces and no flooding. The scans thus confirmed a “flood bottleneck waiting to happen, but not yet reached.” Figure 5.33 shows likely weeping from the chimney tray in the normal reflux scan (blue), but no weeping in the high-reflux scan (red). During operation, there were no problems with reboiler operation or with bottoms purity, so no one expected an issue. However, while performing the modifications discussed in Section 5.5.4 during the next turnaround, the chimney heights were increased from 18″ to 36″. Upon return to service, the concentration of lights in the bottom was much lower, which could only be explained by elimination of the overflow. Co-authored with Betzalel Blum, Bazan, Haifa, Israel Following a process upset, a refinery crude tower experienced poor separation between the diesel and the bottom residue. To keep the diesel 95% point (heavies content) on spec, the refinery lost some diesel in the bottom residue and needed to cut charge rates. Tray damage at the upset was suspected. An outage for repair was considered, but a positive diagnosis was required before taking such a harsh and expensive step. The tower was scanned with a focus on the wash section, the section that achieves the diesel rectification and gets it on spec, trays 35 to 41 in the tower. Figure 5.33 Gamma scan showing liquid level reaching or almost reaching the top of chimneys on a chimney tray, but not generating flood. (From Kister, H. Z., D. E. Grich, and R. Yeley, PTQ Revamps and Operation, 2003. Reprinted Courtesy of PTQ.) Each of the 2-pass trays active areas, as well as the center downcomers, were gamma scanned. The active area scan chords were parallel to and equidistant from the centerline. The south active areas looked dry (red curve in Figure 5.34a); the north active areas (blue curve) appeared more normal, but still on the dry side. The south side of trays 36 and 37 held very little liquid, suggesting damage. The south scan showed some gamma-ray absorptions in the vapor spaces, suggesting the presence of some dense material such as dislodged tray parts. The downcomer scans (not shown) showed about 4 in. of liquid in the center downcomers from trays 35 and 37. So there were more arguments supporting tray damage than tray dryout, but the arguments were inconclusive to justify a unit shutdown. The two key parameters for tray hydraulics are the C-factor (Eq. (2.1)) and the weir load (Section 2.11), which express the vapor and liquid loads, respectively. At the tray spacing of 30 in. and the low weir loads typical of the wash section, the trays will be near jet flood when the C-factor reaches about 0.4 ft/s (Section 2.16). From the tower simulation, the C-factor was less than 0.23 ft/s, which gives less than 60% of jet flood. With the very small liquid loads and the large tray spacing in that section, downcomer flood would not even be close. So these trays should be operating at a comfortable margin away from flood. Weir loads are usually extremely low in wash sections (<1–2 gpm/in. of outlet weir length). Based on the plant meters, the weir loads during the scan were even lower, of the order of 0.2–0.6 gpm/in. of outlet weir length. At this liquid load range, the trays will be essentially dry and will look dry on the gamma scans. A dry tray does not look much different from a missing tray (Section 5.3, item 12, and Section 5.5.9). Gamma scans do not see trays; they see liquid sitting on the trays. This is key for interpreting the current gamma scans. This led to the conclusion that the scan interpretation so far was inconclusive. Figure 5.34 Gamma scans of wash section. (a) At normal operating liquid rates, showing difference between south and north active areas; (b) south active area scan at double the liquid rates (red pen) compared to the original liquid rates (green pen). To distinguish dry from damaged trays, it was necessary to increase the weir loads by a great amount. This was achieved by cutting the diesel draw rate and running what used to be product as reflux to the wash section. The liquid rate was thus doubled, to 0.4–1.2 gpm/in. At weir loads greater than about 1 gpm/in. of outlet weir length (most of the trays), the trays should no longer look dry and should be much easier to distinguish from damaged trays. We then repeated the scans of the south active area and the center downcomers. At the higher liquid loads, the south active area scans (Figure 5.34b) showed more liquid on trays 37, 39, 40, and 41 (red curve). Not much change on trays 36 and 38. Both trays 36 and 38 had long outlet weirs and therefore low weir loads. There appears to be some flooding initiating above trays 37, 39, and 41 (the trays with the side downcomers). At the low C-factors, there is no explanation to flooding on these trays other than damage. As expected at the higher liquid loads, the liquid heights increased in the center downcomers. The observation of little change on trays 36 and 38 despite doubling the weir loads, as well as the unexpected flooding, provided strong evidence supporting tray damage. The tower was shut down, and the damage was found and repaired.
Chapter 5
Qualitative Gamma Scans Troubleshooting: The Basic Diagnostics Workhorse
5.1 GAMMA-RAY ABSORPTION
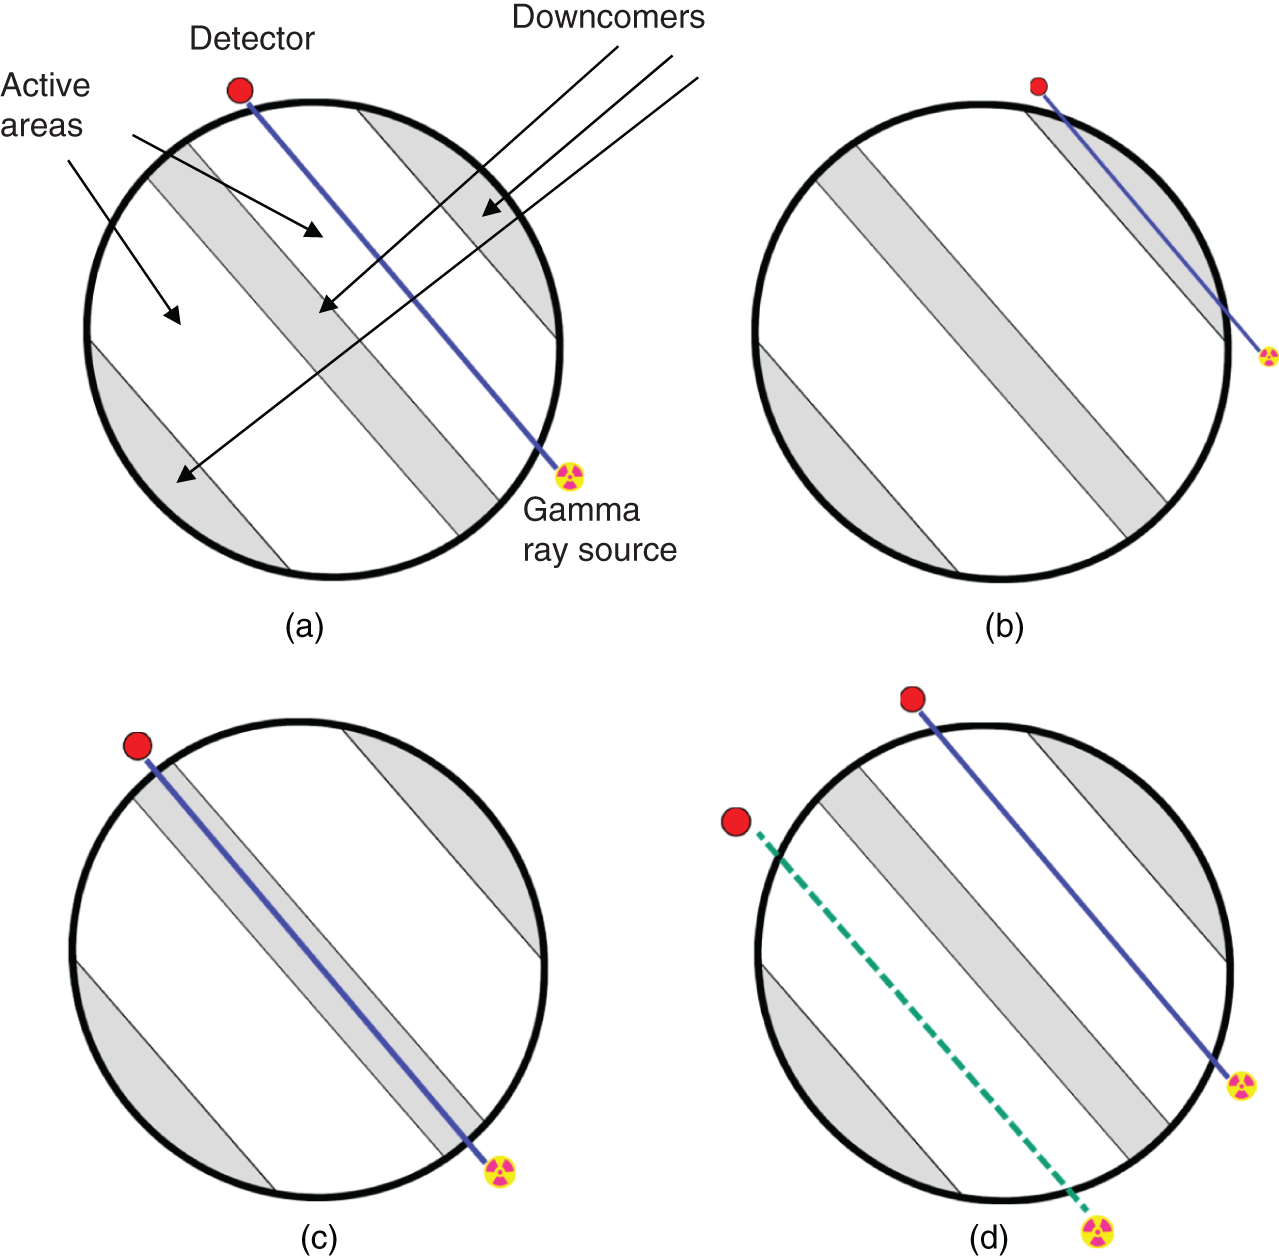
5.2 QUALITATIVE GAMMA SCANS
5.2.1 What Do Qualitative Gamma Scans Show in Tray Towers
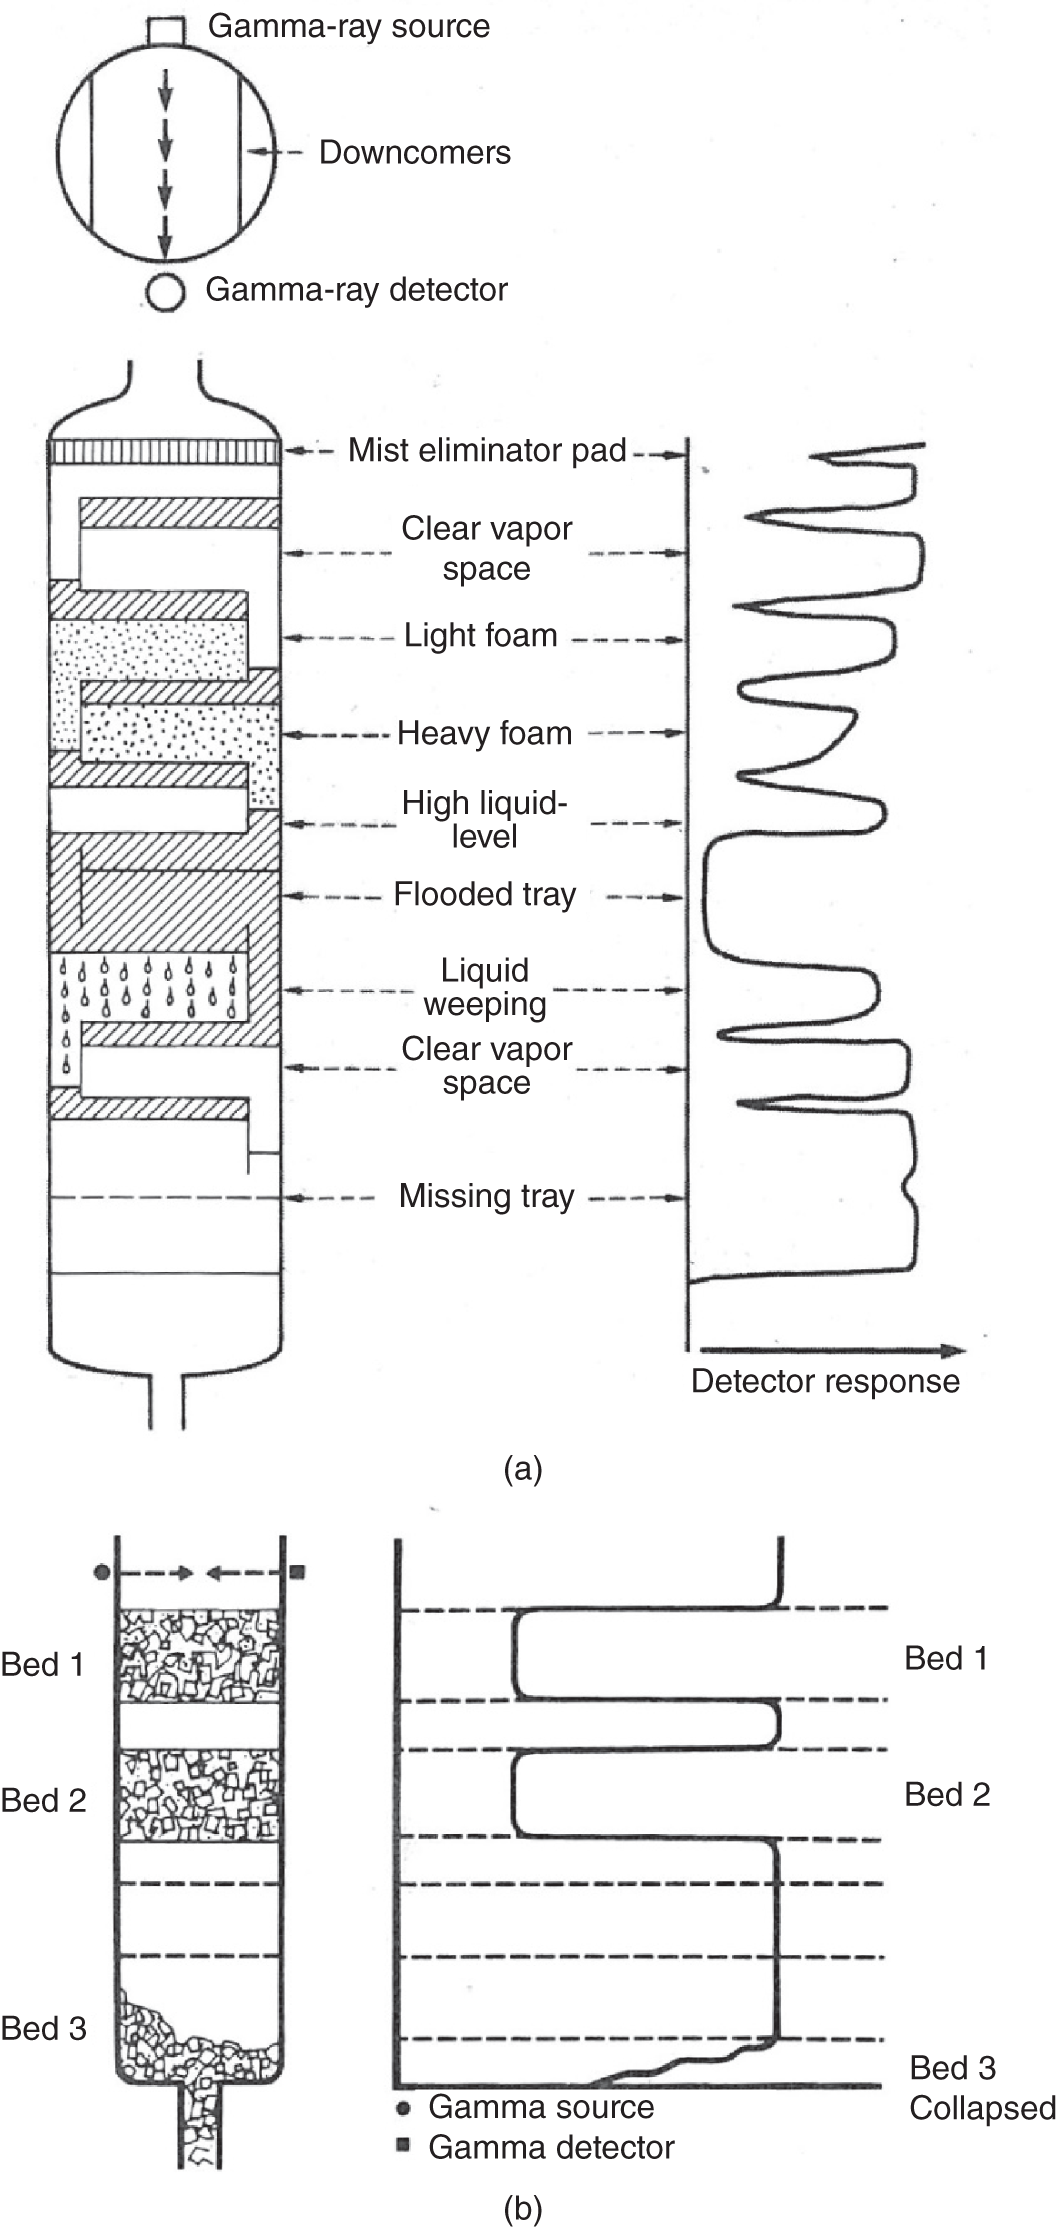
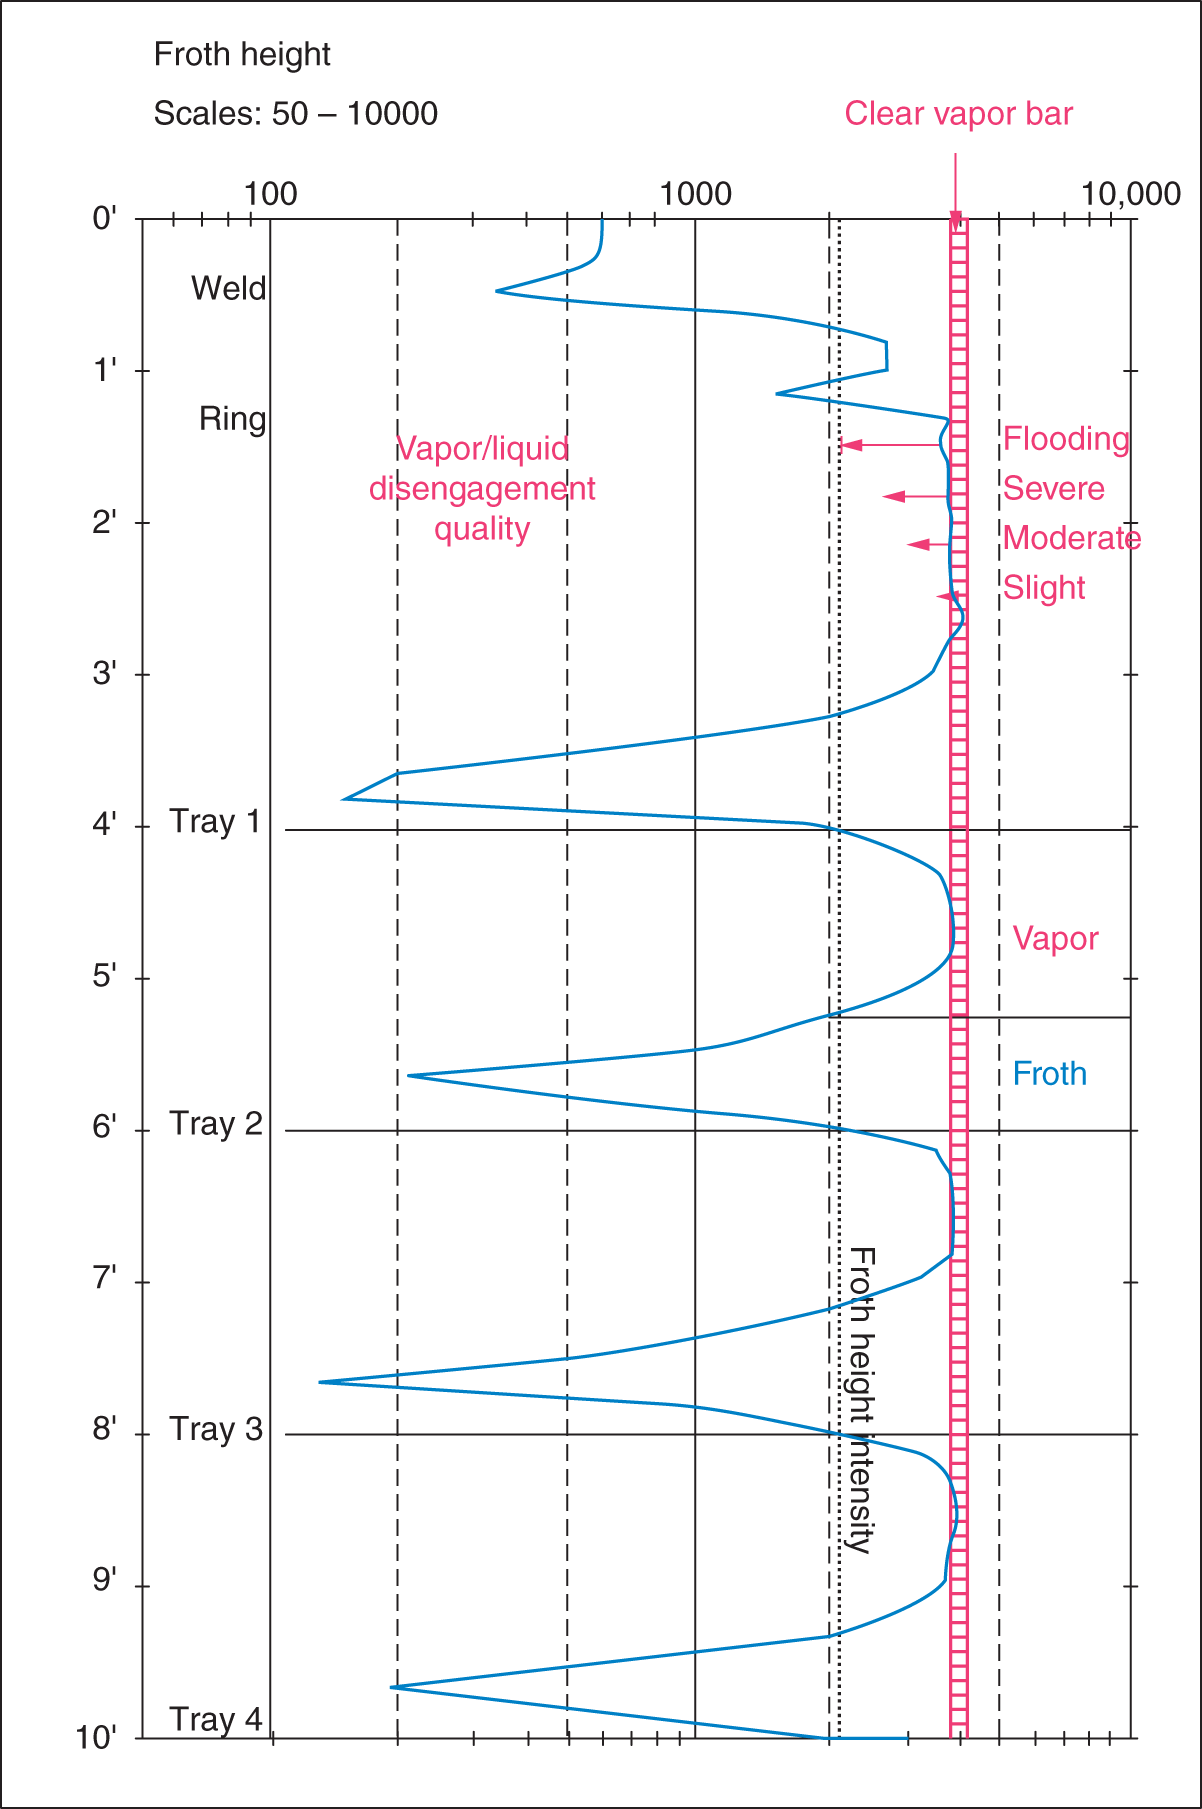
5.2.2 Entrainment versus Weeping
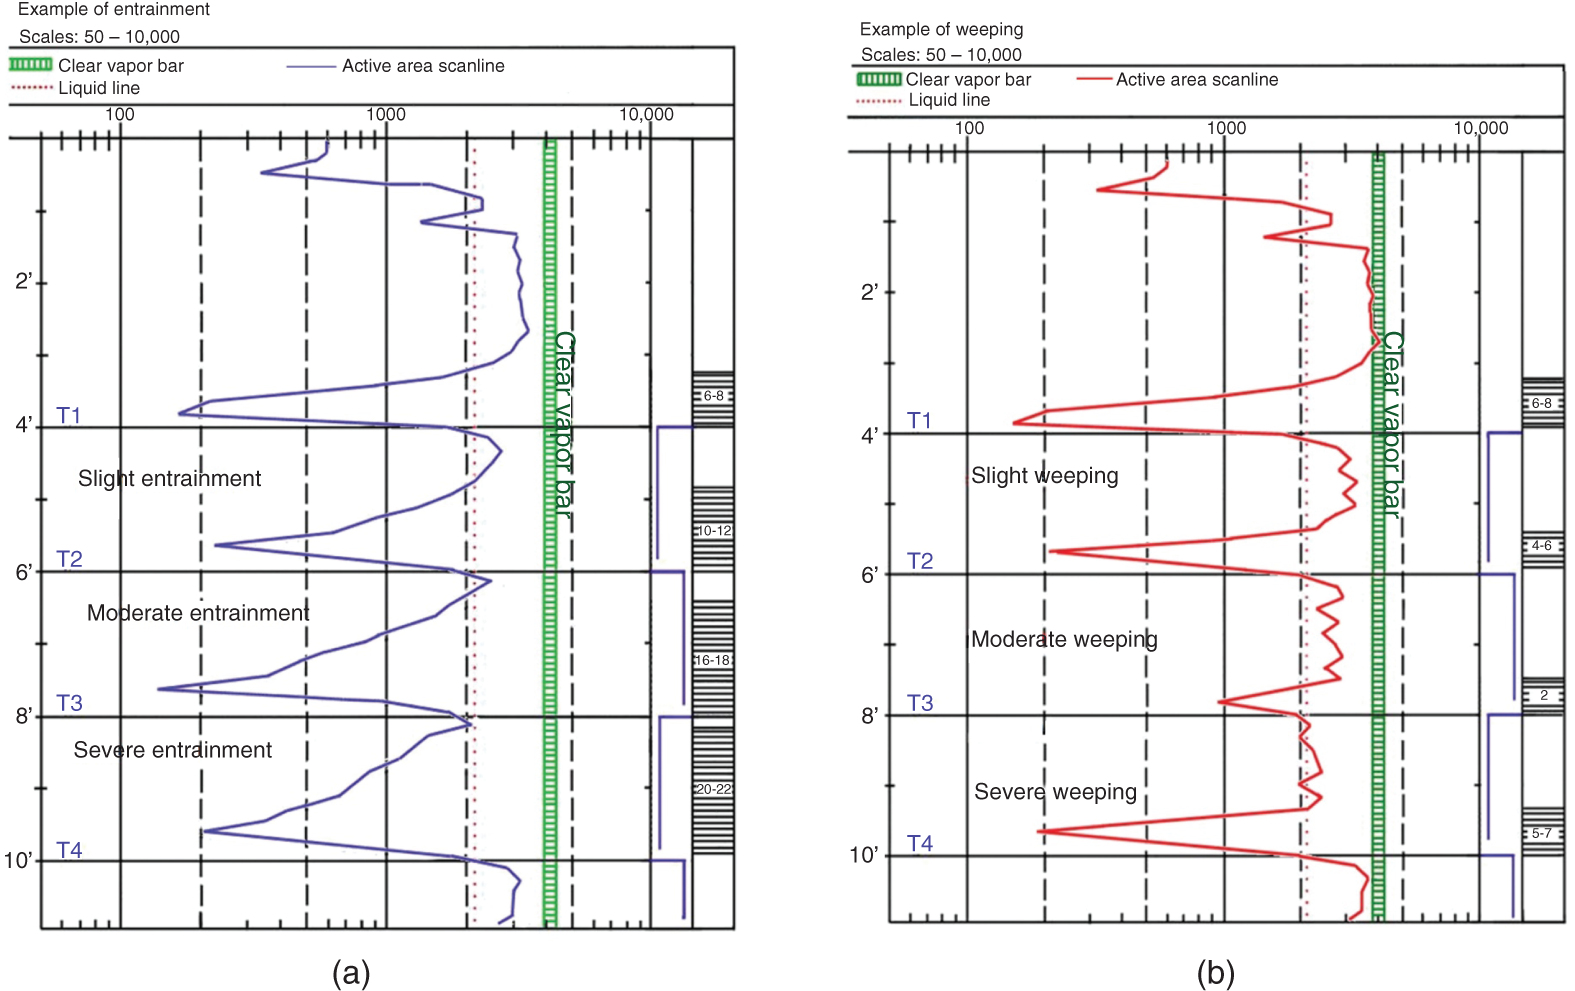
5.2.3 What Do Qualitative Gamma Scans Show in Packed Towers
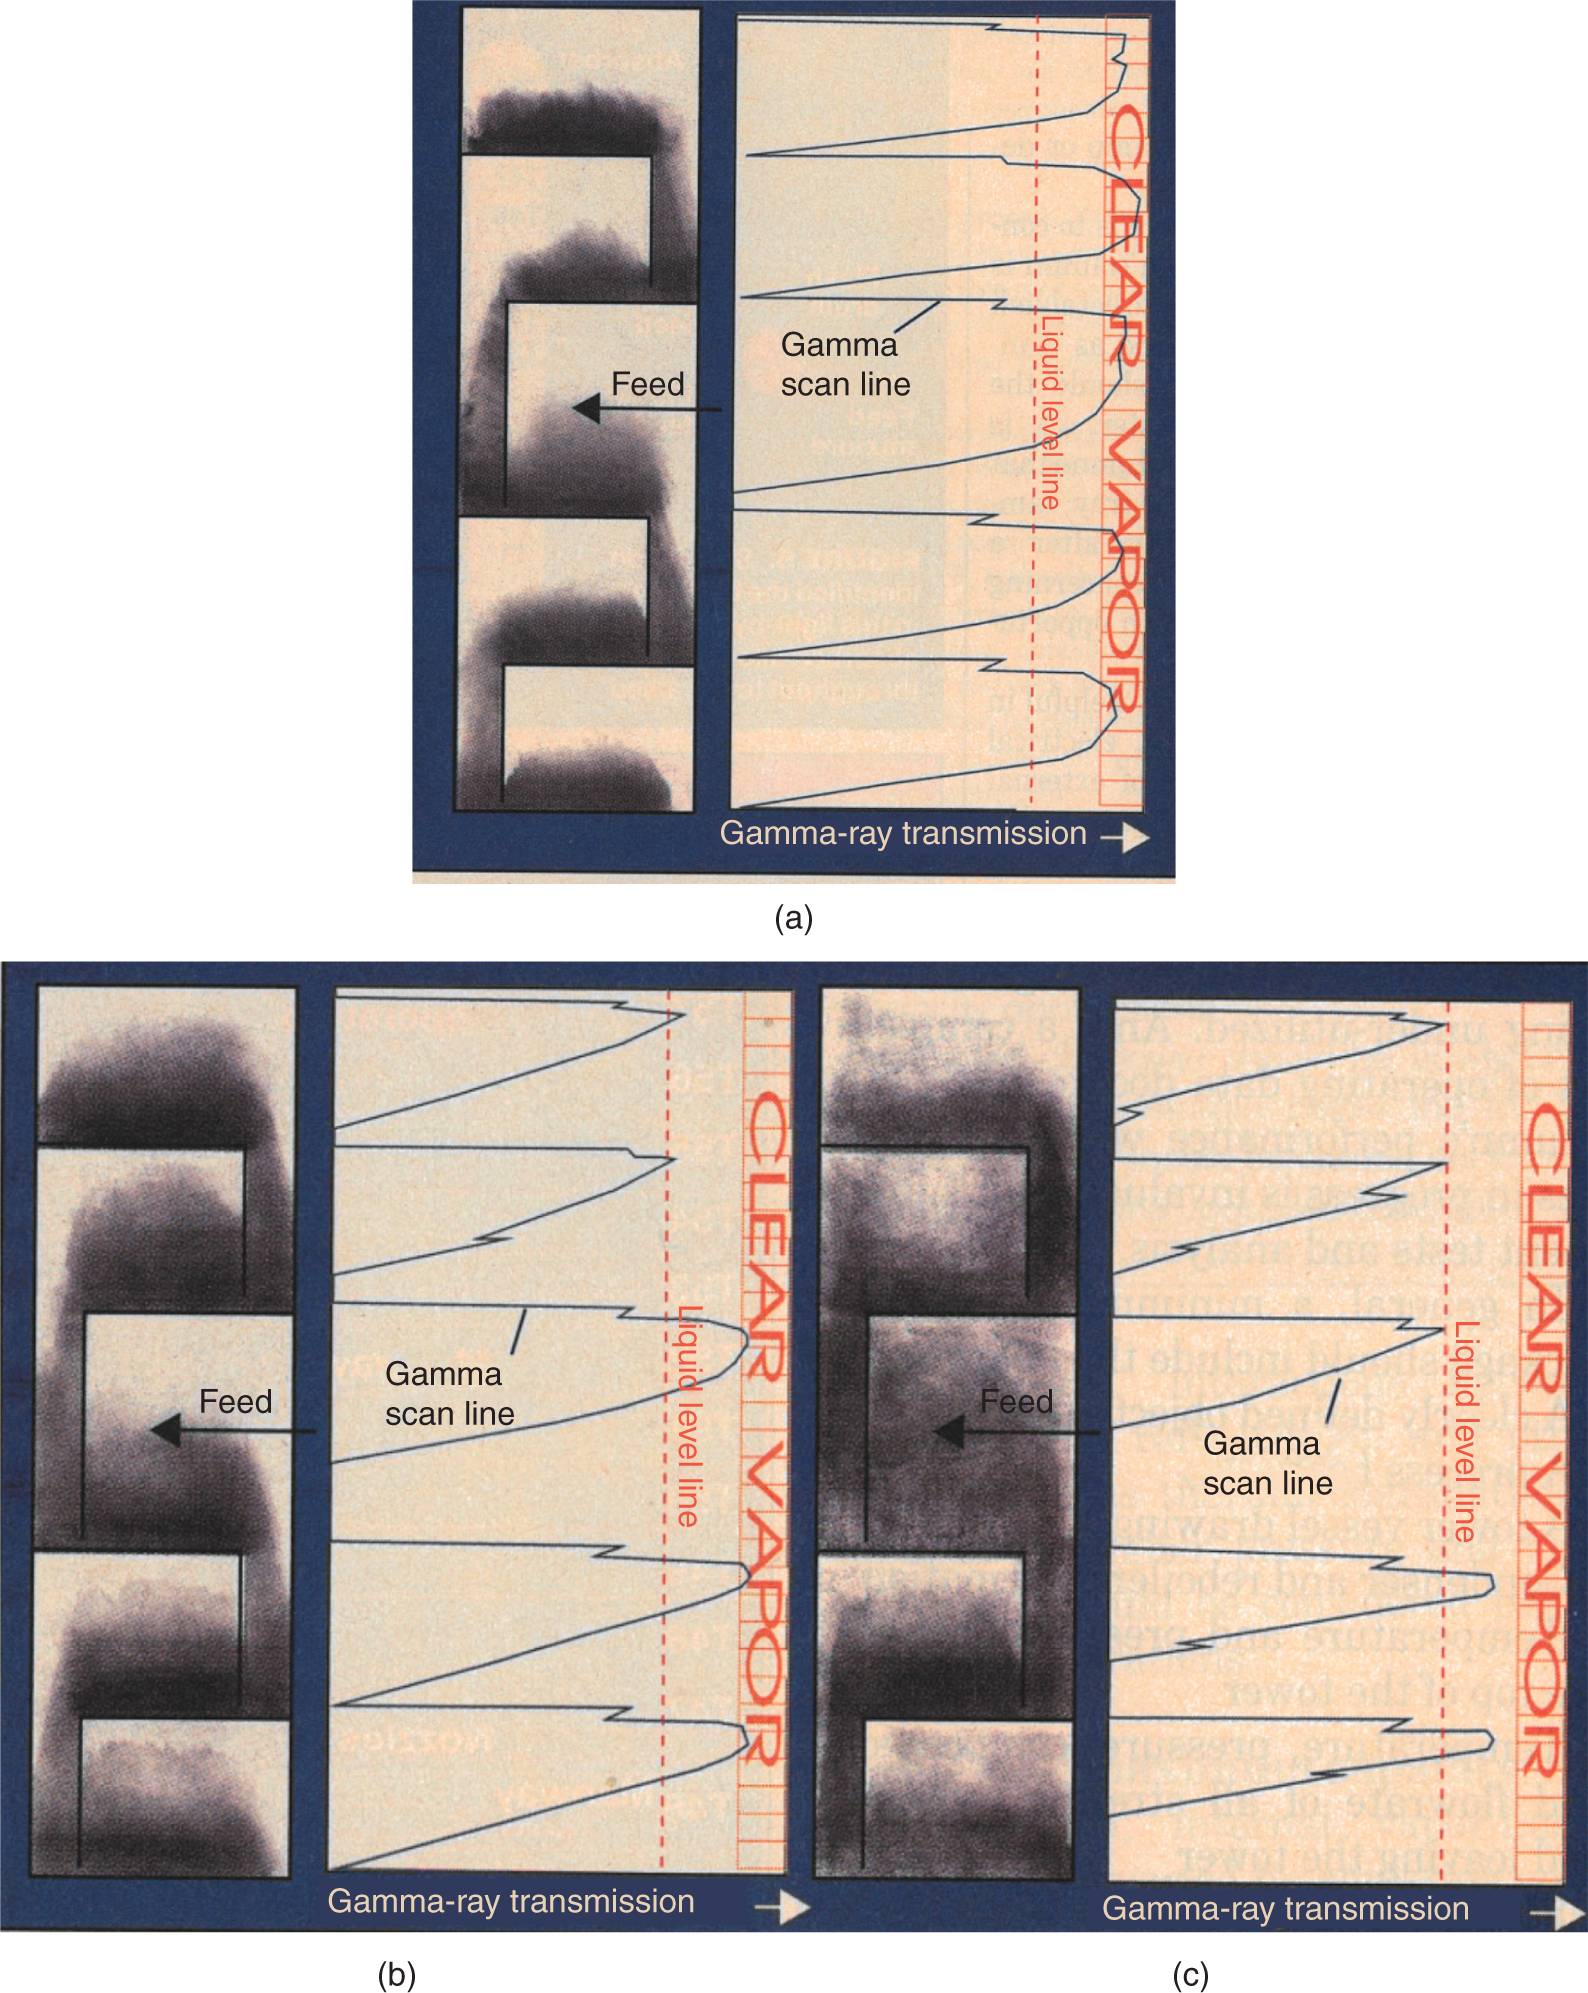
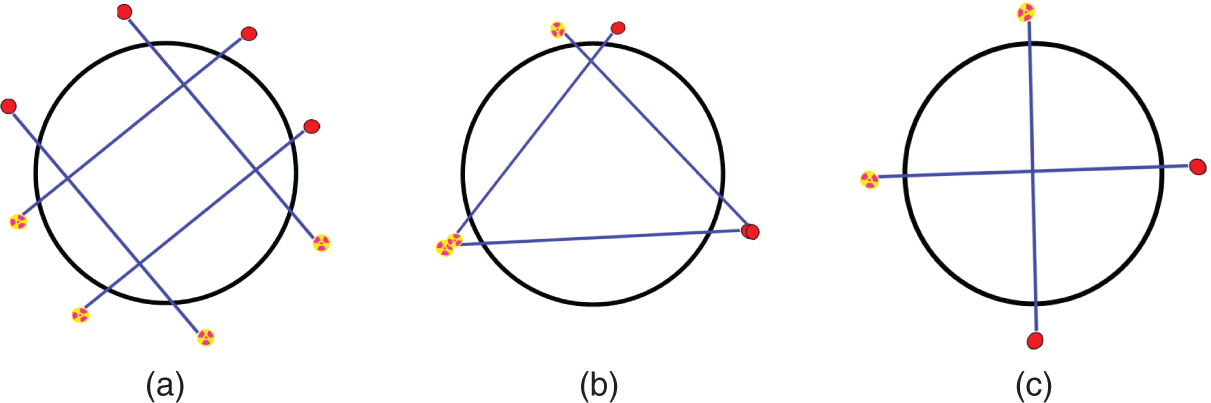
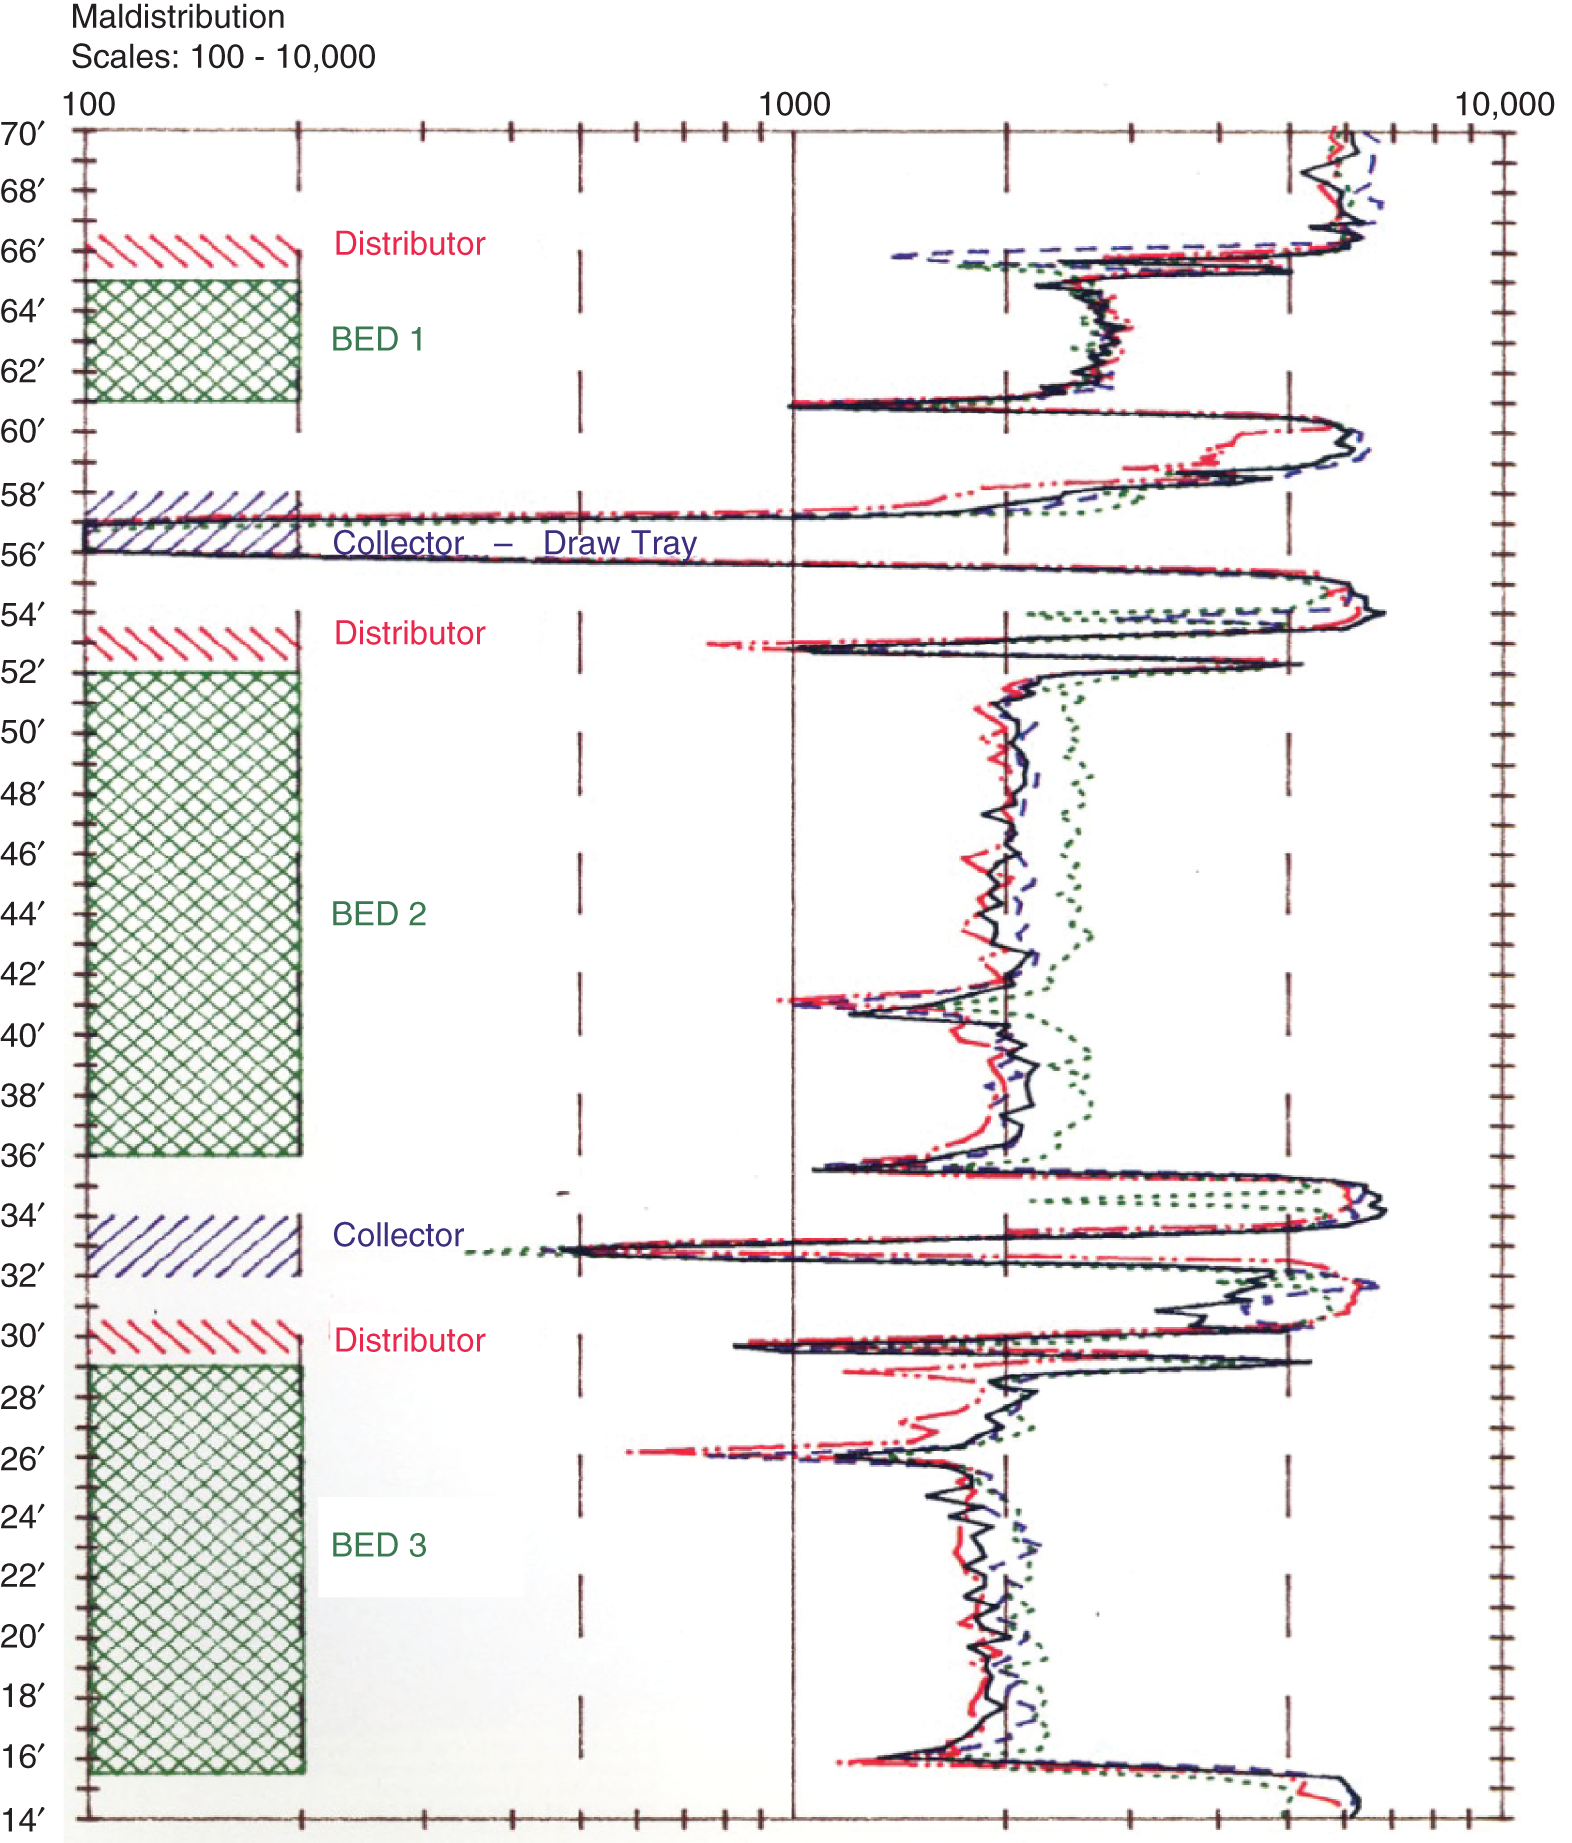
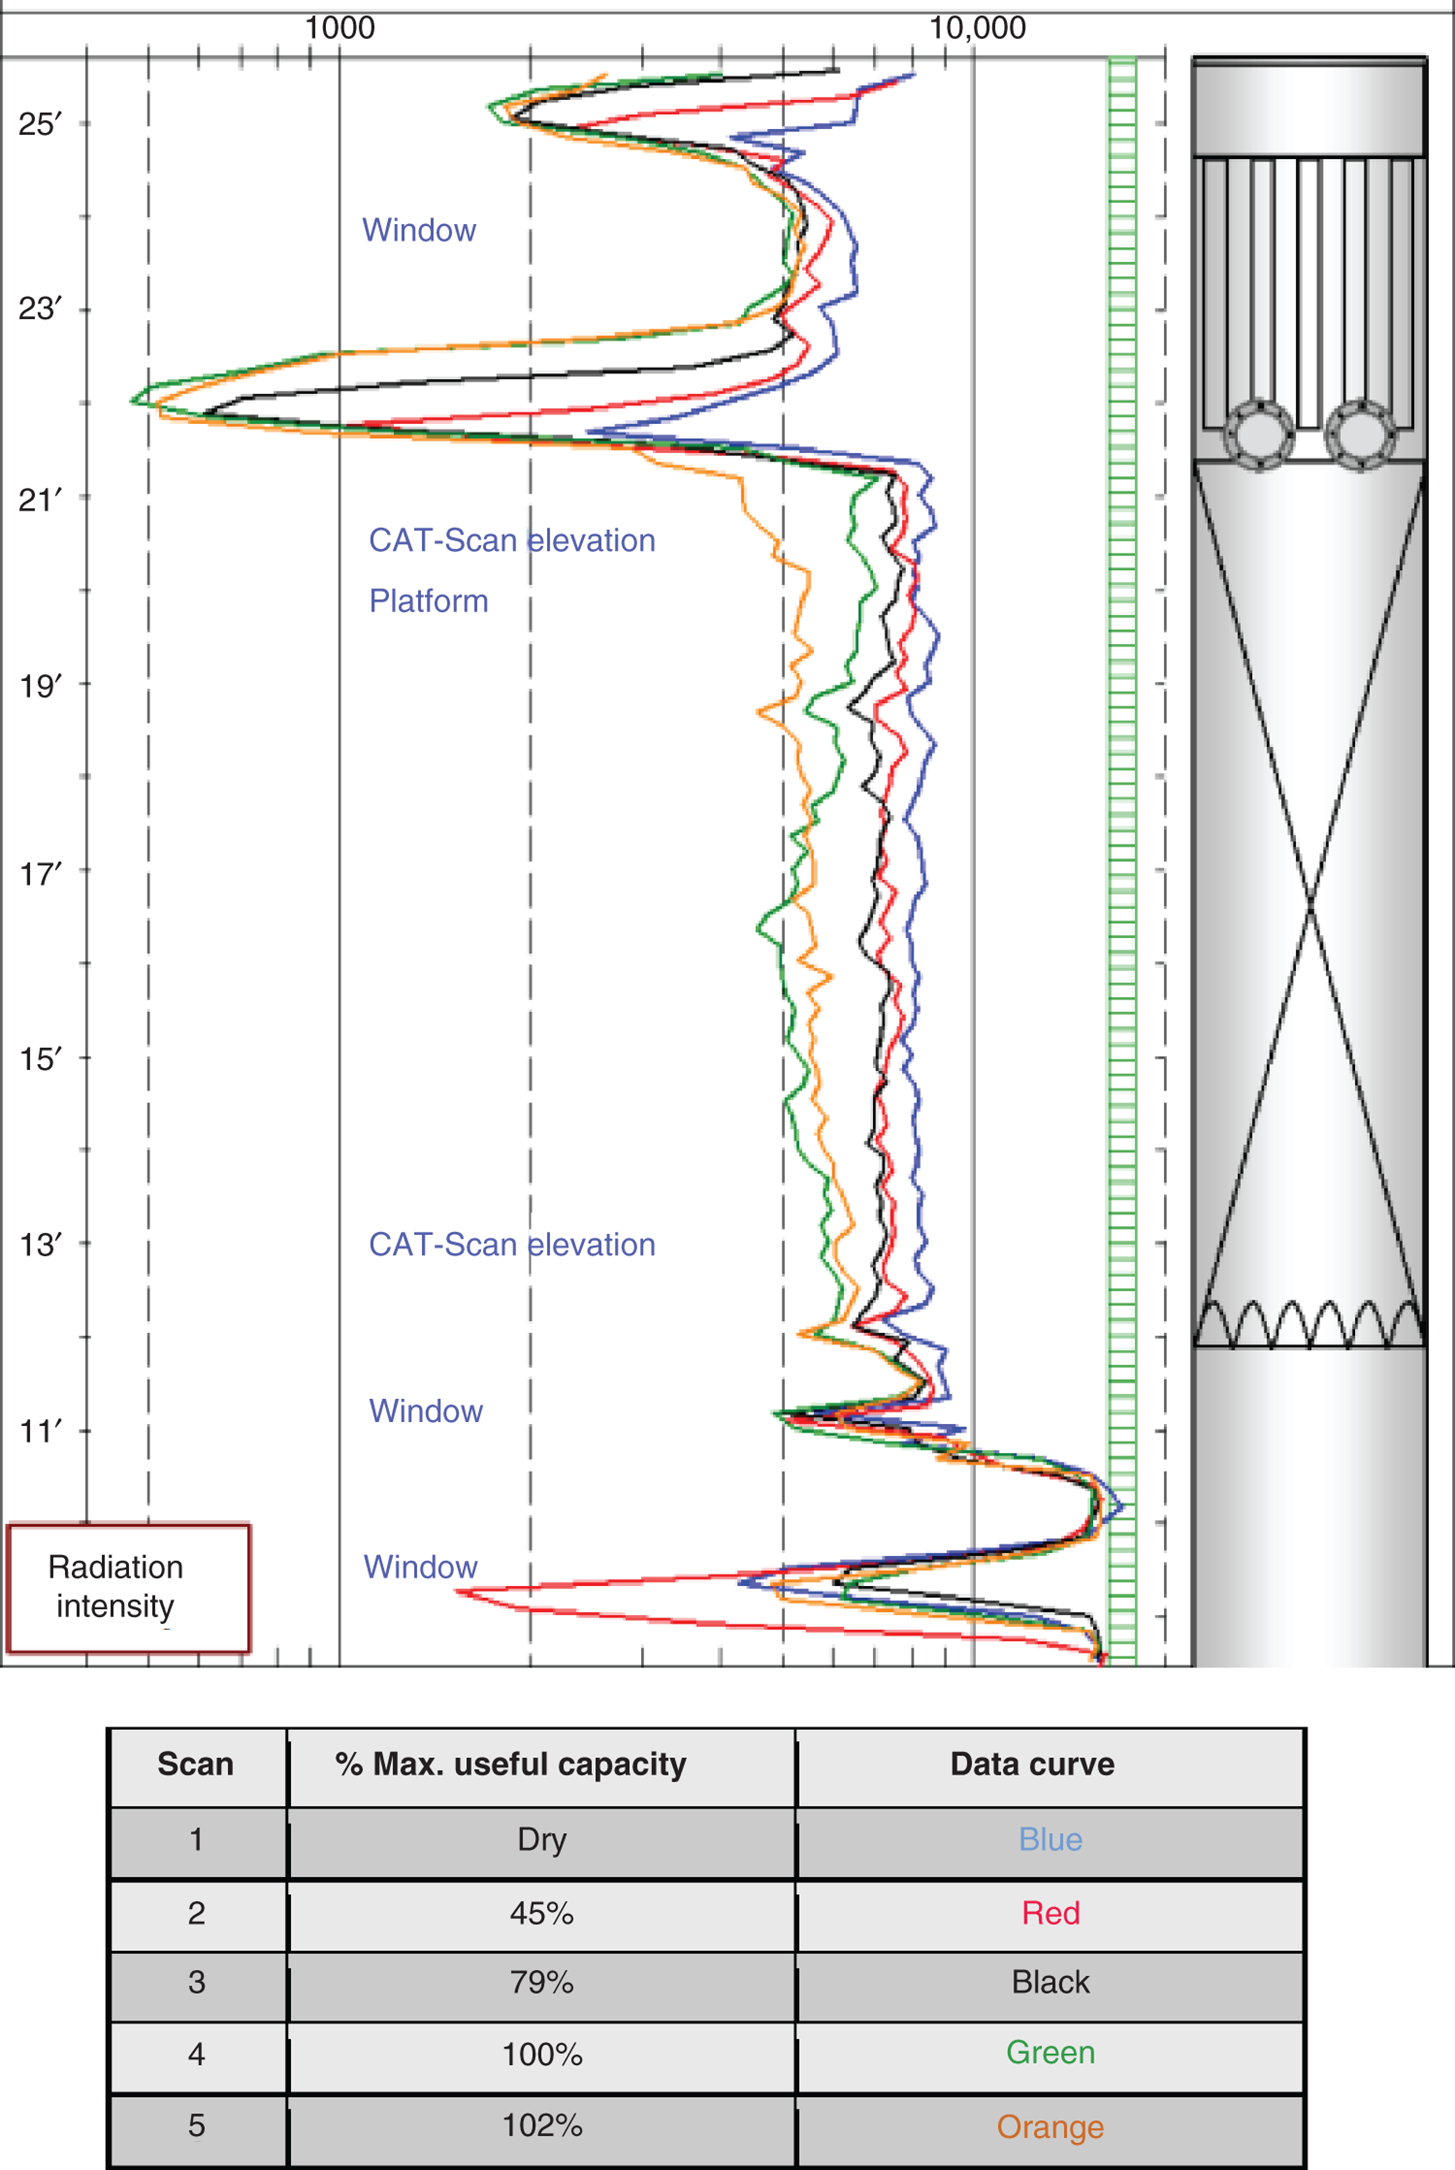
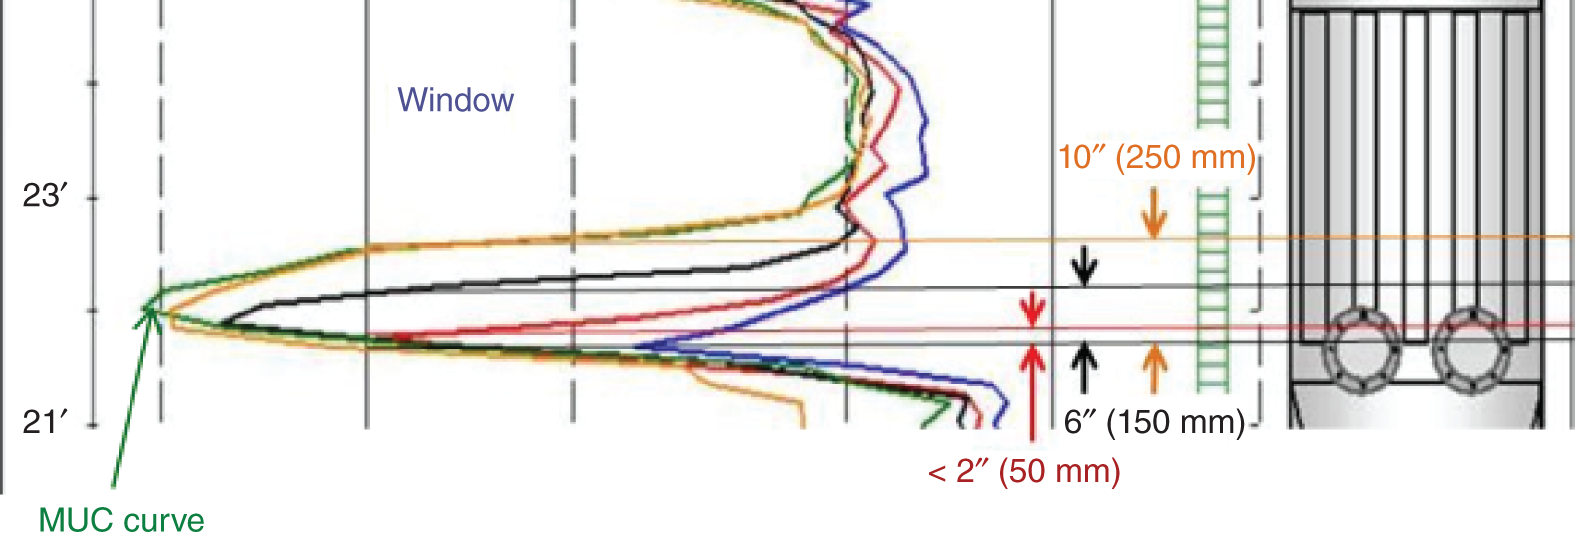
5.2.4 Stationary Monitoring (“Time Studies”)
5.2.5 What is in the Tower Inlet/Outlet Pipes?
5.3 GAMMA SCANS PITFALLS AND WATCHOUTS
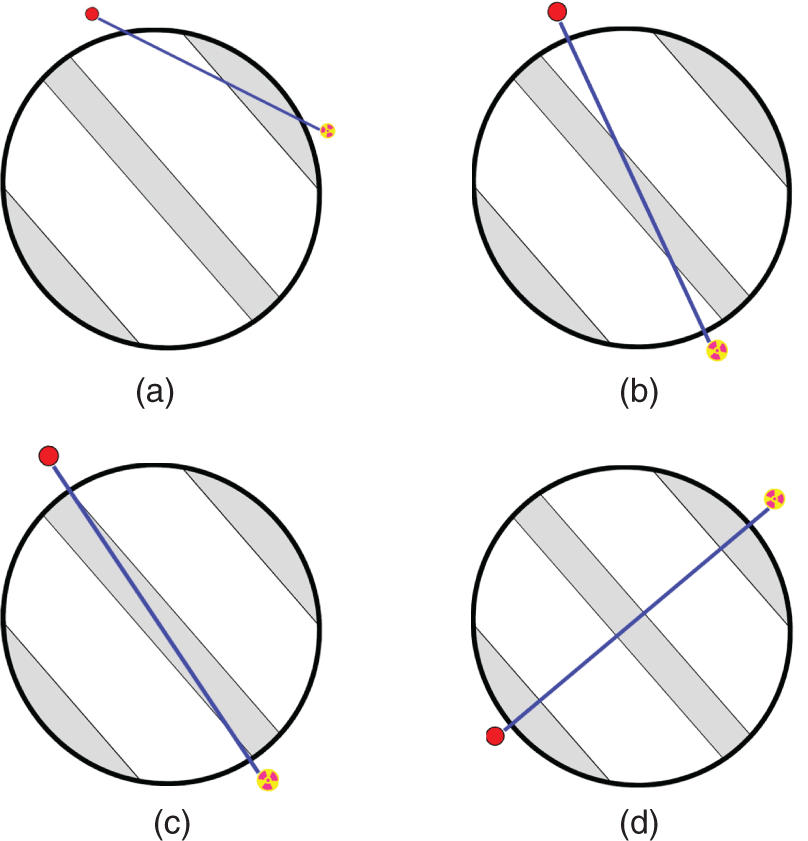
5.4 GAMMA SCAN SHORTCUTS: COST VERSUS BENEFITS
5.4.1 Dry (Empty Column) Scans: Yes or No?
5.4.2 Initial Operation Scans (Often Referred to as Baseline Scans): Yes or No?
5.4.3 Changed Conditions Monitoring Scans
5.4.4 Performing Downcomer Scans: Yes or No?
5.4.5 Can We Learn More about the Bottleneck?
5.4.6 Would Our Proposed Modification Solve the Problem?
5.5 SOME APPLICATIONS OF QUALITATIVE GAMMA SCANS
5.5.1 Distinguishing Fact from Interpretation
Facts
5.5.2 Is the Flood a Jet Flood?
5.5.3 Diagnosing the Correct Flood Mechanism and Arriving at the Effective Fix
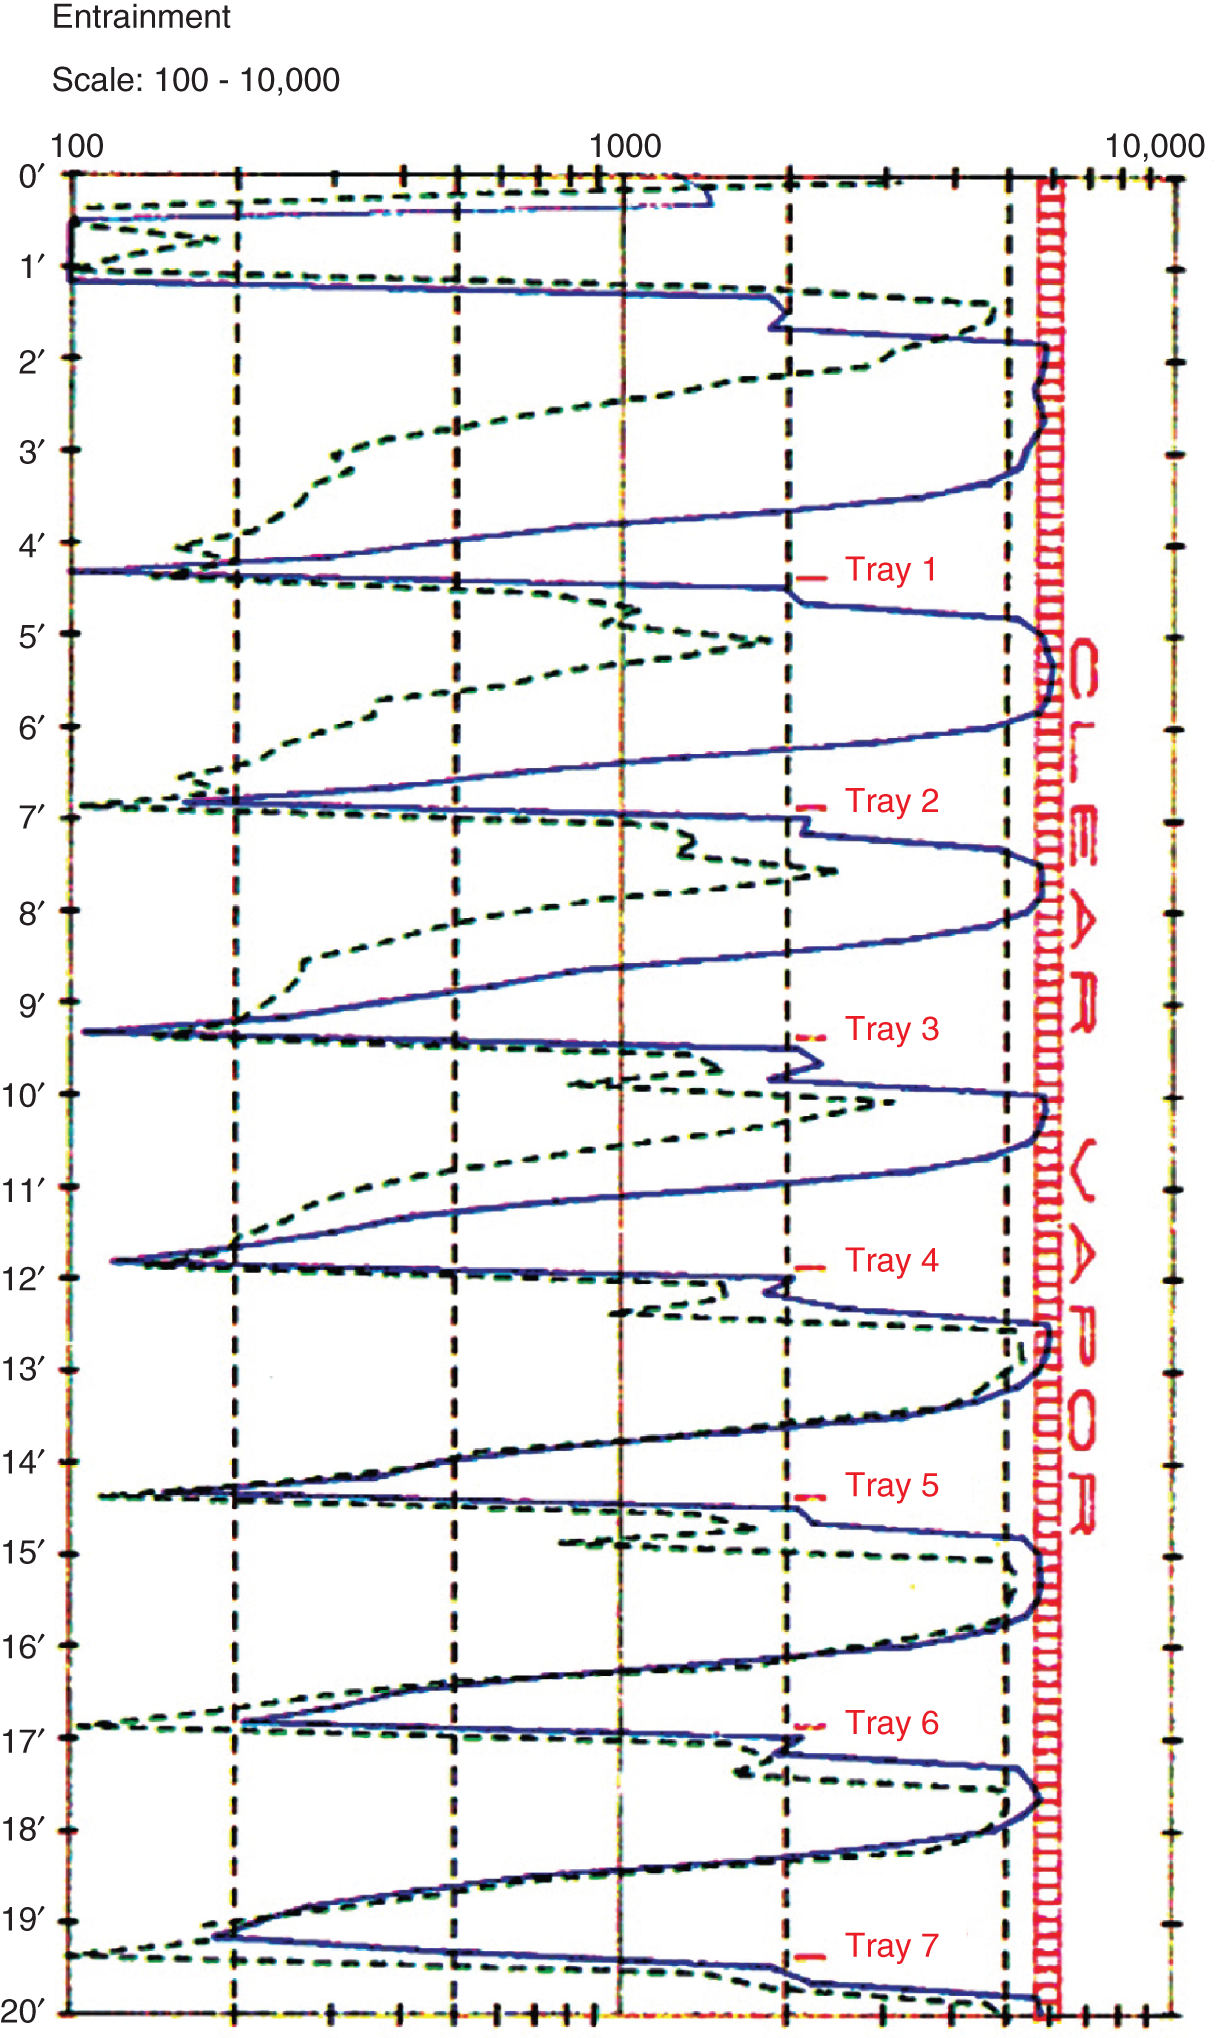
Tray number
Bottom
4–6 Trays from bottom
Just below feed
% Jet flood
52
52
17
% Froth in downcomer
61
60
41
% Downcomer choke
98
99
38
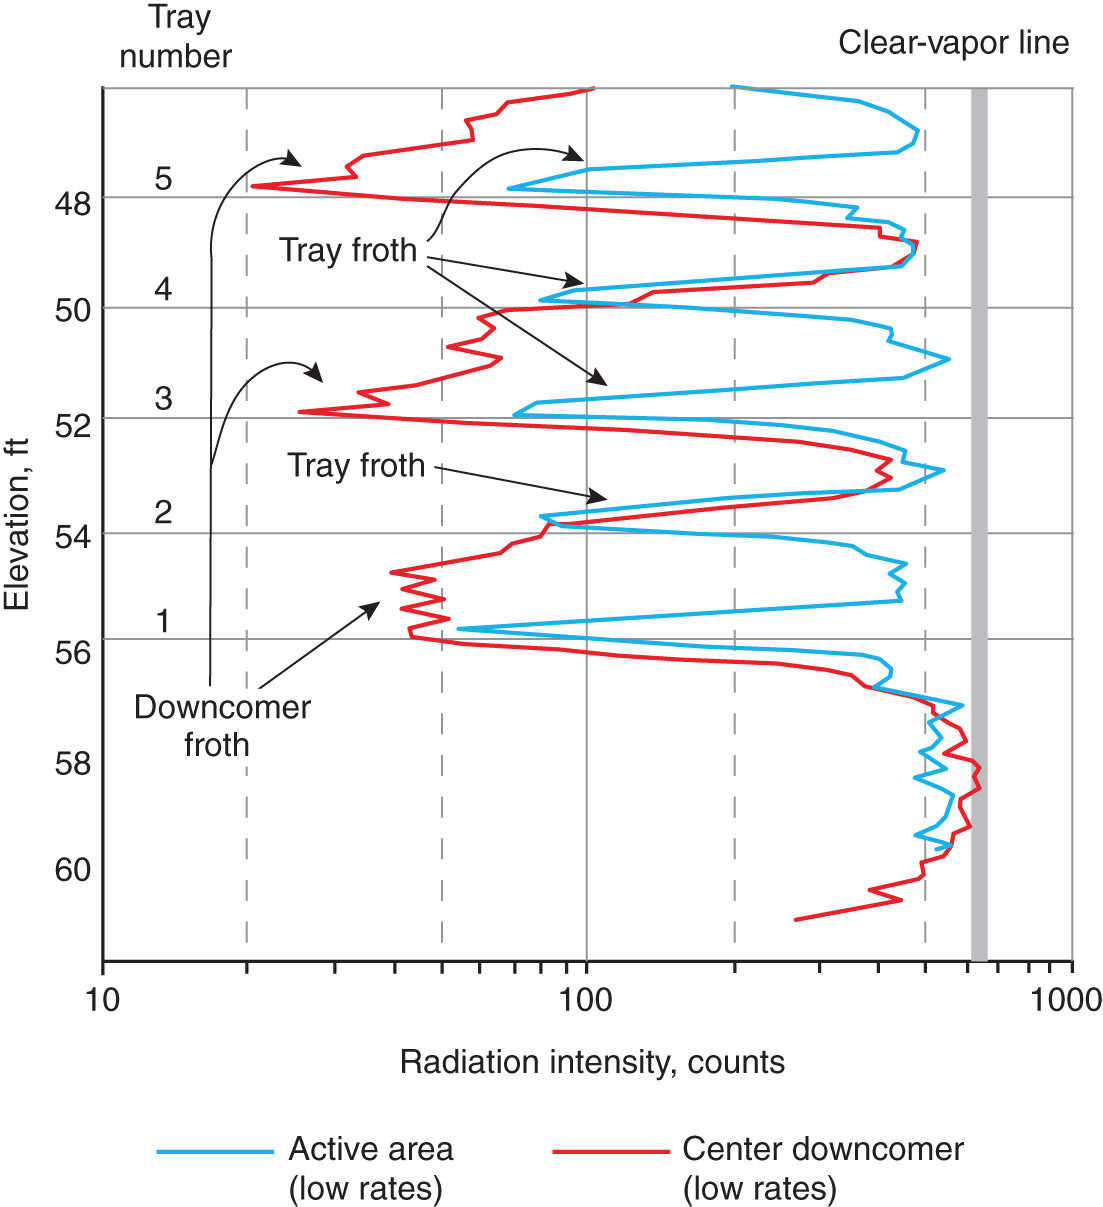
5.5.4 Does the Tower Flood Occur at the Expected Location?
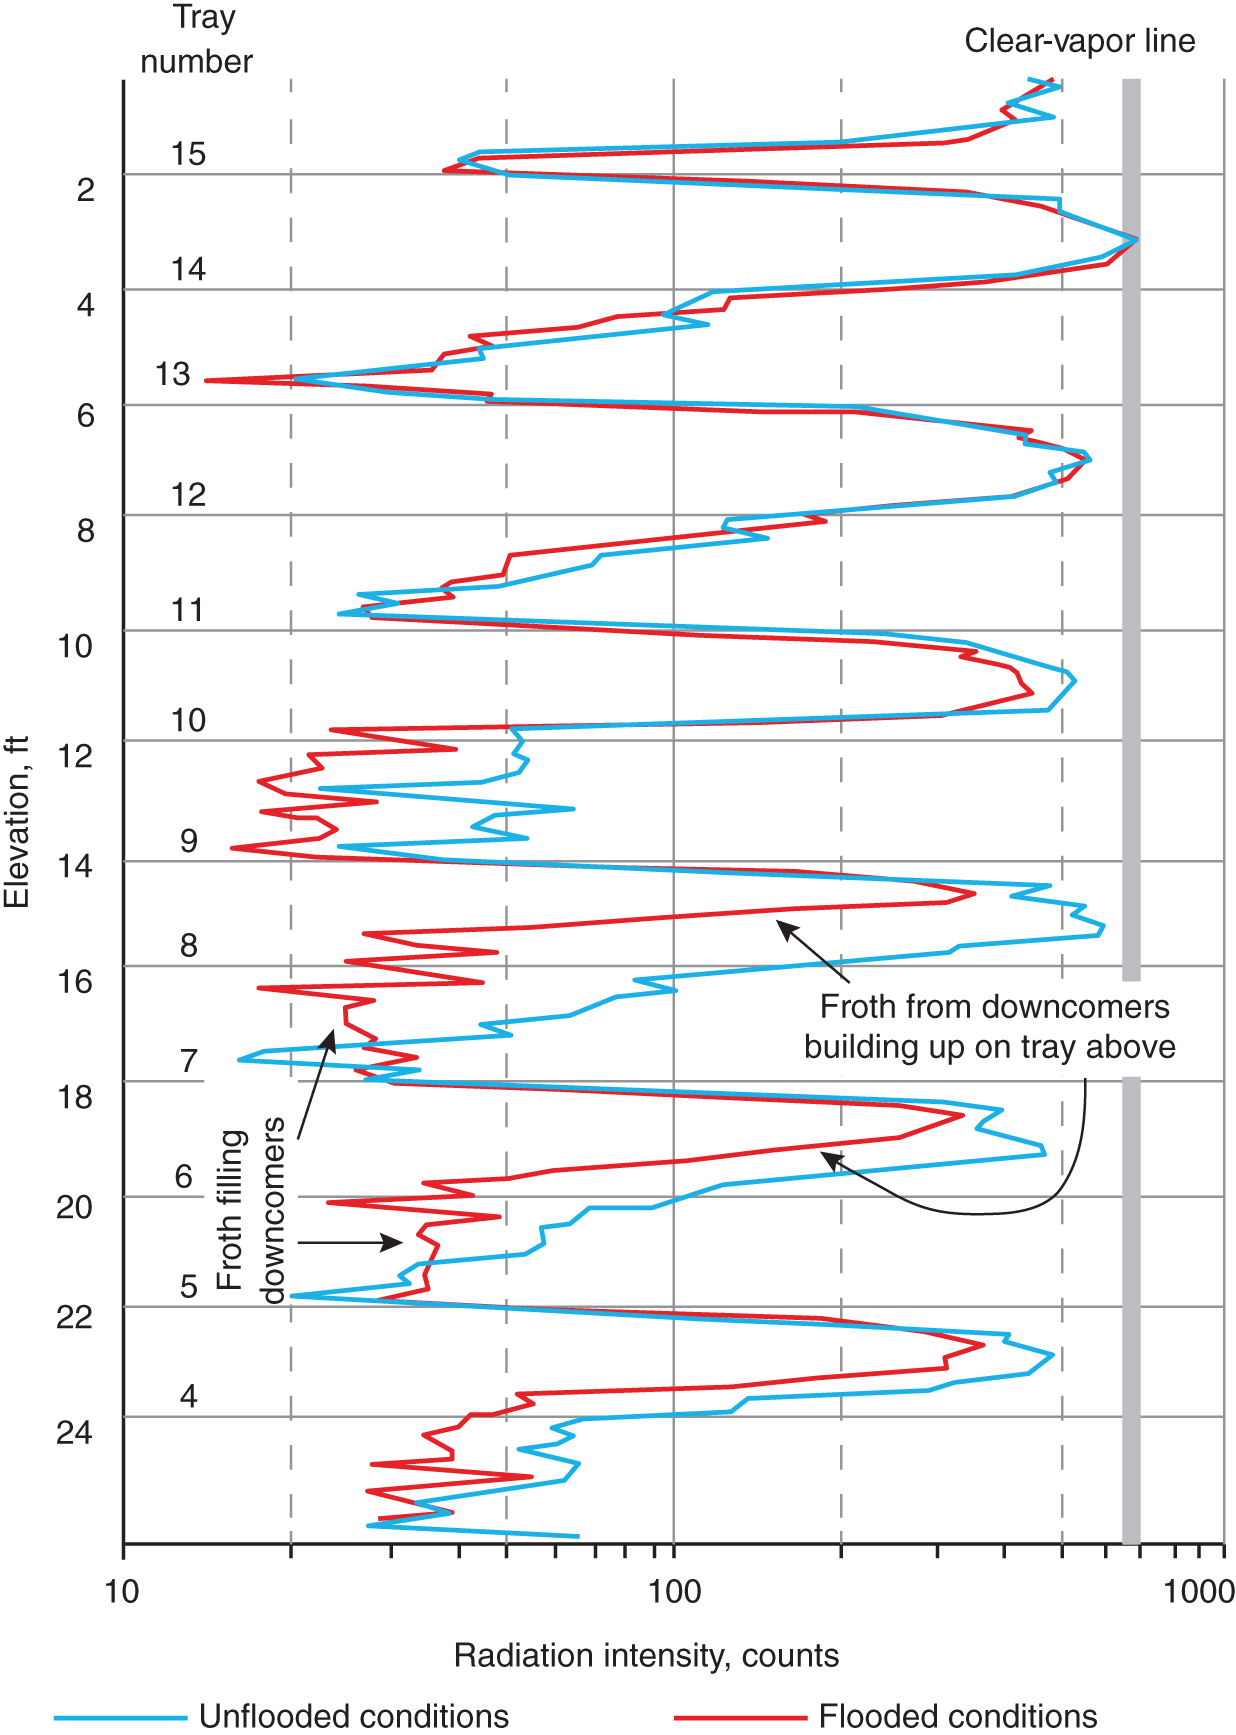
Tray number
Above feed
Below feed
Bottom trays
% Jet flood
55
39
56
% Froth in downcomer
56
56
69
% Downcomer choke interpolation
71
55
72
% Downcomer choke correlation
90
79
103
Downcomer entrance velocity (ft/s)
0.31
0.44
0.52
5.5.5 Foaming or Not Foaming?
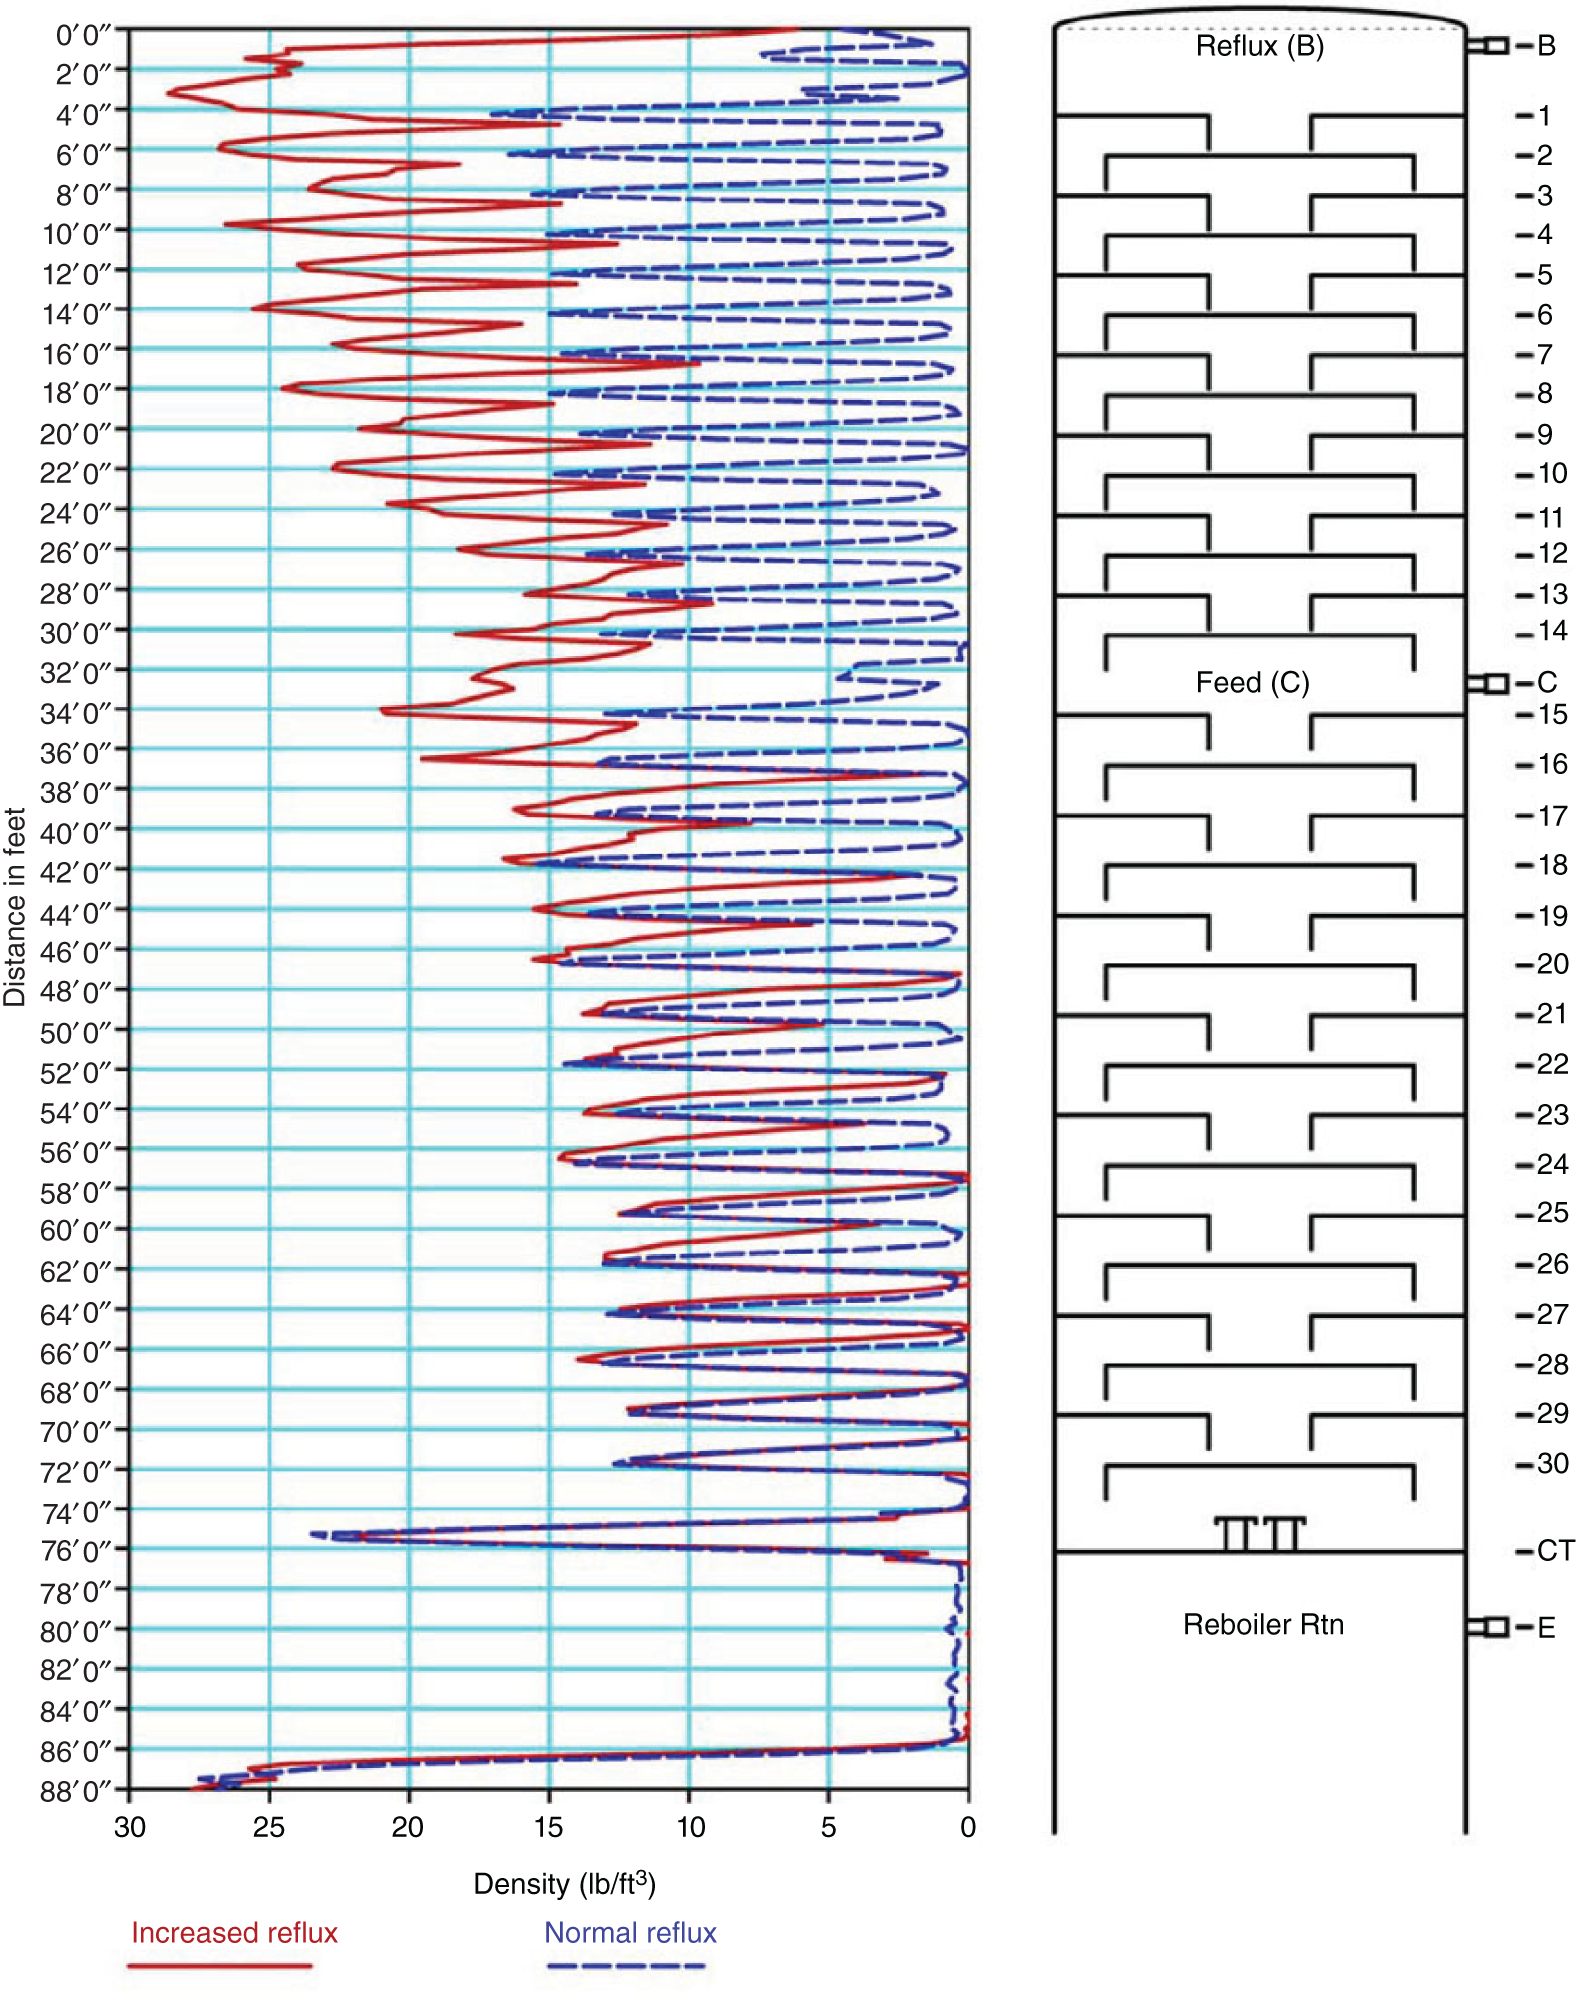
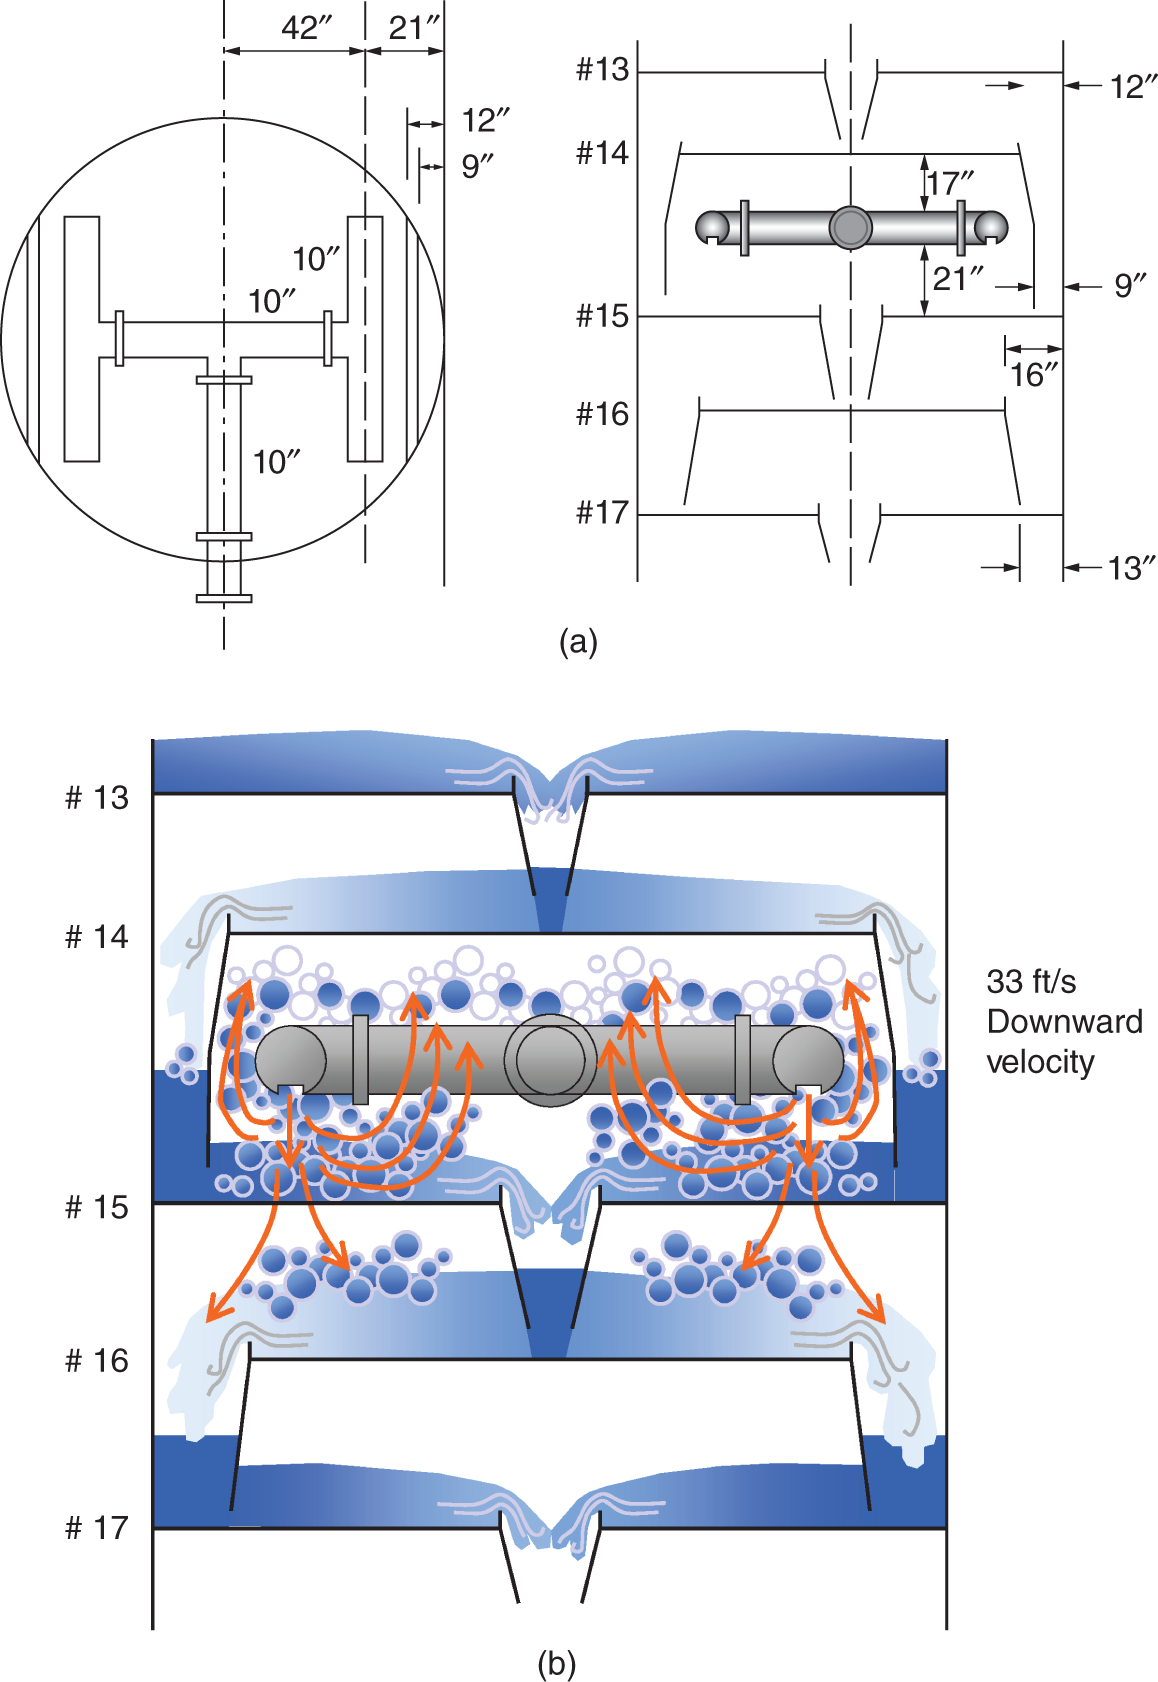
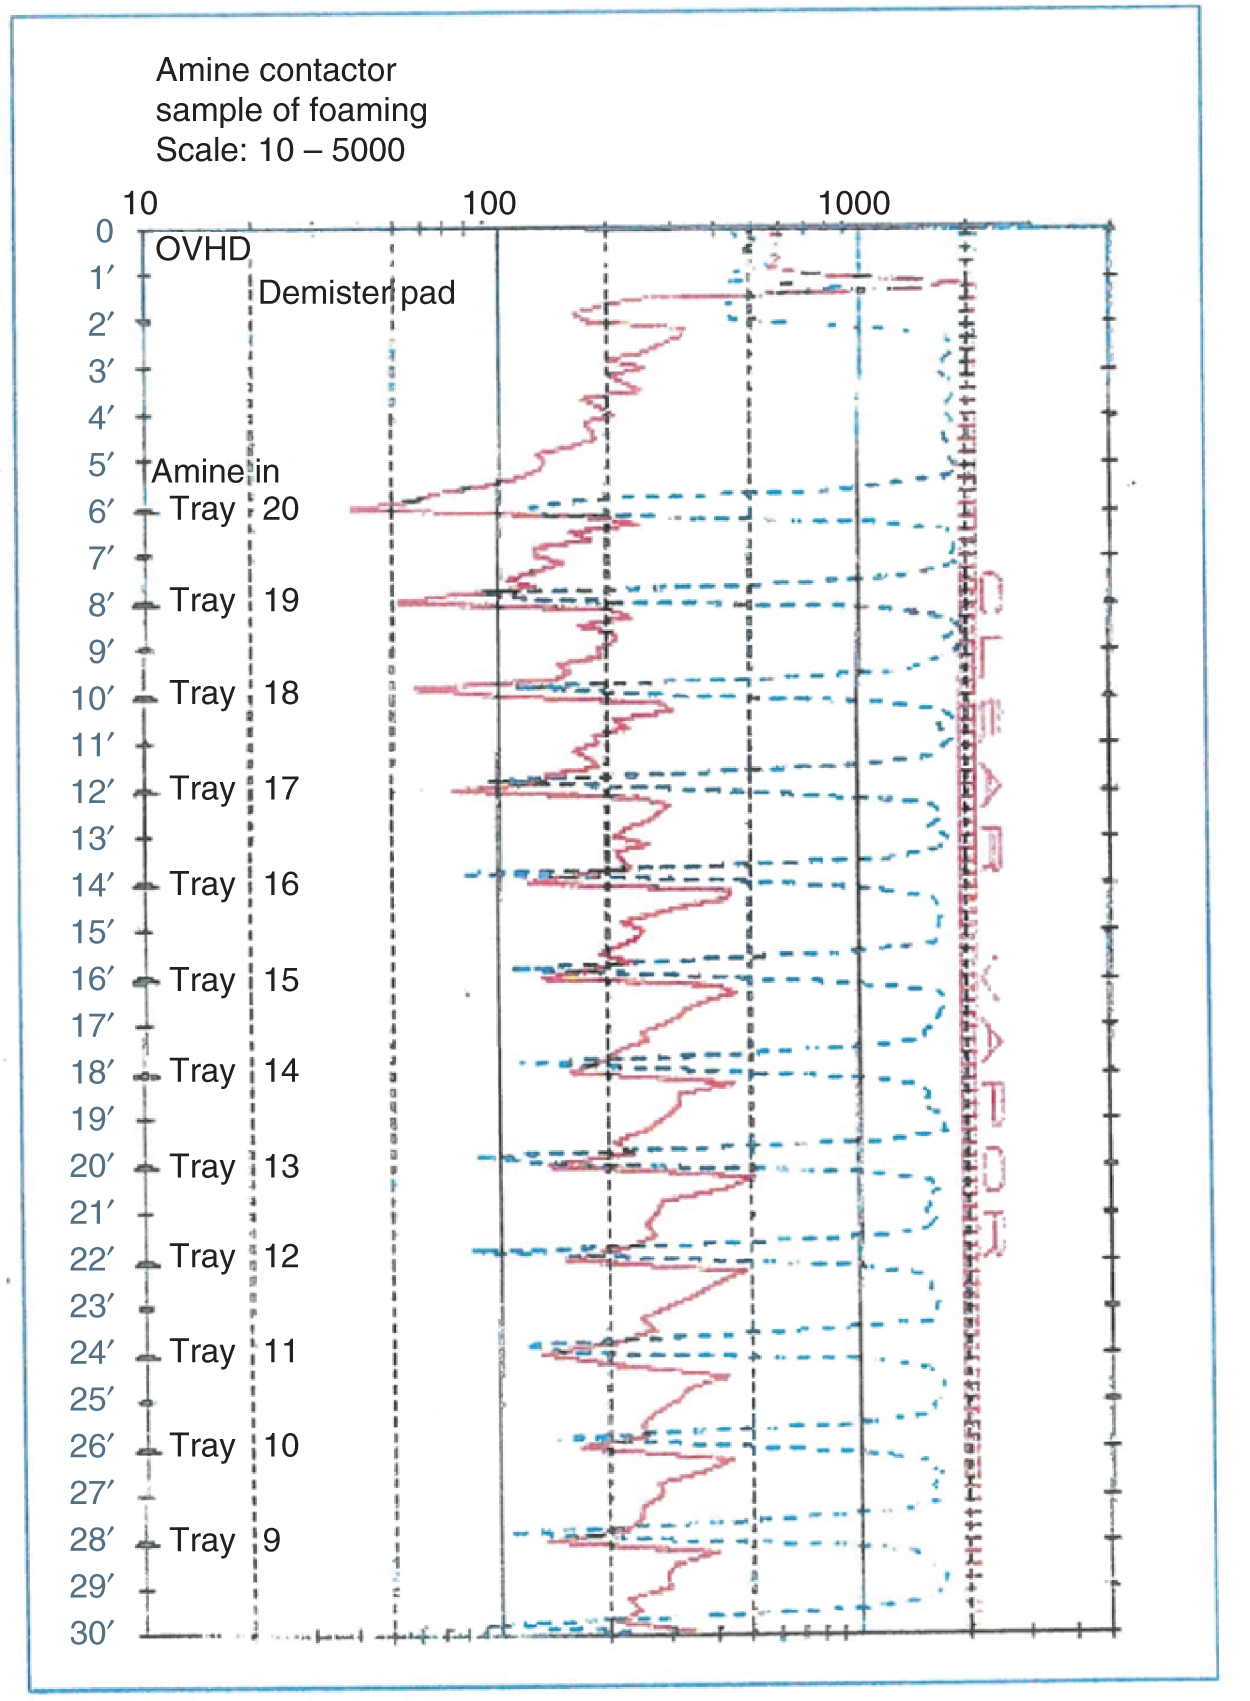
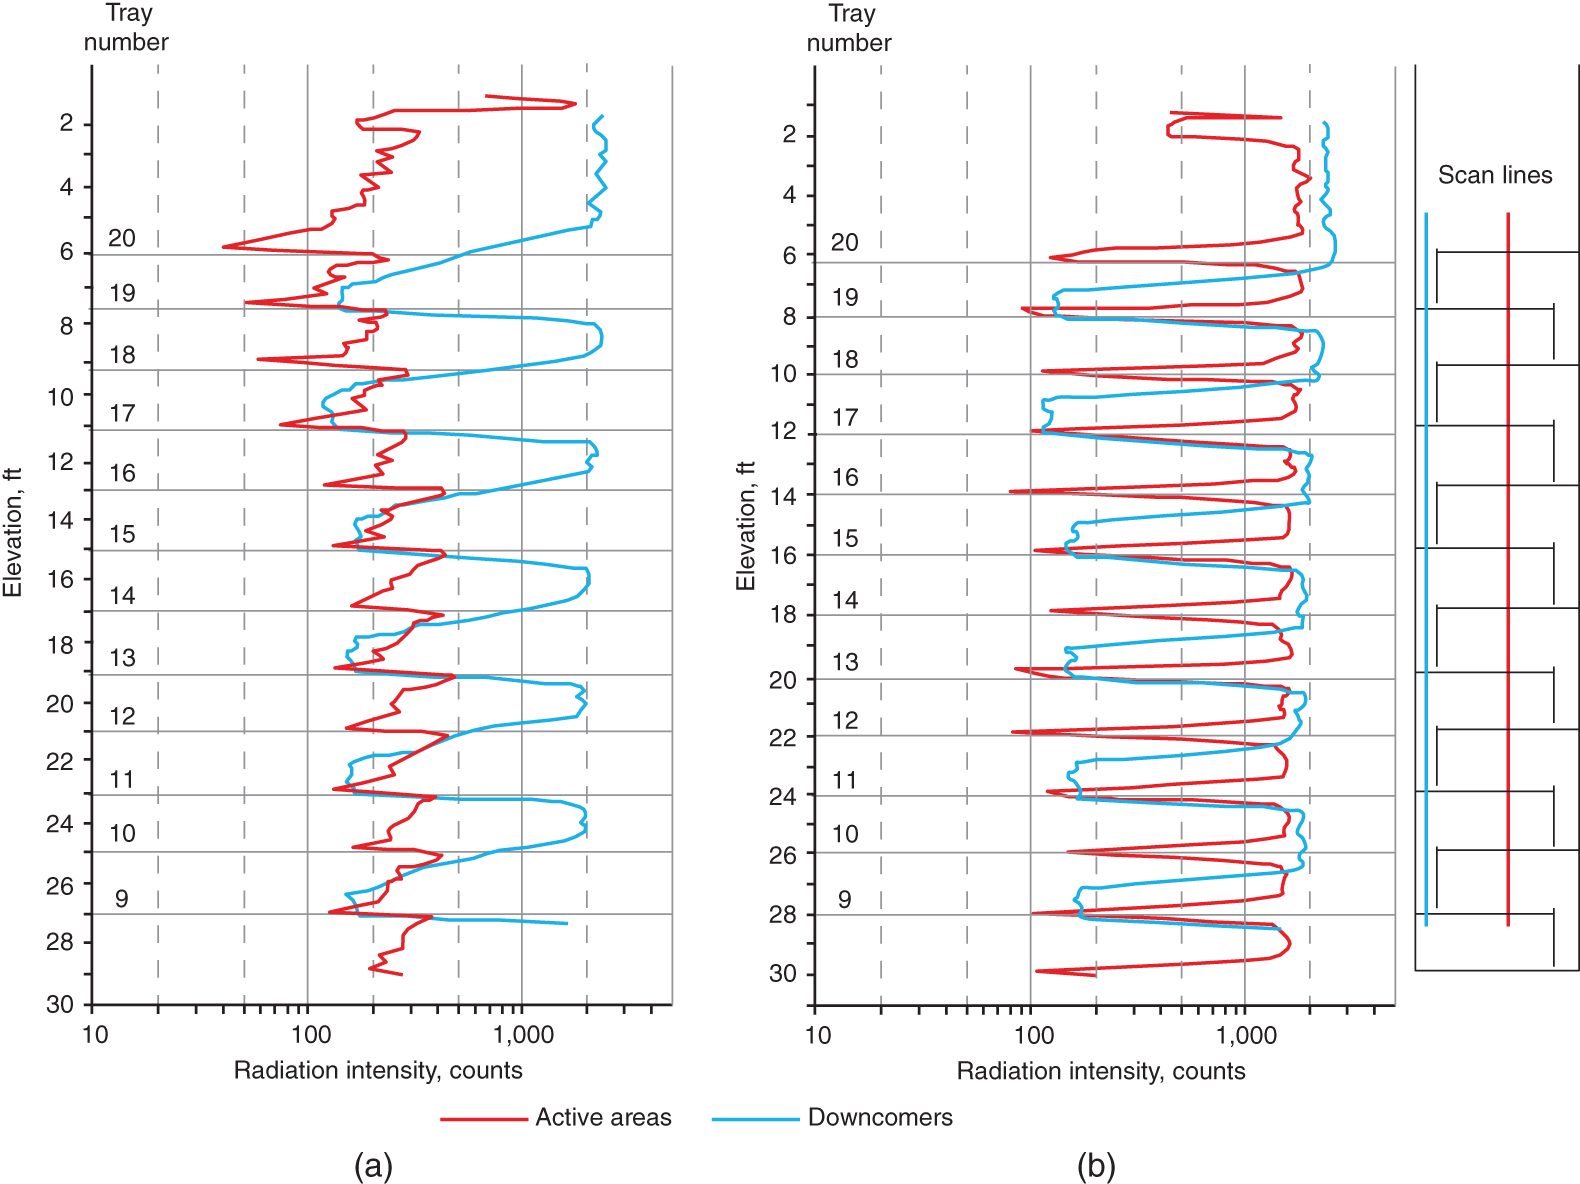
5.5.6 Insights into Fouling Patterns/Shortcuts Lead to Misinterpretations
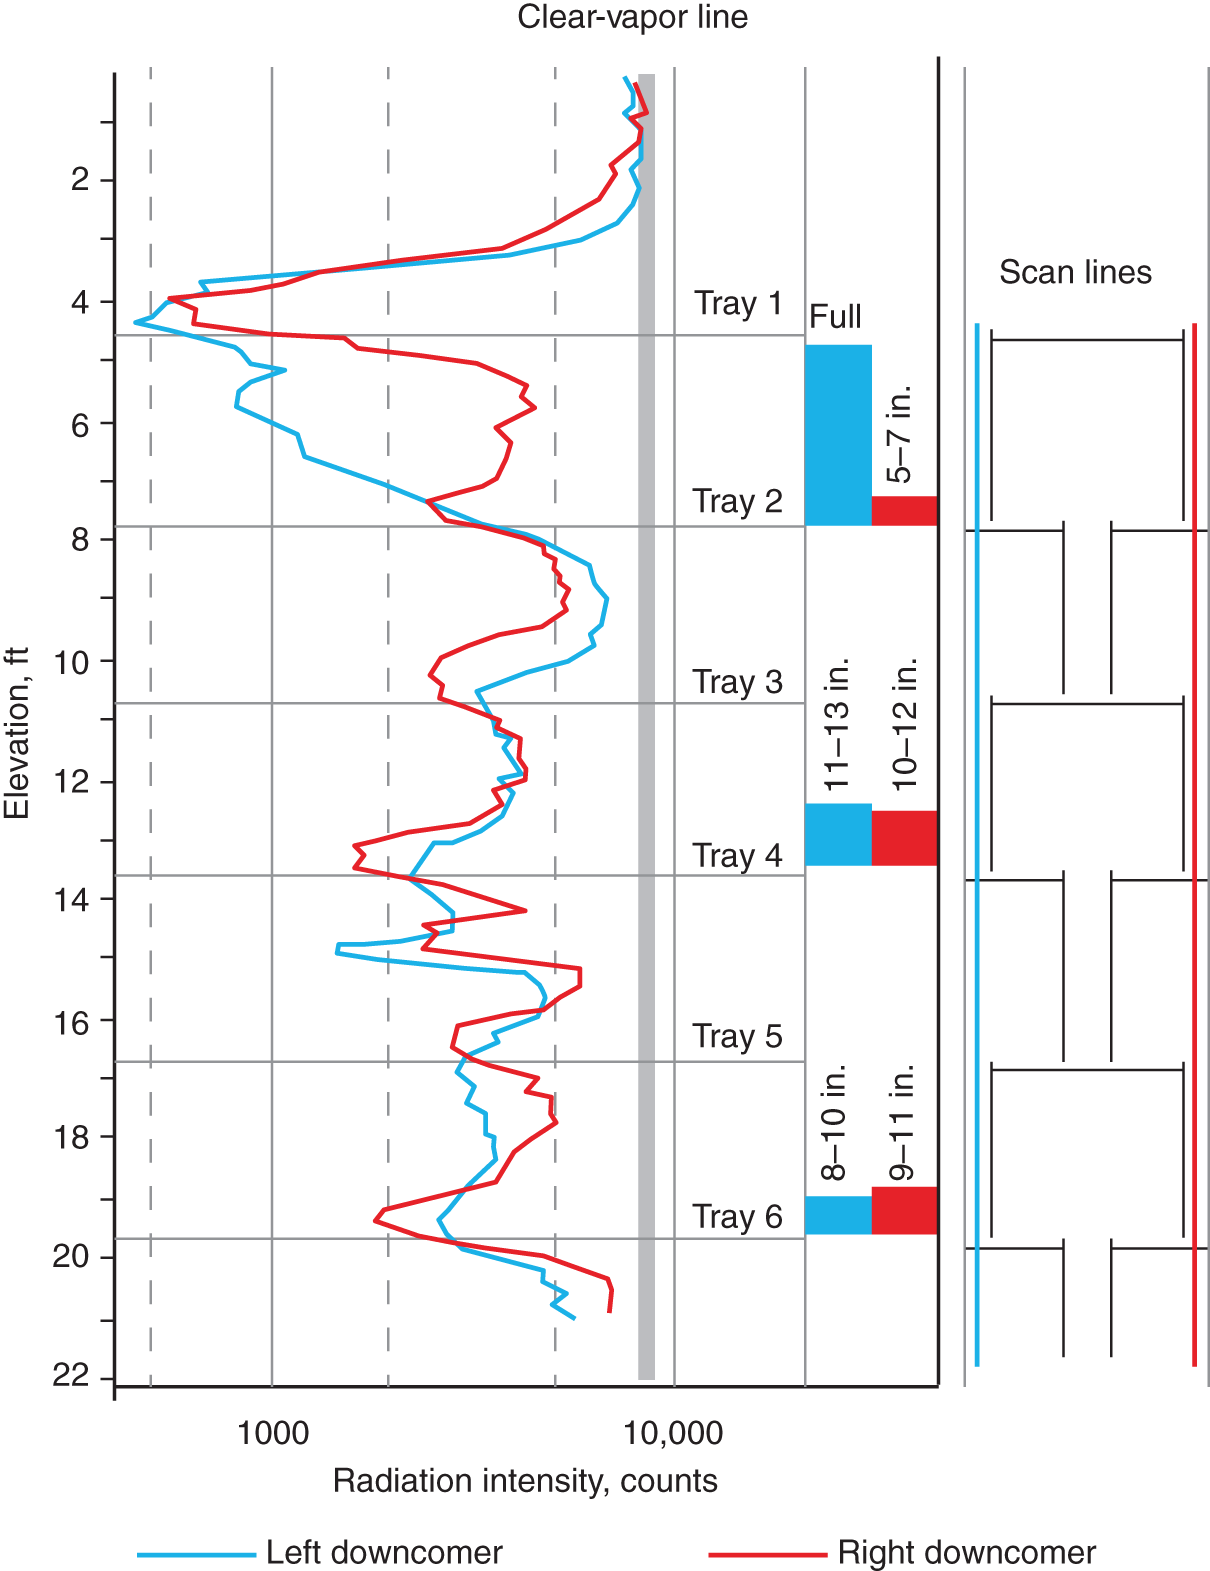
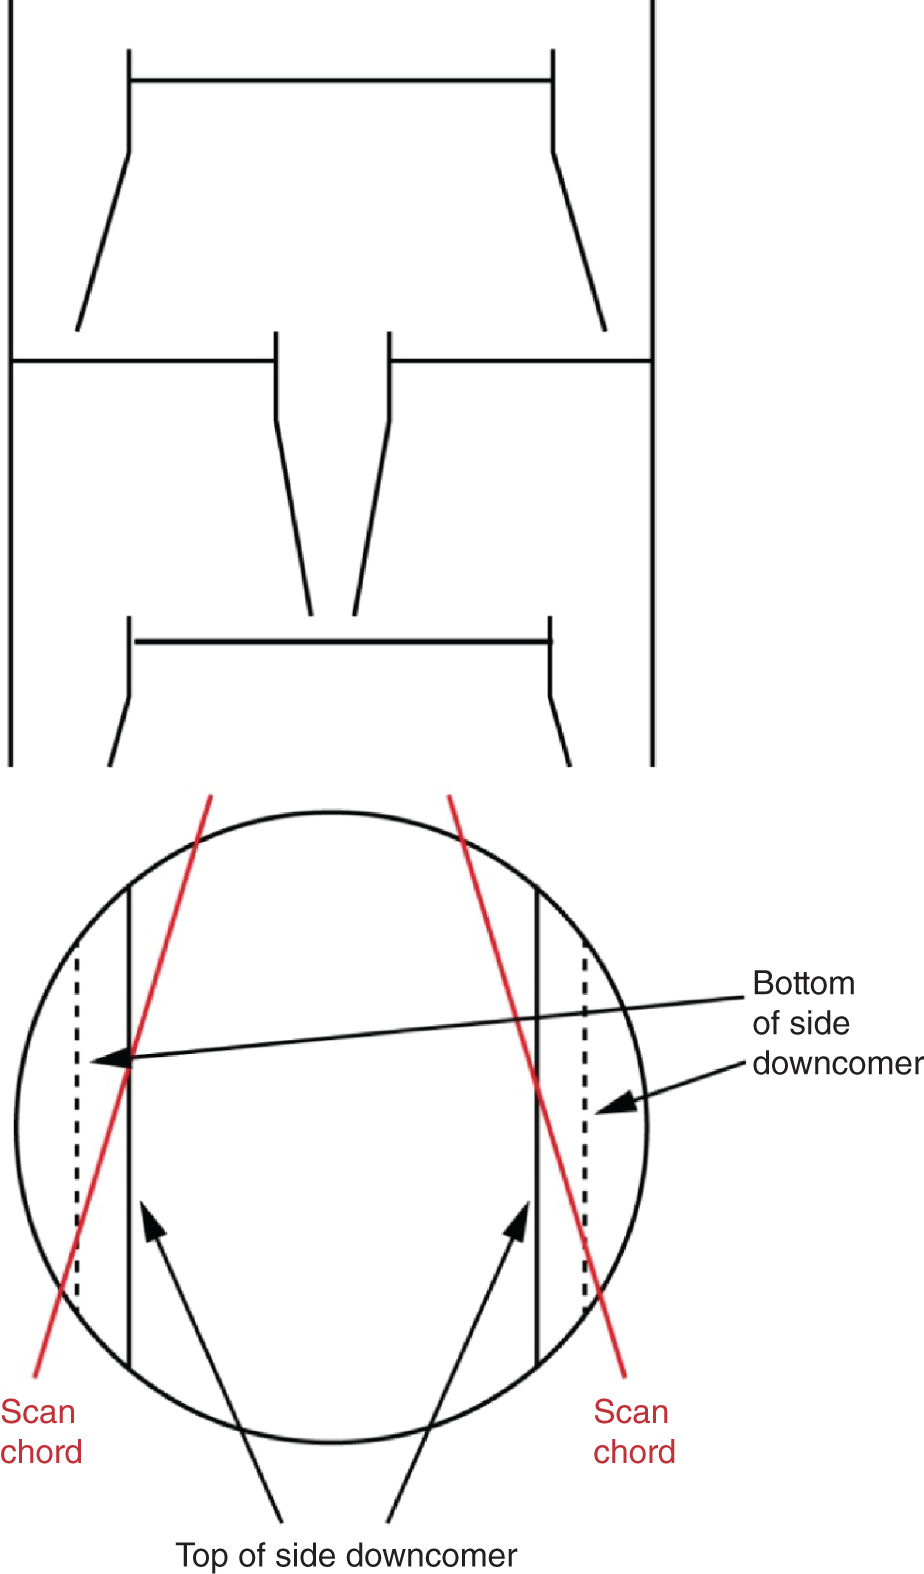
5.5.7 Multipass Trays Maldistribution
5.5.8 Fouling-Induced Maldistribution in 2-Pass Trays (180)
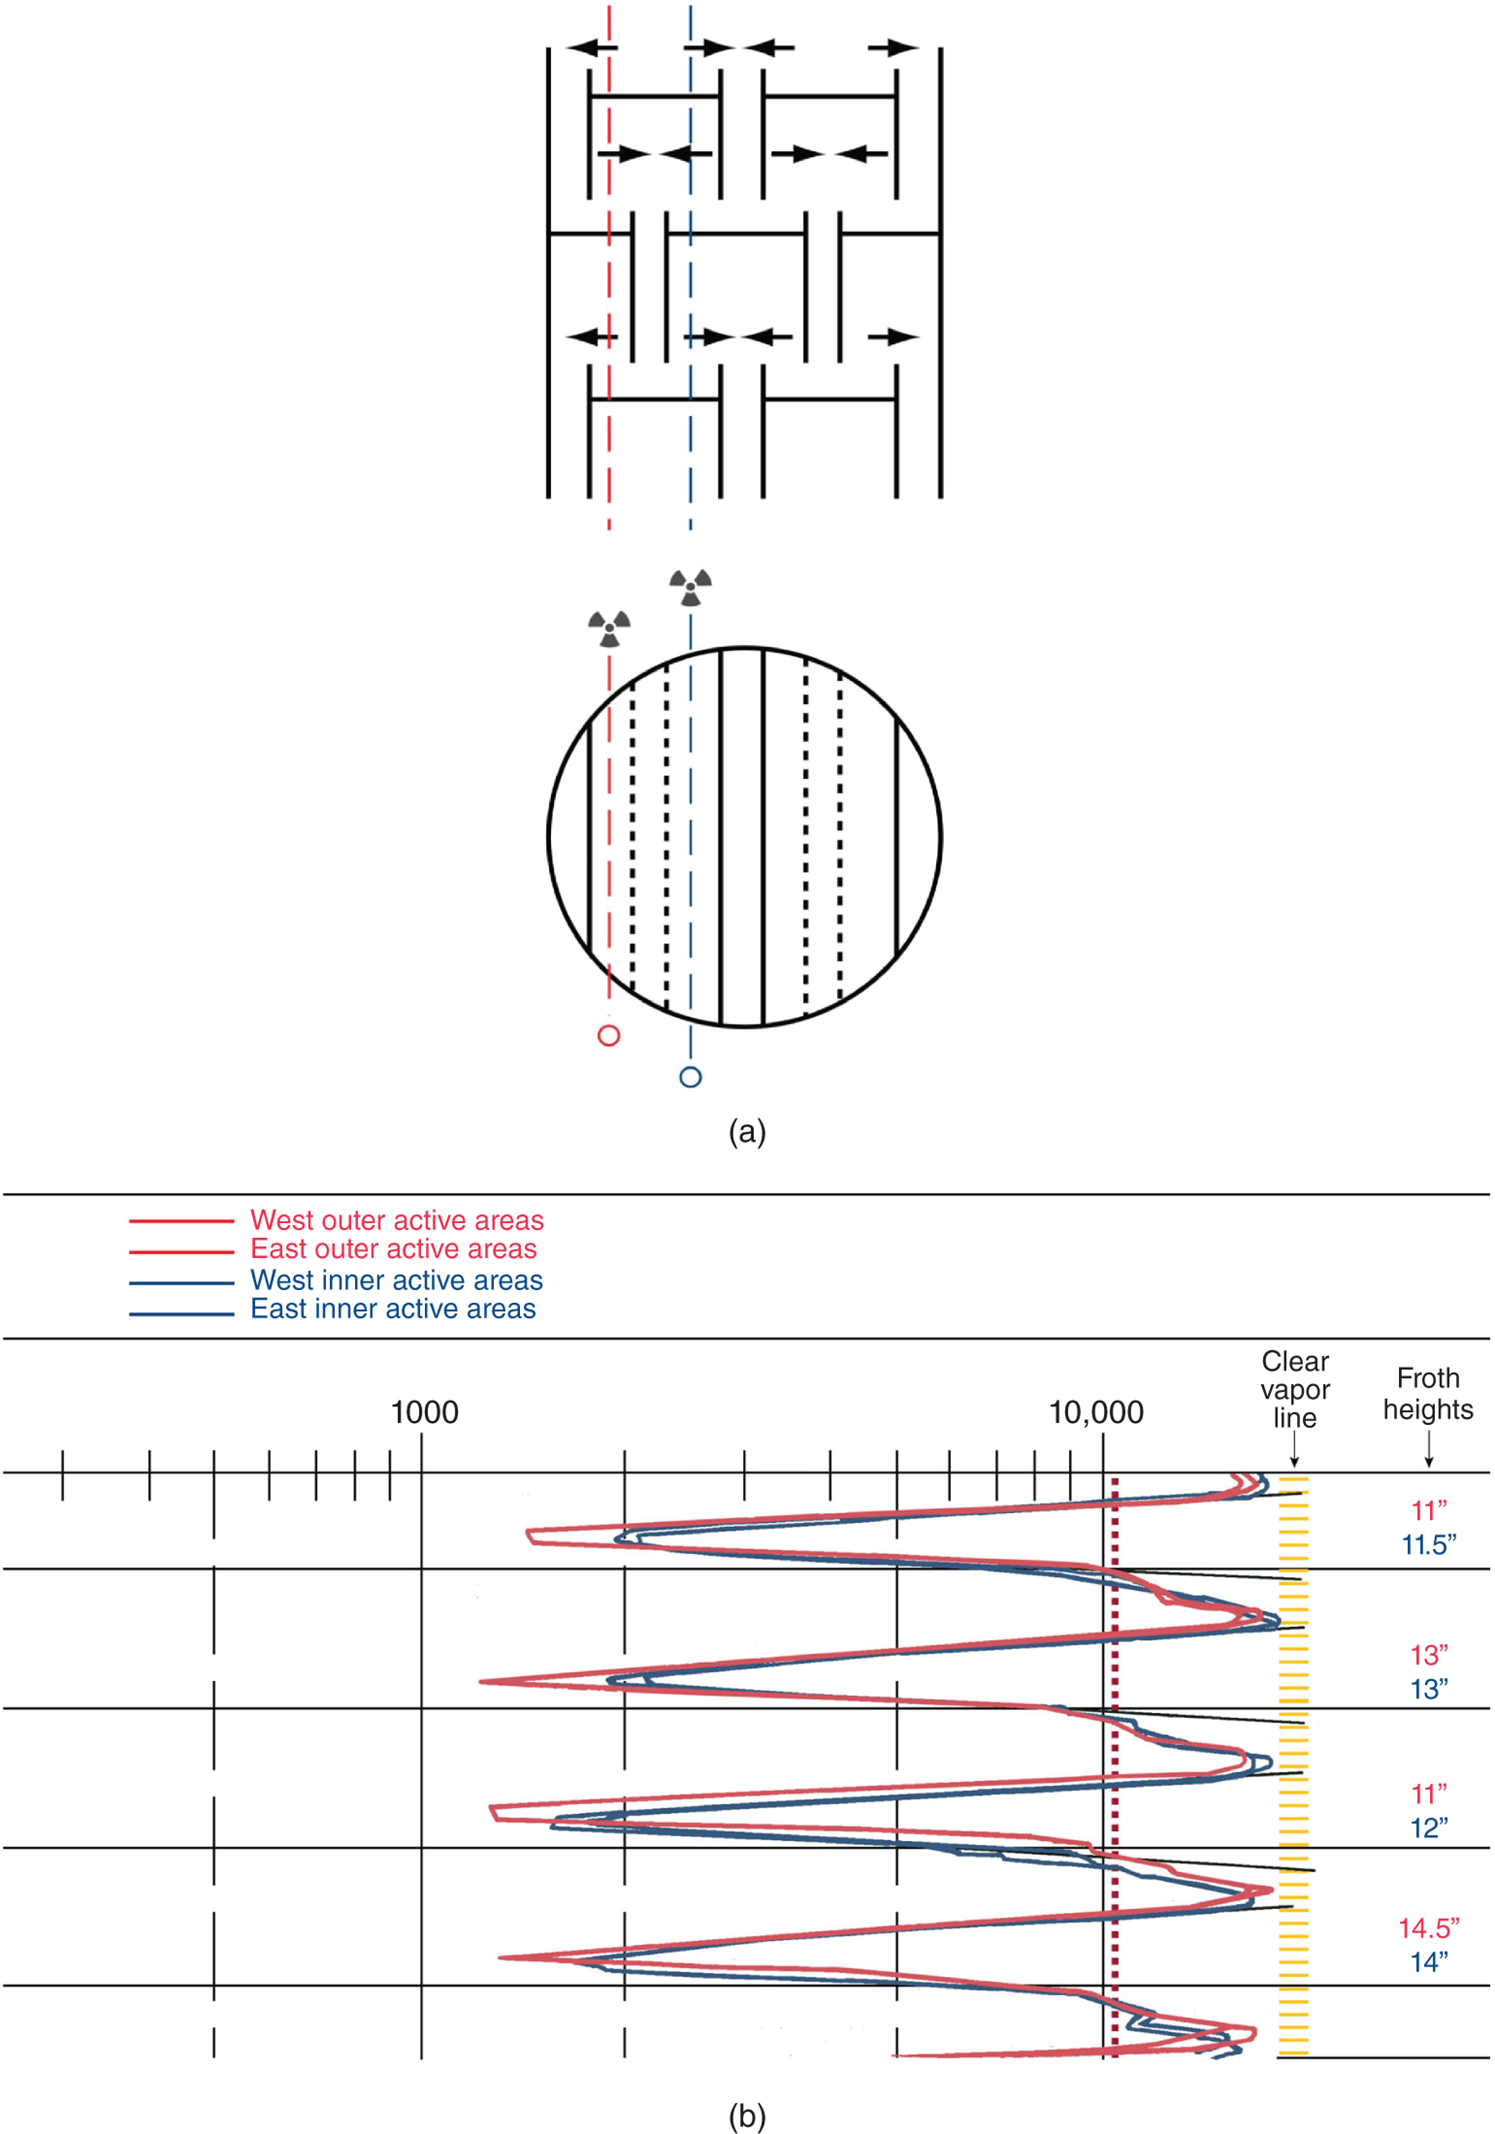
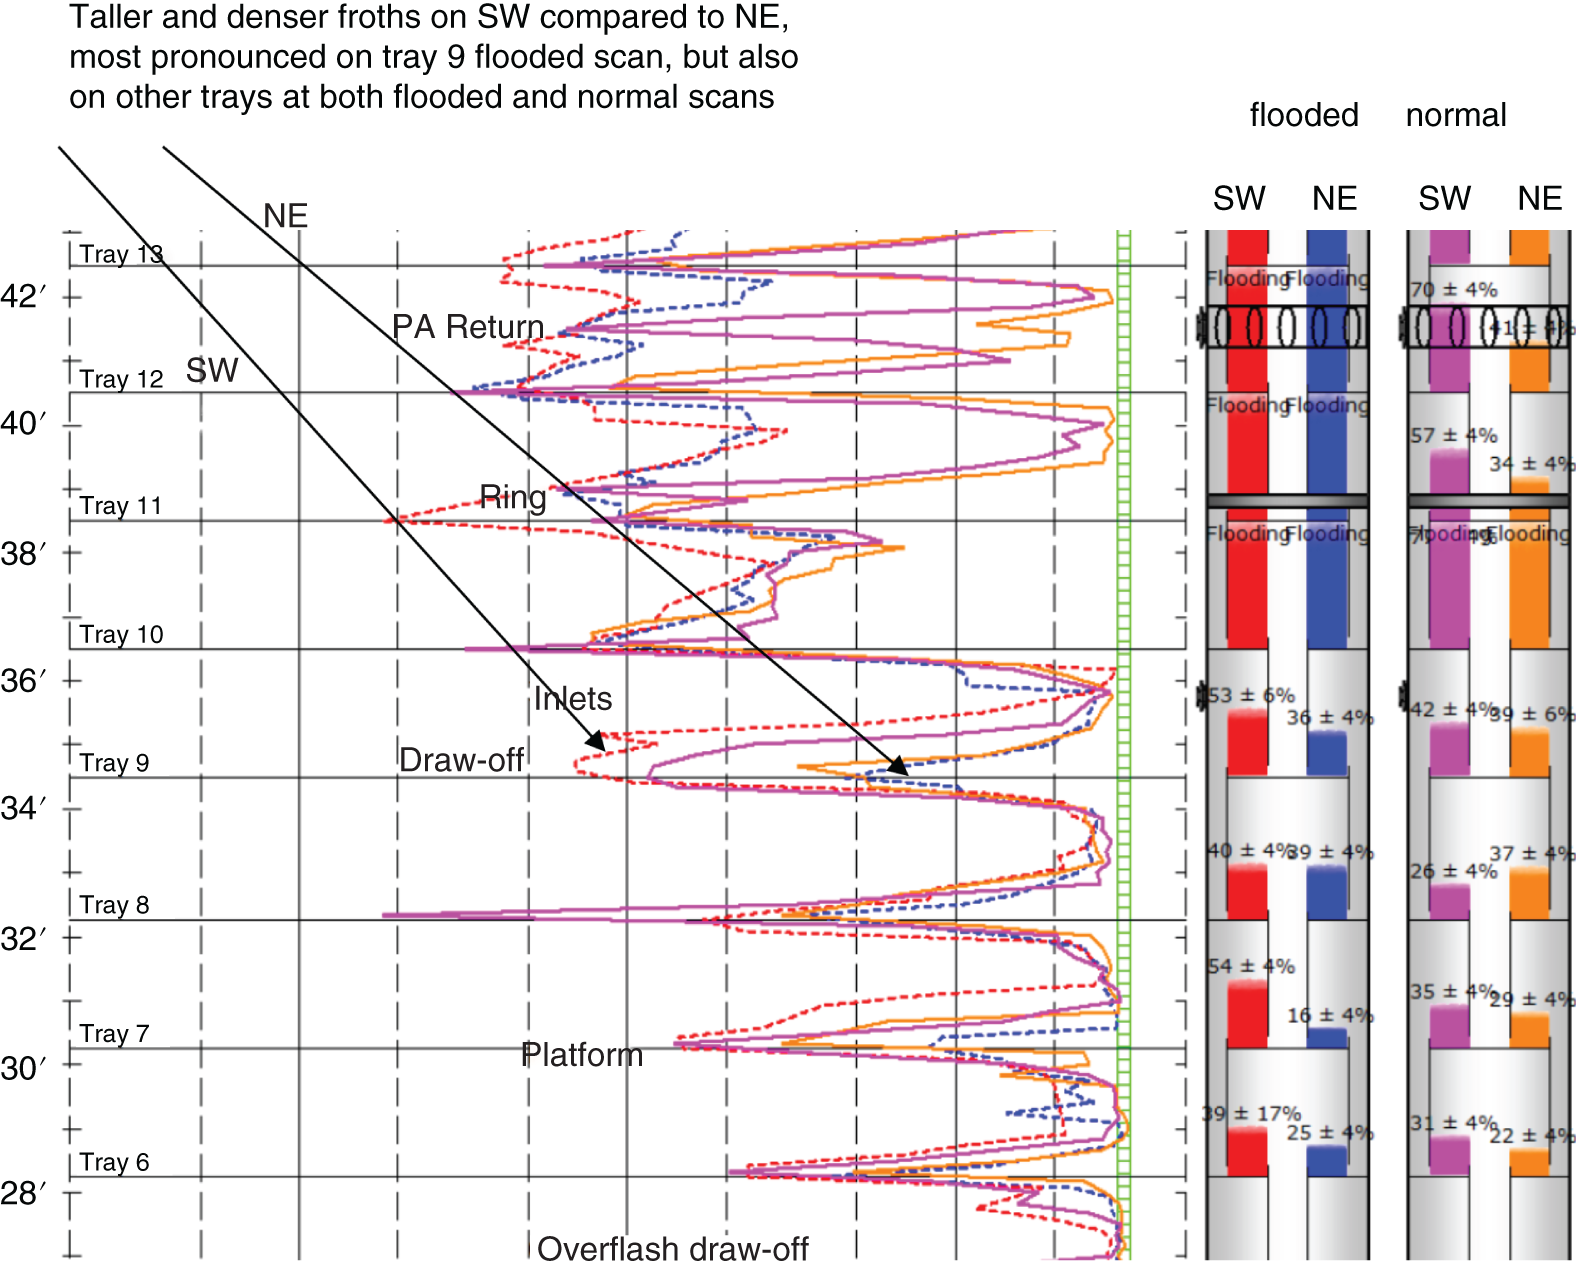
5.5.9 Weeping/Dense Liquid/Missing Trays
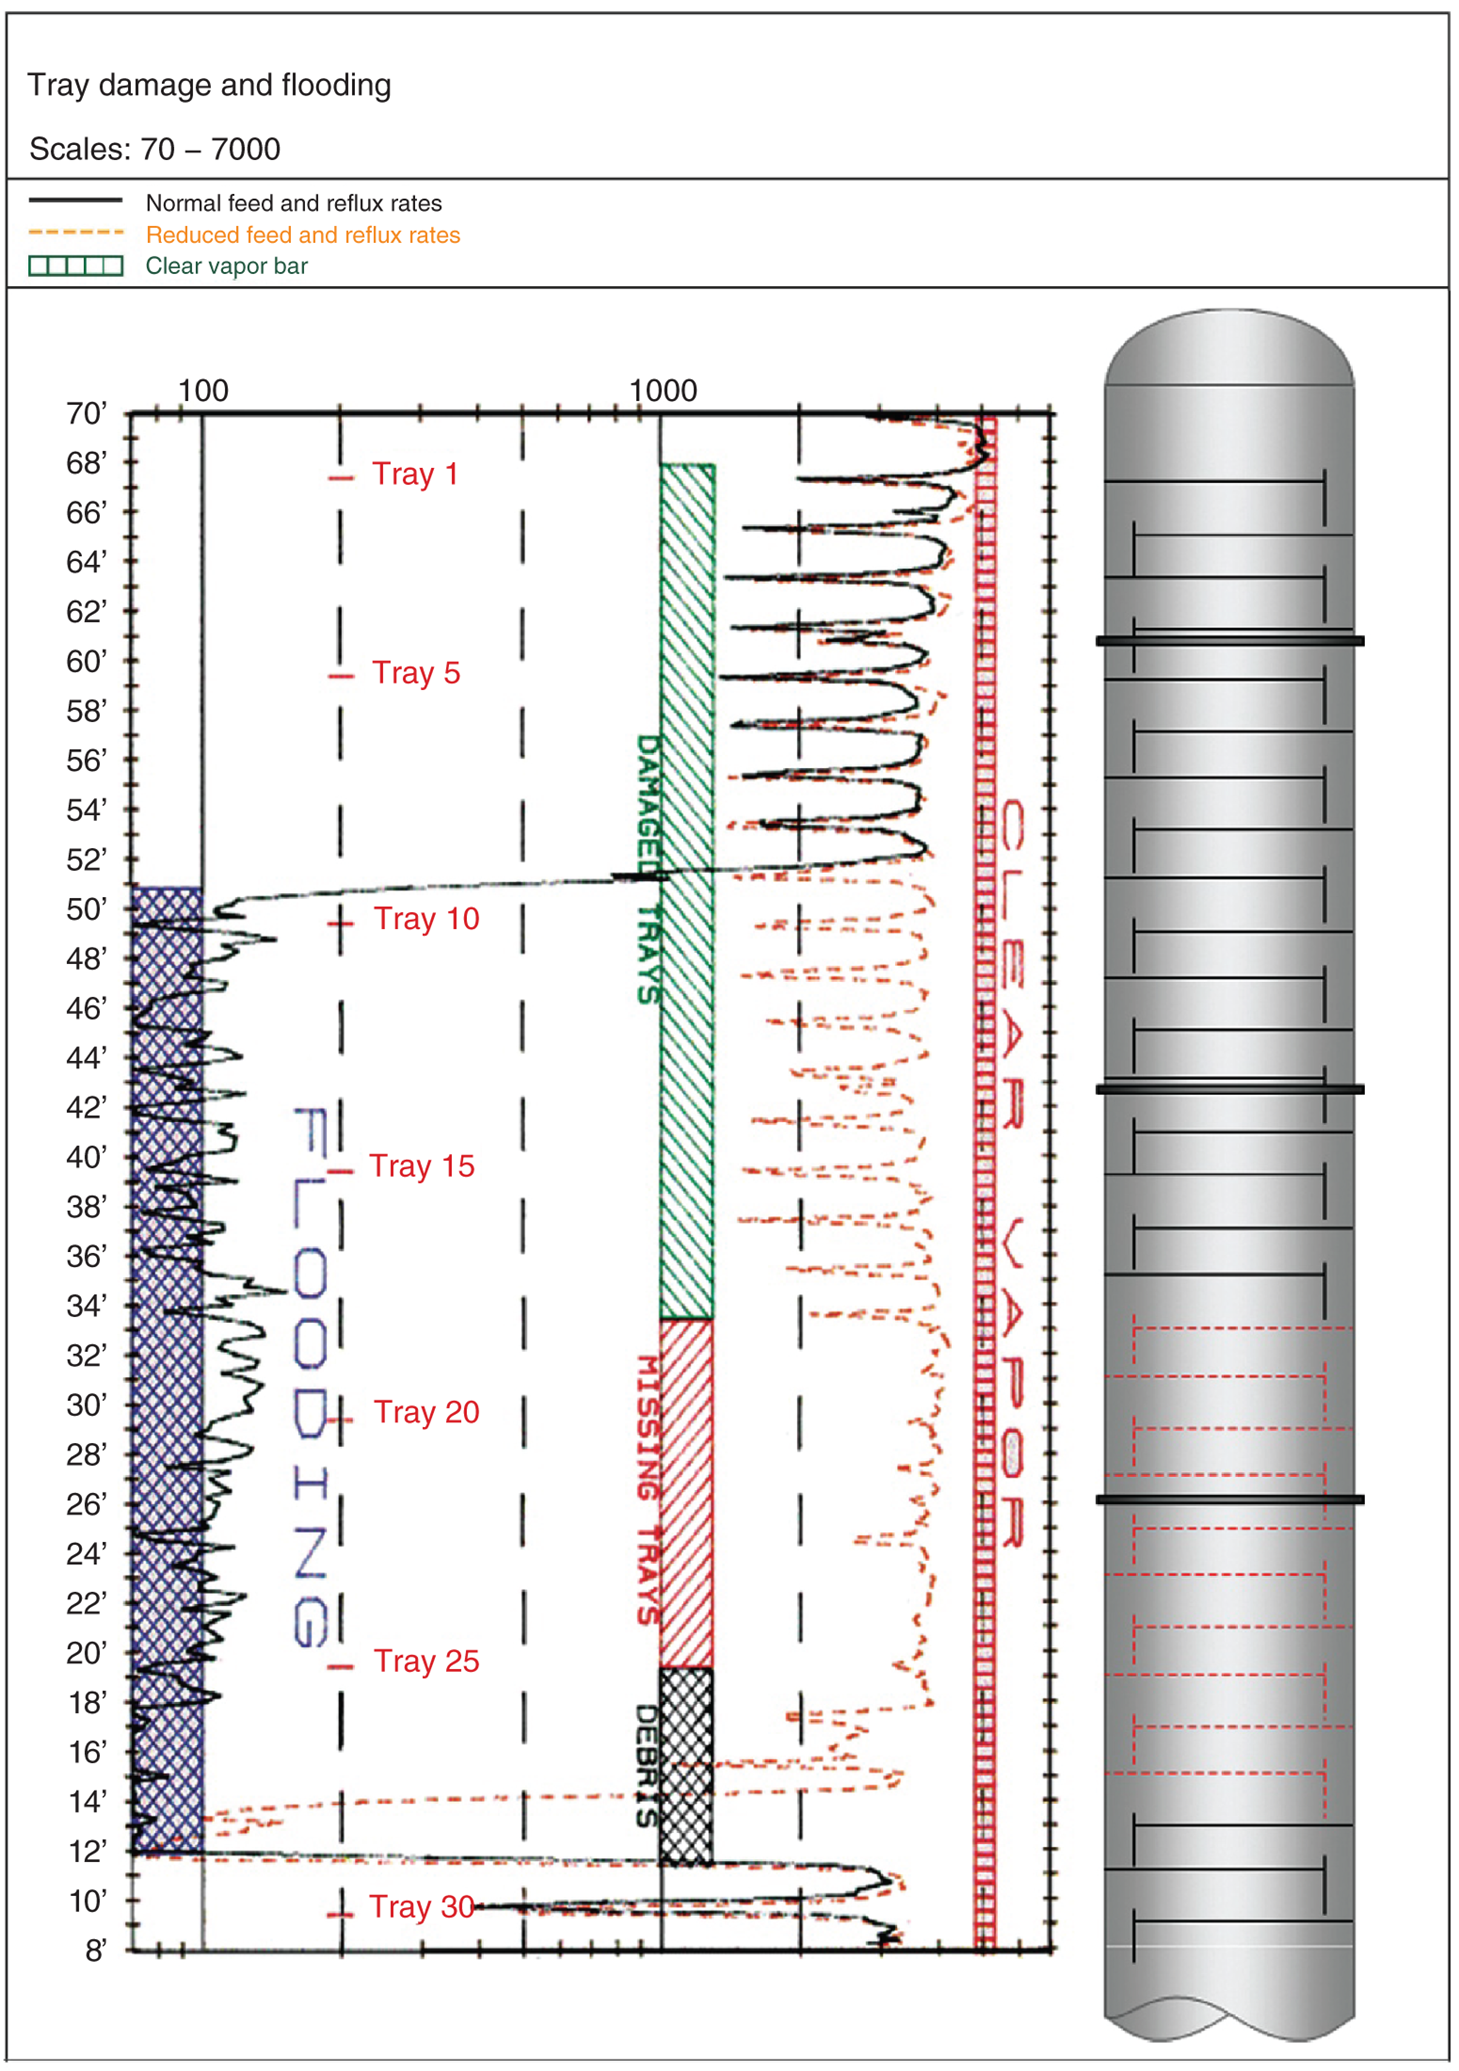
5.5.10 Plugging, Flood, and Fouling Monitoring in a Packed Bed (90, 372)
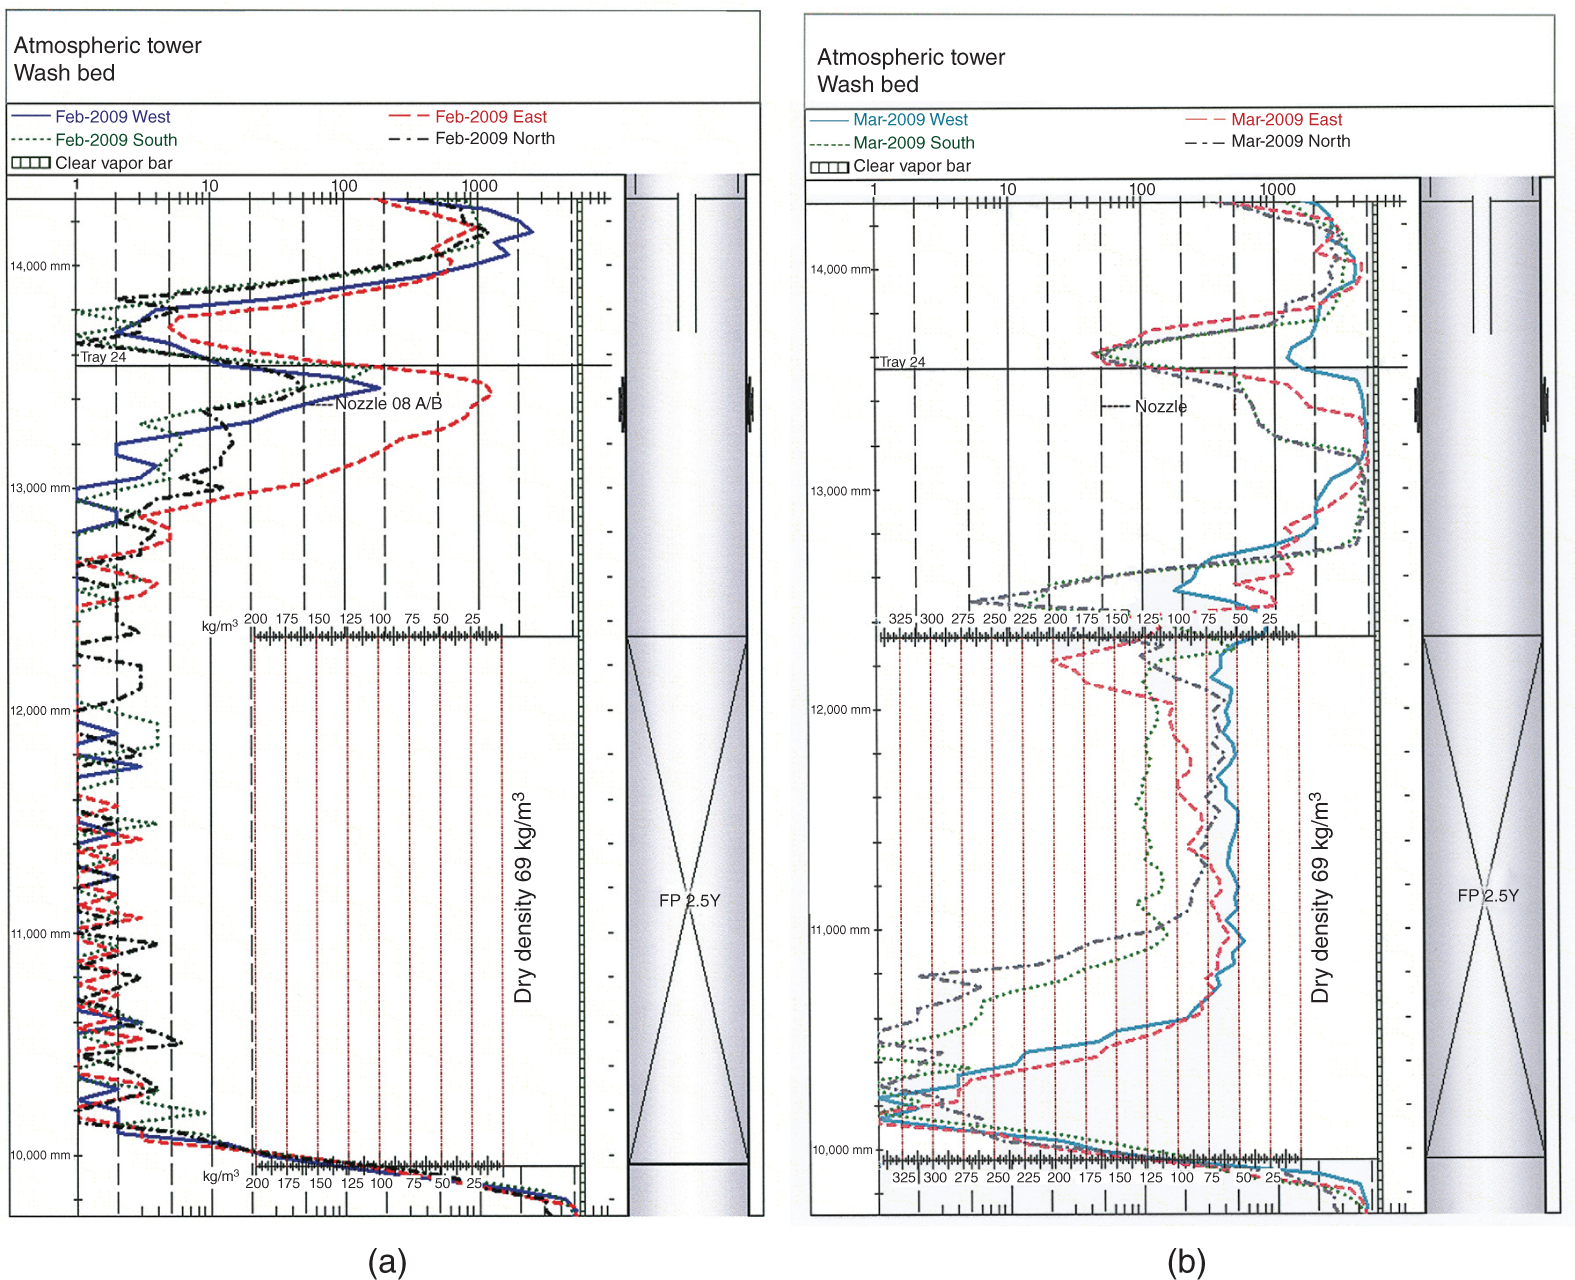
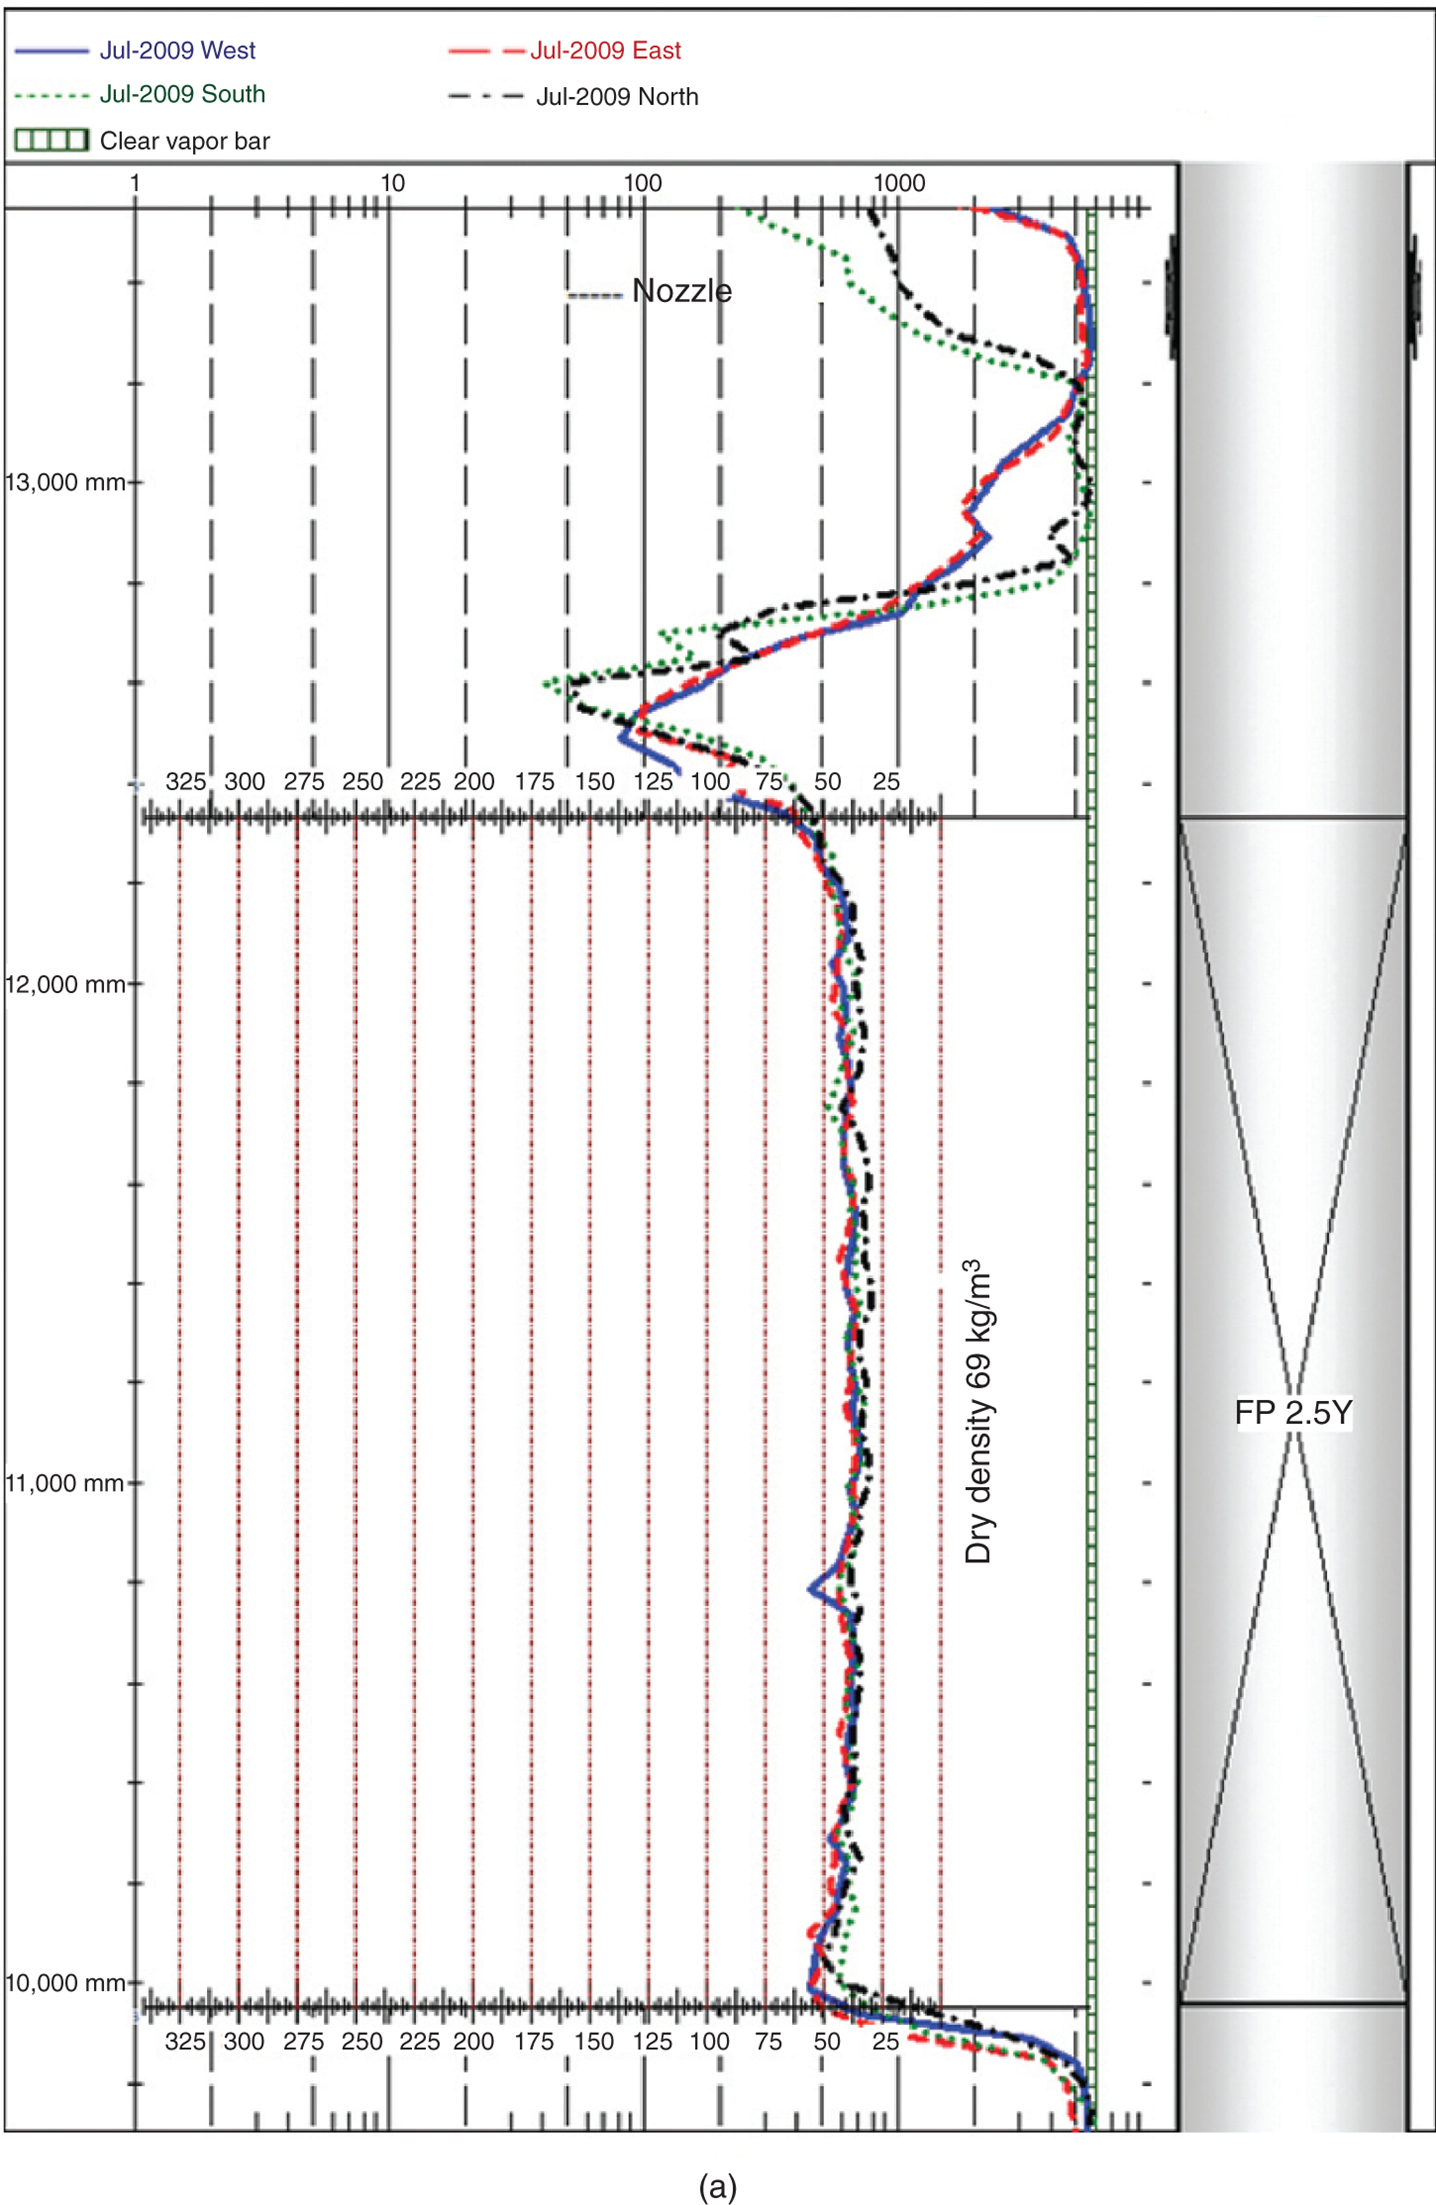
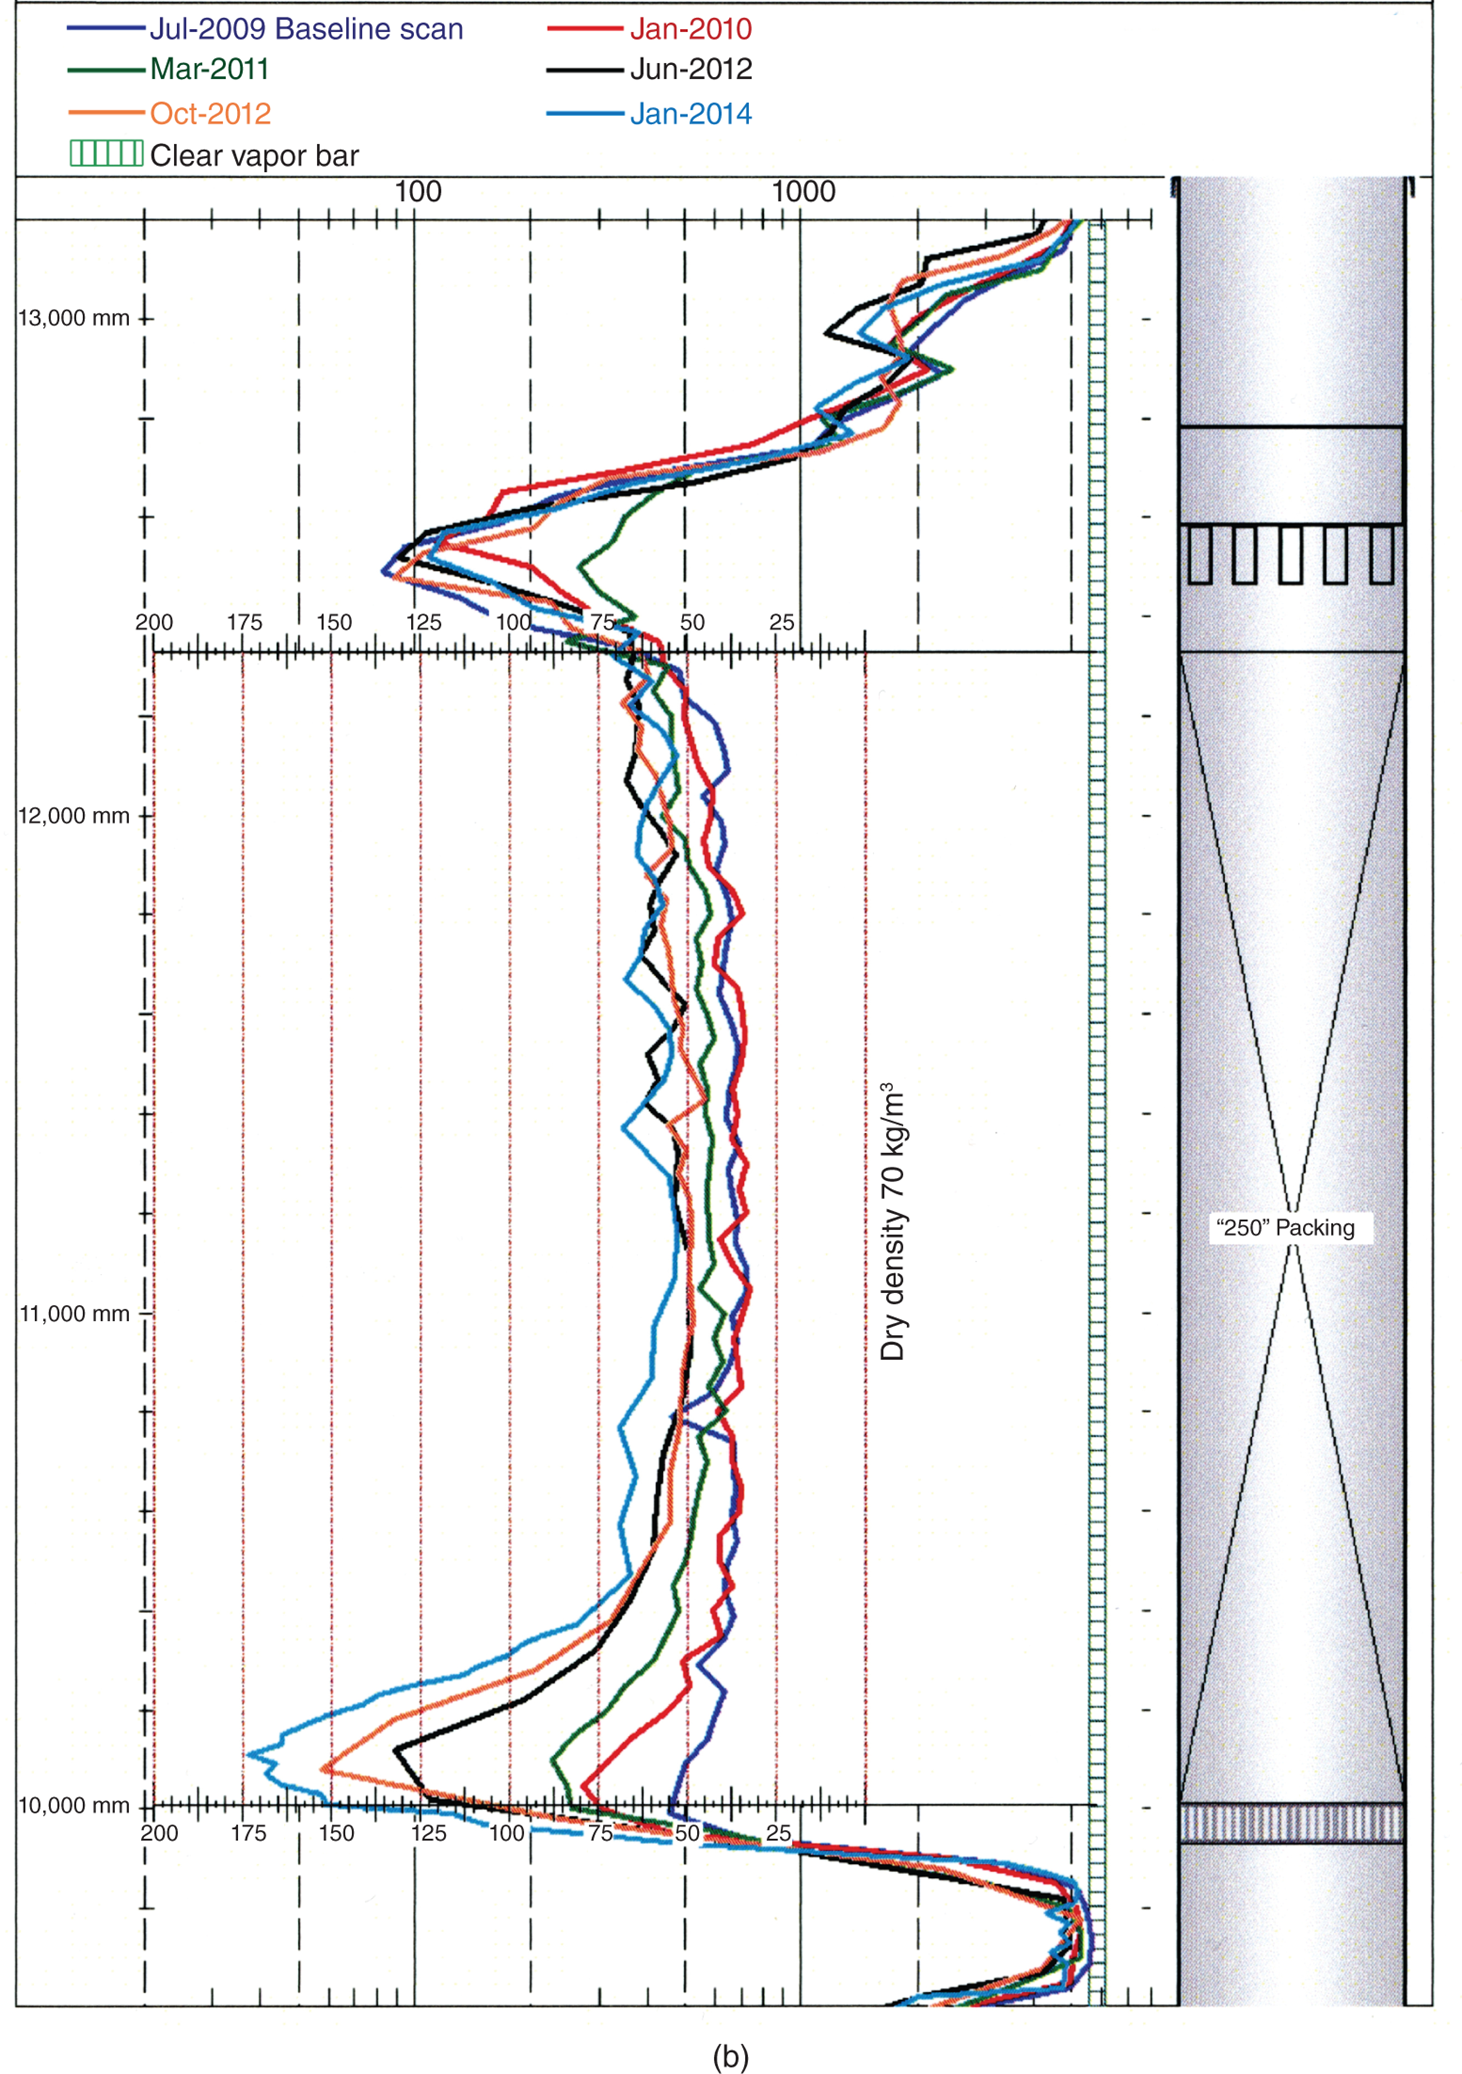
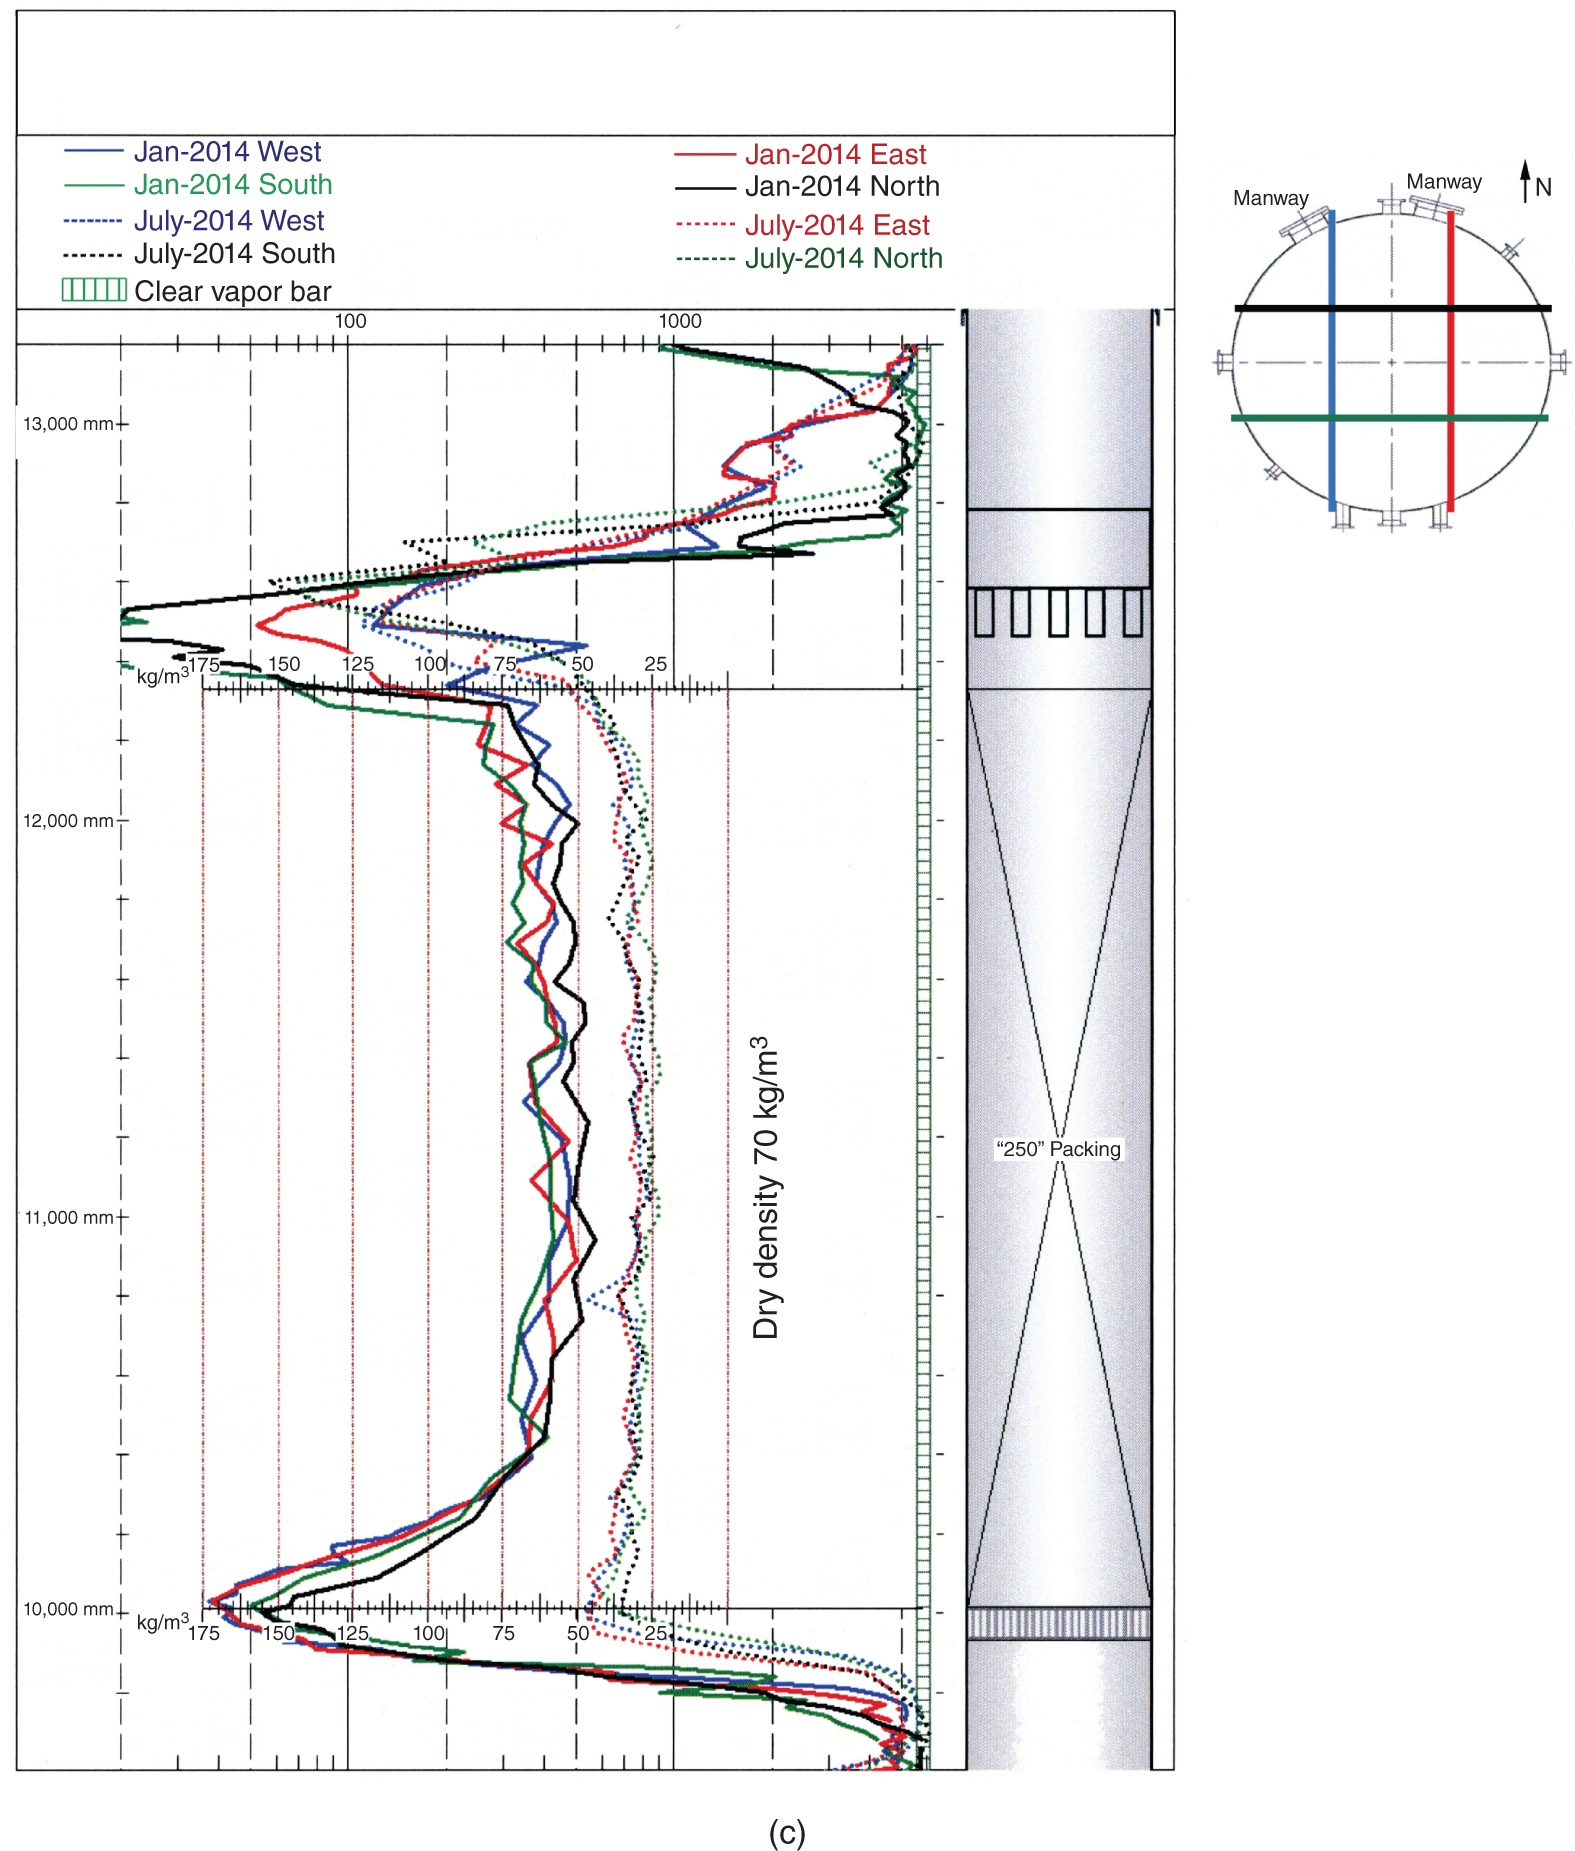
5.5.11 More Plugging and Flooding in a Packed Bed (485)
5.5.12 Flood due to Crushed or Damaged Random Packings (509)
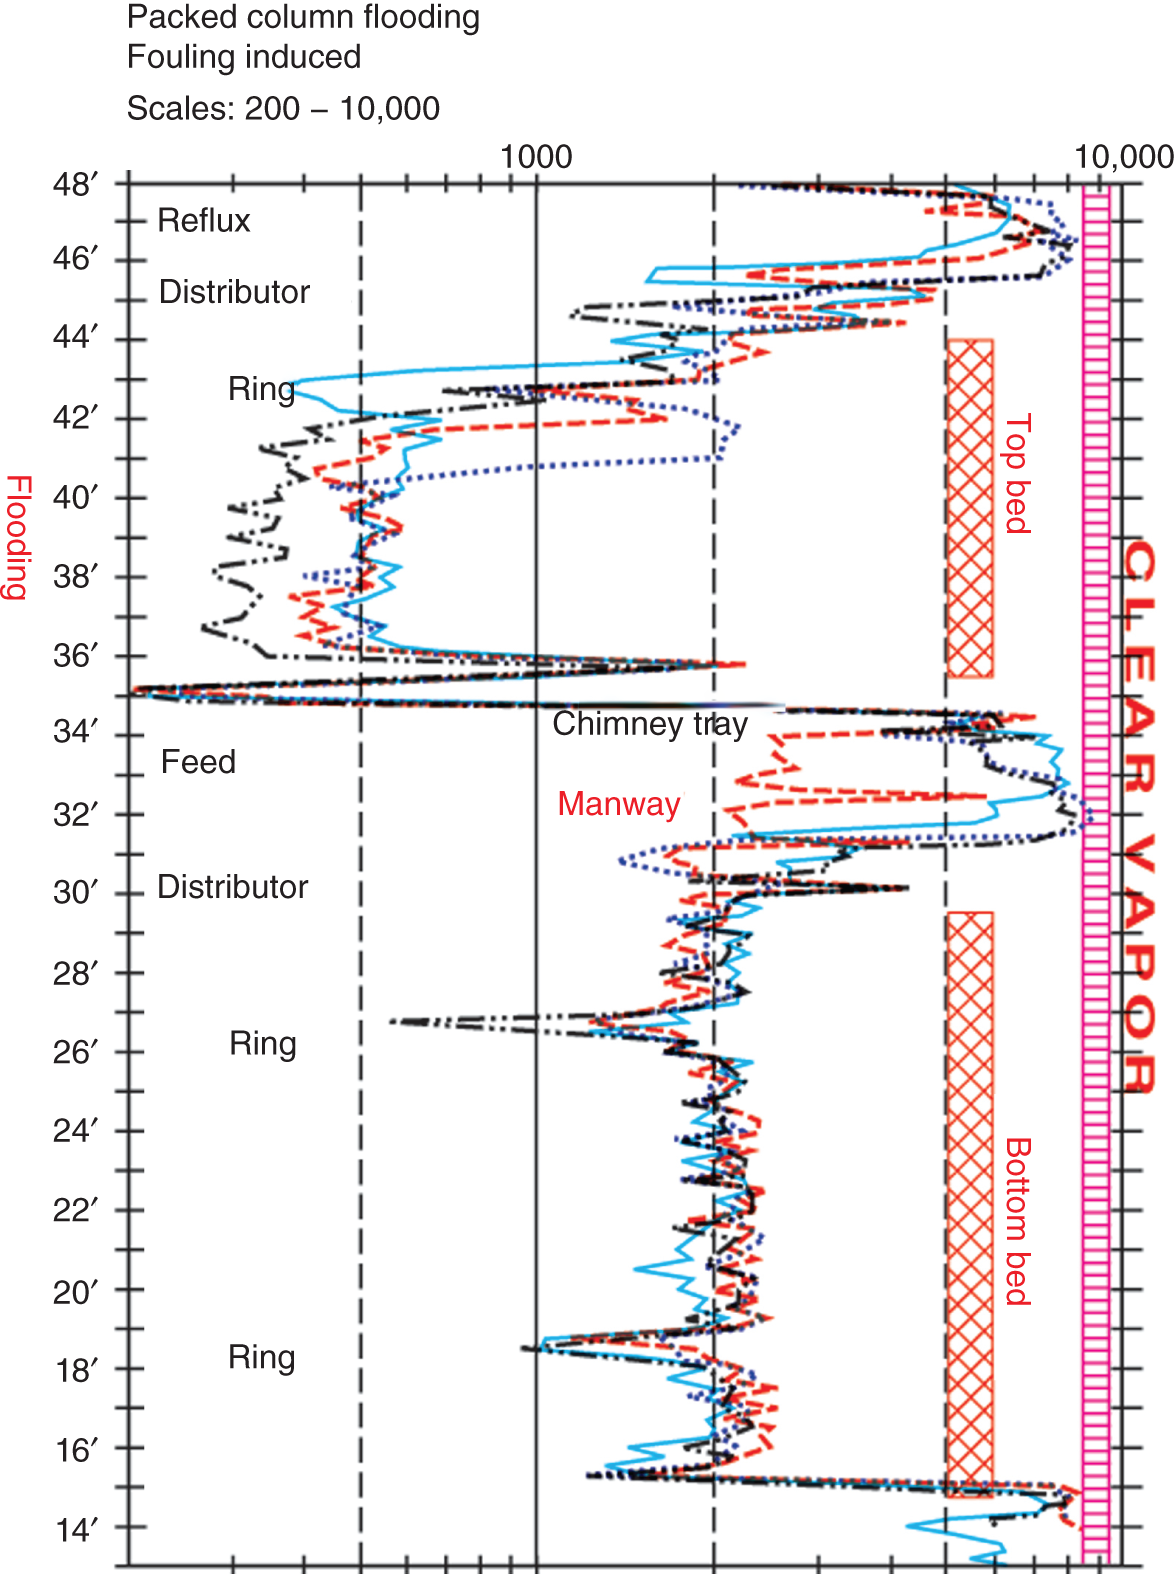
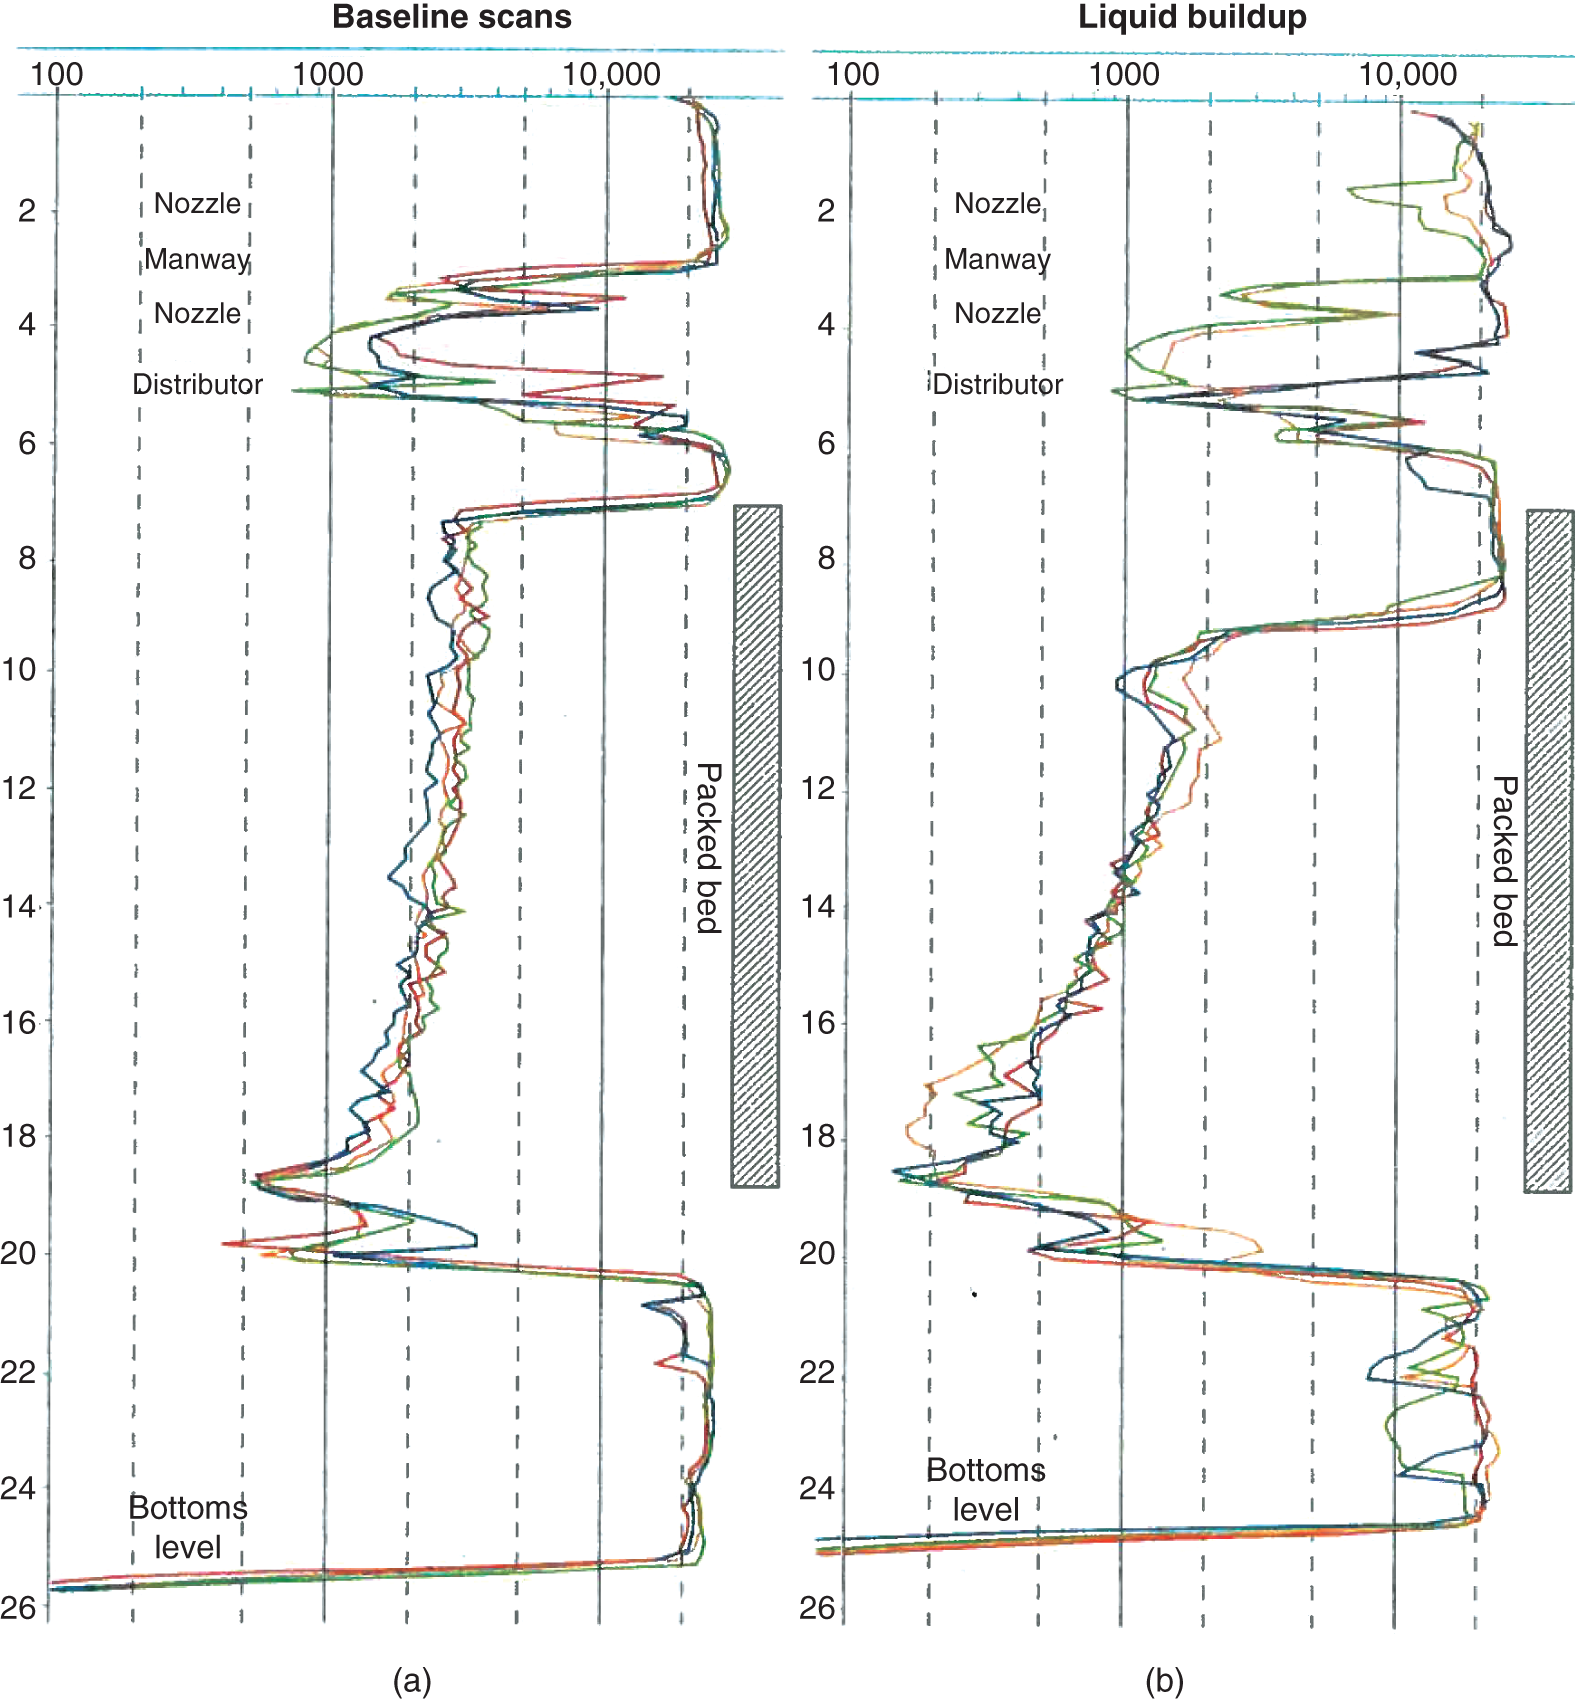
5.5.13 Missing Random Packings (373)
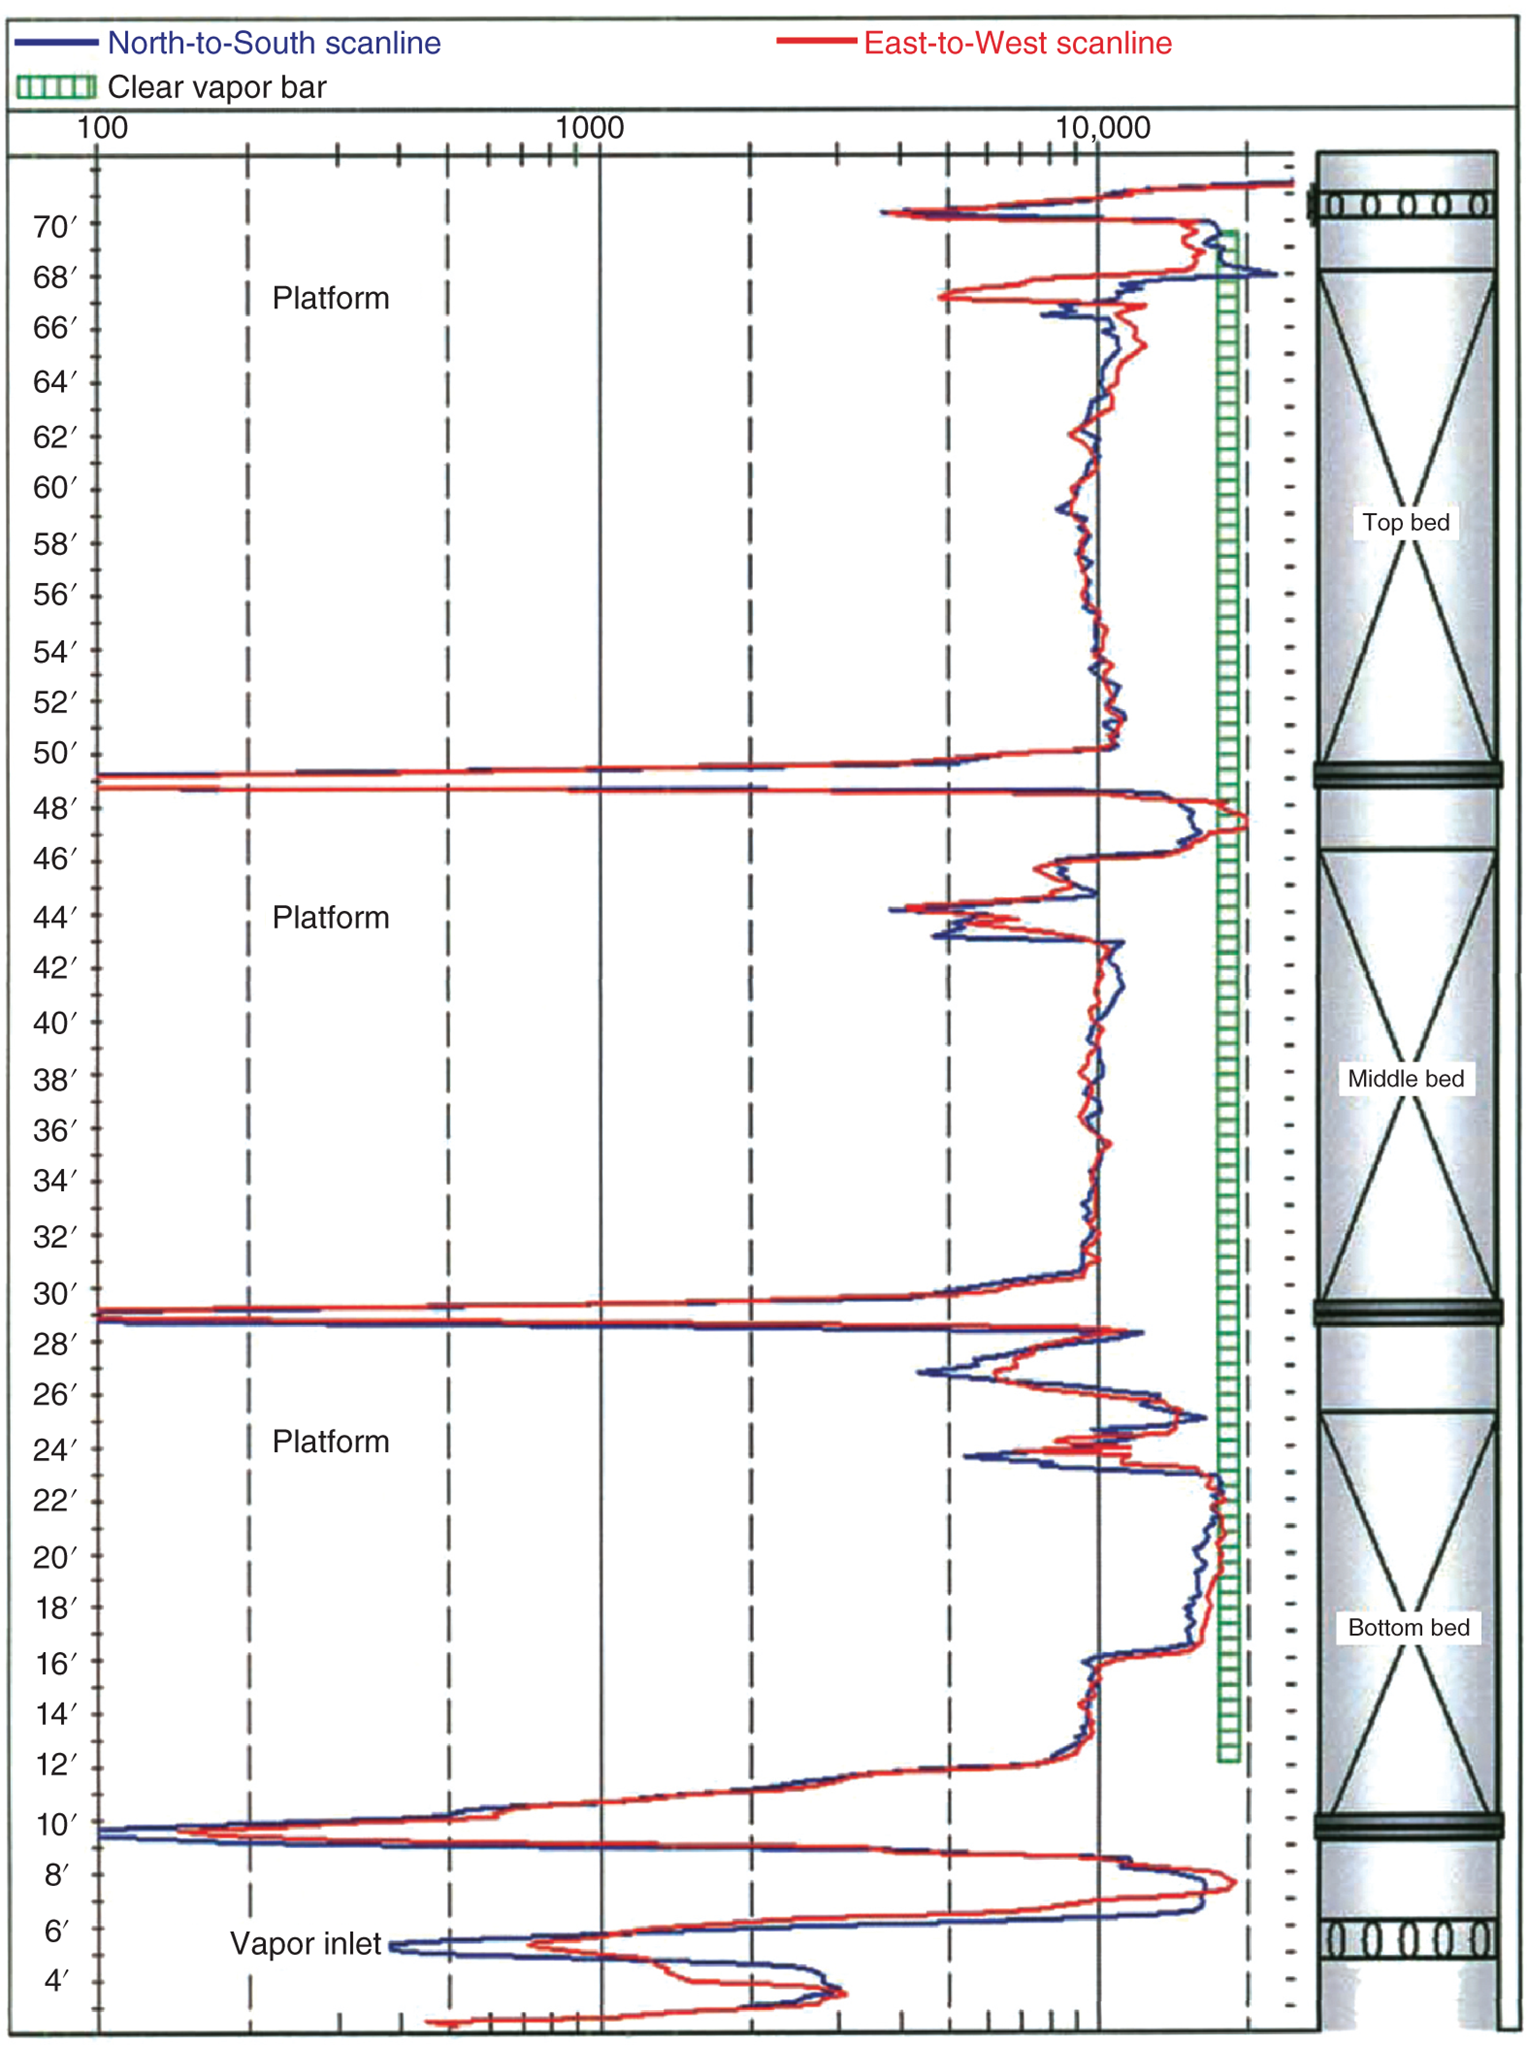
5.5.14 Displaced and Damaged Structured Packings (89)
5.5.15 Flooding Induces Channeling in Deep Vacuum Packed Tower (232)
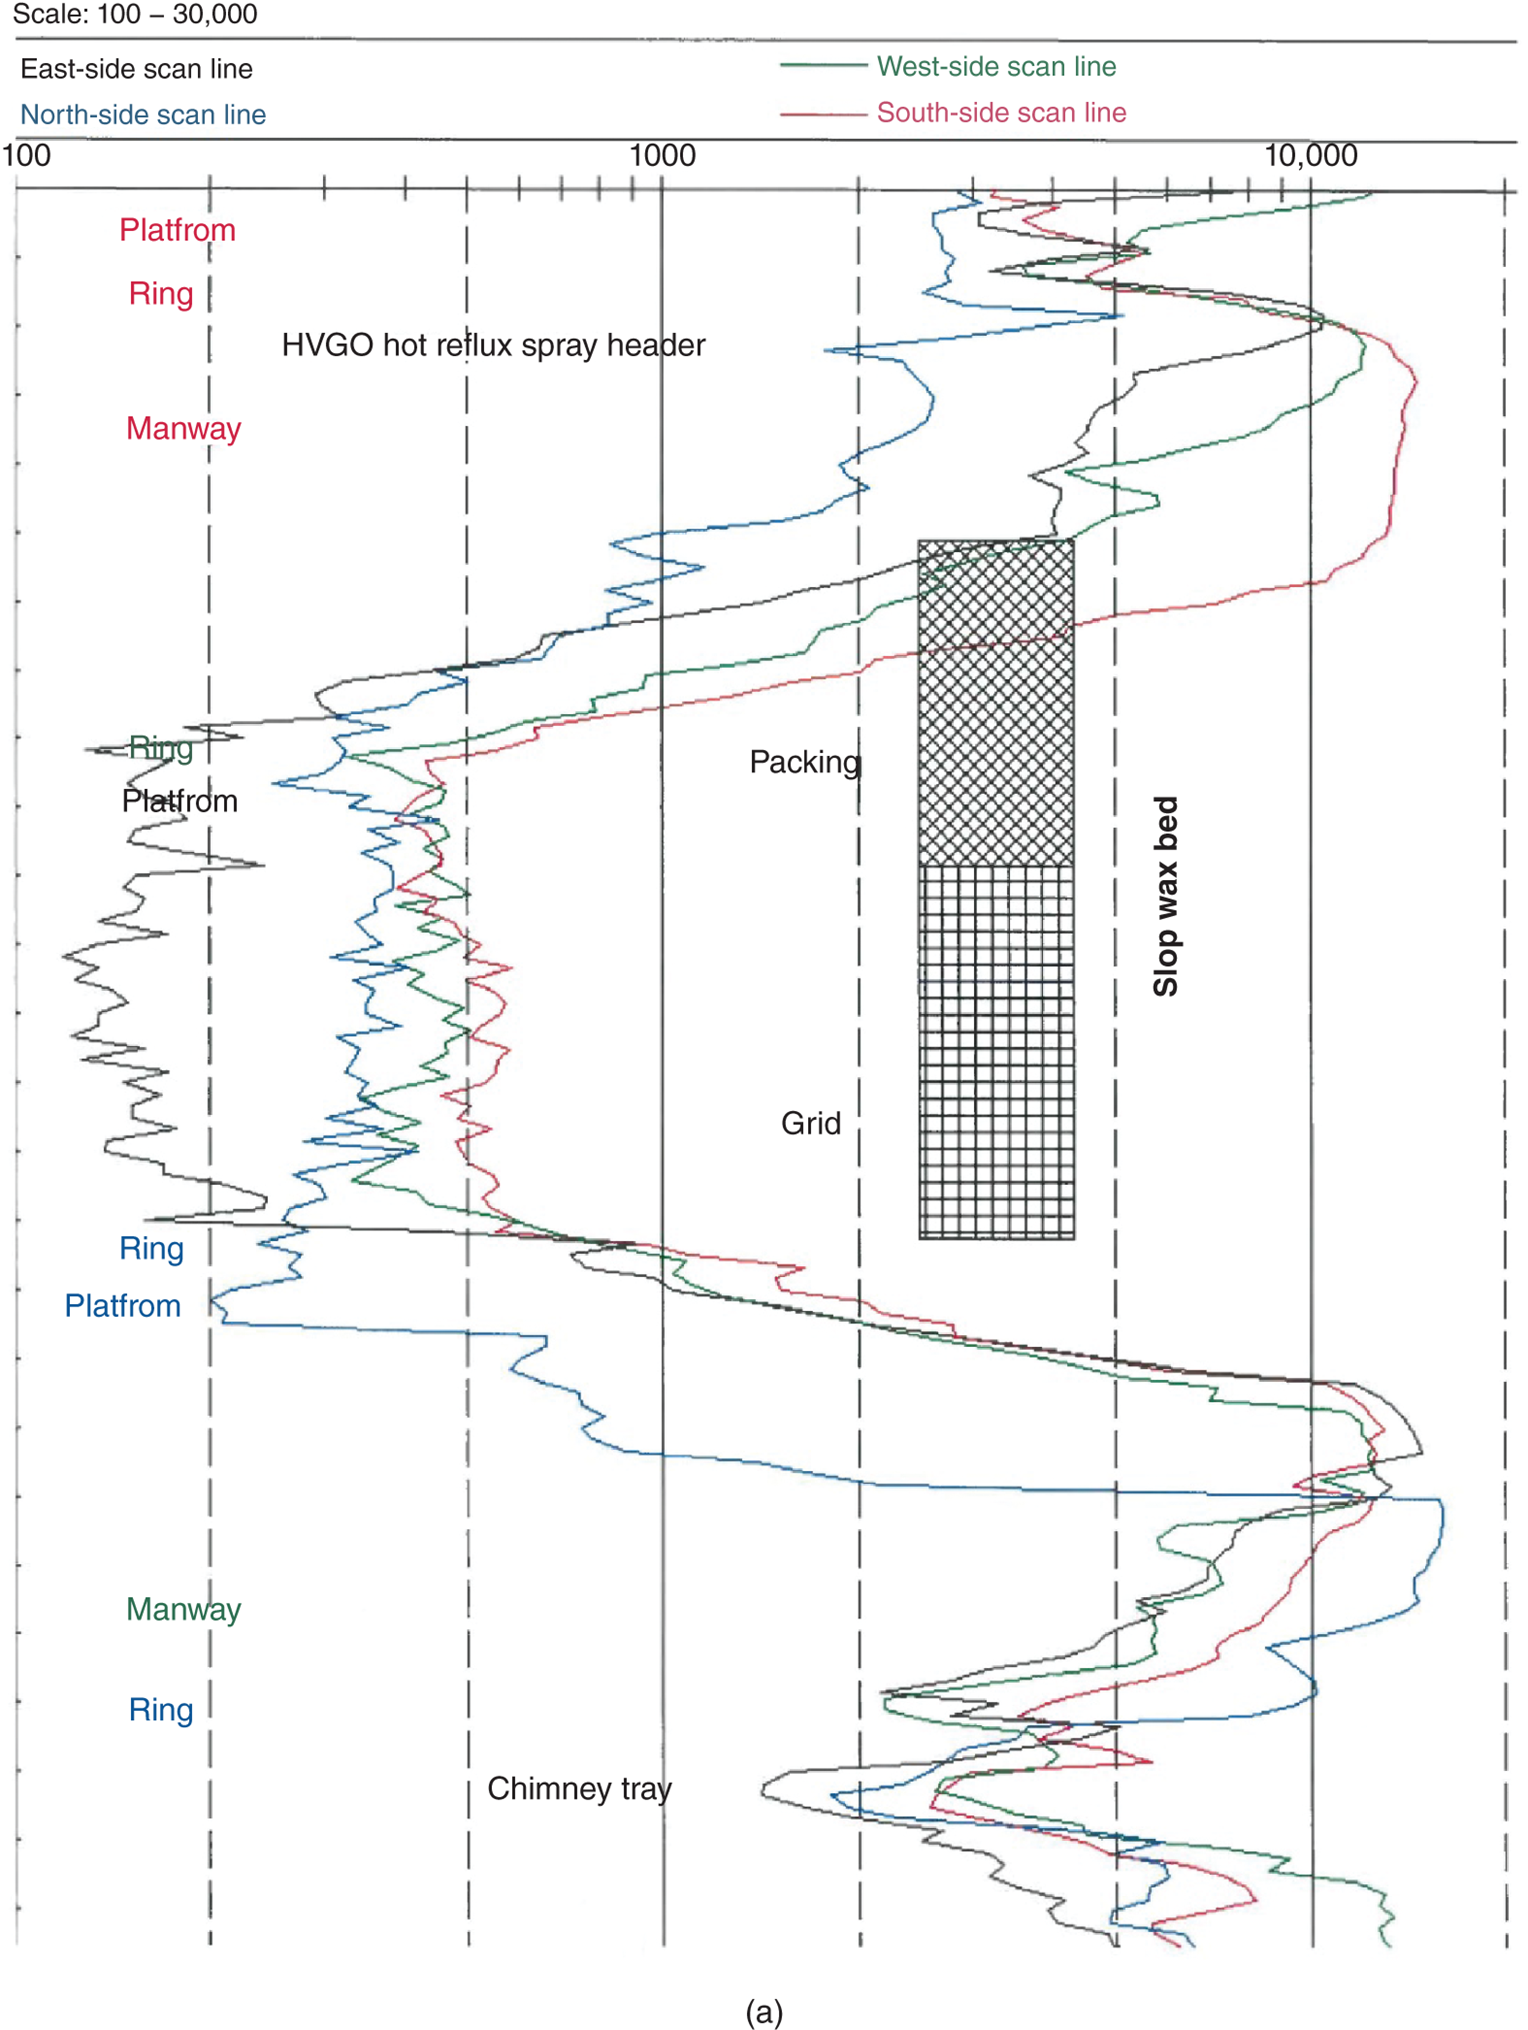

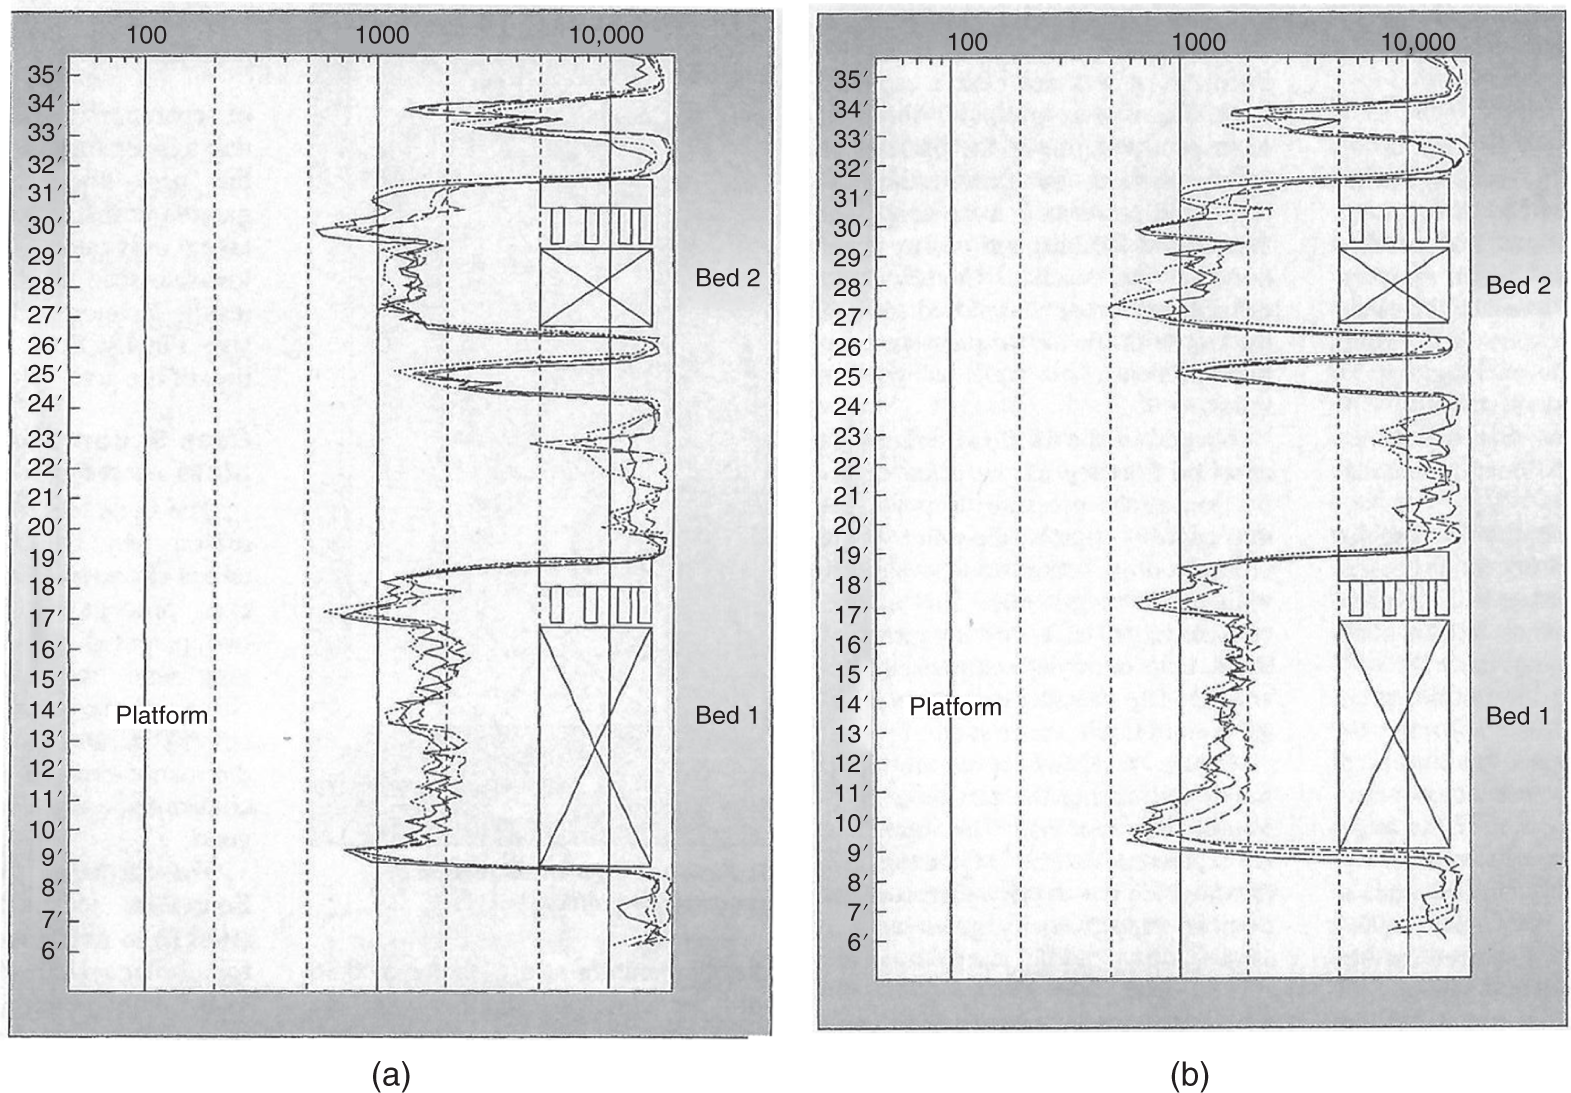
5.5.16 Distributor Overflow and Maldistribution (377)
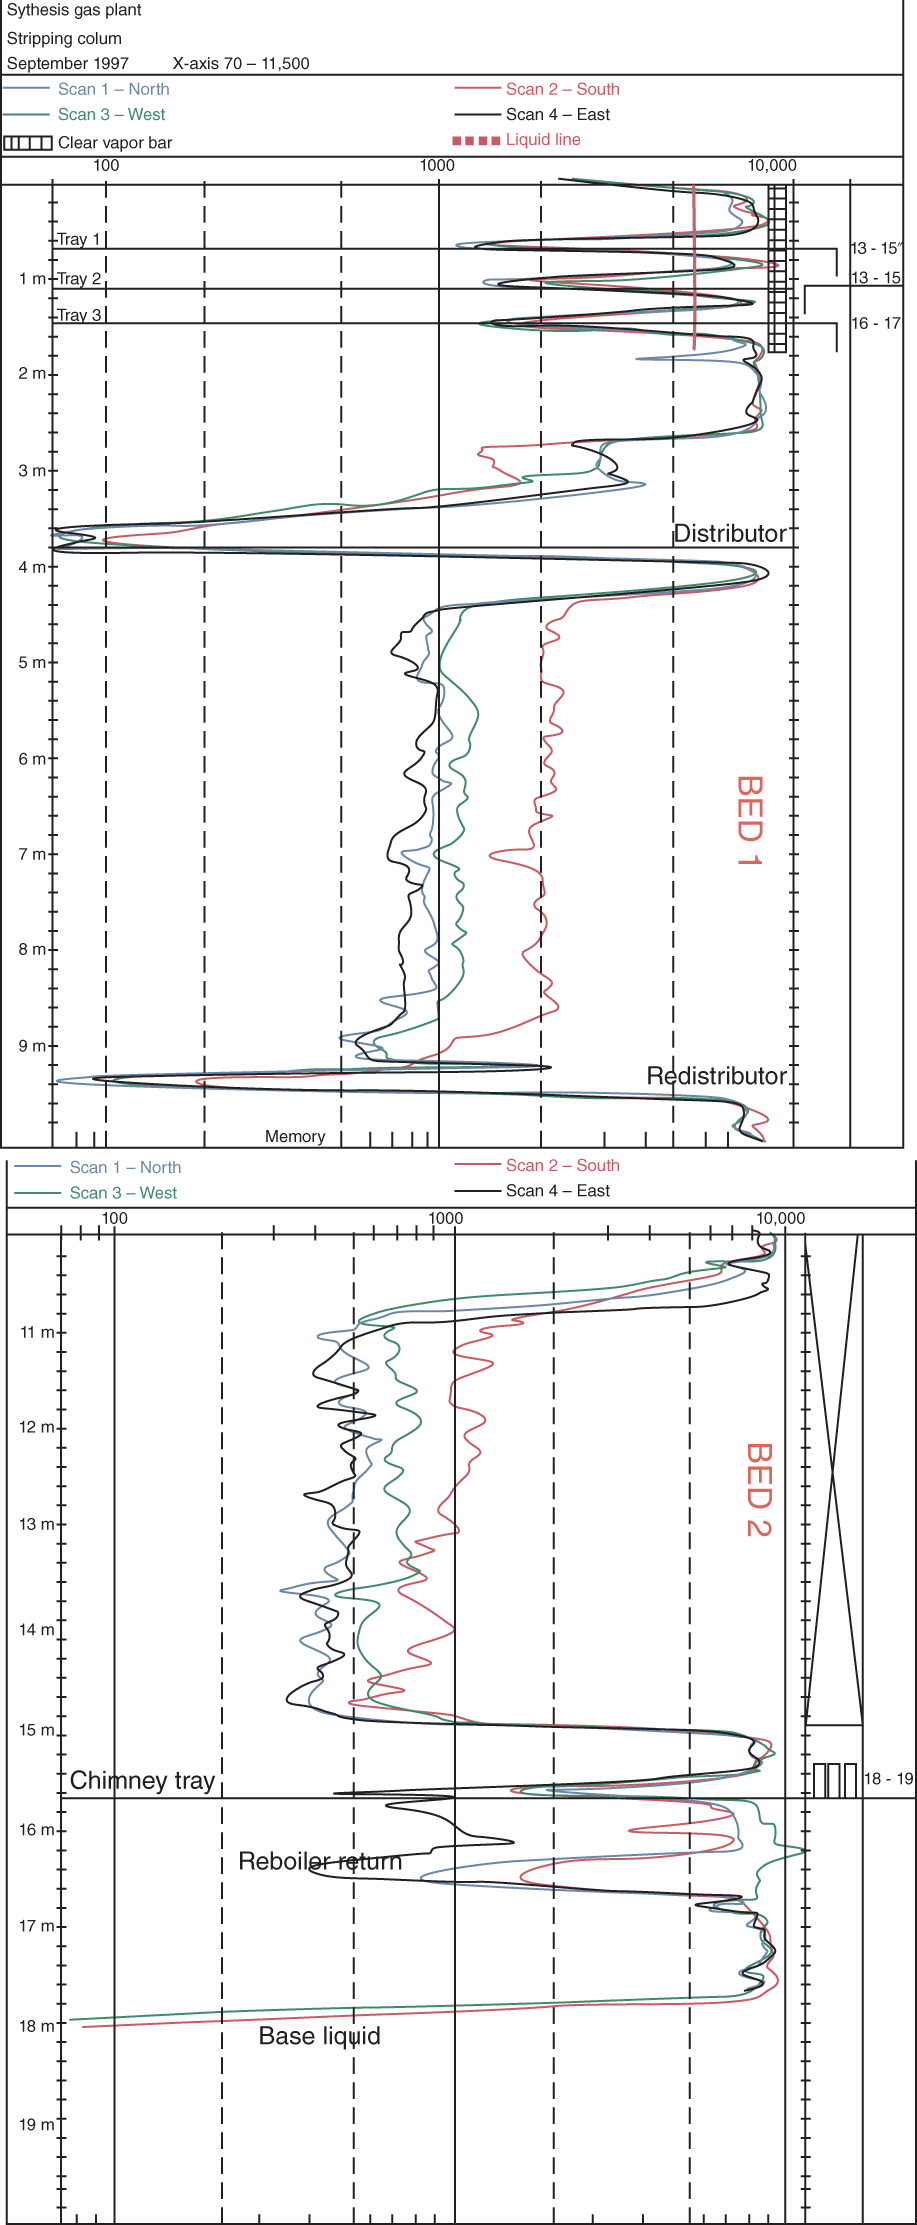
5.5.17 Overflow, Entrainment, and Maldistribution from Flashing Feed Distributor
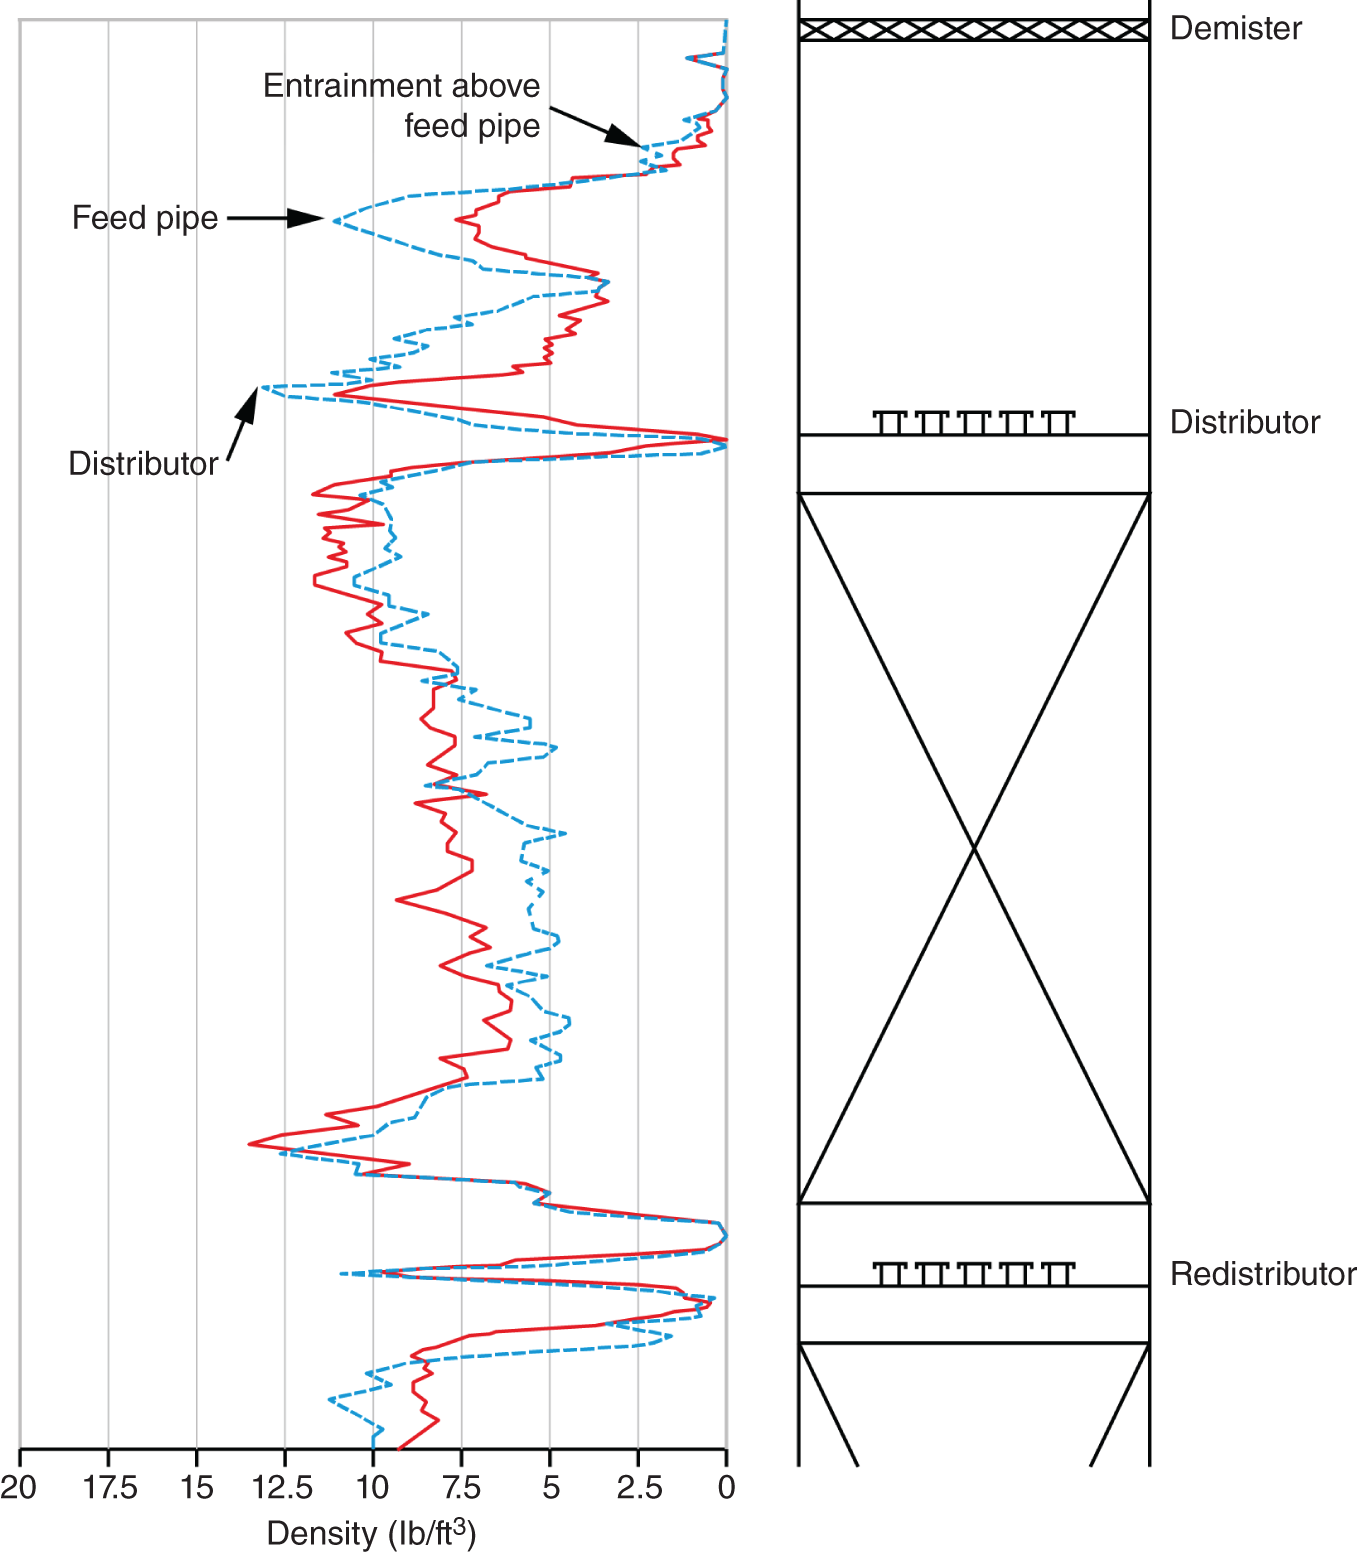
5.5.18 Tower Overfill due to Excessive Pressure Drop in Kettle Reboiler Piping
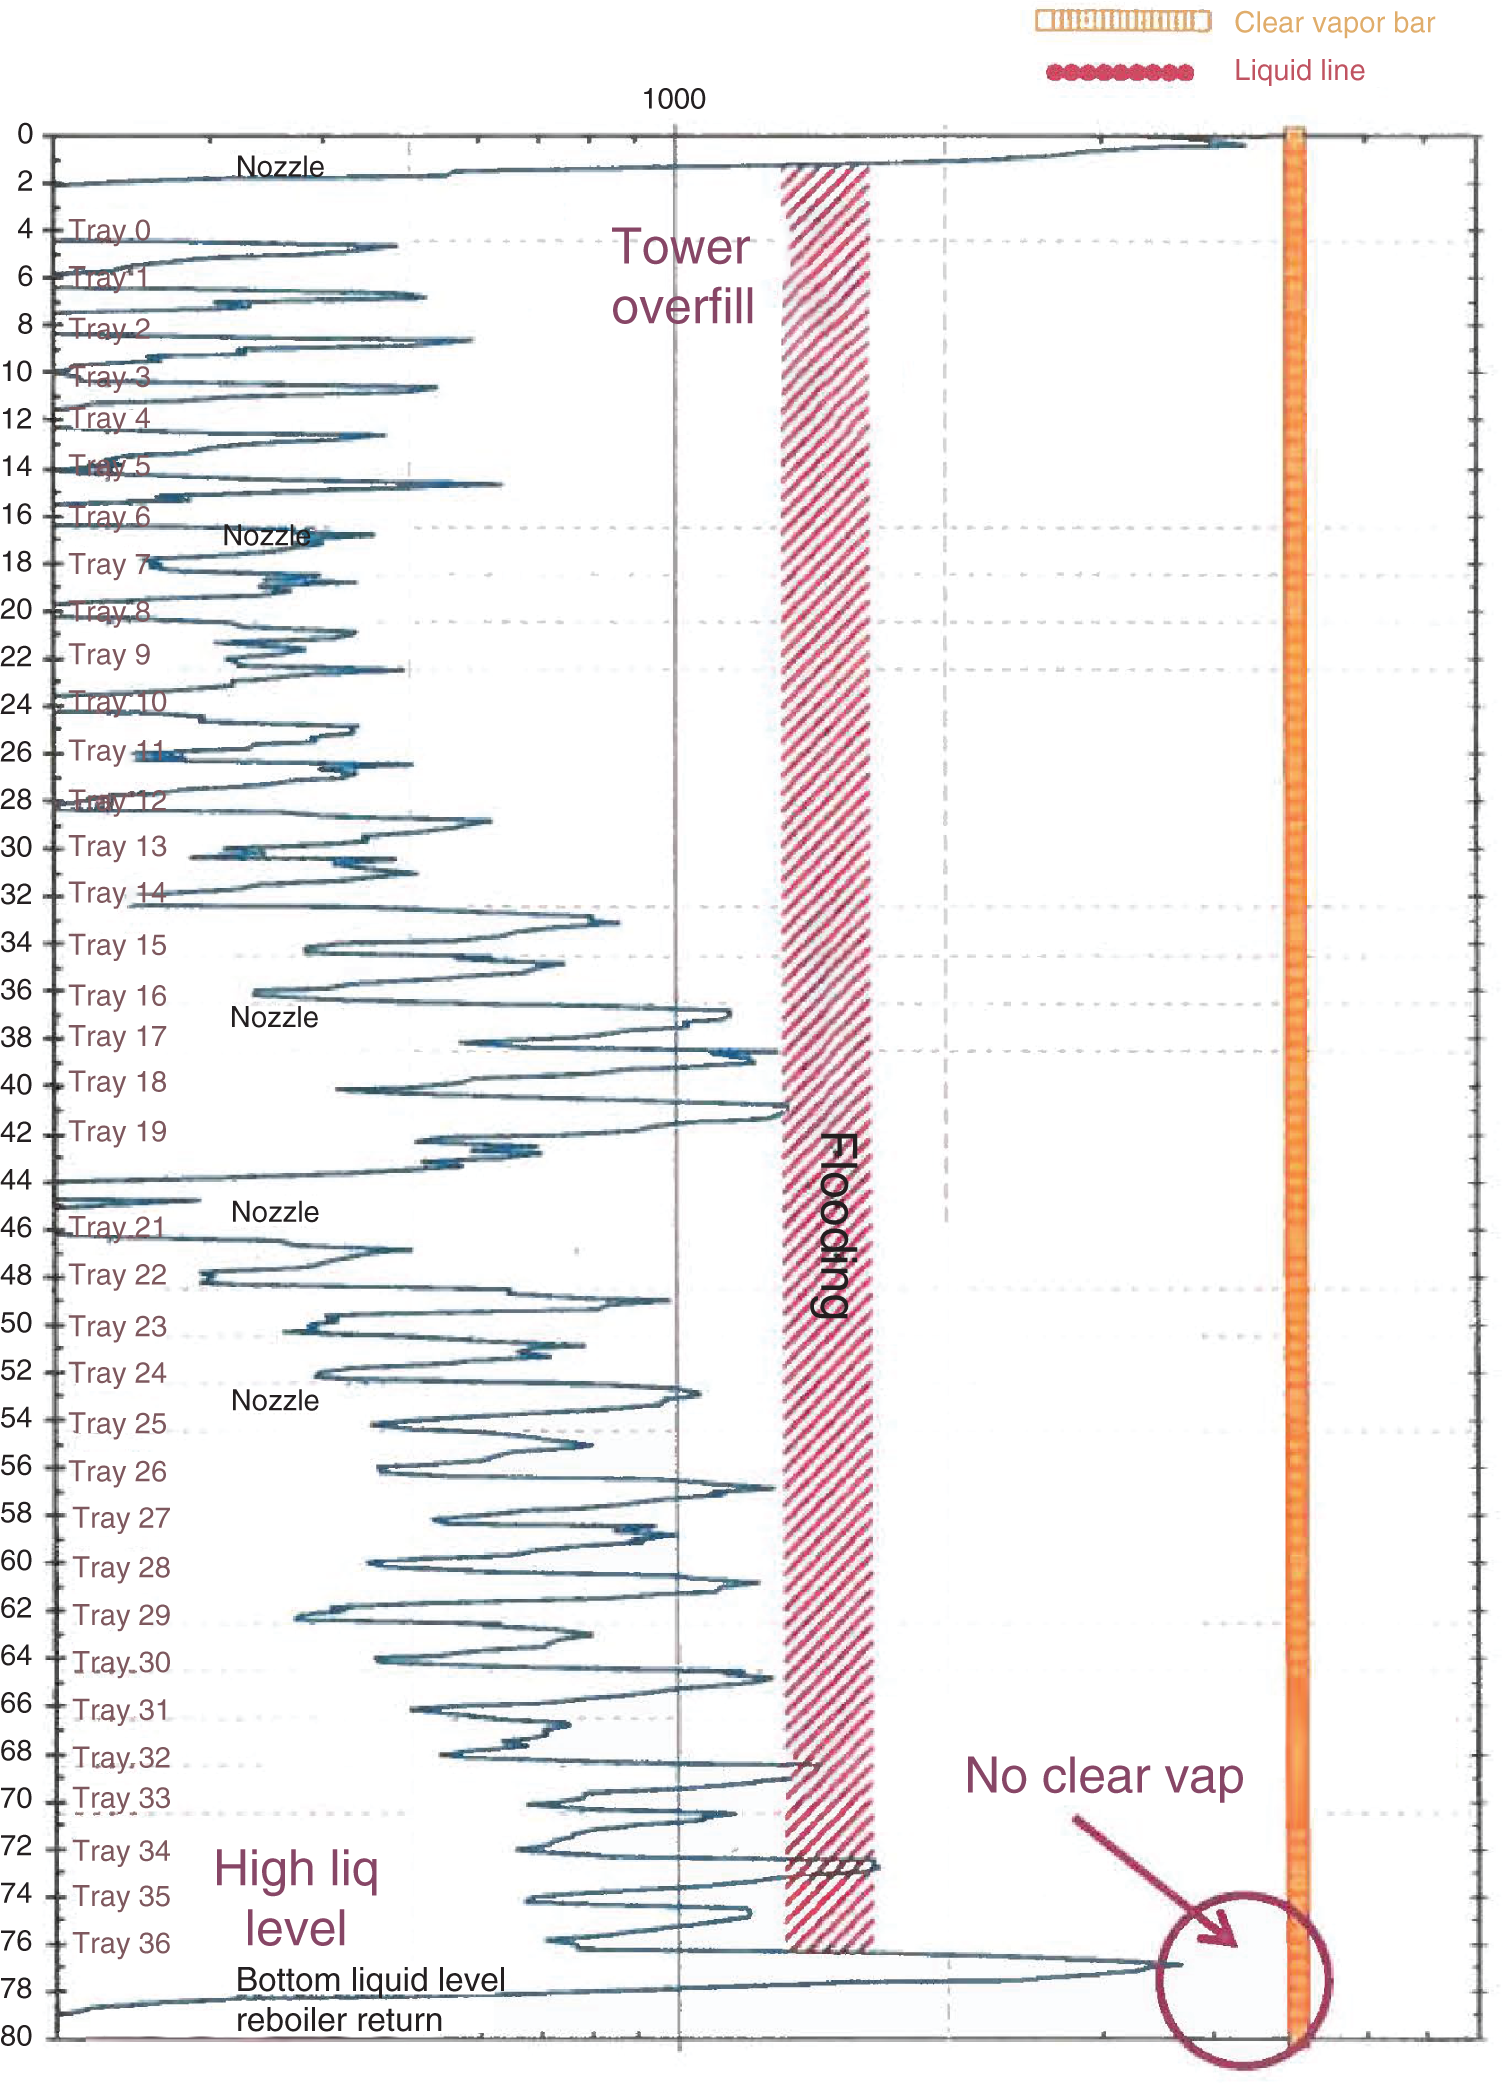
5.5.19 Is a Collector (or Chimney Tray) Overflowing? Does this Initiate Flooding?
5.5.20 Damaged or Dry Trays?