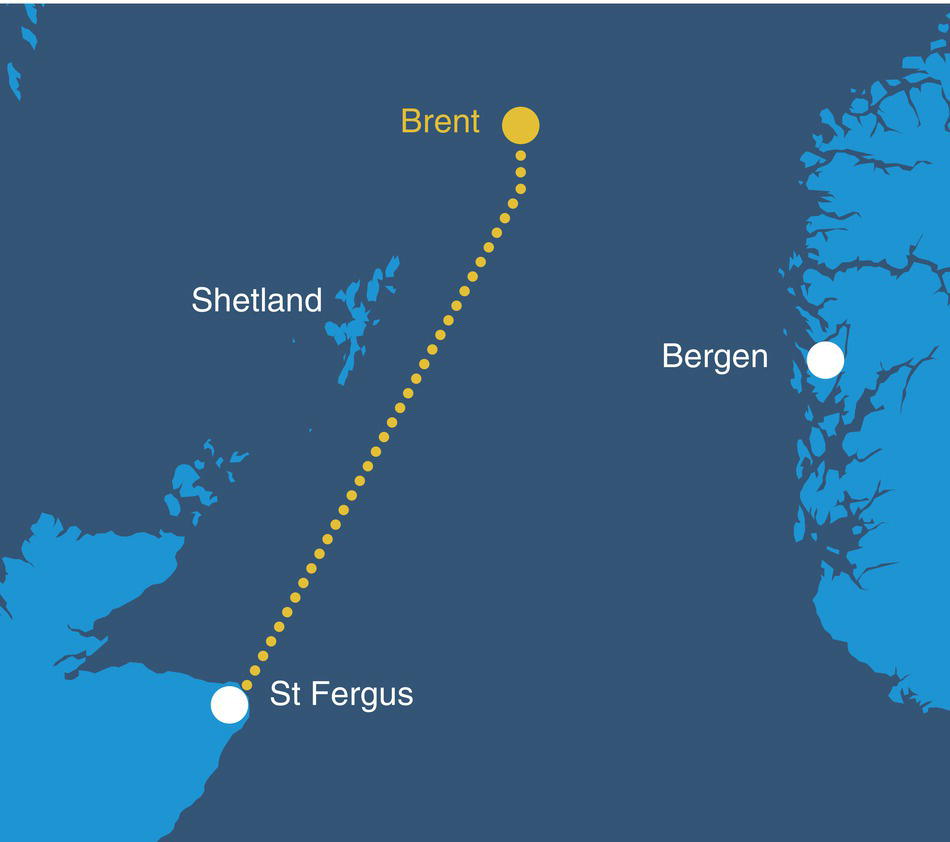
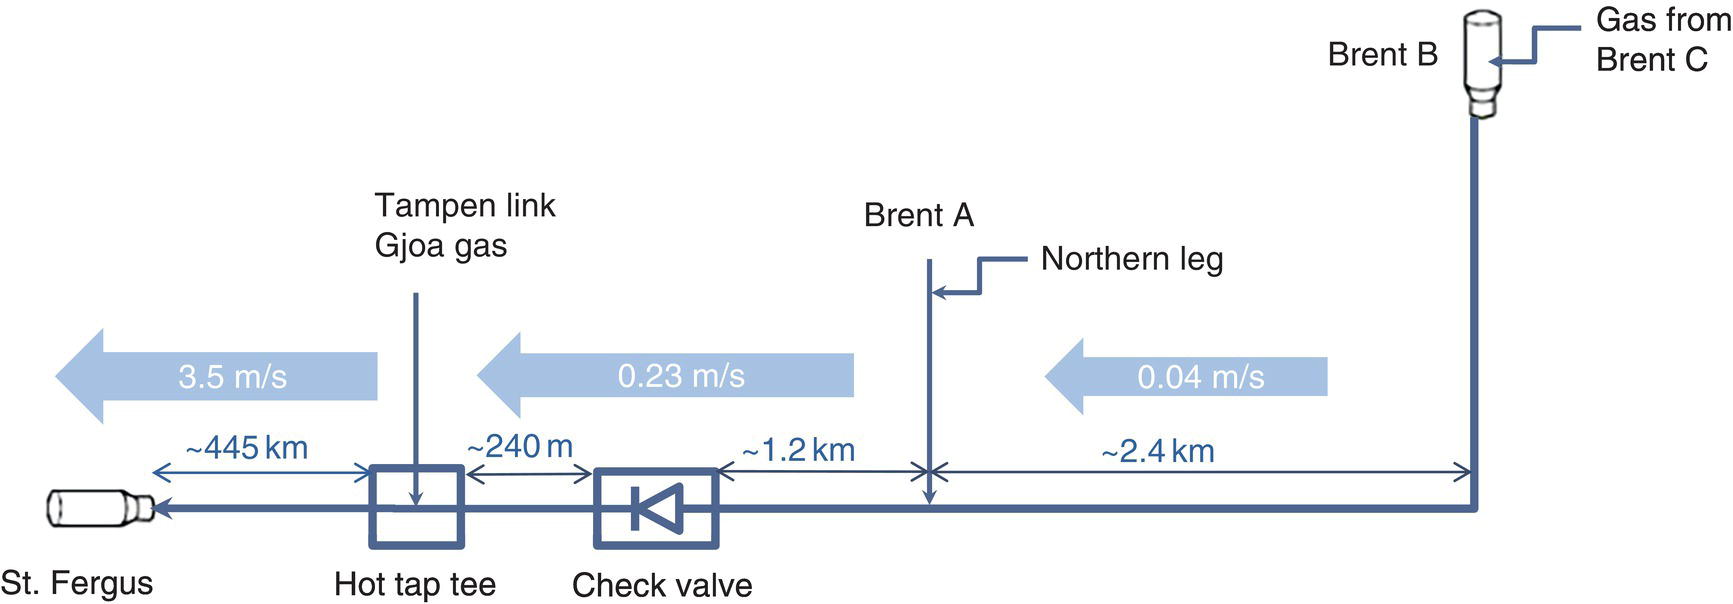
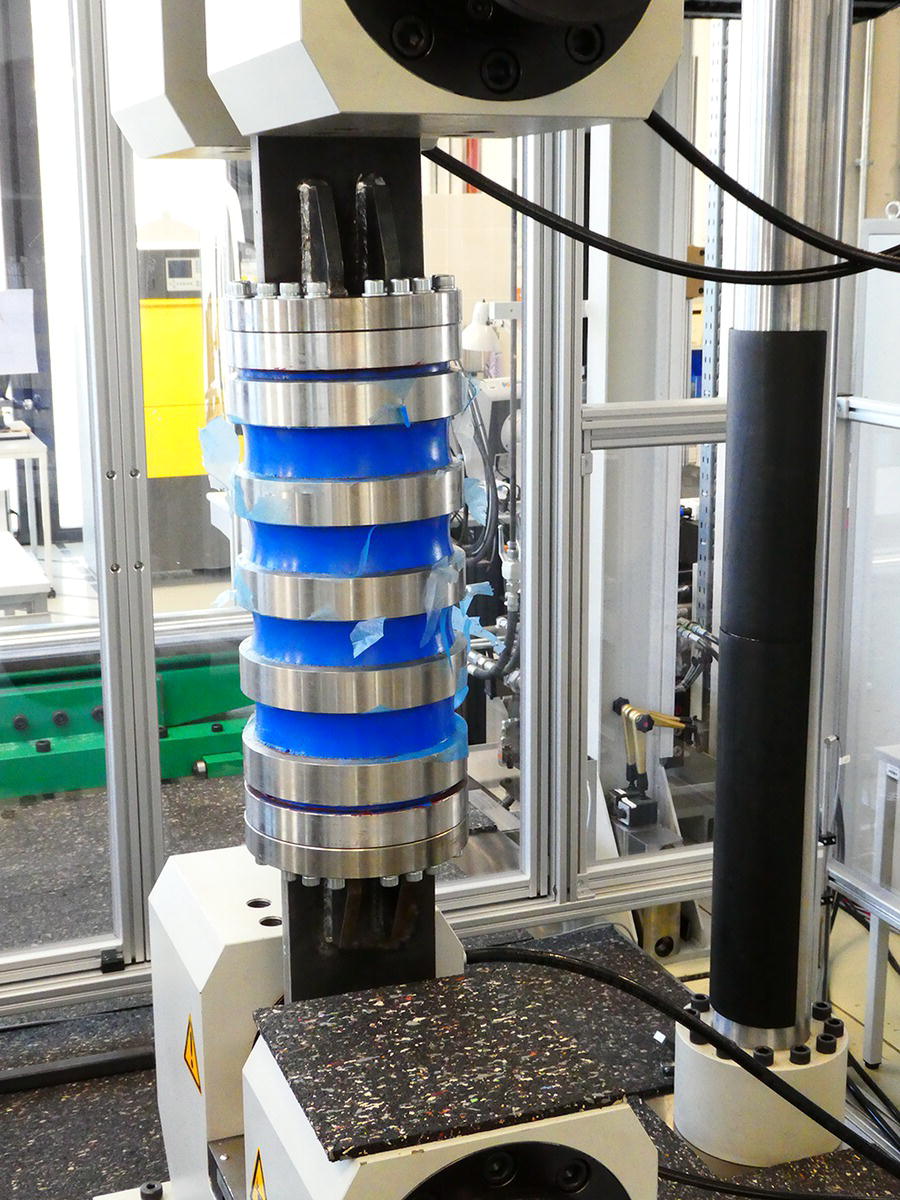
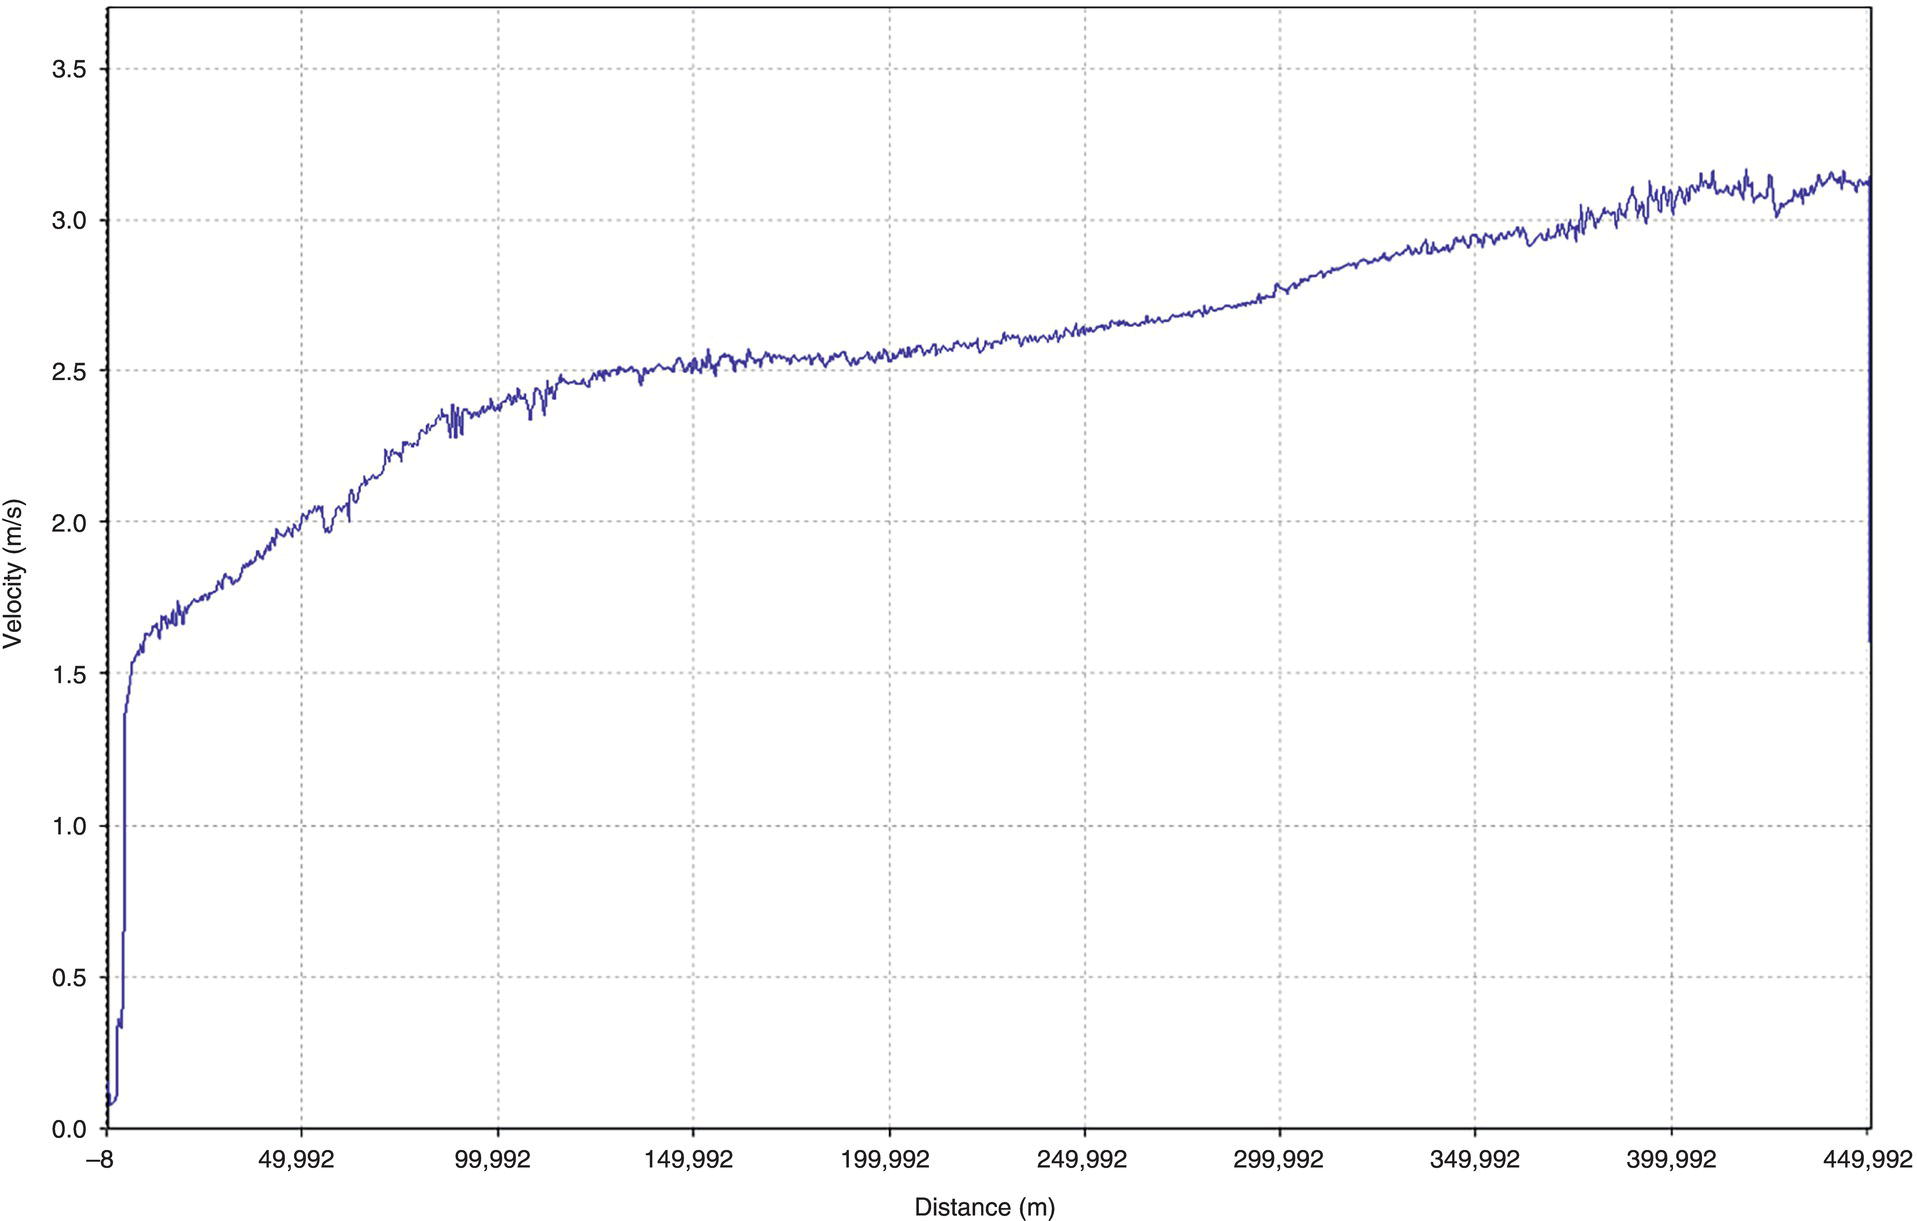
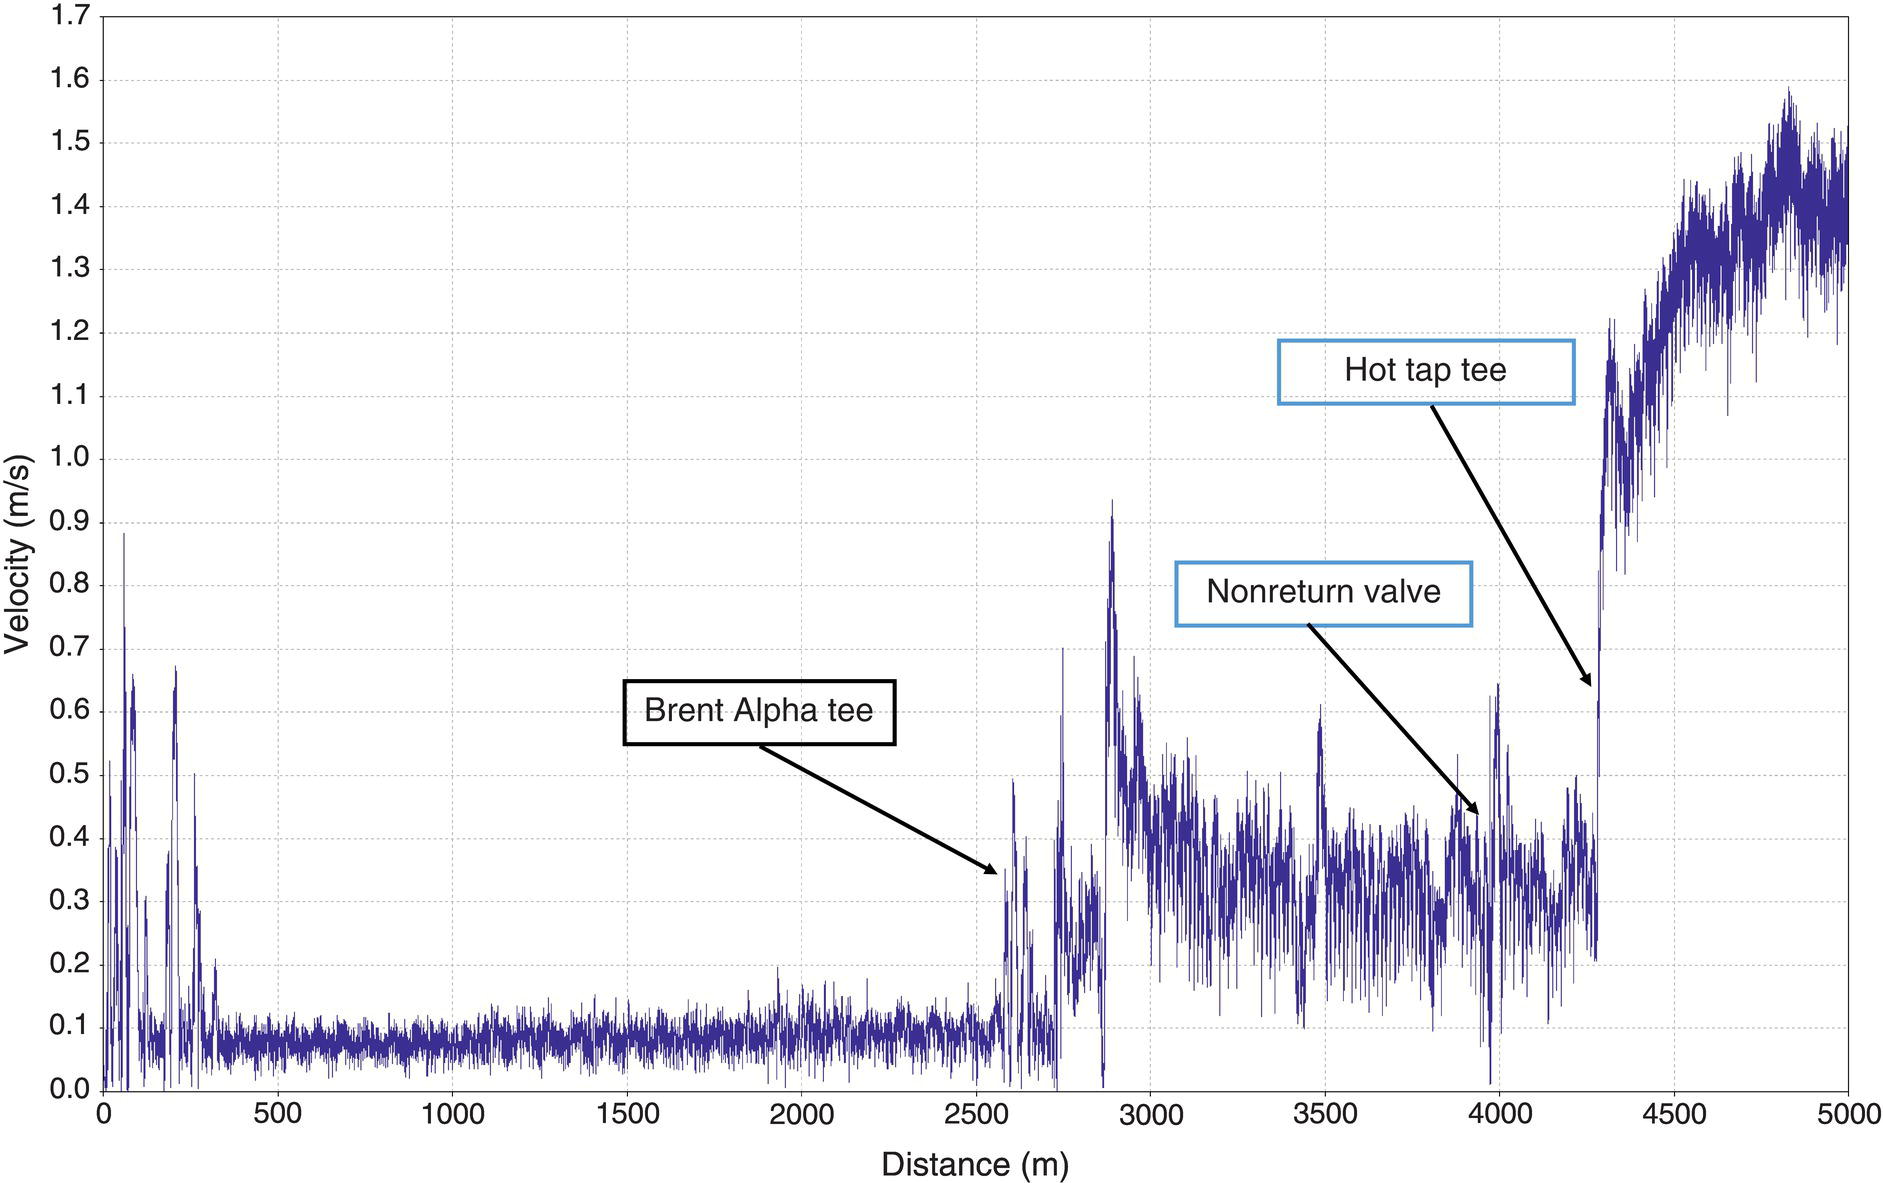
J. Nonemaker1 T. Steinvoorte2 and R. Subramanian3 1ROSEN Group, Houston, TX, USA 2ROSEN Europe B.V., Oldenzaal, The Netherlands 3Shell U.K. Limited, Aberdeen, UK In-line inspection of offshore pipelines is increasingly becoming a challenging task for several reasons: Offshore pipelines distinguish themselves from onshore pipelines because external reference measurements and local repairs are challenging or sometimes even impossible. Furthermore, inspecting offshore pipelines is often more demanding than inspecting onshore pipelines, e.g., because of logistics, accessibility, and cost. Consequently, measurement performance, first run success, risk mitigation, and operational impact are key factors to be considered when selecting an inspection solution. And to execute these inspections successfully, experience and expertise, from both operator and inspection contractor, need to be combined in a multidisciplinary team that operates as “one team” and establishes the confidence and trust to make the right decisions. This chapter discusses a recent example of such a challenge; the successful inspection of a key Shell pipeline in the North Sea which could not be inspected with conventional tools and procedures. The Far North Liquids and Associated Gas System (FLAGS) is an offshore 36 in. × 450 km pipeline which runs from the Brent B platform to the St. Fergus gas terminal in Scotland. It was commissioned in 1983 and was due for its next metal-loss inspection in 2021. However, due to the decommissioning of the Brent field, Shell required a metal-loss inspection prior to starting the Brent Bypass project in 2017. If the pipeline was not going to be inspected prior to the Brent Bypass work, subsea pig launching would be required, which would increase the complexity and costs for the inspection. The pipeline location is indicated in Figure 72.1. Although the FLAGS line had been in-line inspected before, changes in operating conditions and the addition of a hot tap tee (HTT) in the system made the inspection task a unique, industry-first challenge. The inspection solutions had to overcome: The pipeline configuration is illustrated in Figure 72.2. Figure 72.1 Pipeline location (dotted line). The overall approach to the inspection solution was to provide a ruggedized magnetic flux leakage (MFL) tool that could perform in the low-flow and high-flow pipeline sections, as well as pass the check valve and HTT side flow without any damage. The main risk with low-flow inspections is a stationary tool due to insufficient sealing. Because of the low flow a small amount of gas bypass over the tool can cause the tool to stop. The engineers therefore designed customized pulling units for the MFL tool and the cleaning/gauging pig that decreased gas bypass to an absolute minimum. The dual-body MFL tool design included protective frames and bumpers to allow the tool to push open the check valve and pass it without becoming damaged, or getting caught by the valve clapper. The engineers developed a similar cleaning and gauging pig that would prevent the gauge plate from being damaged by the clapper. The magnetization of the MFL tool was increased to ensure full measurement specifications for the nominal pipe thickness at speeds up to 3.5 m/s. Because of the challenging nature of the pipeline, the tool designs had sufficient contingency. A safety factor of 8 was used to ensure the MFL tool could provide enough drive force to push open the check valve. The tools could perform at speeds as low as 0.01 m/s, lower than the expected minimum in the pipeline. Furthermore, the modules of the MFL tool and the cleaning/gauging pig were designed to ensure that they would still be functional if the modules were separated, i.e., resulting from a joint break at the HTT. On the MFL tool, the electronics were placed so that a joint break would still allow the tool to record data. For further contingency, in the unlikely event that a tool would become lodged, a rescue pig was available and the tools were built to allow for being pushed. A comprehensive testing program was performed to confirm the design: Figure 72.2 Pipeline configuration. Figure 72.3 Side-flow test setup. Figure 72.4 MFL tool during check valve testing. The initial risk assessment revealed a theoretical risk of a reversed flow resulting in a tool moving backward in the pipeline. This situation could occur in case of a platform shutdown, after which gas would be removed from the pipeline to restart the platform. During the first MFL tool design solid brushes on the MFL tool were included because they improve the tool’s bidirectional capability. However, during testing, excessive wear was observed on these brushes, which forced the engineers to reconsider the design and adjust the inspection schedule. After an in-depth assessment of the issue, a change to lamella brushes was proven suitable and was selected for the final tool design. The risk of tools running backward was mitigated by establishing operational procedures that prevented reversed flow in the pipeline. Figure 72.5 Stiff joint tensile test. After all testing was completed, the inspection team mobilized to the platform in January 2017 and launched the cleaning and gauging pig. It was received after 59 h and 53 min. The pig brought out little debris from the pipeline, and there was no significant damage to the gauge plate or the tool body. These results led to the conclusion that there were no major risks, and the MFL tool was launched. It arrived at the receiver 60 h and 6 min after launch. Figure 72.6 shows the MFL tool velocity profile along the full pipeline. The tool was initially in the low-flow pipeline section, as illustrated in Figure 72.7. For the first 2 km the tool had an average speed of ~0.1 m/s, but then the velocity rose sharply at the Tampen Link tee. After passing the tee the velocity steadily increased as the pressure along the pipeline decreased. Thanks to the diligent efforts of the project team, both tools successfully navigated through the pipeline; it was received in good condition and with a full data set. Figure 72.6 Tool velocity across pipeline. Figure 72.7 Tool velocity in low-flow section. In addition, the engineers were able to qualify the MFL tool for speeds as low as 0.01 m/s and polyurethane for these conditions. Low wear on the disks was observed, and the MFL tool could theoretically have been rerun without exchanging polyurethane. Moreover, the engineers demonstrated that reliable testing programs for tools can be developed for low-flow gas conditions and an array of mechanical and operational challenges. The project was executed safely, with a first-time success, on budget, and with minimal impact on normal operations. The inspection results allowed Shell to demonstrate the FLAGS pipeline as healthy and open for business.
72
Shell Flags* Inspection Case Study
72.1 Introduction
72.2 The Challenge
72.3 The Solution
72.4 Field Work
72.5 Result
Note