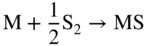
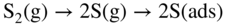
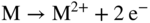
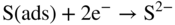
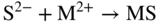
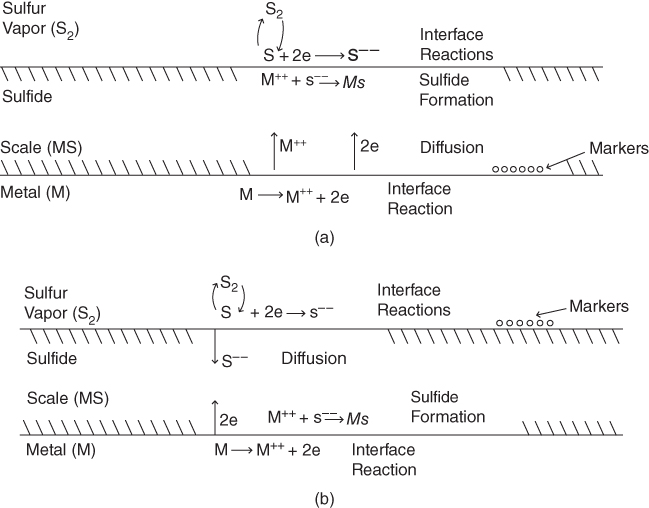
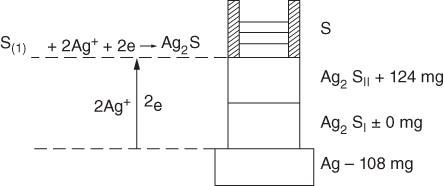
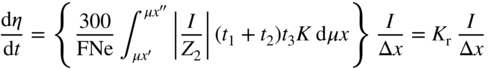
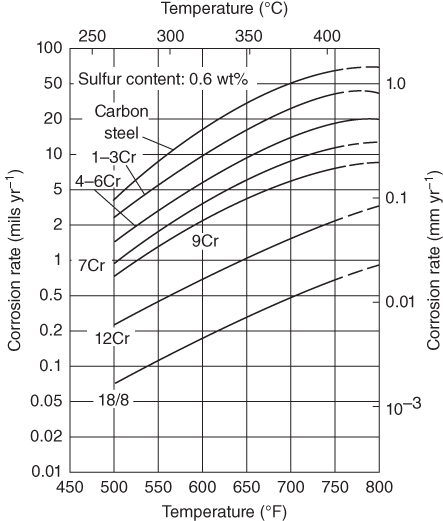
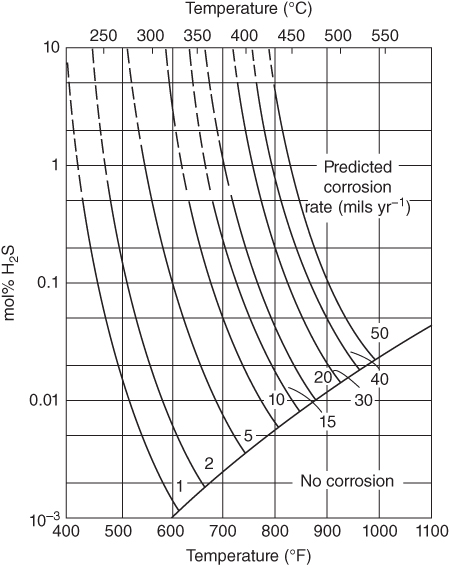
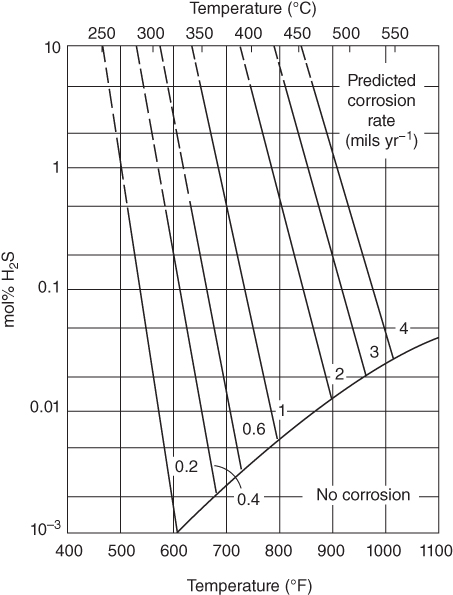
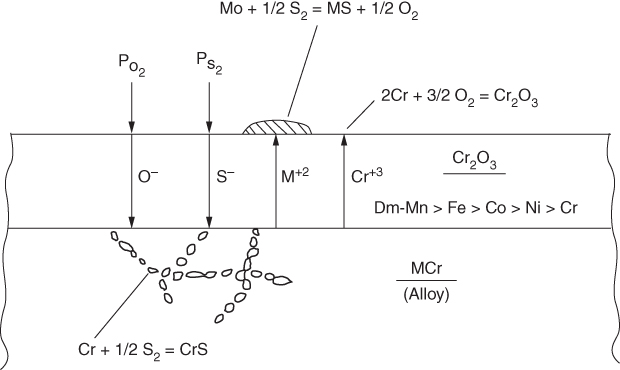
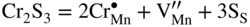
section epub:type=”chapter” role=”doc-chapter”> Because of the widespread natural occurrence of sulfur in fuels (whether solid, liquid, or gaseous), severe corrosion may arise when materials come into contact with hot combustion atmospheres derived from these fuels, as in superheaters, heat exchangers, gas turbines, etc. Sulfur contamination problems also arise in processing plants in the petroleum and chemical industries. In these situations, the main concern is the interaction between metals and alloys and hydrogen sulfide, sulfur dioxide, sulfur trioxide, or elemental sulfur itself. Metal/alloy reactions with other sulfur‐containing compounds such as carbon disulfide are also a source of concern. Interaction with sulfur dioxide (and/or trioxide) may produce scales consisting of the oxide alone, or oxide plus sulfide, or even sulfate, but in the present review, the reactions that lead to the formation of sulfide scales on metals and alloys only will be considered. The sulfidation behavior of metals and alloys is also a subject of academic interest, since it would be hoped that fundamental studies of these phenomena might ultimately lead to a more complete understanding of the process involved and to the development of better sulfidation‐resistant materials. The present chapter is confined to a brief theoretical consideration of the sulfidation behavior of metals and alloys, discussing the basic phenomena involved in the processes. Accordingly, first, an overall picture of the sulfidation process is given, which is more amplified in three further sections concerning the kinetics of sulfidation of metals, the sulfidation behavior of alloys, and the defect structure of metal sulfides. Reference to published papers covering many aspects of sulfidation is also included. For the formation of a metal sulfide, MS, from a divalent metal and sulfur vapor containing S2 molecules as the main species, according to a scheme of the type the driving force is the decrease in free energy (ΔG°) attending the reaction. Provided that Thermodynamic considerations of this type, as discussed adequately in Chapter , are of only limited use since the corrosion product either partially or completely covers the metal surface. The subsequent reaction is then governed entirely by the physicochemical properties of this sulfide scale, and the corrosion problem becomes one of reaction kinetics and not thermodynamics. If we assume that the layer is compact, dense, and pore‐free, affording a protective covering to the underlying metal surface, as may reasonably be expected since the volume of metal consumed in producing that volume of sulfide, according to the principles established by Pilling and Bedworth (see Chapter ), then the rate of continued scaling will be governed by one of several possible mechanisms, which together constitute the overall process, viz.: followed by flow of the electrons toward the sulfide/sulfur vapor interface to allow production of sulfur ions or but at different interfaces. Figure 8.1 Summary of the various mechanisms leading to the formation of sulfide scales on metals involving (a) an outward diffusion of cations and (b) an inward diffusion of anions. It should be emphasized, however, that even when such a favorable potentially protective sulfide/metal volume relationship exists within a given reaction system, often in practice, because of the large stresses that are produced within the system by virtue of this large volume ratio, the protective scale breaks down mechanically and develops porosity, leading to an enhanced reaction rate (Hauffe 1965; Kubaschewski and Hopkins 1962). Of these three reaction products (1)–(3), one will be the slowest and will therefore control the overall rate of reaction. It should be noted that processes (1) and (2) also involve incorporation of S2− ions and M2+ ions into the sulfide layer, respectively. Again, the ionization of metal atoms (process 2) may require a simultaneous injection of vacancies into the underlying metal. When considering the individual mechanisms constituting processes (1) and (2), it is important to recognize that these are all phase‐boundary reactions, in contrast to process (3). Which of these processes is rate controlling will normally be reflected in the scaling kinetics; if process (1) or (2) is rate controlling, linear kinetics will prevail, while if process (3) is the slowest overall mechanism, then diffusion‐controlled (often parabolic) kinetics may be expected. Thus, although at first sight we have in sulfidation an essentially simple chemical interaction, involving the normal thermodynamic considerations, the process is, in fact, complex. It should be emphasized that the foregoing description of some of the main features of the sulfidation process has been limited to a consideration of the formation of compact sulfide scales of a single chemical composition. In practice, the unrestricted natural growth of a physically and mechanically perfect scale, according to the mechanisms outlined above, is rare. Often the scales formed on metals and alloys develop imperfections (cracks, voids, porosity) and lose adhesion to the metal surface, leading to the development of non‐protective scales that may seriously modify the normal processes, particularly (3). To enable the outline description of the sulfidation process to be amplified, it is convenient to further discuss the subject matter under three headings: sulfidation kinetics, sulfidation behavior, and defect structures. Two types of reaction kinetics – linear and parabolic – have been observed during the sulfidation of metals under isothermal exposure conditions that lead to a formation of sulfide scales. Of these two kinetic types, the parabolic relationship between weight gain and exposure time has been most commonly observed. If we consider an increase in weight per unit area of sample, Δm, due to sulfidation after an exposure time t, the parabolic relationship is defined as (Δm)2 = kp · t where kp is the parabolic reaction‐rate constant. The linear scaling law is defined by the expression (Δm) = kl · t where kl is the linear rate constant. Occasionally, sulfidation reactions are initially parabolic, but linear kinetics is observed to succeed as a second reaction stage (“paralinear” kinetics). This transition in behavior appears to be associated with the development of mechanically imperfect, porous, or partially fused scales (Davin and Coutsouradis 1962; Dravnieks 1951; Haycock 1959a,b). The mechanism of parabolic scaling of metals (whether involving oxidation or sulfidation) was fully described over 75 years ago by Wagner (1933a,b). The main features of the Wagner model may be conveniently illustrated with reference to the parabolic sulfidation of silver, a reaction system that has been studied in some considerable detail. The interaction between silver and liquid sulfur leads to the formation of the scale of silver sulfide, Ag2S (Figure 8.2), and the growth of this scale depends on the physicochemical properties of the scale and involves three reaction mechanisms, as defined earlier. Of these mechanisms (1)–(3), the Wagner model is concerned only with the diffusion‐controlled reaction, i.e. mechanism (3); it is assumed that the phase‐boundary reactions described in mechanisms (1) and (2) are sufficiently rapid not to be rate controlling and that a volume diffusion of the reacting ions (Ag+) and transport of electrons across the growing scale controls the overall rate of reaction. Electrons and ions are considered to migrate independently of each other through the n‐type defect silver sulfide lattice. The part played by a possible counter diffusion of S2− ions in forming the Ag2S scale is considered negligible. It is assumed that thermodynamic equilibrium is established between the metal and the sulfide at the metal/sulfide interface and between the sulfide and the sulfur at the sulfide/sulfur interface; in this way, the boundary conditions for diffusion are established. Figure 8.2 The reaction between silver and liquid sulfur to form silver sulfide (Wagner 1951). The driving force for the sulfidation process is the free energy change associated with the formation of the sulfide Ag2S from metallic silver and the sulfur, and a chemical‐potential (concentration) gradient exists across the scale. The partial pressure of sulfur at the metal/sulfide interface is equal to the equilibrium dissociation pressure of the sulfide in contact with the metal, while at the other interface, it corresponds to the sulfur activity in the liquid sulfur in equilibrium with the sulfide. More generally, for gaseous sulfur corrosion, this sulfur activity would correspond to the partial sulfur pressure of the surrounding atmosphere. The rate of growth of the sulfide scale at the outer sulfide/sulfur interface is determined by this chemical concentration gradient through the scale and the rate of diffusion of silver ions under the influence of the gradient. The mobilities or the diffusion coefficients of the cations and electrons are, however, not equal, and, as a result, an electrical‐potential difference exists across the scale, which draws the silver ions through the scale to the outer interface. The transport of ions and electrons through the scale is then described in terms of diffusion due both to the chemical‐potential and electrical‐potential differences across the scale. On the basis of this model, Wagner derived an expression for the rate of thickening (dη/dt equivalents per second) of a scale of thickness Δx: where K is the electrical conductivity of the scale (Ω−1 cm−1) and t1, t2, t3 are the transport numbers of the cations (Ag+), the anions (S2−), and electrons, respectively – properties that can be measured. In practice we may note that t2 ≃ 0 and t3 ≃ 1, i.e. the contribution of the S2− ion to the total conductivity is negligible and the conductivity of Ag2S is considered to be mainly electronic, with a small cationic contribution. Z2 is the valency of the negatively charged nonmetal (sulfur) ion; μx′ and μx″ are the chemical potentials of the nonmetal for the equilibria between the sulfide reaction product and the metal (i.e. at the inner interface) and between the sulfide reaction product and the nonmetal (i.e. sulfur at the outer interface). F is the Faraday (96 500 C), N is Avogadro’s number, and e is the charge on the electron in e.s.u.; Kr, the expression within the braces was termed the rational rate constant by Wagner, indicating the reaction rate in equivalents/cm2 s for a scale layer of unit thickness (1 cm). Since the chemical potential of the nonmetal is by definition related to the activity, ax, of the nonmetal, and if the activity is approximated to partial pressure, we may write Normally, it is common practice to measure parabolic sulfidation rates gravimetrically; when the units of kp are (gS)2/cm4 s, kr is proportional such that for a sulfide M2S (e.g. Ag2S), where Veq is the volume of 1 g equivalent of the sulfide, Z2 is the valency of the sulfur ion, and A is the atomic weight of sulfur. Wagner was, in fact, able to show experimentally that the growth of silver sulfide was indeed governed mainly by silver‐ion migration and at the same time demonstrated the validity of expression (8.6). The experimental arrangement used is shown in Figure 8.2. Two silver sulfide tablets (I and II) were placed on the top of a cylinder of metallic silver. A glass tube containing sulfur was placed on the top surface of tablet II. The complete unit was then heated at 220 °C in an atmosphere of nitrogen for one hour. During this period silver sulfide was observed to form at the bottom of the glass tube, i.e. at the sulfur/silver sulfide interface. The gain in weight of tablet II (including the freshly formed sulfide) was equal to the weight loss of the silver cylinder together with the equivalent weight of (combined) sulfur. Thus, Wagner showed that the reaction took place mainly at the sulfur/sulfide interface and involved only silver‐ion migration. By observing the growth rate of the silver sulfide, a rational rate constant of 1.6 × 10⁻⁶ equiv. cm−1 s−1 was calculated. The corresponding values of 2–4 × 10⁻⁶ calculated from Eq. (8.6) using available transport numbers and electrical‐conductivity data were in reasonable agreement with the experimentally determined value, thus confirming the validity of the reaction model. Sulfidation experiments reported by Hauffe and Rahmel (1952), Meussner and Birchenall (1957), and many others would appear in general to support the validity of the Wagner model. But, when considering these results, it is important to realize that the reaction model does not assume larger molecular species such as S4, S6, and S8 in the vapor phase; also idealized sulfide scale growth is uncommon, marker experiments are difficult to interpret, the sulfide defect model does not consider the degree of association of the ionic and electronic defects, etc. In summary, practical analysis of the kinetics of sulfidation of metals is by far really a complicated situation. Studies on the sulfidation of pure metals have yielded useful information regarding the fundamental mechanism(s) of the process. In general, it has been concluded that there are many similarities but also differences between the kinetics and mechanisms of oxidation and sulfidation. One of the most important conclusions is that both sulfide and oxide scales on common metals grow by outward diffusion of cations. On the other hand, in the case of the sulfidation of some refractory metals, e.g. molybdenum, tantalum, and tungsten, inert markers were found on the scale surface, strongly suggesting that the MoS2, TaS2, and WS2 scales, like the ZrO2 scale, grow by inward diffusion of anions. This important similarity in the growth mechanism of sulfide and oxide scales on metals results from the same type of predominant disorder in transition metal sulfides and oxides. However, the sulfidation rates of common metals are usually many times higher than their oxidation rates, which results mainly from a very high concentration of point defects in the sulfides. In other words, sulfidation rates are primarily determined by lattice diffusion, grain boundary diffusion being less important in sulfides than in the case of metal oxidation. It is also very important to note that very small solubility of sulfur in metals as well as rapid scale formation makes the formation of an internal sulfidation zone, which plays an important role in oxide corrosion, impossible. Furthermore, small or even trace amounts of impurities may dramatically influence the rate of sulfide corrosion due to the doping effect that will be discussed later. Since pure metals are not generally suitable for high temperature structural engineering applications on account of their lack of strength, for practical purposes the development of sulfidation‐resistant alloys is of interest. There are two possible approaches to this problem. First, on theoretical grounds, according to the principles established by Wagner, it should be possible to reduce the number of defects present in a semiconducting sulfide scale by the incorporation into that scale of a suitable alloying element. This in turn might be expected to reduce the rate of sulfidation, provided the reaction was controlled by a diffusional process. Accepting the application of this Wagner alloying theory to sulfidation phenomena (which was originally postulated and proved with reference to metal oxidation), there are certain practical limitations that unfortunately severely restrict its application. The second approach to the problem of developing sulfidation‐resistant alloys is to consider alloying the basis metal with another metal that reacts very readily to form a stable sulfide, i.e. sulfidizes preferentially. This might be expected to result in the formation of a protective layer over the underlying alloy and so reduce the rate of sulfidation. A low defect concentration in the preferentially formed sulfide is clearly implicit for effective protection. The Wagner theory of alloying as a method for reducing the rate of sulfidation of metals may be explained as follows. Briefly, the effect depends upon whether the ions of the solute (i.e. alloying addition) increase or decrease the number of defects in the surface compound (semiconducting sulfide) of the solvent. Consider the formation of silver sulfide, Ag2S. If we accept that silver sulfide is an n‐type (metal‐excess) semiconductor, the defect equilibrium may be considered as follows: which, applying the law of mass action, gives The substitution of a metal of higher valency than unity into the sulfide lattice would increase the number of excess electrons and bring out a decrease in the number of the interstitial monovalent silver ions, in accordance with the law of mass action. Since, as we have seen, the sulfidation of silver is parabolic, and the rate of reaction is controlled by the rate of diffusion of silver ions through the defect lattice, the reaction rate would be expected to decrease following this decrease in the Experimental evidence in support of these theoretical predictions has been given in the open literature along the last 30 years. It is now necessary to compare the application of the Wagner theory of alloying to p‐type (metal‐deficit) sulfide semiconductors. As an important industrial example, one might consider the formation of ferrous sulfide, FeS, during the sulfidation of iron. The defect structure of FeS has been discussed earlier. Here, the opposite effect to that observed for n‐type Ag2S would be expected, i.e. addition of metals exhibiting a valency of >2 should increase the number of vacant cation sites. Thus, in a situation where the growth of FeS is diffusion controlled, the rate of reaction would be expected to increase over that for pure iron for an iron‐based alloy containing such addition elements. On the other hand, addition of monovalent metals as alloying elements to iron should decrease the number of cation vacancies and slow down the reaction rate relative to the pure metal. However, when one considers the selection of metals that fulfill this valency requirement, other difficulties become apparent. First, it is implicit in the Wagner theory that the alloying addition, which must be present as a minor addition (i.e. in amounts insufficient to form a separate sulfide phase), must be freely soluble in the parent sulfide. A proper idea of the solubility, i.e. the ease of incorporation of the foreign ion, depends on the availability of appropriate phase diagrams or of other data that is not reported yet. Sulfidation experiments trying to reproduce the theoretical predictions led to complex results. By reviewing the works of Hauffe and Rahmel (1952), Foley et al. (1953), Lichter and Wagner (1960), Mrowec et al. (1966), and Spauschus et al. (1954), we notice that many of the reported data are in disagreement with the theoretical predictions of Wagner. It will be clear therefore that the successful development of sulfidation‐resistant alloys on the basis of rational theoretical considerations is limited. However, it would seem that even if the required data were available, often the theoretical analysis of the particular system would prove to be inadequate and oversimplified, so that in practice only a partial success could be expected. For all these reasons, a somewhat empirical approach to alloy development is unavoidable. Nevertheless, the development of sulfidation‐resistant alloys, based on the premise of the formation of a stable protective sulfide by selective sulfidation, would appear to be fairly successful, certainly when compared with the alternative approach based on the principles of Wagner. Following this avenue, Davin and Coutsouradis (1962), Hancock (1962), Setterlund and Prescott (1961), and others carried out sulfidation experiments on Ni–Cr, Fe–Cr, Co–Cr, Fe–Al, and Fe–Cr–Al alloys and others, but no satisfactorily accounted improvement results were obtained. Due to these difficulties, it is very important to select candidate materials to be used in S + H2S + RSH, H2 + H2S, and other high temperature sulfidation environments by monitoring their behavior in real industrial situations during their operation life. It seems to be appropriate now to review some of these materials that are used in calcining of mineral and chemical feedstock, petrochemical processing, fossil‐fired boilers, petroleum refining, coal gasification, waste incineration, fluidized‐bed coal combustion, and oil‐fired boilers (Hill and Black 1981; Lai 1985; Norton 1984; Rapp 1981; Sorell et al. 1986; Stringer 1986). Sulfidation behavior of metals and alloys in sulfur vapor environments has been studied generally at sulfur pressures higher than 10−3 atm. Studies of H2–H2S mixtures have been typically carried out at sulfur partial pressures less than 10−2 atm. Mrowec and Przybylski (1984) and Young (1980) gave excellent reviews on sulfidation in sulfur vapor and H2–H2S environments. Data generated in these types of environments (iron at 250–980 °C, nickel at 400–640 °C, cobalt at 500–1000 °C, chromium at 700–800 °C, iron‐, nickel‐, and cobalt‐based alloys in S2 and H2–H2S mixtures) are applicable only to industrial environments where sulfides, but not oxides, are thermodynamically stable. Improved sulfidation resistance for alloys with less than 40 at.% Cr at sulfur potentials greater than 10−2 atm was attributed to the formation of an inner sulfide layer: Fe(Fe2−xCrx)S4 for Fe–Cr alloys, chromium sulfides with nickel for Ni–Cr alloys, and chromium sulfides with cobalt for Co–Cr alloys. In alloys with higher chromium (40 at.%), a single layer of chromium sulfide (Cr2S3) was observed. In refineries, sulfidation, which is commonly referred to as a sulfidic corrosion in refinery industry, is a common materials problem, at temperatures between 260 and 540 °C. Sulfur compounds originating from crude oils include polysulfides, hydrogen sulfide, mercaptans, aliphatic sulfides, disulfides, and so forth (Foroulis 1985). The crude distillation units that process mostly sweet crude oils (<0.6% total sulfur, with essentially no hydrogen sulfide) experience relatively less sulfidation problems. More sulfidation problems are encountered in the distillation units that process mostly sour crudes (Gutzeit et al. 1987). The corrosion rates of the crudes and their liquid fractions can be predicted by the so‐called modified McConomy curves. Figure 8.3 shows the modified McConomy curves for liquid hydrocarbon streams containing 0.6 wt% (Gutzeit 1986). For hydrocarbon streams containing more than 0.6 wt% sulfur, the corrosion rate multiplier (Gutzeit 1986) can be used in conjunction with the data shown in Figure 8.3 for making the prediction of the corrosion rate of the various steels at different temperatures. Figure 8.3 Modified McConomy curves providing predicted corrosion rates as a function of temperatures for various steels in a liquid hydrocarbon stream containing 0.6% S (Gutzeit 1986). Hydrogen in hydrotreating, hydrocracking, and hydrosulfurizing processes is used to remove sulfur (to convert it to hydrogen sulfide) and nitrogen (to ammonia) for separation from the hydrocarbon stream. Hydrocracking processes combine desulfurization and cracking operation that can convert hydrocarbon feedstocks into various products. Sulfidation in these processing units is dictated by the H2S concentration in the H2–H2S environment. Sulfidation in H2–H2S environments is severe since the corrosion products are sulfides with no protection by oxide scales in these environments. Materials issues related to hydrogen attack are discussed in Chapter . Couper–Gorman curves are generally believed to provide the most practical correlation among corrosion rates, temperature, and concentration of H2S for various steels. These curves were based on a survey conducted by NACE Committee T‐8 on Refining Industry Corrosion (Couper and Gorman 1971). The modified Couper–Gorman curves (i.e. the original curves were extended to higher concentrations of H2S with dashed lines) for 5Cr–0.5Mo steels (also applicable to carbon steels) and 18Cr–8Ni steel are shown in Figures 8.4 and 8.5, respectively. It was found that total pressure between 1 and 18 MPa was not a significant variable. Gutzeit, Couper, and Gorman also observed that no sulfidation occurred at very low H2S concentrations and at temperatures above 315 °C because formation of iron sulfides in that regime is not feasible thermodynamically. Figure 8.4 Modified Couper–Gorman curves showing corrosion rates as a function of H2S concentration (mol%) and temperature for 5Cr–0.5Mo steel. The data is also applicable to carbon steels and alloy steels with less than 5% Cr (naphtha desulfurizers (Gutzeit 1986). Figure 8.5 Modified Couper–Gorman curves showing corrosion rates as a function of H2S concentration (mol%) and temperatures for 18Cr–8Ni steel (Gutzeit 1986). Sulfidation behavior of alloys in environments containing H2, CO, CO2, H2O, and H2S, and their gaseous components with oxygen and sulfur potentials high enough to form oxides and sulfides for most high temperature alloys, has been extensively studied during the 1970s, 1980s, and early 1990s when coal gasification programs have been actively pursued. Significant understanding of corrosion reactions in these coal gasification atmospheres having sulfur potentials of 10−5–10−10 atm and oxygen potentials of 10−15–10−20 atm has been achieved (Hill and Black 1981; Howes 1987; Humphreys and Schaefer 1983; Kneeshaw et al. 1987; Rothman 1985). In addition, a large engineering database on more than 80 commercial alloys has been generated. Many of these alloys were discussed by Verma (1985) who observed that chromium was the most important alloying element in resisting sulfidation attack. Breakdown of the protective chromium oxide scale resulted from the sulfides formed over it (Perkins 1980). Formation of liquid sulfide slag over the chromium oxide scale is most damaging. Manganese, iron, cobalt, nickel, and other alloying elements diffuse through the chromium oxide scale and react with the environment on top of the oxide scale to form external sulfides. This was proposed by Perkins (1980) as a possible mechanism for breakaway corrosion, schematically illustrated in Figure 8.6. In addition to outward diffusion of alloying elements to form external sulfides, the corrosion reaction also involves sulfur penetrating through the oxide scale to form discrete particles of sulfides in the matrix. Natesan (1983) showed that, for a given sulfur potential, there exists a threshold value for oxygen potential beyond which a continuous protective oxide scale is developed. This threshold oxygen partial pressure (kinetic boundary) is about 103 times the oxygen partial pressure for chromium oxide and chromium sulfide equilibrium (thermodynamic boundary). Figure 8.6 Formation of external sulfides on top of the chromium oxide scale and the formation of internal sulfides (Verma 1985). John et al. (1993) reported the corrosion data generated at 700 °C and 1 atm pressure for various commercial alloys in syngas environments that were rich in CO and H2 with low water. The data for various Fe‐, Ni‐, and Co‐based alloys at 700 °C and lower in CO–26H2–1.0CO2–0.9H2S–2H2O–10N2 shows that Co‐based alloys, such as alloys 25 (CO–20Cr–10Ni–11.5W) and 150 (Co–27Cr–18Fe), were not significantly better than Type 310 and but not as good as Type 446. Natesan (1993) found that molybdenum and TZM (molybdenum with 0.5Ti and 0.04Zr) formed very thin adherent sulfide scales when tested at 871 °C in a sulfidizing environment with low oxygen and high sulfur potentials. The beneficial effect of molybdenum in improving the alloy sulfidation resistance in the environments with low oxygen, high sulfur potentials would be of interest since molybdenum has been used in many high temperature nickel‐based alloys to provide solid solution strengthening for the alloy. Some of these wrought alloys include alloys X, S, 617, 625, and R‐41. Furthermore, molybdenum is also a major alloying element in Ni–Cr–Mo corrosion‐resistant alloys, such as C‐276, C‐12, 59, C‐2000, and 686. These Ni–Cr–Mo alloys contain molybdenum in a range of 13–16%. High levels of molybdenum in these Ni–Cr–Mo alloys can cause a thermal stability issue when used at high temperatures because of the formation of intermetallic phases during the long‐term, high temperature exposures. Most corrosion studies of SO2‐bearing environments have been conducted in either SO2 or O2–SO2 mixtures. Materials investigated include nickel, iron, cobalt, chromium, Co–Cr alloys, Ni–Cr alloys, and so forth (Hocking and Sidky 1987; Hocking and Vasantasree 1976; Sidky and Hocking 1987; Strafford et al. 1989; Vasantasree and Hocking 1976). Kofstad (1988) reviews the corrosion of pure metals and binary alloys in SO2 and SO2–O2, which form oxides and/or sulfides as corrosion products, strongly depending on temperature. The reaction rate generally peaks at a certain temperature and then decreases with increasing temperature. The highest corrosion rate is normally related with the formation of sulfides. Sulfides provide paths for rapid outward diffusion of metals, such as nickel, iron, chromium, and so forth, resulting in rapid corrosion attack. Chromium does not form sulfides in SO2 at temperatures from 700 to 1000 °C, but instead forms a Cr2O3 scale. Thus, chromium as an alloying element improves resistance in Co–Cr and Ni–Cr alloys. Many industrial processes that generate SO2‐bearing environments are generally at temperatures lower than 900 °C. Yates et al. (1994) tested alloys X (identified as HX Ni–22Cr–9Mo–18Fe), 617 (Ni–22Cr–12Co–9Mo–1.2Al), 230 (Ni–22Cr–14W–La), 198 (Co–22Cr–20Ni–14W–La), and 214 (Ni–16Cr–3Fe–4.5Al–Y) at 704 °C in O2–4% SO2 for more than 40 days. Based on their test results, Ni–Cr and Co–Cr alloys containing about 22% Cr are considered to have adequate corrosion resistance in O2–4% SO2 at 704 °C. All four 22Cr alloys (X, 617, 188, and 230) exhibited a parabolic reaction kinetics with low mass changes over more than 40 days of exposure, indicating the formation of protective chromium‐rich oxide scales. On the other hand, Ni–Cr–Al alloy 214 with only about 16% Cr showed some indication of breakaway corrosion. Not many investigators have tested commercial alloys in SO2‐bearing environments, particularly at low SO2 level (<1%), but these oxidizing environments generated by combustion of a sulfur‐containing fuel of feedstock with excess air or oxygen are generally less corrosive than reducing environments. Before concluding this section, it is worth noting that the Co–Cr alloys exhibited better resistance to corrosion than the other alloys, and it was suggested that it was due to the smaller molecular volume of the cobalt sulfide, the slow outward diffusion of cobalt ions, and the fairly high melting point of the cobalt–sulfur eutectic (Co–Co4S3 eutectic at 880 °C). It may be noted that the superior corrosion resistance exhibited by the Co–Cr alloys relative to the Ni–Cr alloys is of considerable interest in the context of gas turbine development. While the creep‐rupture strength of Ni‐based high temperature alloys is superior to that for Co‐based alloys at the intermediate temperatures of 900–950 °C, the cobalt alloys offer equal, if not slightly better, strength properties at high temperatures (950–1100 °C). However, it seems that the better sulfidation resistance of Co–Cr alloys may be the limiting factor and could finally influence the choice of material for turbine blades to attain the desired higher operating temperatures, depending upon the required operating life of the turbine. In Section 8.2, it was emphasized that the physicochemical properties of the sulfide scale formed on a metal entirely govern the process of sulfidation. Of particular importance is the defect structure of the sulfide, i.e. whether the surface‐layer compound is an n‐type (metal‐excess) or p‐type (metal‐deficit) semiconductor, since this largely dictates – certainly during the formation of a dense compact scale – the basic growth processes of the scale. When comparing the available data relating to the defect structures of metal sulfides, on the one hand, and of metal oxides, on the other, it becomes apparent that more fundamental studies have been attempted with oxides than with sulfides. In this section, a brief attention is given to the experimental methods used to provide these data. Then, the role of the defect structures and doping effect in modifying corrosion rate and protective properties of sulfide scales will be discussed with good examples of such situations. Information concerning the defect nature of oxide or sulfides may be obtained by carrying out specific experiments to provide various physical and chemical data, which, if viewed separately and in isolation, are insufficient, but which when considered collectively and as a whole yield a picture of the defect state of the material. It is possible to classify the methods that have been used and that are cited in the literature into two main groups: (A) those concerned with property measurements on the actual compounds themselves, i.e. detached from the metal and in fact often prepared “artificially,” for example, by the sintering of powders to produce pellets of the required material, and (B) those concerned with observing the manner in which the compound (the scale) is formed on the metal (essentially oxidation of sulfidation experiments under specific exposure conditions). The various experimental procedures within these two groups that may be used, together with the expected observations and the conclusions that may be drawn from such observations, are summarized in Table 8.1. Techniques involved in group A provide direct evidence regarding the defect nature of a compound, while those in group B can only be considered as providing indirect, complementary supporting evidence to that derived from group A experiments and involve the inherent assumptions required with the invocation of the Wagner model of scaling (see Section 8.2). Table 8.1 Experimental methods for assessing sulfide defect structures In Table 8.1, x is the term associated with the charge on the vacancies (equal numerically to 3, 2, or 1), and n is the number of atoms associated with the dominant molecular species. The stoichiometry of certain sulfides has also been established by the experimental techniques known as coulometric titration, whose underlying principles have already been covered by many investigators (Wagner 1953; Wagner and Wagner 1957; Wehefritz 1960). Concerning the nature of electronic defects in sulfide semiconductors, the measurement of the sign of the Hall coefficient or of the Seebeck or Peltier coefficient (the so‐called thermoelectric power) (Hannay 1959; Wagner 1933a,b) is sufficient to allow distinction between n‐ and p‐type semiconductors. These R and π coefficients shown in Table 8.1 are explained in the Glossary of the selected terms used in high temperature corrosion. To demonstrate that the defect structures and the doping effect may not only improve but also considerably worsen the protective properties of sulfide scales, changing simultaneously the temperature and pressure dependence of the sulfidation reaction, let us analyze a few of these phenomena. A first example is the case of Al–Mo alloy sulfidation. From Wagner’s theory of metal oxidation, it follows that, if the concentration of the predominant defects in the growing scale on a given metal is low enough that their mobility is concentration independent, the self‐diffusion coefficient of diffusing species depends in the same way on oxidant pressure as the parabolic rate constant of scale growth (Kofstad 1988). Thus, in the cases of Mo and Al–Mo alloys (e.g. Al–34Mo), sulfidation Kp (g2 cm−4 s−1) should be given by as found by Mrowec (2003). Here DS is the self‐diffusion coefficient of sulfide ions, Di is the defect diffusion coefficient, and Neglecting other defects, the electroneutrality condition is given by If where K is the defect equilibrium constant for the sulfidation quasi‐chemical reaction of defects formation: If Under these conditions, a very low point defect concentration in Al‐doped MoS2 increases more rapidly with increasing sulfur pressure than in the case of pure molybdenum disulfide (Eq. 8.16). Thus, similarly to Eq. (8.12), the parabolic rate constant of alloy sulfidation should be the following function of sulfur activity: From Eq. (8.13) it follows also that the effect of dopants depends not only on its concentration but also on sulfur activity. Concentration of native defects increases with increasing sulfur pressure, and consequently at any constant aluminum concentration, both limiting cases of the electroneutrality condition for the doped molybdenum disulfide (MoS2–Al2S3 solid solution) may theoretically be realized by appropriate changes of equilibrium sulfur pressure. At higher sulfur activities, the concentration of dopant may be too low to affect the defect structure of MoS2. With decreasing sulfur activity, the concentration of point defects in the sulfide decreases, and at sufficiently low sulfur pressure, an extrinsic region may be reached, in which foreign ions determine the electron hole concentration. The lower the dopant concentration, the less sulfur pressure is needed to pass from the intrinsic to the extrinsic region. A second example is the case of Mn–Cr alloy sulfidation. The predominant defects in manganous sulfide (Mn1−yS) are doubly ionized cation vacancies, and, consequently, three‐valent foreign ions (for example, chromium) incorporating substitutionally into the cation sublattice of the sulfide will increase the concentration of ionic defects and decrease electronic defects (Mrowec and Grzesik 2002): It follows that the concentration of cation vacancies in chromium‐doped Mn1−yS is higher than that in pure manganous sulfide, and the concentration of electron holes is lower. In other words, the growth rate of Cr2S3–Mn1−yS solid solution scale on Mn–Cr alloy should be higher than that of Mn1−yS scale on pure manganese metal. The electroneutrality condition for Cr2S3–Mn1−yS solid solution shows that when and the electroneutrality condition can be written as Thus, if the electron hole concentration by that of dopant When
Chapter 8
Sulfidation
8.1 Introduction
8.2 The Process of Sulfidation
 is less than 0, i.e. is negative, then it is reasonable to assume on the basis of the usual thermodynamic arguments that the reaction will occur spontaneously. In fact, since the standard free energy of formation of most metal sulfides is often negative at the elevated temperatures relevant to many environments containing sulfur, then corrosion may be expected as a natural consequence.

8.3 Sulfidation Kinetics
8.4 Sulfidation of Selected Materials
 concentration. An opposite effect might be expected for additions of metals of lower valency than that of the metal constituting the parent sulfide, e.g. the addition of silver to cadmium sulfide.
8.5 Defect Structures of Metal Sulfides
Experimental procedure
Observations
Conclusions
Group A: Physicochemical property measurements
(1) Determination of stoichiometry by:
(a) Chemical analysis
(b) X‐ray diffraction and density measurements
(c) Coulometric titration
See Wagner (1953)
See Wehefritz (1960)
(2) Electrical‐conductivity (K) measurements:
(a) On pure sulfides, as a function of sulfur activity
(a)  or
or 
p‐Type or n‐type
(b) On sulfide doped with addition of element A, at various (constant) temperatures
(b) Valency of A > valency of M
n‐Type or p‐type
K increased or decreased
Valency of A < valency of M
p‐Type or n‐type
K increased or decreased
(3) Hall coefficient (R) measurement at various (constant) temperatures
Seebeck coefficient (π)
R negative or positive
n‐Type or p‐type
π negative or positive
n‐Type or p‐type
Group B: Sulfidation experiments
(1) Assessment of the variation of kp with sulfur activity at constant temperature
 or
or 
p‐Type or n‐type
(2) Observation of the effects on kp of additions of alloying element (A) to basis metal M at constant temperature
Valency of A > valency of M
p‐Type or n‐type
kp increased or kp decreased
Valency of A < valency of M
n‐Type or p‐type
kp increased or kp decreased
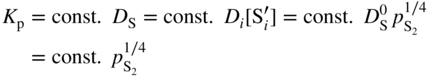
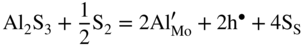
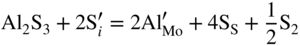
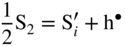
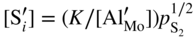
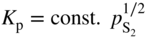
 are single ionized interstitial sulfide ions. Note that Di is a direct measure of defect mobility (Kofstad 1972; Mrowec 1980). In the case of Al‐doped MoS2, not only lower defect concentrations (Rau 1980) but also different pressure and temperature dependences are to be expected. Thus, assuming that the Al3+ ions are dissolved on regular Mo sites, the following defect equilibria may be described (Kröger 1974):
 ,
,  , which corresponds to the defect situation for pure MoS2+y; in other words the native (intrinsic) defect equilibrium in the sulfide is not affected:
 ,
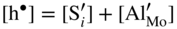
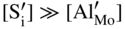
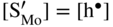
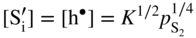
,  ; in other words the point defect concentration decreases, and the electron hole concentration is fixed by the dissolved amount of aluminum ions. From the simplified form of the electroneutrality condition and the value of K, it results
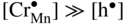 ,
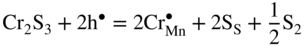
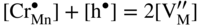
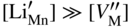
, 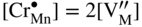 , that is, the higher sulfidation rate of Mn–Cr alloy should be pressure independent and the activation energy of this reaction must be lower than that of pure manganese sulfidation. In summary, in the case under discussion, the doping effect was negative. However, doping the same scale (Mn1−yS) by monovalent addition (for instance, lithium) may play a positive role. For the growing MnS scale on Mn–Li alloy, the quasi‐chemical reversible reactions (Grzesik and Mrowec 2006) are
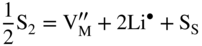
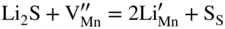
 ,
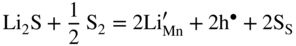
, 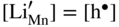 , and the very low concentration of cation vacancies in Mn1−yS–Li2S solid solution, and therefore the sulfidation rate of Mn–Li alloy, would increase much more rapidly with increasing sulfur pressure than that of pure manganese sulfidation. This results from replacing in the equilibrium constant Kv of the defect reaction of pure Mn1−yS
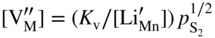
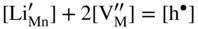
 ,
,  , which implies that in this case the rate of sulfidation of such a very diluted Mn–Li alloy should be virtually the same as that of pure manganese sulfidation. It follows that in agreement with Hauffe–Wagner theory (Kofstad 1988; Mrowec 1982), as already discussed for oxidation processes in Section 7.7.2, the protective properties of the sulfide scale on Mn–Li alloy are considerably better than on pure manganese due to the doping effect.
8.6 Questions
References
Further Reading
Sulfidation
8.1
8.2
8.3
8.4a
8.4b
8.5
8.6
8.7
8.8
8.9
8.10
8.11
8.12
8.13
8.14
8.15
8.16
8.17
8.18
8.19
8.20
8.21
8.22
8.23
8.24
8.25
8.26
8.27