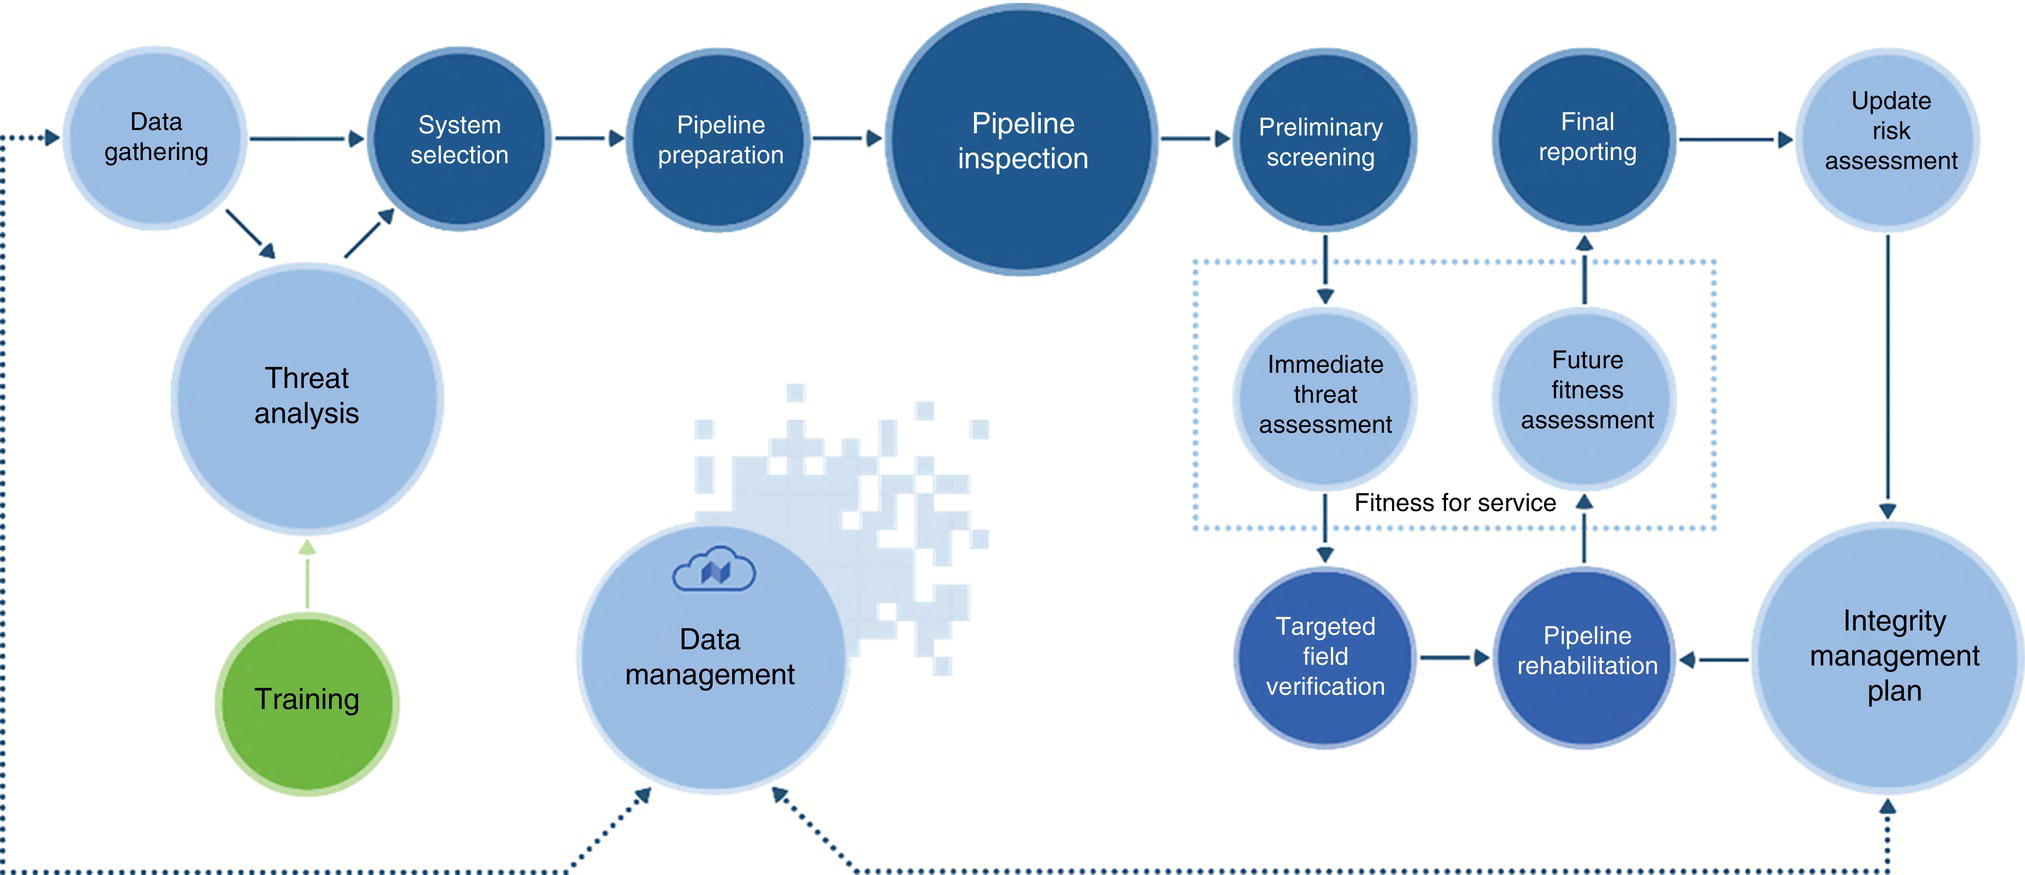
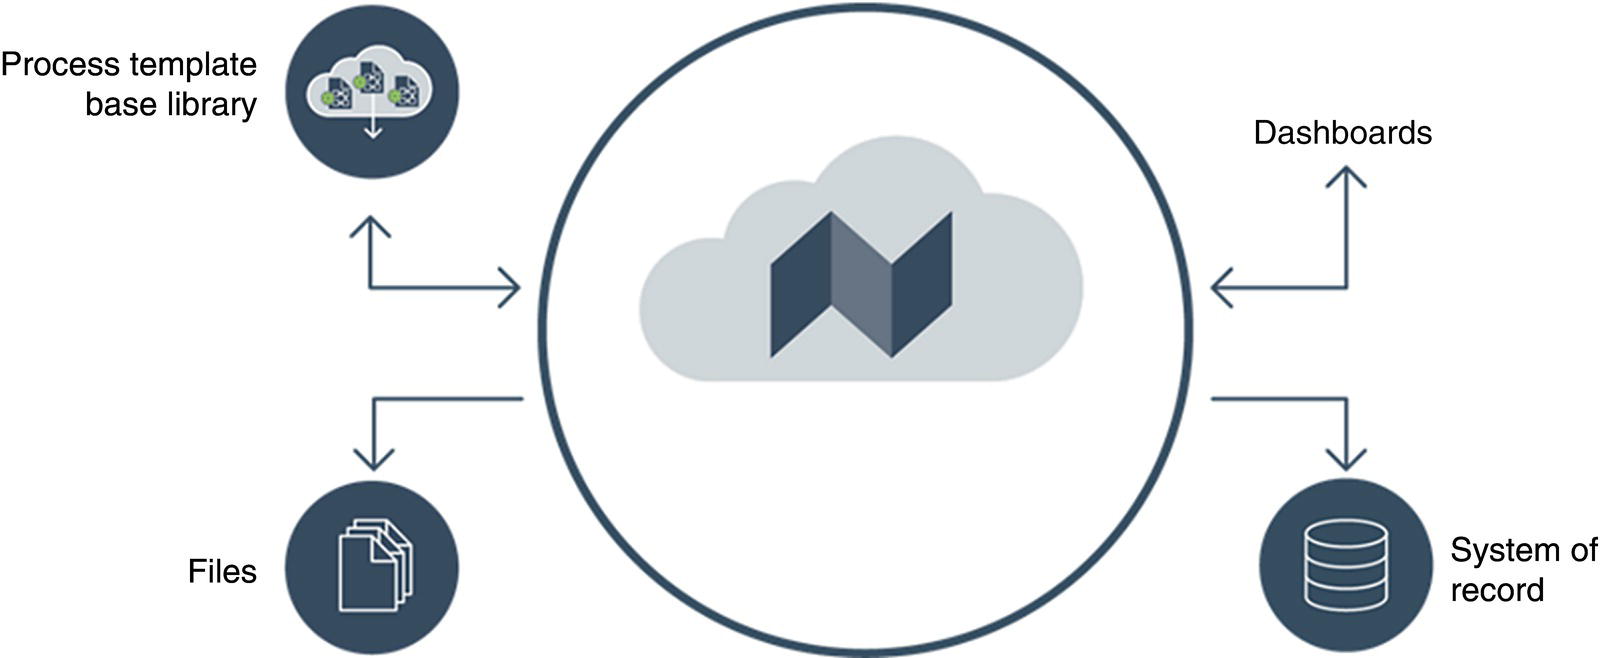
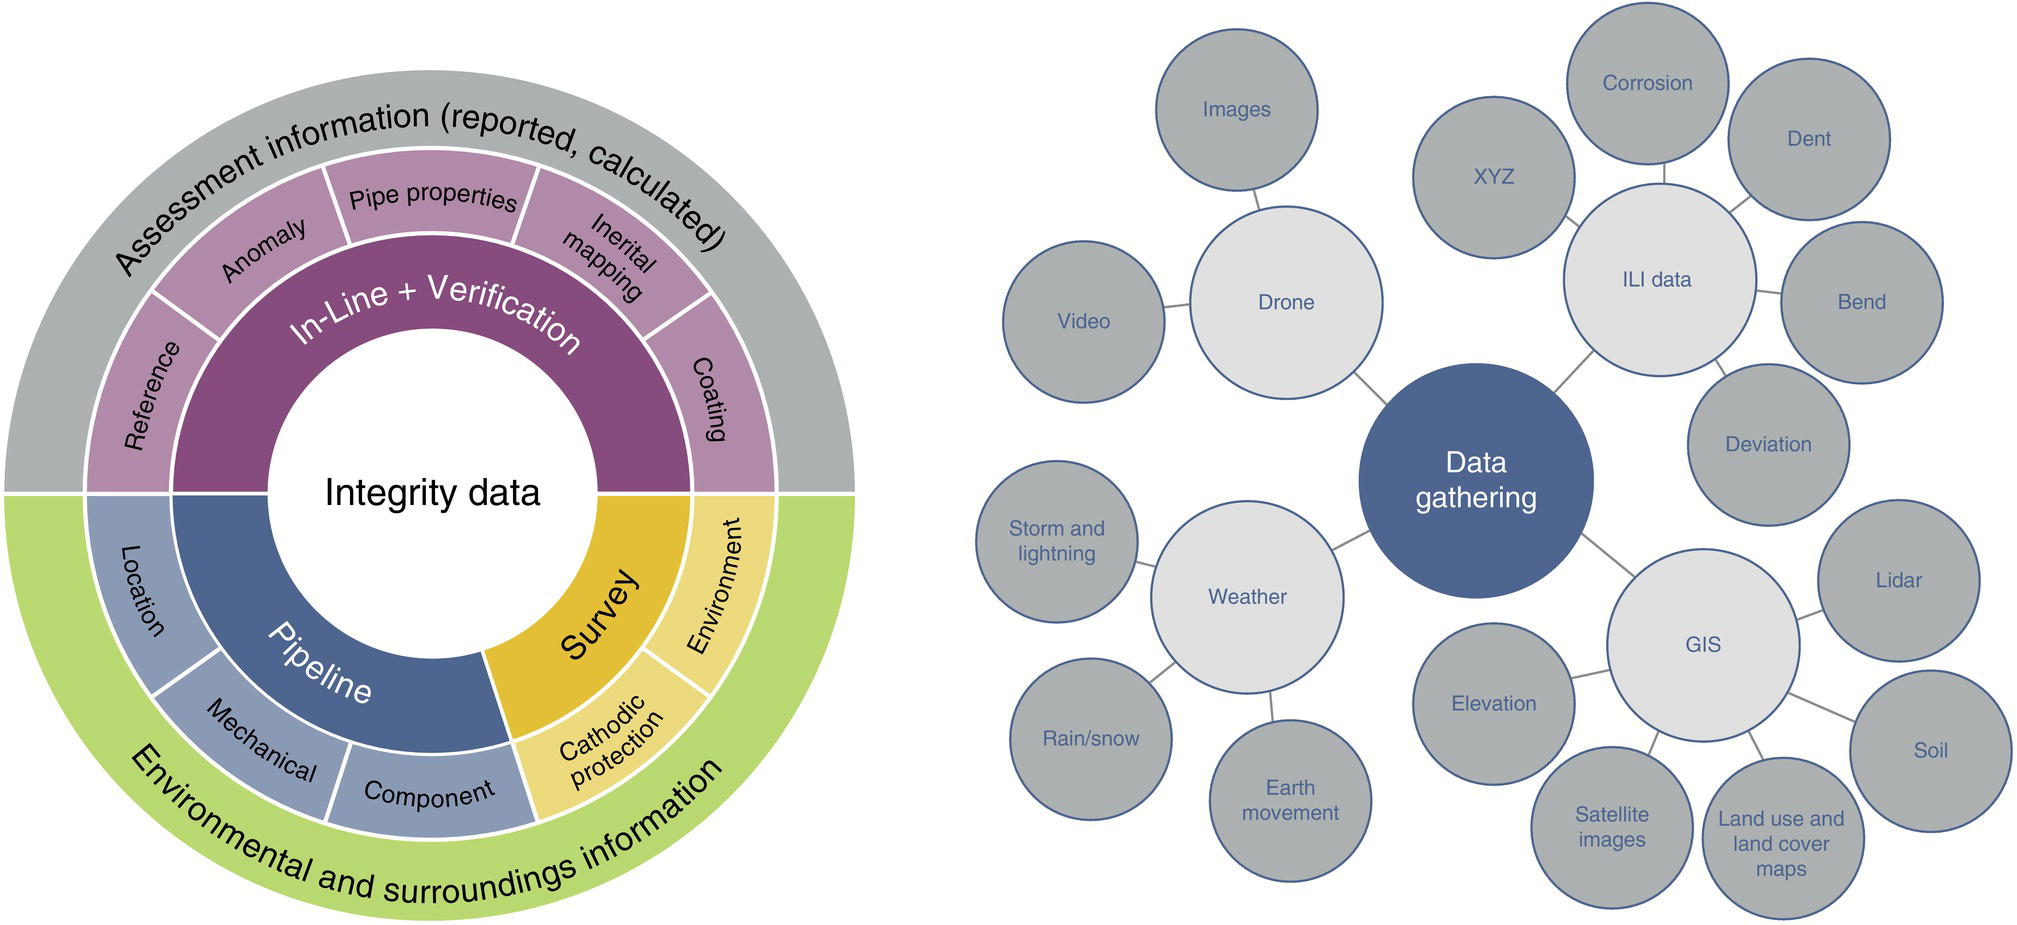
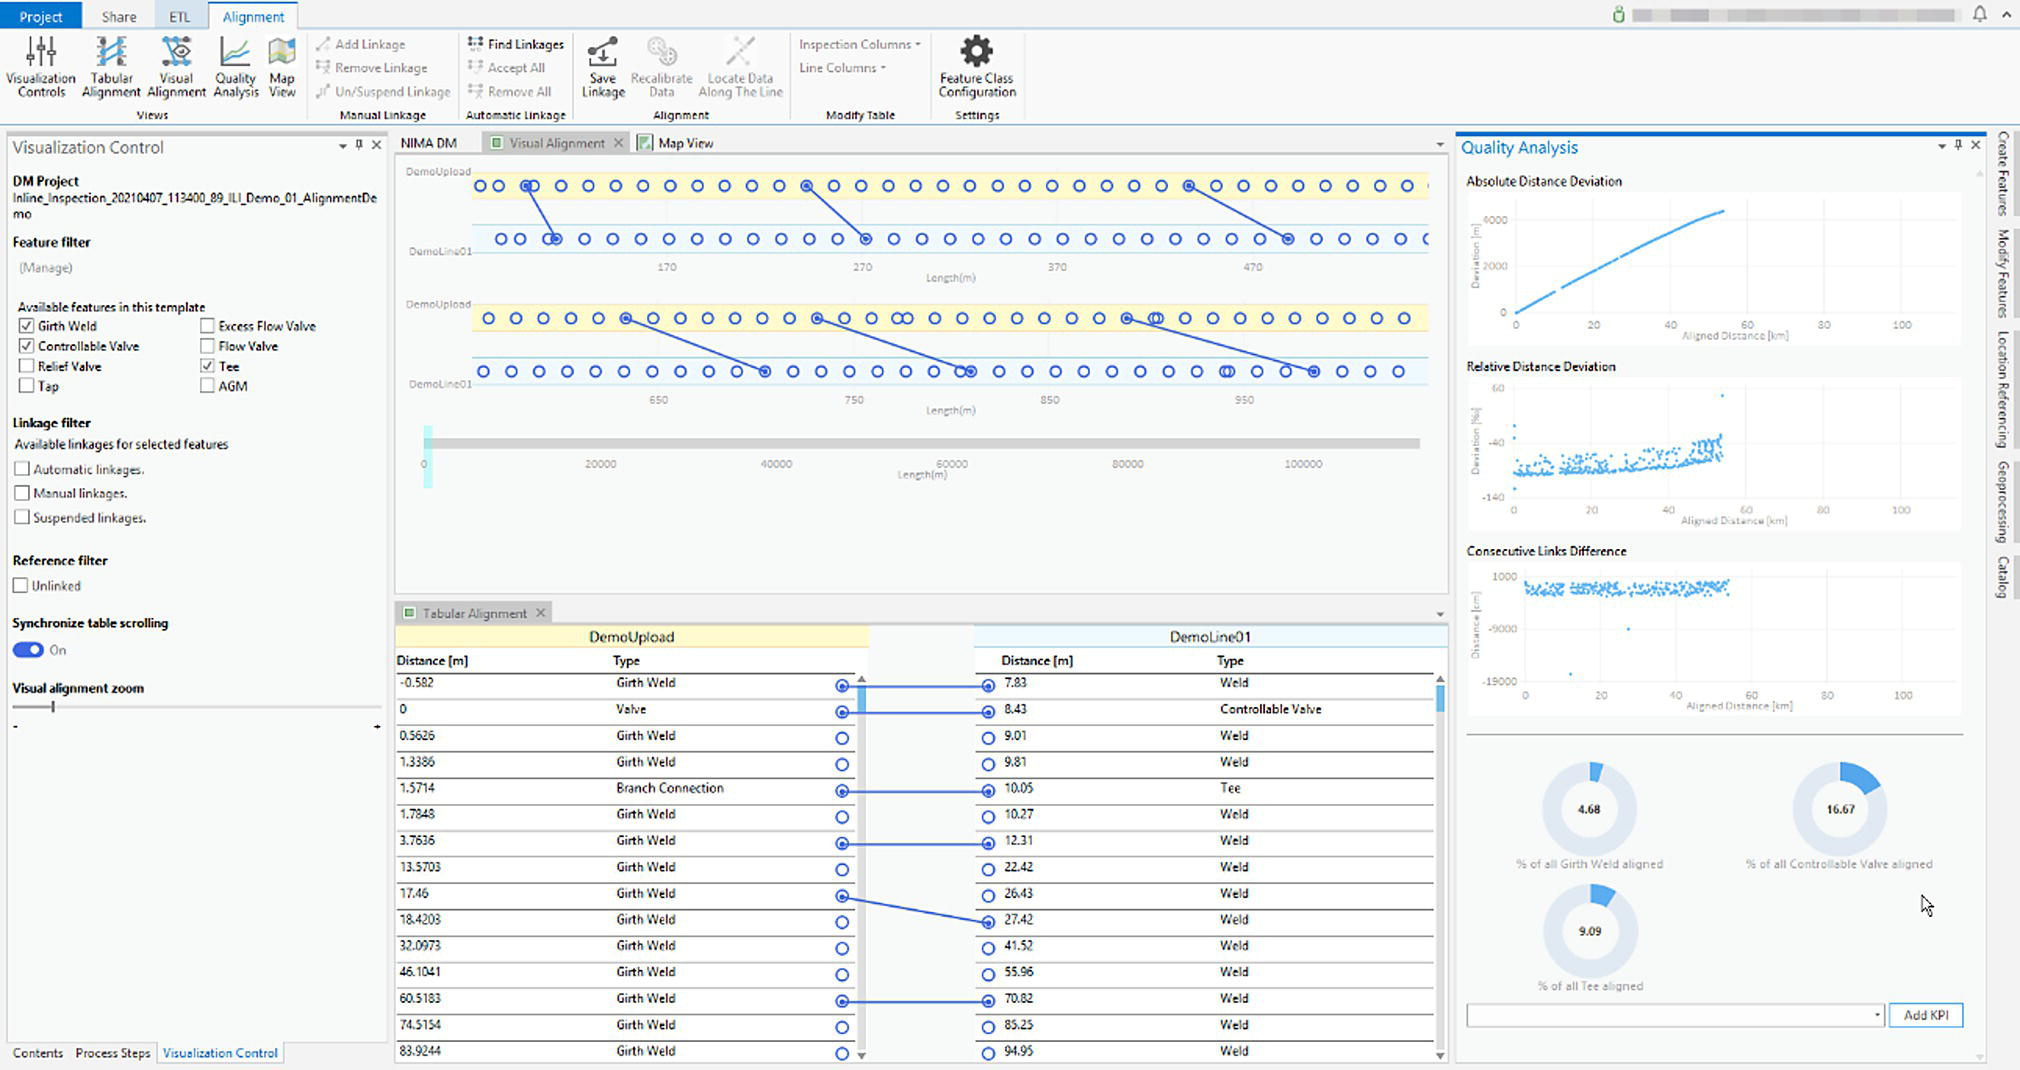
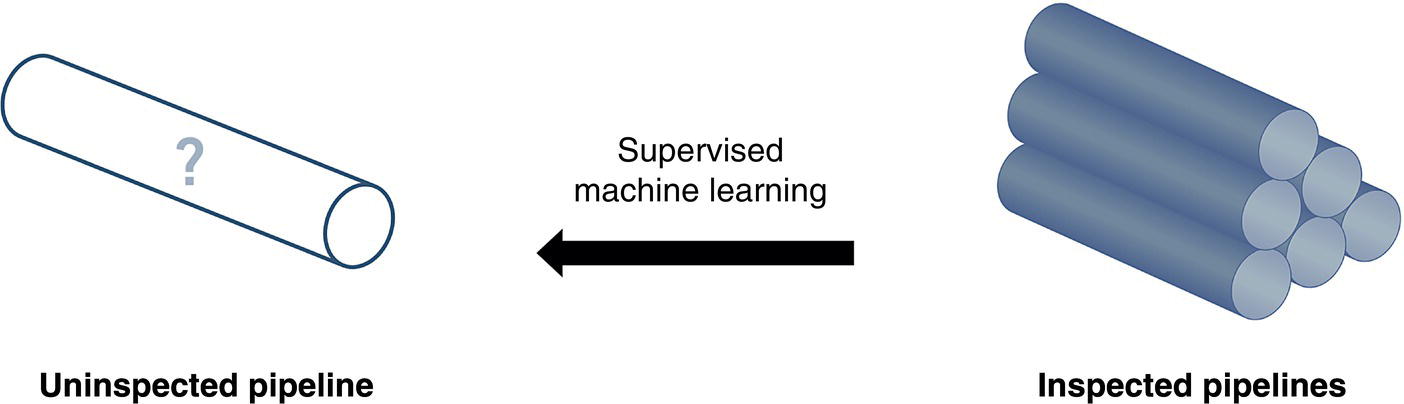
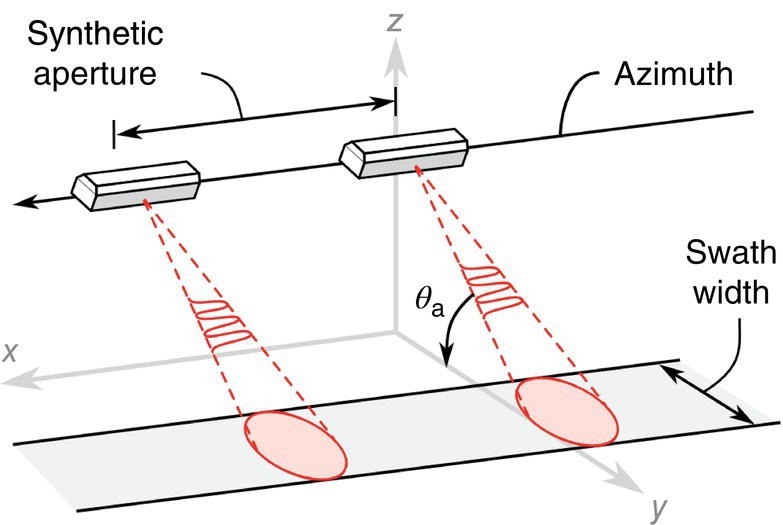
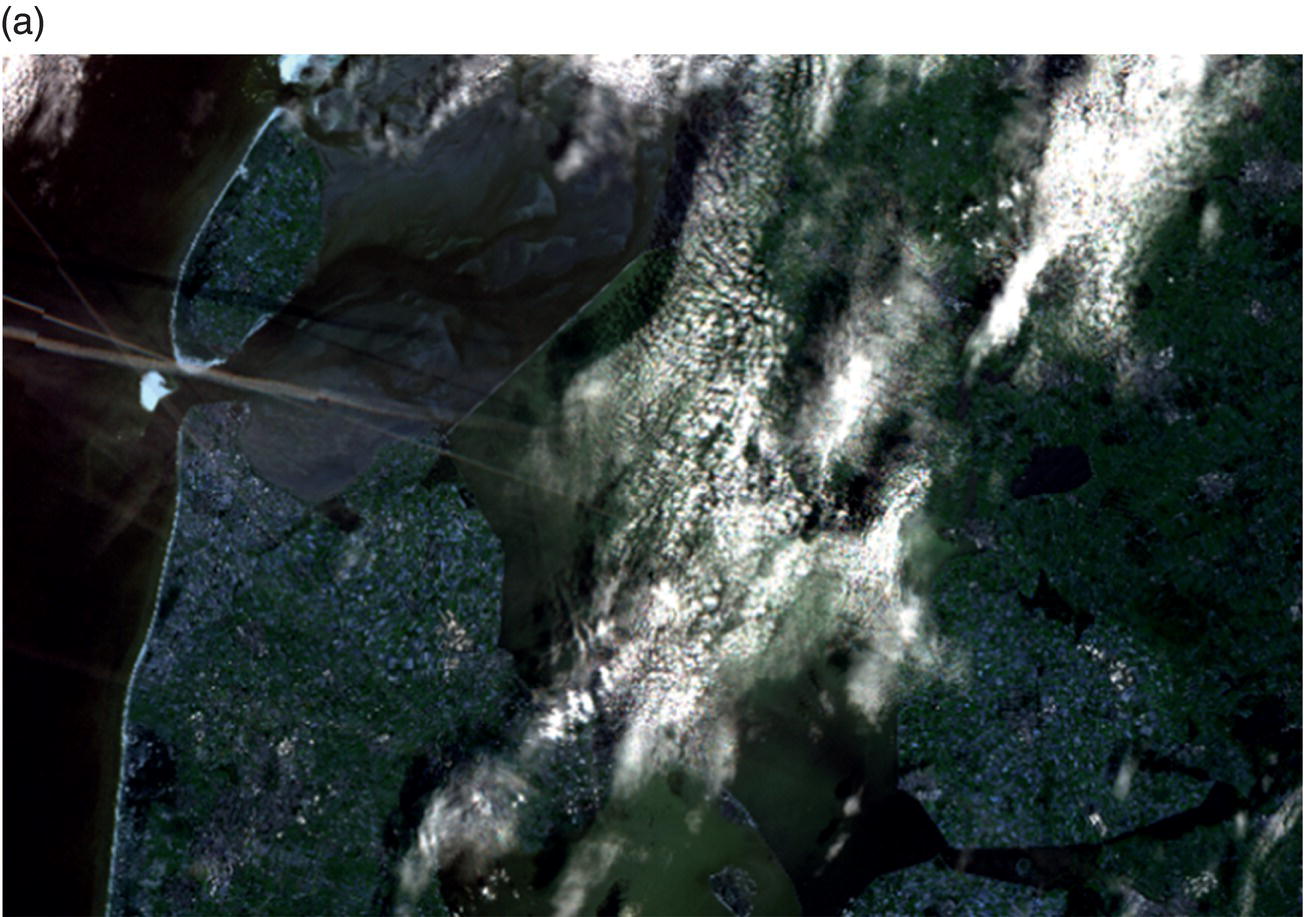
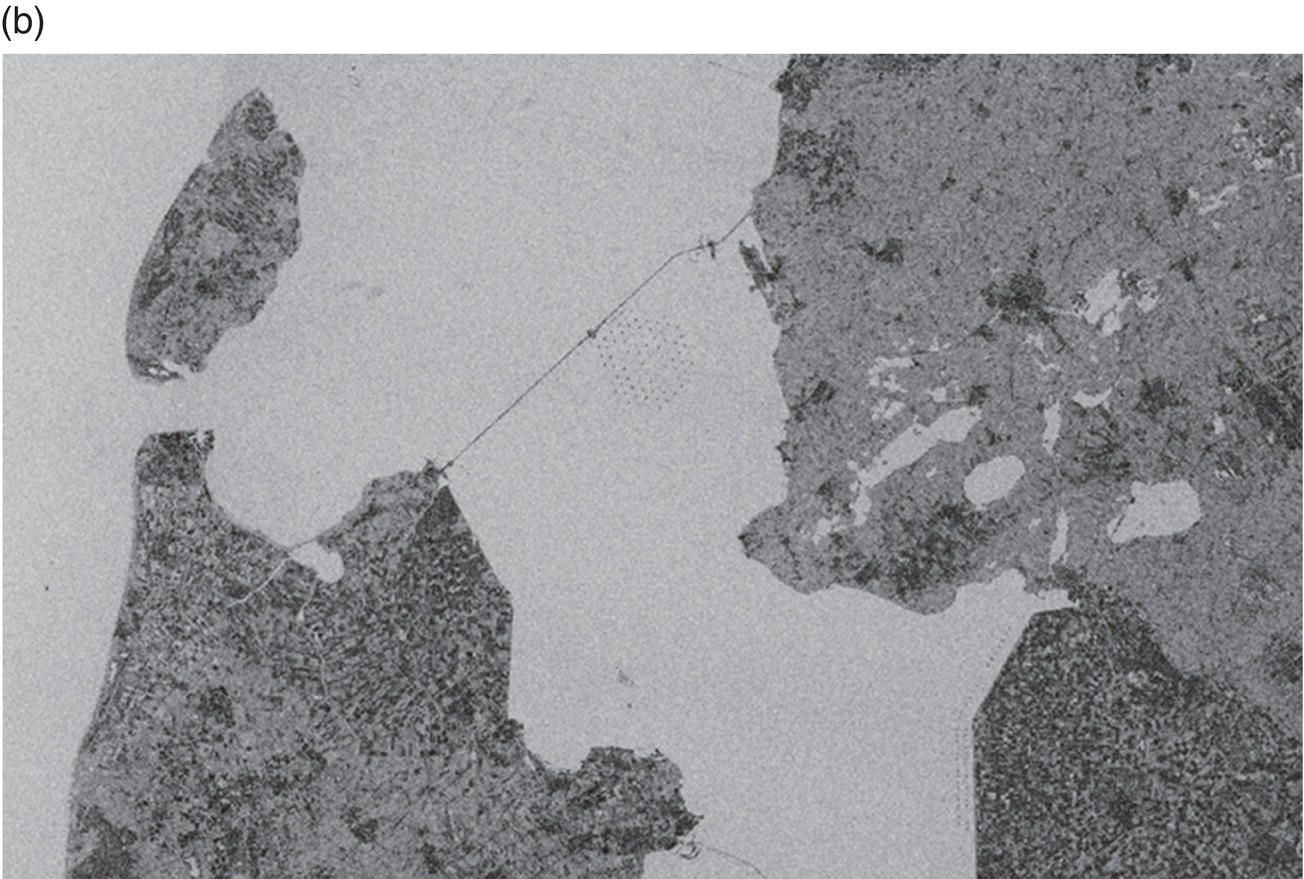
Gaurav Singh ROSEN Europe B.V., Oldenzaal, The Netherlands Over the last decade, integrity monitoring and assessment have gained in importance. Nevertheless, numerous high-profile safety incidents over the years have resulted in product releases and, in some cases, human casualties. These incidents have led to increased regulatory standards from governments and raised concerns among the public about pipeline integrity and the environmental impact of pipeline transportation. Most pipeline operators have integrity management plans set according to norms and obligations imposed by many governments, but the effectiveness of pursuing integrity management primarily depends on an organization’s budget [1]. The significance of pipeline integrity and structural health relies on numerous factors: data integration, threat identification, risk identification, and proactive decision-making to mitigate issues. These critical factors ensure a company’s optimum operations and successfully facilitate risk-based integrity assessment [1, 2]. Executing an integrated approach using existing integrity methods and digital monitoring technologies is challenging, which leads to a labor-intensive, lagging, and untargeted process for mitigation and maintenance activities [3]. There are two challenges in the integrated approach: The processes are followed by mapping, integrating, and managing the data. The process slows until the data is received from the operators or surveyors; time is lost until the identified risk is reported. Pipeline integrity has, in general, begun a digital transformation journey. New technologies and solutions are available to help pipeline operators achieve better and more feasible integrity solutions [2, 4], leading to safe and efficient operations using the uniquely designed framework approach discussed hereunder. A digital integrity framework consists of two frameworks that are generic enough and can be applied to any asset type. The first framework is a Pipeline Integrity Framework (PIF), which can be applied to any operating asset in order to find its current condition and how it can be improved. The second framework is a technological framework, which in conjunction with the first framework helps implement the digitalization processes in managing the assets. The purpose of this book is to focus on pipelines as an asset. Let us understand at both the frameworks a bit more in detail. A PIF is not something new in the industry; it has evolved from a simple plan-do-check-act exercise to a more detailed look at the identification and implementation of processes that are future-ready and can be easily integrated with evolving data and digital technologies. Figure 1.1 shows one such PIF, which can be applied to any asset with the end goal of ensuring safe pipeline operation. The framework approach [1] creates an opportunity for users to combine the competencies from different domains, such as inspection technologies (left side), digitalization and data management, and integrity expertise (right side), to mention just a few. Following the framework approach, one must also make sure that legacy data (records) is digitally stored in a system of record, which acts as a single body of “truth data” for integrity engineers to carry out the assessments. That is why data management is at the core of this framework, which helps in making compliance easier by ensuring that all inspection and integrity records are traceable, verifiable, and complete. It demonstrates that integrity assessments (e.g., risk models) comply with national and international standards; present a complete history of inspections, including Non-Destructive Evaluation (NDE) and repairs; and retrace the integrity assessment process and factors considered. Figure 1.1 Pipeline integrity framework (PIF). (Adapted from Ref. [1].) Figure 1.2 Digital framework for PIMS. Digitalization takes place when we break away from old practices—the legacy way of storing data in flat files, distributed systems, file folders on network drives, or in hard copies—and adapt to evolving digital technologies to collect, store, and analyze data that is accessible to all decision-makers in the organization. After all, the data is the property of the originator and not of a specific user group (e.g., inspection or integrity) within the organization. Keeping this as one of our focuses, we designed a digital framework approach for managing not just pipeline datasets but also datasets for other assets, such as tanks, distribution lines, and piping. The system of record where all the data sits is at its core. Our framework consists of two components, as shown in Figure 1.2: data management and integrity management. Data has become an intangible asset for many domains, and the pipeline integrity domain is not far from it. In fact, the pipeline integrity industry is one of the industries where huge amounts of data are generated and gathered throughout the life of the asset, right from the design stage to its operations and decommissioning stage. An example of the variety of integrity and other datasets gathered can be seen in Figure 1.3 which shows the variety of datasets one needs to conduct integrity assessments. Figure 1.3 Integrity data (left); additional datasets (right). In the language of data engineers, we can further categorize this as “data in REST” and “data in MOTION.” Data in REST are the data we collect by running In-Line Inspections (ILIs) or Non-Destructive Tests (NDTs), or even data that surround the assets. This dataset becomes snapshot data for the pipelines and provides the condition of the pipeline at that moment. Data in MOTION are the data we collect from sensors every second; this could be data related to pressure and temperature coming from the SCADA system, potential data from cathodic protection systems, ground movement data from inclinometers, leak detection data from live sensors, or even live audio-visual feeds from an incident site. All of this data can be stored in a database management system or in memory that can be accessed via cloud platforms/solutions or locally. Furthermore, one can classify data differently depending on the applications consuming it. With such a varied datasets, it is imperative to store it in a standard data mode, such as one proposed by Pipeline Open Data Standards (PODS) or Esri’s proprietary Utility and Pipeline Data Model (UPDM). Because ILI inspections are carried out by different service providers, it is important for an operator to linearly and spatially align all the inspections and survey data such that every dataset in the system is represented by the same distance measurement and each asset or joint has a coordinate attached to it. Providing a well-structured workflow supports data analysts with integrating, managing, and maintaining large amounts of location data and other asset-related data originating from different systems and in different formats. Data management is seamlessly integrated into GIS, providing the full power of ArcGIS Pipeline Referencing (APR), thereby enabling operators to manage route and event data effectively on multiple linear referencing systems. Data alignment is the final step for survey and inspection data. Visual and tabular views, together with real-time quality indicators (Figure 1.4), allow the user to monitor alignment progress and accuracy. Visual components involved in the alignment can be controlled by the user and stored as templates. In any integrity analysis, the alignment of the data, both spatially and linearly (for pipelines), is key to generate value from the data especially when used in Risk assessment [5]. Collecting, storing, and synchronizing datasets provides a wealth of information for engineers and decision-makers in the form of Key Performance Indicators (KPIs), as shown in Figure 1.5. These KPIs help the decision-makers to have a holistic view of the health of the assets and allocate investments where it is needed the most. Organizing the data in such a way is a first step toward the adoption of digital technologies or digitalization which would further accelerate the development of digital twin models. These activities are tracked in the system, offering a fully auditable data management platform. The process becomes even more powerful when leveraging cloud-based data storage and processing, making data, processes, assessment results, and visualizations available at our fingertips anytime and anywhere. Also, the data management platform should be data and vendor agnostics so that data-driven solution can be deployed and full value potential can be exploited. Figure 1.4 ILI data alignment and monitoring alignment quality. Figure 1.5 Operations management dashboards with KPIs. Integrity management is a continuous assessment process that is applied to an operating asset in order to avoid failure. For the operator, its purpose is to achieve: Typically, the assessments are based on codes and standards, such as ASME, NACE, BS, ISO, and the like. Reading these standards, using them for assessments, and later deducing information for decision-making need substantial years of experience in the industry, which is not an easy task. Therefore, the integrity management component of our framework allows for the configuration of autonomous definitions as well as the modification of integrity management processes and integrated algorithms as needed. Not restricted to a set of predefined functionalities, it presents the user with unlimited options in terms of adaptation to individual requirements, as new integrity processes can be created and existing ones altered at any point in time, thereby bringing flexibility when there is an update to the codes and standards mentioned previously. The process-based logic of the IM component follows the idea that each integrity assessment can be represented as a logical step-by-step process, whether the process is a relatively straightforward defect assessment calculation or a highly complex quantitative risk assessment. The process-based design ensures that the integrity engineer follows well-defined steps to generate meaningful results. The process-centric design guides the engineer (new or old) from top to bottom through the defined process steps of the assessment in a digitally savvy way. Once the assessments are carried out, the results can be visualized through the free definition of scenario-centric dashboards, which are combined visualizations consisting of charts, tables, maps, band views, and risk matrices, all interconnected with each other and configurable as per the user’s requirements. One such example of a dashboard is provided in Figure 1.6. To make smarter, more efficient decisions, we need three ingredients: data, processes, and people. According to ISO 55000, achieving excellence in Asset Integrity Management (AIM) requires clearly defined objectives, transparent and consistent decision-making, and a long-term strategic view. Specifically, it recommends well-defined policies and processes to bring about performance and cost improvements, improved risk management, business growth, and enhanced stakeholder confidence through regulatory compliance. In reality, processes are interpreted differently by different pipeline operators, and the workflows that make up these processes are often defined by individual engineers and subject matter experts (SMEs). Indeed, although different operators will all have the same fundamental objectives (e.g., zero failures, improved performance, and reduced costs), the processes they adopt to achieve those objectives will vary. For example, data management within individual companies will vary depending on the size of and skill sets within the company. Two challenges in developing a successful digital PIMS framework can be foreseen. First, just because integrity processes may well have been developed by SMEs, they may not be fully transparent throughout the company. Second, the datasets necessary to allow integrity assessments may not all be available at the same or even at the correct location, and they may not be correctly aligned. This can result in quite different integrity assessment results; it is dependent on the engineers conducting the assessments and the datasets utilized. Figure 1.6 Integrity management dashboard (immediate FFS). So, the digital PIMS platform should, ideally, seek to address both challenges by providing a framework-based approach where traceable, verifiable, and complete records are stored and aligned, together with the provision of standard and tailored integrity processes, created with the SMEs’ knowledge, that can be utilized throughout the organization. Therefore, consistent asset integrity assessments will be the norm throughout the company. To develop a digital PIF adhering to industry standards, the primary step is to have a data management plan. Figure 1.7 shows a data warehouse, which stores anonymized pipeline data consisting of ILI runs, design and construction data of the pipelines, operational parameters, and above-ground survey information from over 145,000 km of pipelines and counting. This accounts for 15,000 pipelines across the globe with internal and external defects, cumulatively comprising more than 11 million defects [1]. This number includes 100s of pipelines subject to Electro-Magnetic Acoustic Transducer (EMAT) and/or ultrasonic (UT) crack detection inspections, in addition to several thousand metal loss inspections (MFL, UT). This unique database provides information on where cracks or metal loss of different types can be found, as well as detailed knowledge of the variables that should be considered within data analytics studies (whether from ILI data, above-ground survey data, environmental data, and operational data). Simultaneously, analytical tools and techniques are developed and successfully implemented to handle big data. The data and tools efficiently improve pipeline integrity management by adhering to industry standards and providing decision-making solutions for the entire pipeline integrity lifecycle, right from data management to inspection selection to integrity management. The next stage in the application of data analytics is to understand what will happen in the future meaning predictive analytics, this is the stage where we take the trends we have seen in the descriptive analytics stage and use them to create relevant predictive models to predict what will happen in the future. In addition, by using these two stages we can—either independently as separate tools or as a combined tool (which is known as prescriptive analytics)—come to an informed decision about what we should do in the future. Applying sophisticated algorithms using machine learning techniques means unearthing new opportunities to find indicators that threaten the integrity of the pipelines and were previously unknown to the SME. Such techniques help operators move from time-based maintenance to more proactive, predictive pipeline maintenance, thereby also allowing substantial OPEX savings and planning for future CAPEX allocation. One of the simplest examples of descriptive analytics is benchmarking of pipelines. Figure 1.8 shows about 5000 pipelines plotted anonymously based on their external corrosion condition. The y-axis shows a number for anomaly density (as reported by ILI), and on the x-axis, we have the maximum depth. This plot provides us with a representation of prevalence (how widespread external corrosion is) and severity. Figure 1.7 Integrated integrity data warehouse (IDW). Figure 1.8 Benchmarking of pipelines using IDW. We have highlighted one particular network of pipelines where one can quickly identify which pipelines are good (left of plot—relatively low feature count/exceedance), bad (right of plot—relatively high feature count/exceedance), or average (somewhere in the middle) [8]. With appropriate metrics, the same technique can be used for any other measurable pipeline threat, including cracks, dents, and bending strain. The most obvious application of predictive analytics is gaining an understanding of the condition of a pipeline that cannot be inspected using ILI technology—which is a reality for half of the world’s pipelines. The goal is to predict the present and the future state of the pipelines. Historically, these pipelines have been managed with direct assessment techniques involving traditional modeling or susceptibility analyses, followed by direct examination in the field. Though effective at times, this is a costly process with no guarantee of success, especially if subsea pipelines are considered. We therefore tend to know relatively little about the true condition of uninspected pipelines, particularly when they are at the bottom of the ocean or buried underground. This is an example of how data analytics can bring real value—by learning from the condition of similar pipelines that have been inspected in the past, we can begin to understand the different variables such as coating type, pipe grade, CP potential, or soil properties that predict pipeline threats and develop models to predict the condition of uninspected pipelines at joint level. Predictive analytics describes the creation of a predictive model, which will be of the form: [8–12] where 𝑦 is the “target variable” and {𝑥𝑖} are the relevant “predictor variables,” which could be the properties of the pipe joint, environment, etc. For the purpose of locating and identifying a specific threat (corrosion or crack defects), the target variable will be anomaly classification. This target variable will be estimated for all reported crack-like anomalies in the target pipeline. The predictive model will be created using supervised machine learning techniques. In a supervised machine learning model, the relationship between 𝑦 and {𝑥𝑖} is learned using historical observations of the variables. This is recommended in cases where there is abundant “ground truth,” such as field verification results, with which to train the model. Supervised machine learning techniques include logistics regression, support vector machines, and decision trees. ILI can reliably detect a number of pipeline threats, but many pipelines across the world cannot be internally inspected due to constraints such as location, flow rate, tight bends, valves, tees, or any of the other features that traditionally create obstacles for an ILI tool. So, can a virtual inspection give us reliable information on what to expect from a real inspection by using data from inspected pipelines? Collecting data over the years and creating a data warehouse provides us the opportunity to look back into data and find various patterns (variables) that are responsible for features or defects in the pipeline. This is helpful in predicting the condition of a pipeline that does not have a provision to run an ILI tool (Figure 1.9). Results can be achieved by utilizing the latest digital technologies, including machine learning and data analytics. Figure 1.9 Overview of virtual ILI. Virtual ILI [9, 12] can be applied to any threats that can be detected via an ILI, such as predicting corrosion (internal or external). For external corrosion, for example, one would look at the density of the anomalies in old pipelines and its interactions with the CP system; in internal corrosion, the prediction could be based on various other variables, such as elevation, product type, pressure cycle information, soil condition, coating type, etc. One should be aware of the boundary conditions when using such machine learning techniques as they heavily depend on the availability of the actual parametric data like soil pH, soil type, coating condition, etc., which are required for the training of the machine learning models. Only good-quality data would generate conclusive results. Research [8–10, 12] suggests that machine learning models applied to external-corrosion condition metrics indicate a promising performance for virtual ILI. The approach is expected to be valuable for a variety of integrity management applications, thereby helping integrity engineers and pipeline managers needing timely and actionable information/reports to avoid potential problems. Remote sensing techniques make it possible to collect data from dangerous or inaccessible areas, with growing relevance in modern society. They replace slower, more costly data collection on the ground, providing fast and repetitive coverage of vast regions for routine applications ranging from weather forecasts to reports on natural disasters and climate change [13]. Remote sensing is also an unobstructed method, allowing users to collect data and perform data processing and geospatial analysis offsite without disturbing the target area or object. Monitoring of floods, forest fires, deforestation, vegetation health, chemical concentrations, infrastructure health, and earthquakes are just a few subjects in which geospatial remote sensing provides a global perspective and actionable insights that would otherwise be impossible. The data collection method typically involves aircraft-based and satellite-based sensor technologies, classified as either passive or active sensors. Responding to external stimuli, passive sensors gather radiation reflected or emitted by an object or the surrounding space. The most common source of radiation measured by passive remote sensors is reflected sunlight. Other common examples of passive remote sensors include charge-coupled devices, film photography, radiometers, and infrared. Active sensors use an internal energy source to collect data, emitting energy to scan objects and areas, after which a sensor measures the energy reflected from the target. RADAR and LiDAR are popular examples of active remote sensing instruments that measure an object’s distance before returning to establish an object’s location, direction, and speed [13, 14]. The data gathered are then processed and analyzed with remote sensing hardware and computer software (e.g., energy analytics and business intelligence) available in various proprietary and open-source applications. Simply put, the data are acquired and processed digitally. Therefore, the term used is digital asset monitoring [3, 4]. Typical digital asset monitoring involves data acquisition to report digitally, i.e., without conducting field surveys. The monitoring process is conducted in different sequential stages as depicted in Figure 1.10 and explained hereunder. The pipeline corridor is identified as an asset. The corridor’s location on a global scale is essential, as problems vary regionally. Primarily, geophysical factors are considered. For example, active earthquake and flood-prone areas significantly affect the pipeline asset on a global scale, boosting stress and external corrosion, respectively. Configured next is the intensity of the problems and which data will solve the problems. Figure 1.10 Stages of digital data monitoring. Satellite images from different sensors (wavelength) or existing aerial imagery archives are acquired. Satellite images are acquired regularly within precise time intervals. Consistency in obtaining data from satellites is essential for the accurate monitoring of assets. Increased processing power combined with more sophisticated algorithms create new opportunities for data analytics—conceivably delivering insights into previously unidentified threats to pipeline integrity. The data acquired is in the form of images. Image data processing is performed to detect changes in spatial and temporal dimensions. The advanced Computer Vision (CV) algorithm can detect minute changes in the pipeline corridor, scan each image pixel, and quantify the geometric variance of the assets and surroundings. In the next section, digital asset monitoring using RADAR technology is detailed. Satellite radar remote sensing technology is difficult to compare because lower-cost electronics are just beginning to make Synthetic Aperture Radar (SAR) technology economical for the monitoring of assets. The capabilities of SAR can overcome the limitations of satellite data, such as obstruction due to cloud and atmospheric interference [3, 15] as seen in Figure 1.12a. SAR systems take advantage of the long-range propagation attributes of radar signals and the complex information processing capability of modern digital electronics to provide high-resolution imagery, as shown in Figure 1.11. Figure 1.11 Basic principle of synthetic aperture radar, data acquisition along the flight (azimuth), and swath-width coverage on the ground. (Reference [16]/RCraig09/CC BY-SA 4.0.) SAR complements other optical imaging capabilities; it can accurately capture data at night and distinguish a target’s reflections of radar frequencies (Figure 1.12b). From a monitoring perspective, SAR technology provides structural terrain information to geologists for mineral exploration, oil spill boundaries on the water to environmentalists, sea state and ice hazard maps to navigators, and surveillance and targeting information [17, 18]. There are many other applications for this technology. Some of these, mainly civilian ones like environmental monitoring, land-use and land-cover mapping, and civil infrastructure monitoring, require extensive coverage area imaging at high resolutions [19]. SAR technology has not yet been adequately explored in the pipeline industry and is just beginning to become economical for downstream and upstream pipeline monitoring. Figure 1.12 Satellite data from (a) Multispectral sensor has limitations to penetrate the cloud cover; (b) Radar amplitude data are able to penetrate the cloud cover. An advanced time series technique using Interferometric SAR (InSAR) data can detect structural health in real time. A technique that permits the detection of infrastructure deformation laid on or near the earth’s surface, InSAR has been used extensively to measure displacements associated with earthquakes, sub-surface movement, and many other crustal deformation phenomena. An analysis of a time series of SAR images extends the area where interferometry can be successfully applied and allows the detection of smaller displacements, ranging from small time frames (for weeks) to long time frames (for years) [13]. InSAR can complement and even transcend ground-based measurements, which sometimes tend to under-sample the displacement field in spatial (GPS antennas are available only at specific points) or temporal (e.g., low frequency of leveling measurements) domains (Figure 1.13). The formidable advantage of space-borne InSAR is the ability to monitor pipelines nearly in real time. In addition, integrating InSAR results with ILI data can do wonders. It will strengthen the historical data for pipeline movements (drifts) and provide a concrete integrity assessment methodology to monitor unpiggable pipelines. Another significant advantage of integrating InSAR with IDW is that, a mitigation analysis model can be developed to predict the theft or rupture of a pipeline, i.e., where and when. These are some of the many questions operators ask while managing the pipeline integrity and, more specifically, during the times of energy transition when a new fuel (like H2) is to be transported using the existing pipelines. Figure 1.13 Interferometry SAR (InSAR) technique; measurements are acquired from different viewing angles at different times. (Reference [20]/Commonwealth of Australia/CC BY 4.0.) Embracing the advancements of emerging technologies can pave the way for a new digital business model focused on pipeline integrity. This model will bring forth fresh opportunities and lead us toward the complete digitalization of integrity practices. These technological advancements are rapidly evolving, enhancing operational efficiency and safety, while also necessitating the need to stay up-to-date with the latest trends. To maximize the benefits of this transition, organizations must update their skill sets, adopt a flexible approach, and effectively adapt to the transfer of technology. In addition, the structure and functioning of organizations will be significantly influenced by these changes. This is the essence of digital transformation, which will reshape work patterns in the foreseeable future. Further adoption of a framework-based analytics approach is revolutionizing how service providers engage with customers. By leveraging cloud-based data, the power of computation is harnessed to perform intricate algorithms, enabling professionals in the industry to access the results anytime and anywhere worldwide. This connectivity and data-driven approach unlock the full potential of professionals in the field.
1
The Digital Future of Pipeline Integrity Management
1.1 Introduction
1.2 Digital Integrity Framework
1.2.1 General Pipeline Integrity Framework
1.2.2 Digital Framework for Pipeline Integrity Management Systems
1.2.3 Data Management
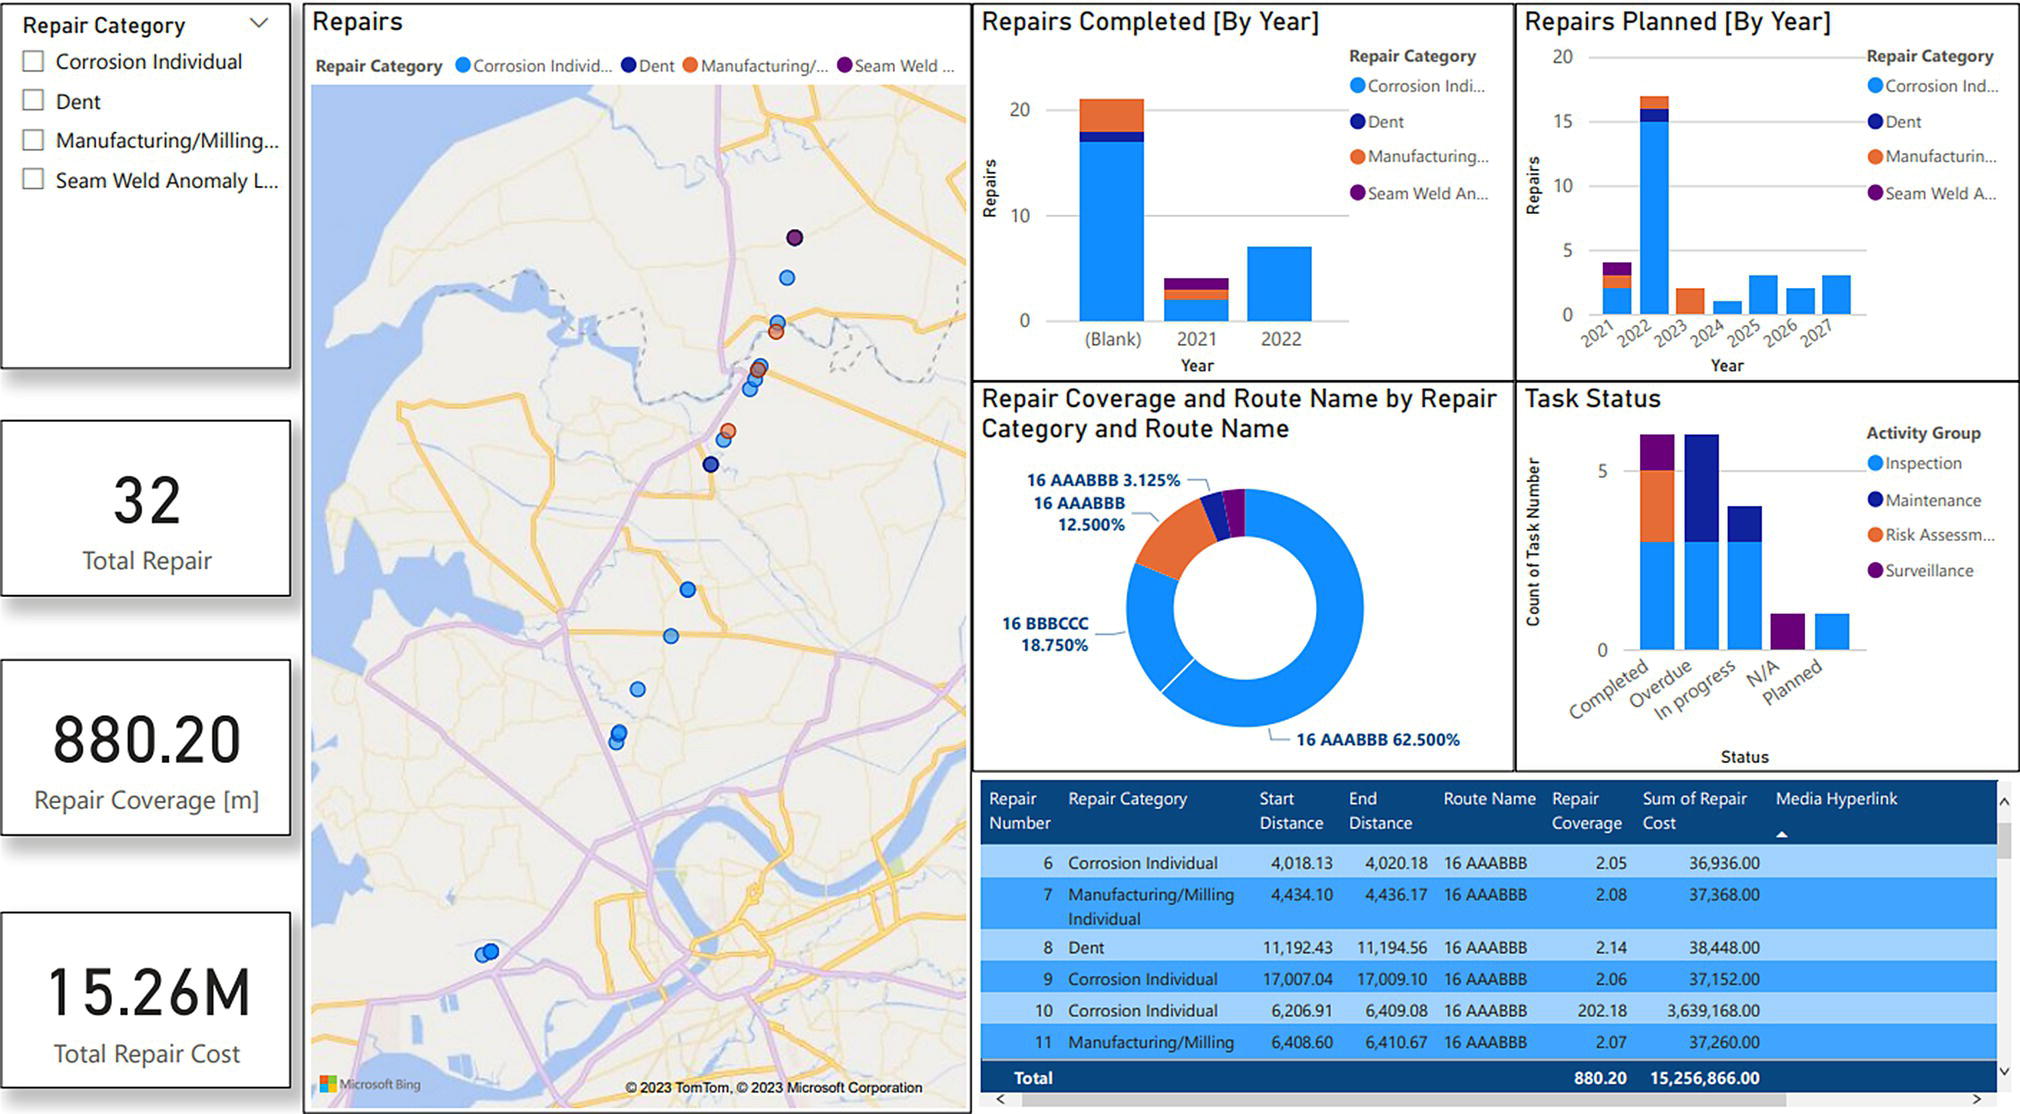
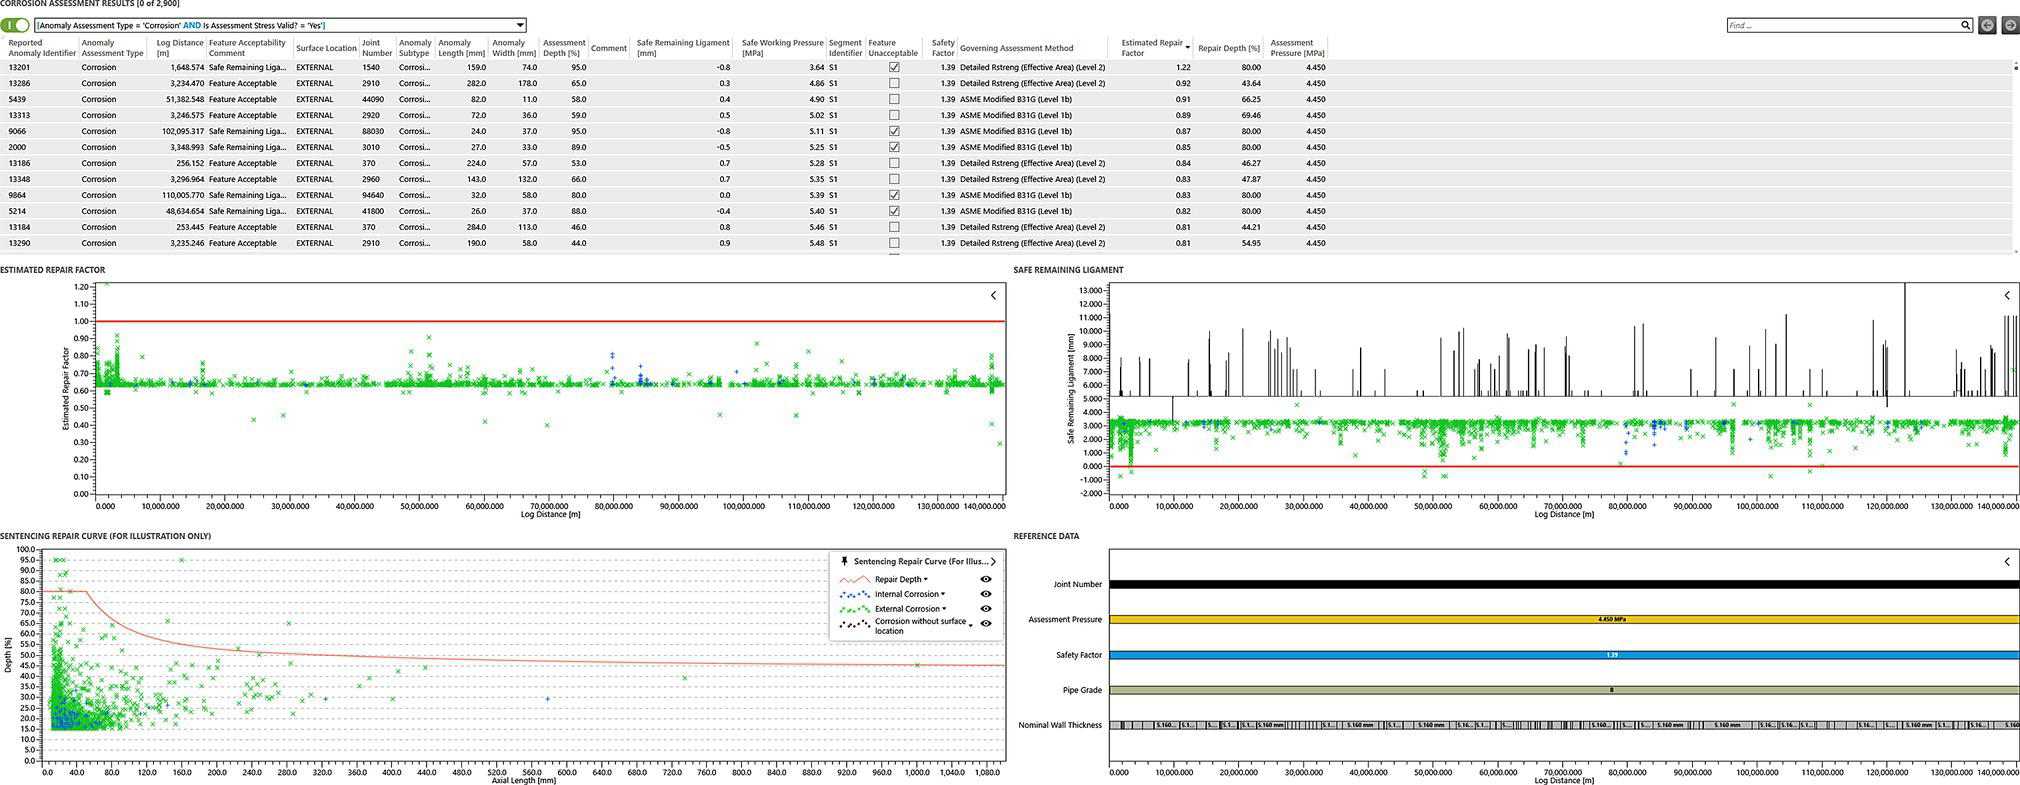
1.2.4 Integrity Management
1.3 Fast Forward Digital Future Technologies
1.3.1 Integrity Data Warehouse
1.3.2 Descriptive Analytics: What Has Happened?

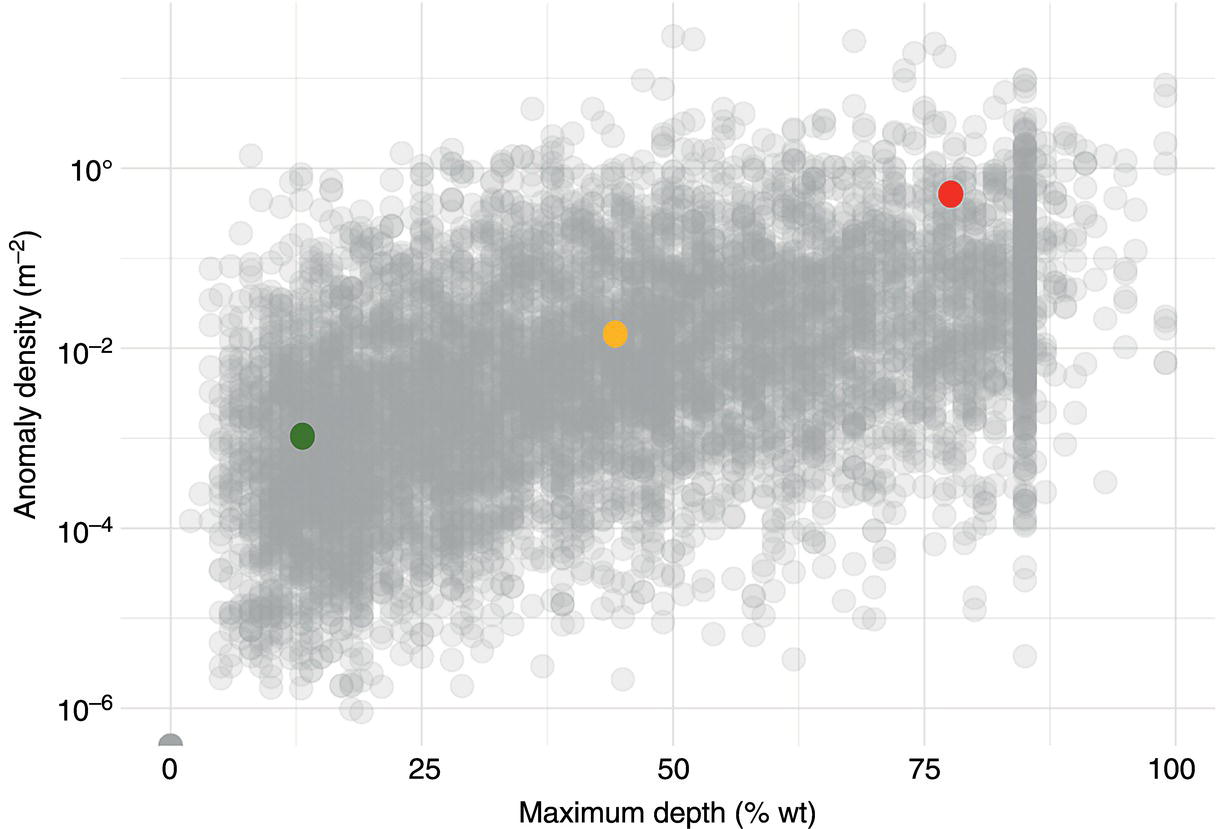
1.3.3 Predictive Analytics: What Will Happen?
1.3.4 Use Case: Virtual ILI
1.3.5 Space-Based Digital Asset Monitoring (Earth Observation)
1.3.5.1 Identification of Assets and Problems

1.3.5.2 Data Acquisition
1.3.5.3 Data Processing and Analytics
1.3.6 Radar
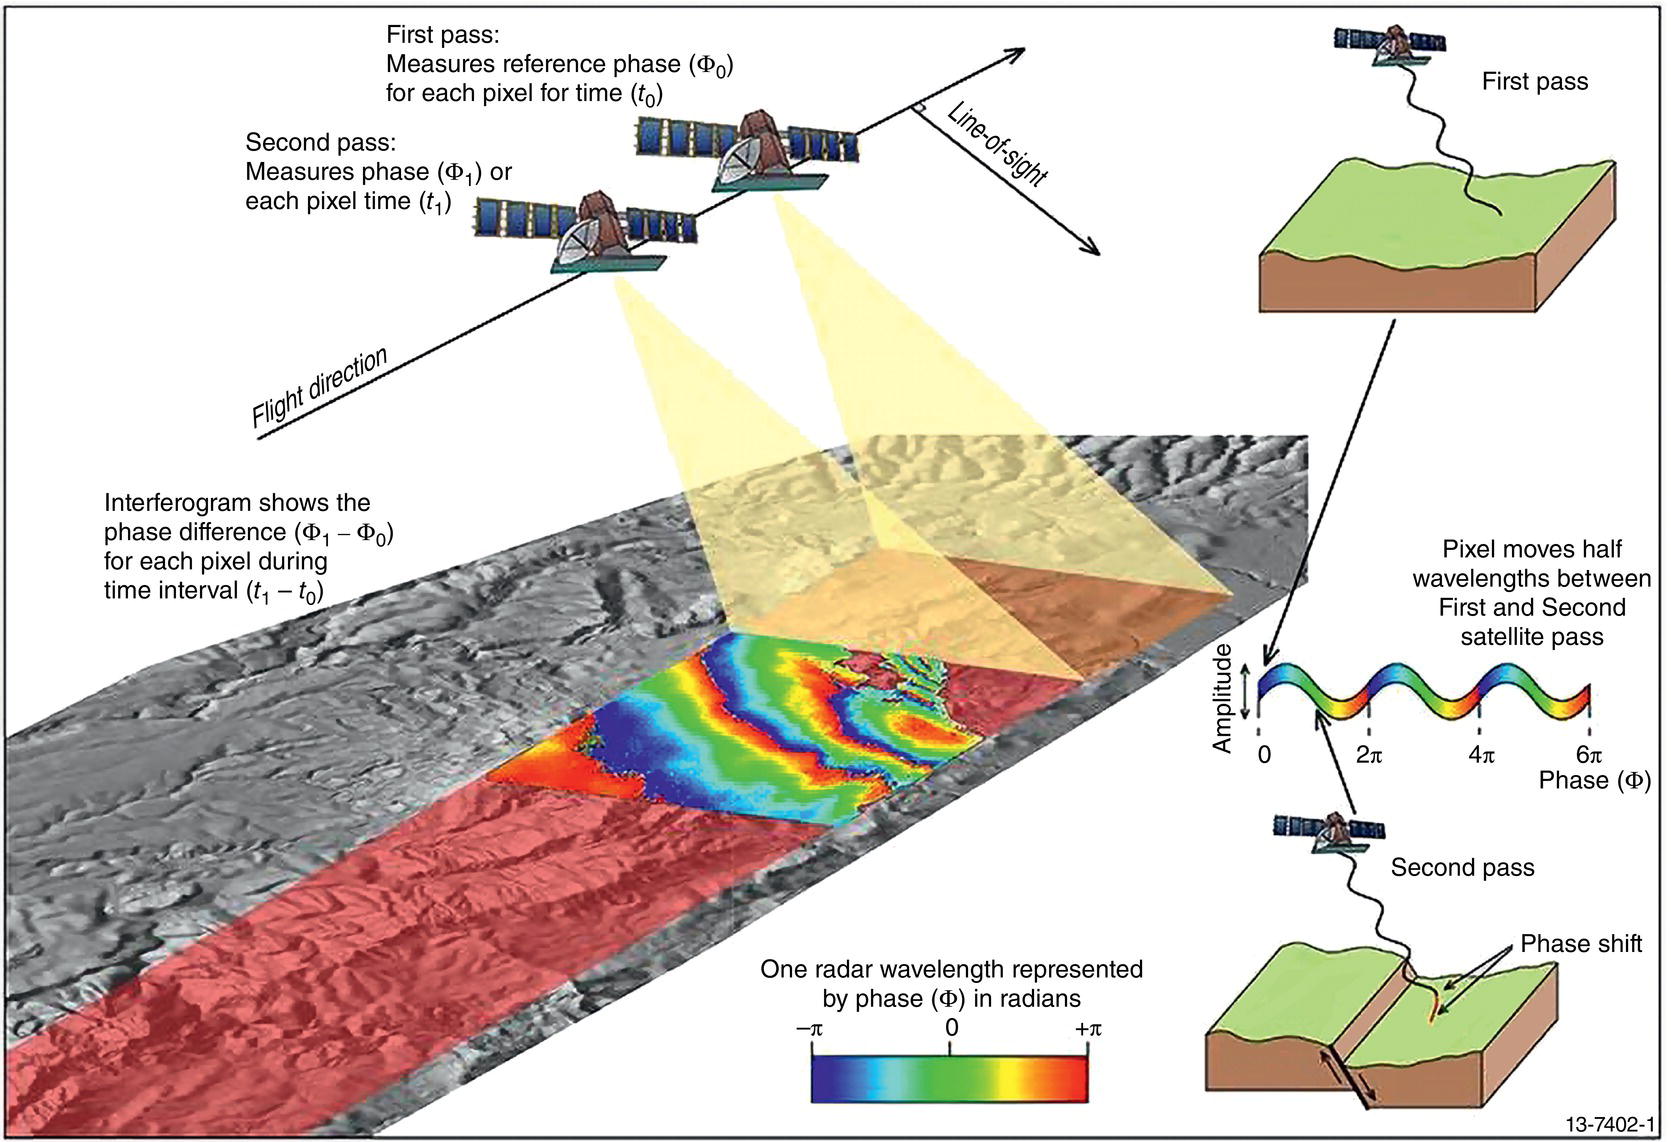
1.3.7 SAR Time Series
1.4 Technology Transition with Energy Transition
References
 (last accessed June 7, 2023).
The Digital Future of Pipeline Integrity Management
(1.1)