“If something doesn’t look right… it probably is not right” —(Ross Vail, presentation to AIChE) One of the very first checks at the doctor’s office is the patient’s temperature, which is central to the doctor’s diagnosis. The same applies when diagnosing the ills of distillation columns. The main difference is that in columns there are many more temperatures that can be measured, all of which provide invaluable input to the diagnosis. Decades ago, troubleshooters were totally dependent on column thermocouples for temperature measurement. Local indicators often read incorrectly, and contact thermocouples required long thermal stabilization periods to yield reliable information. Rapid developments in infrared (IR) thermography changed this, by bringing to our industry pyrometers (“temperature guns”) and IR cameras, which now enable troubleshooters to measure as many temperatures as they wish, even shoot “thermal videos.” There is only one problem: most engineers do not take advantage of this tool to its full extent. It is the author’s hope that this chapter will familiarize the reader with this important resource and demonstrate how valuable it is for diagnosing and solving column problems. Energy balancing is another invaluable technique. A correctly compiled energy balance does not lie, but can invalidate incorrect theories and lying measurements. The author was once humbled when an intern applied an energy balance to diagnose a problem that the author and his colleagues struggled with for months (216). The author then learned how important it is to compile these energy balances. It is his hope that future tower doctors will appreciate their importance too. Holes can be cut in the insulation around the tower, its auxiliaries, or its piping, and wall (skin) temperatures measured by an IR surface pyrometer or a thermal camera. These wall temperatures provide a wide range of invaluable diagnostics, such as testing theories, validating simulations, detecting packed tower maldistribution, and detecting liquid levels in reboilers, condensers, bottom sumps, and chimney trays. They can also provide invaluable information on flood determination, transient behavior, the presence or absence of a second liquid phase, accumulation of non-condensables in condensers, and many more. Such applications are discussed in this section. Successful temperature surveys require valid and reliable measurements. It is crucial to verify the data by extensive consistency checks. Invalid or unreliable temperature measurements lead to incorrect diagnostics. In one case, variations of more than 100°F along the circumference of a crude tower wash bed, which were interpreted as maldistribution, were caused by incorrect surface temperature measurements. The key to a successful temperature survey is reliability, repeatability, and consistency. Here are some guidelines for achieving them: Caution is required where thermocouples stick some distance into a packed bed and may therefore read temperatures that are different from those at the wall. Check the thermocouple specs and do not include them in the calibration if there is a reason to suspect that the wall and inside temperatures are different. There is often a discussion on what emissivity to set the pyrometer at. Usually, a high value, between 0.9 and 1.0, is set. In the author’s experience, this value does not make much difference when calibration is properly done, as calibration will make up for any errors in emissivity setting. Caution is required when calibrating packing temperature surveys. As stated in step 7, wall temperature may differ significantly from thermocouple temperature deep inside the bed. Also, maldistribution can be local. The best calibration points are on collectors or distributors (Figure 7.1), where the temperatures tend to be more uniform, or in vapor spaces. Figure 7.1 Circumferential temperature survey for packed towers. A preliminary test that may minimize the scaffolding requirements is to perform a radial temperature survey above each bed, or at least above some of the beds, or at elevations partially accessible from platforms. This survey can show which beds should be singled out for more detailed testing. At times, this survey will suffice to establish maldistribution, and eliminate the need for further tests and scaffoldings. One such survey above each of the three fractionation beds was reported for a refinery fluid catalytic cracker (FCC) main fractionator (134), with high to low temperature differences ranging from 48°F to 85°F. These high numbers established the existence of major maldistribution issues. In another FCC main fractionator (129), a temperature survey of one side of the tower was conducted near the top of a fractionation bed, and that of the opposite side near the bottom of the bed. Both showed high to low temperature differences of 100°F or more, which clearly established the existence of major distribution issues, eliminating the need for more detailed measurements. Even though the pyrometer laser spot projects on one point in the hole, the pyrometer averages the wall temperatures over a circle centered at that point. The pyrometer specs list the diameter of the circle. Circles 1.5 in. in diameter provide unreliable tower wall temperature measurements. Standard pyrometers draw circles that are ¾″ in diameter and are suitable. High-accuracy pyrometers draw circles as small as ¼″ in diameter and are recommended. The circle diameter varies with the distance between the pyrometer and the tower wall. Generally, the pyrometer is held 6–12 in. from the tower wall (follow the pyrometer specs for the best distance) to achieve the smallest circle. Some pyrometers actually show a light ring around the focal point to define the circle drawn on the tower wall. Do not hold the pyrometer closer to the wall than needed. The author has seen loss of measurement reliability when the pyrometer was heated up by the wall. Some of the author’s colleagues report success with sticking dull black low-chloride tape. The author has no experience with the black tape technique. This is the same tower discussed in Section 5.5.14 (89). As part of the troubleshooting endeavor, surface temperatures were measured along the wash bed (Figure 7.2a) circumference at three elevations. The three elevations selected were just under the wash reflux spray distributor, in the structured packing, and in the grid. The temperature profile (Figure 7.2b) showed severe liquid maldistribution, with a strong liquid bias (lower temperatures) on the northeast and a strong vapor bias (higher temperatures) on the south, west, and east. At the grid and structured packing elevations, the temperature differences exceeded 100°F. This cold spot on the northeast persisted at all three elevations, confirming the measurements’ validity. There was a temperature reversal on the northeast, with the structured packing temperature 20–30°F colder than the temperature at the distributor elevation above. On the southwest, northwest, and southeast, a structured packing temperature approaching the grid temperature indicated the drying up of the wall region below the structured packing measurement point. Figure 7.2 (a) Refinery vacuum tower that experienced wash bed packing damage. (b) Temperature survey in the damaged wash bed, showing a clear cold spot on the northeast and a hot zone on the south, west, and east. (From Duarte Pinto, R., M. Perez, and H. Z. Kister, Hydrocarbon Processing, April 2003. Reprinted Courtesy of Hydrocarbon Processing.) The described pattern can be indicative of either damage or severe maldistribution, or both. In this case, gamma scans conclusively showed damage (Section 5.5.14). Also, the column history described in Section 5.5.14 pointed to damage. The upper part of an atmospheric crude tower (Figure 7.3) separated a full-range naphtha (FRN) top product from a heavy naphtha (HN) side product drawn from the HN chimney tray below (89). A small side stripper D-124 stripped lights from the HN and returned them to the fractionator. The lower of the two packed beds in Figure 7.3 fractionated the FRN from the HN. The upper top pumparound (TPA) bed drew a hot liquid stream from the chimney tray underneath, cooled it, and returned the cooled stream to the top of the bed to perform direct contact condensation, providing reflux to the fractionation bed below. This reflux was supplemented by additional reflux condensed in the overhead condenser. In 1993, the tower was modified to lower the FRN end point, i.e., to move the heavy components in the FRN into the HN product. This lowered the crude tower top temperature by about 30°F and raised the HN product flow rate. Hydraulically, these adjustments loaded up the beds and raised the TPA heat duty. To handle the higher loadings, the trays in the lower fractionation bed were replaced by 6 ft of 250Y structured packings fabricated from 0.1-mm-thick 410 stainless steel, and the trays in the upper TPA bed were replaced by 4 ft of 125Y structured packing fabricated from 0.1-mm-thick monel. Figure 7.3 Atmospheric crude tower in Section 7.1.3. Temperatures shown are for normal operation. (From Duarte Pinto, R., M. Perez, and H. Z. Kister, Hydrocarbon Processing, April 2003. Reprinted Courtesy of Hydrocarbon Processing. Following restart, the TPA monel packing experienced severe corrosion due to an NH3 injection problem. The heat removed at the TPA, and the TPA draw temperature declined. In November 1994, all the TPA packing was replaced by in-kind. Amine injection into the reflux was started to prevent the recurrence of the corrosion. Beginning in June 1995, the TPA draw temperature again gradually declined from 278°F to 229°F. The heat removed in the top bed was down by 23%. To keep the FRN on-spec (end point at 295°F), the reflux needed to be raised from 12,000 to 15,000 barrels per stream day (BPSD). The following possible causes were considered: To diagnose the cause of the heat transfer loss, a sprays pressure drop test, a temperature survey, and gamma scans were performed. Sprays Pressure Drop Test This test, described in detail in Section 4.15, should always be the very first test when dealing with a spray distributor. The measured pressure drop of the TPA sprays at the operating flow rate was 17 psi, close to the 20 psi calculated from the spray vendor catalog. This ruled out either plugging or distributor damage as the sole root cause. For the sprays pressure drop to be close to the design, as was measured, either the sprays were functioning properly or both plugging and damage occurred simultaneously. So the second possible cause above has now become “simultaneous plugging and damage of the spray distributor.” Temperature Survey Surface temperatures measured around the tower circumference near the top, middle, and bottom of the TPA bed per step 14 in Section 7.1.1 are shown in Figure 7.4. Mid-bed temperatures were intermediate between the top and bottom at any vertical line (Figure 7.4a), verifying excellent consistency. Figure 7.4b is a more illustrative representation of the temperature data. For clarity, only measurements for the top and bottom elevations are shown in Figure 7.4b. Figure 7.4 shows severe maldistribution with a strong liquid bias on the north and northwest and a strong vapor bias on the southeast. On the north and northwest, liquid appears to descend with little heat pickup from vapor. On the southeast, vapor appears to ascend without any cooling. This test ruled out heat transfer loss due to TPA chimney tray damage or overflow. A chimney tray issue would have entrained liquid into the TPA bed or maldistributed vapor to it, but the bed would have still cooled vapor on the southeast and warmed the liquid on the north and northwest. Of the remaining causes, this test argued against corrosion. Corrosion can explain the cold region on the north and northwest; the corroded packing may have opened a gap through which the liquid fell with little contact with the vapor. But on the southeast, the rising vapor would have cooled down at least some by contacting the descending spray liquid. The observation that the vapor on this side rose without any cooling argues against the corrosion theory. This leaves the second cause as the front-runner, with plugged sprays on the southeast and header or spray damage on the northwest. As the evidence was not conclusive enough to rule out corrosion, it was decided to gamma-scan the bed. Gamma Scans The temperature survey guided setting the gamma scan chords. With the vapor and liquid biases peaking on the southeast and northwest, a grid scan with southeast and northwest chords (Figure 7.4b) is most informative. Further, to test the broken spray theory, the space between the spray distributor and the top of the bed (about 2 ft) was scanned at 1″ intervals (instead of 2″) per guideline 15 in Section 5.3. Figure 7.4 Temperature survey in the TPA bed (a) showing the bed top, middle, and bottom measurements. The consistency between the three elevations validates the observations. (b) An alternative, more illustrative representation. The middle measurements omitted for clarity. Also shown are the gamma scan chords. (Part (a): From Duarte Pinto, R., M. Perez, and H. Z. Kister, Hydrocarbon Processing, April 2003. Reprinted Courtesy of Hydrocarbon Processing.) The scan (Figure 7.5) showed the packing in place with no apparent large-scale damage. In the vapor space between the spray distributor and the top of the bed, the southeast and southwest chords showed very little liquid. The northeast chord showed a strong liquid bias throughout the packed bed and, most importantly, in the vapor space between the spray distributor and the packing. Along this chord, as well as along the northwest chord, some of the spray appeared to be entrained above the spray distributor. The northwest chord showed a very strong liquid bias just above the bed. Figure 7.5 TPA bed gamma scans, showing liquid bias on the northeast. In the space between the distributor and the top of the bed, there is a strong liquid bias on the northwest and northeast and a strong vapor bias on the southwest and southeast. (From Duarte Pinto, R., M. Perez, and H. Z. Kister, Hydrocarbon Processing, April 2003. Reprinted Courtesy of Hydrocarbon Processing.) These observations verified the temperature survey findings. The bed integrity visible in the scans, together with the liquid and vapor biases in the vertical space between the spray distributor and packing, ruled out packing corrosion. This left only one plausible root cause: spray distributor damage on the north–northwest, with spray plugging on the southeast. Inspection Based on this diagnosis, no replacement packing was ordered for the TPA. When the tower was opened up, the nozzles on the southeast were found heavily plugged, while the spray header was found broken on the north–northeast, as predicted by the temperature survey and gamma scans. Takeaways A thorough temperature survey, supported by judicious gamma scans and plant tests, led to a correct diagnosis. Prior to the temperature survey, the recurrence of the corrosion problem was the leading theory, the solution being 2–3 million US$ (1995 values) worth of packings replacement. The temperature survey and gamma scans disproved the corrosion theory, saving the refinery the cost of new packings. For maximum effectiveness, the temperature survey should be applied at three different elevations: near the top of the bed, near the bottom of the bed, and near the middle of the bed, per step 14 in Section 7.1.1. This procedure tracks the variation of the maldistribution pattern along the bed height and provides a superb consistency check for the measured data. An atmospheric crude tower (Figure 7.6) was revamped for clean fuel production and to process lighter crudes (237). In anticipation of additional naphtha (top product) production, the heat removal capacity at the TPA and mid-PA (MPA) was increased, and trays 21 and 22 in the MPA were replaced by high-capacity trays. Details of the changes and the reasoning behind them are in Ref. 237. Following the revamp, the TPA could not reach its target heat duty. Attempts to raise the TPA duty led to temperature and pressure drop swings over four to five minute intervals. The stove oil draw temperature to the side stripper swung 15–25°F peak to valley, and the MPA draw temperature 10–20°F, with smaller swings in other temperatures above the MPA. The pressure drop between trays 14 and 24 swung 0.1–0.15 psi, out of a total of 1–1.2 psi. These swings were never observed previously and were stopped by limiting the TPA heat duty at the expense of constrained naphtha recovery. Figure 7.6 The refinery crude tower experiencing instability. (From Kister, H. Z., D. W. Hanson, and T. Morrison, Oil & Gas Journal, February 18, 2002. Reprinted Courtesy of The Oil & Gas Journal.) Simulated stove oil temperature was about 15–20°F hotter than measured. This was explained by mixing the liquid from the trays above with some cold MPA return, which could enter the stove oil draw sump. To gain insight, wall temperatures were measured by an IR surface pyrometer (Figure 7.7) and compared with the control room thermocouples (all temperatures prefixed by “CR,” meaning control room, in Figure 7.7). Where both were available, the agreement between most was excellent. The wall temperature profile (Figure 7.7) looked normal, with temperatures continually rising down the tower, with one exception: the stove oil draw temperature was 20–30°F colder than tray 24 above and 10–20°F colder than tray 26, three trays above. Tray 23 liquid and vapor wall temperatures were measured, and appeared normal and consistent with those on trays 22 and 24. The only conceivable cause for the colder stove oil draw temperature was the mixing of hot liquid from tray 24 (425°F) with cold MPA return liquid (325°F). This was in line with the simulation findings. A heat balance or simple mixing calculation determined the fraction of cold MPA return mixed with the tray liquid. To give a draw temperature of 400°F, 75% of the draw liquid needs to come from tray 24 above (at 425°F), 25% MPA return (325°F). A wall temperature time study (Figure 7.8) provided insight into the nature of the swings. Upon increasing the TPA heat duty, tray 23 vapor temperature and tray 24 downcomer liquid temperature cycled with the stove oil draw temperature, peaking when the draw temperature valleyed and vice versa. The difference between the tray 24 downcomer temperature and the draw temperature changed from 10°F to 30°F during a cycle. Figure 7.7 Steady-state temperature survey of the refinery crude tower experiencing instability. (From Kister, H. Z., D. W. Hanson, and T. Morrison, Oil & Gas Journal, February 18, 2002. Reprinted Courtesy of The Oil & Gas Journal.) Application of a heat balance or simple mixing calculation to the hot tray 24 downcomer liquid and the cold TPA return temperature led to an important finding: during a cycle, stove oil draw varied from 30% MPA and 70% downcomer liquid when the stove oil was 30°F colder than the downcomer liquid, to 10% MPA and 90% downcomer liquid (when the difference between the temperatures was 10°F). The temperature cycles therefore reflected changes in the fraction of MPA return liquid in the stove oil draw. Figure 7.8 Temperature survey time studies of the stove oil draw temperature swings. (From Kister, H. Z., D. W. Hanson, and T. Morrison, Oil & Gas Journal, February 18, 2002. Reprinted Courtesy of The Oil & Gas Journal.) This explained the temperature swings on tray 23 and in the rest of the tower. When more MPA return was drawn at the stove oil draw, the temperatures above warmed up. When less MPA was drawn, the temperatures above cooled down. A key observation was that at lower TPA duties, the stove oil draw was steady at 400°F, indicating 25% MPA return and 75% tray 24 downcomer liquid in the draw. When TPA duty increased beyond a certain value, the stove oil draw temperature would slowly rise. An increase in draw temperature would indicate imminent swings. Swings would initiate when the draw temperature reached about 423–425°F (as measured by the control room thermocouple). As the downcomer liquid from tray 24 was 425°F, this suggested that at the onset of the swings, the stove oil draw mostly contained downcomer 24 liquid and little MPA return. Figure 7.9 Root cause of the instability. (From Kister, H. Z., D. W. Hanson, and T. Morrison, Oil & Gas Journal, February 18, 2002. Reprinted Courtesy of The Oil & Gas Journal.) Figure 7.9 shows the stove oil draw sump, with a detailed description elsewhere (237). The center downcomer bringing liquid from tray 24 to the sump extended the full tower diameter for the first 22 in. of elevation, then the downcomer was stepped down, so its first 30 in length near the tower wall on the draw nozzle side was closed off with a solid side wall. The 18 in. long stepped-down downcomer terminated 4 in. above the sump floor. Liquid exiting the downcomer flowed under the downcomer walls. The path toward the nozzle was restricted both by the relatively small opening in the draw direction and by a 5 in. weir (Figure 7.9). Due to the restriction, some downcomer liquid turned upward, ascended, and overflowed the sump walls (the upward arrows in Figure 7.9). It was replaced by the MPA return liquid that entered the sump in the zone between the downcomer end wall and the tower shell (the downward arrows curving to the right in Figure 7.9). Flows shown in Figure 7.9 are based on 75% of the draw being tray 24 downcomer liquid and 25% MPA return liquid. The entry of the MPA return liquid into the sump kept the draw liquid subcooled at 400°F. This persisted over a wide range of TPA duties. Beyond a certain critical TPA duty, a small rise in the TPA duty caused the stove oil draw to rise 25°F and lose subcooling. Subcooling is lost very gradually with sensible heat changes. A sudden loss of subcooling indicates the entry of latent heat. The only conceivable source of latent heat in the sump is vapor breakthrough from the downcomer. Such breakthrough may be caused by excessive liquid velocities (302), which in turn are caused by the higher TPA duty. This is why the first step in the cycle was always a rise in the draw temperature. Once the subcooling was gone, this breaking vapor would aerate the sump liquid. The aerated liquid between the sump wall and downcomer walls would have less density and would preferentially rise rather than flow to the nozzle. Less hot liquid would be available for the draw. It would be replaced at the draw by the cold MPA return liquid. The subcooling at the draw will return. The high-density unaerated subcooled liquid would back some liquid up the downcomer, reducing its velocity and interrupting the vapor breakthrough. After a while, more liquid would accumulate in the downcomer, the velocity would increase, and the vapor breakthrough would return. Figure 7.10 Crude tower stove oil draw modifications (boldface indicates modification). (From Kister, H. Z., D. W. Hanson, and T. Morrison, Oil & Gas Journal, February 18, 2002. Reprinted Courtesy of The Oil & Gas Journal.) Based on this diagnosis, the downcomer from tray 23 was shortened, terminating in an elevated seal pan and the MPA return pipes were lowered so they discharge outside the stove oil draw sump (Figure 7.10). This low-cost modification eliminated the swings and permitted the desired TPA duties to be achieved. Takeaway Temperature survey time studies can give invaluable insights into tower instabilities, leading to correct diagnoses and inexpensive solutions to challenging problems. Detailed temperature profiles are key to diagnosing the presence or absence of a second liquid phase in a tower. A second liquid phase is recognized by a temperature drop of the order of 10–20°C. Gans et al. stated (117), “If a distillation column temperature profile is completely off design, water is probably leaking in.” The author believes they were referring to columns processing organics that are water-insoluble or partially water-soluble, as in the following cases. Case 1 An azeotropic distillation column used a cyclohexane entrainer to remove water from an organic (351). The organic exited in the bottoms, and water and cyclohexane were the tower overhead. After condensation, cyclohexane was decanted from water and returned to the tower. After performing well for 15 years, the tower was replaced by a larger tower. Since then, instability, reduced capacity, organic and cyclohexane losses, and inability to control the temperature were experienced. A simulation using a VLLE model produced the temperature profiles in Figure 7.11a. The diagram shows that as the water content of the reflux increased by as little as from 3.5% to 6%, the temperature profile in the middle of the tower flattened. This flattening was due to the presence of two liquid phases in the tower, reaching well into the middle and bottom sections. The upper curve matched past operation, when the tower operated well. The bottom two curves matched the temperature profiles of the revamped tower. The change in the temperature profile identified the cause of the problem to be excessive water in the cyclohexane entrainer. This was confirmed by sampling the cyclohexane. An undersized line from the condenser to the decanter caused a buildup in the condenser all the way to the midpoint vent, from where it drained directly to the cyclohexane side of the decanter. Figure 7.11 Temperature profiles showing two liquid phases in the tower. (a) Case 1, temperature profile detects excess water (heavy phase) in the reflux. (b) Case 2, temperature profile indicating excess acid (light phase) in the reflux. (From Opong, S., and D. R. Short, “Troubleshooting Columns Using Steady State Models,” in “Distillation: Horizons for the New Millennium,” Topical Conference Preprints, p. 129, AIChE Spring National Meeting, Houston, TX, March 14–18, 1999. Copyright DuPont 1999. Used under permission. Case 2 A packed tower recovered acids as a top product from a mixture of organics (351). The tower had an internal condenser. A collector under the condenser separated the light acid-rich product from the heavy organic-rich phase, refluxing only the heavy phase back to the tower. The tower operated normally for a few days after commissioning, but then the acid recovery became very poor, the temperature profile flattened, and the pressure drop rose. A simulation using a VLLE model produced the solid line temperature profile in Figure 7.11b. The solid line matched the measured temperature profile in the initial few days, when the tower operated well. The data points were the temperature profile when the tower became abnormal, and the dotted line was generated by assuming that some of the light acid-rich phase was refluxed into the tower. The agreement between the two confirmed a malfunction of the collector that led to the refluxing of some light acid-rich phase into the tower. Case 3 A refinery reformer debutanizer separated C3 and C4 hydrocarbons as the top product from gasoline (C5–C9) hydrocarbons bottom product. The tower had 30 trays, 15 above the feed and 15 below. In the top section, temperature indicator readings in the control room were present just above the feed and at the tower overhead. The tower performed normally at moderate rates. However, when the rates were pushed up, the temperatures both above the feed and at the tower top jumped by about 10–15°C. This jump was accompanied by a large rise of gasoline (C5+) components, as much as 15%, in the top product, making the C4 product off-spec. There were no signs of flooding. While just looking at the two TIs showed nothing unusual, a wall temperature survey (Figure 7.12) revealed an unexpected behavior. For on-spec operation, temperatures gradually rose from the top to the feed tray, as they should, but the off-spec operation showed a temperature inversion. Here, the temperature gradually rose from 70°C at tray 30 to about 80°C at tray 22 below and then reversed the direction, going down to about 70°C on tray 18. Below tray 18, the temperature rose again going down the column. This behavior has been observed in chemical separations, where it often signifies the formation of a second liquid phase as described in Cases 1 and 2 and Figure 7.11. In hydrocarbon towers like debutanizers, it is far less common. Small amounts of water often enter in the feed, but for as long as the water content of feed is small, it will vaporize and end up in the overhead system, where it will be condensed and removed via a water removal boot. In this case, the water content in the feed was indeed small. Usually, the boot is an integral part of the reflux drum (192, 286, 288), which allows free movement of water into the boot and hydrocarbons back to the reflux drum. In this tower, the boot was a separate vessel, connected to the drum via a 1–1/2″ valve (Figure 7.13). This line was far too restrictive, restricting the water descent and causing poor water removal from the drum. Water was refluxed back into the tower, accumulating in the tower and causing the formation of the second liquid phase. The presence of nonvolatile water-soluble components like salts or caustic could have induced the water pocket to move down to just above the feed. Other Cases Reference 175 presents a case of ethanol–water distillation, with intermediate alcohols (fusel oil) drawn as a side product. Initially, the fusel oil could not be drawn. Experimenting with various steam rates in both the extractive distillation and the rectifying towers and comparing the measured with simulated temperature profiles provided the key to diagnosing the problem and solving it. In this case, a temperature inversion was expected in the extractive distillation tower, and reducing the boilup to establish it was a milestone toward the solution. Figure 7.12 Temperature survey of the top 15 trays above the feed showing a temperature inversion during the upset conditions. Figure 7.13 Debutanizer reflux drum with water removal boot in the case 3 in Section 7.1.5. Takeaway Temperature surveys can reveal unexpected behavior and diagnose problems. The top bed of a refinery FCC main fractionator (Figure 7.14) fractionated gasoline from light catalytic cycle oil (LCCO) (134). Liquid leaving the bed at 420°F was collected on a chimney tray, some of it drawn as the LCCO product and the rest descended to an orifice pan distributor via a center downcomer. Also entering this distributor was a cooled intermediate PA (IPA) return stream at 135°F. The orifice pan distributor distributed the liquid to the IPA packed bed below. Liquid from the bottom of the IPA bed was collected by a second chimney tray. Some of this liquid was cooled to 135°F, becoming the IPA stream returning to the orifice pan distributor, and the rest of it was used as reflux to the bed below (not shown). The gasoline–LCCO bed experienced poor fractionation, with a HETP of more than 11 ft where 3 ft was expected. As part of the troubleshooting, a radial temperature survey above the IPA bed was conducted, which showed high to low temperature variations of 85°F. While most temperatures were around the 450°F mark, one temperature was as high as 512°F. It was realized that very little cooling was done in at least one location. A close examination of the feeds to the orifice distributor (Figure 7.14) showed that the hot center downcomer reflux from the chimney tray was fed into the middle of the orifice pan distributor, while the cold IPA return stream was fed by two off-center pipes. The hot reflux did not adequately mix with the cold IPA return. A liquid with a nonuniform composition and temperature was therefore distributed across the IPA bed. Vapor leaving the central zone was hotter and contained a lot more heavies than the vapor rising in the regions to which the cold PA liquid was distributed. This resulted in poor fractionation in the bed above. Additional problems with this orifice pan distributor were described in the original Ref. 134. Figure 7.14 Top section of the FCC main fractionator that experienced separation problems. (Based on Golden, S. W., D. W. Hanson, J. Hansen, and M. Brown, Oil & Gas Journal, March 15, 2004.) This is the same tower that was described in Case 6.4.1. The temperature survey was conducted before the computer-aided tomography (CAT) scan (240). A chemical tower experienced two operation modes: “normal” and “upset.” In the upset mode, the measured temperature near the top of the upper bed became 40°C higher than normal, and a “reversal” occurred: this temperature became hotter than temperatures further down the bed. The heating up of that temperature was accompanied by a large rise in heavies in the overhead product. A shift to the “upset” mode was triggered mostly by raising the set point on the tower temperature controller, but also by excessively raising feed rates. Figure 7.15 Temperature survey of the top bed of the chemical tower that was experiencing upsets. (From Kister, H. Z., W. J. Stupin, J. E. Oude Lenferink, and S. W. Stupin, Transactions of the Institution of Chemical Engineers, 85, Part A, p. 136, January 2007. Reprinted Courtesy of IChemE.) Per step 14 in Section 7.1.1, a circumferential temperature survey was conducted at three elevations in the 4.8 m tall upper bed. Holes were cut in the tower insulation 0.5, 2.4, and 4.2 m below the top of the bed (referred to as the top, middle, and bottom rings, respectively). Each elevation had six holes around the circumference (at 60° angles). In the “upset” mode, the following observations were made (Figure 7.15): To investigate why the tower overhead temperature exceeded the temperatures at the top of the bed, a temperature survey ring was added in the vapor space above the reflux inlet, at 0.100 m below the top tangent line. The reflux was the only source of cold temperatures in the system, so above its inlet point, the temperatures should be the same as the tower overhead temperature. The “above reflux inlet” curve in Figure 7.15 shows that the cold spot on the northwest persisted in the vapor space above the reflux inlet. Other temperatures in this ring ranged from 140°C to 180°C, well below the overhead temperature of 195°C. Values obtained in this vapor ring were very consistent with the values obtained in the ring at the top of the bed. Interpretation of the Temperature Survey Temperature differences exceeding 10°C at the same radial elevation usually give rise to concerns about maldistribution (differences not exceeding 5°C are good). In the upper bed, the differences exceeded 100°C at the same elevation. In the upset mode, wall temperatures near the top of the upper bed were lower than 300 mm in from the wall (as measured by the thermocouple). This suggests preferential liquid flow at the wall and vapor in the center. There was a cold spot along the northwest that persisted along the entire upper bed. Besides the maldistributed profile, the temperature survey provided a major clue in the investigation. It showed cold, maldistributed temperatures near the top tangent line, mostly 15–35°C colder, but as much as 80°C colder, than the overhead vapor temperature. This is very unusual and suggests that the cold reflux is likely to have been sprayed upward – with vengeance. This spraying led to the diagnosis of flashing of the reflux. Prior to the temperature survey, there was no basis to suspect flashing of the reflux that was pumped from the reflux drum. The CAT scan in Section 6.4.1 later confirmed the suspected flow pattern. A subsequent investigation based on the findings of the temperature survey and CAT scans (240) showed that reflux flashing upon tower entry, and boiling in the reflux distributor, generated the bad liquid distribution observed and the upset condition. The flashing was promoted by a 90°C gap between the boiling points of the two major components in the reflux. The flashing was induced by vigorous steam tracing of the reflux line. This is the same kettle that was described in Cases 6.3.3 and 6.5.3 (217). The temperature survey preceded the neutron backscatter and tracer tests. The oil-heated depropanizer kettle reboiler bottlenecked the capacity of a gas plant. Tower flooding, initiating at the kettle reboiler, occurred when feed rates were raised. A pressure balance showed that to make the pressure drop in the kettle circuit high enough to raise the bottom sump level above the reboiler return nozzle (and initiate flood) would take significant entrainment from the kettle. A multitude of tests, including reboiler temperature surveys, were conducted to evaluate the likelihood of such entrainment. Surface temperatures were measured by a laser-guided IR pyrometer, calibrated with measurements of the depropanizer bottoms and the kettle liquid draw temperatures. Figure 7.16 shows the pyrometer measurements, at locations roughly drawn to scale, at rates just below those at which the tower flooded. Temperatures were measured at the top, bottom, east, and west sides of the kettle. For clarity, only the east side temperatures are shown; those measured on the west followed the same trend. The temperatures of the streams entering and leaving the kettle, as measured by thermocouples, are shown encircled in Figure 7.16. Non-encircled temperatures were pyrometer-measured. It is important to recognize that the surface temperatures were measured at the wall, at a varying distance from the tube bundle. Figure 7.16 Temperature survey of a kettle reboiler shows that the inlet region was thermosiphoning, while the outlet region operated like a kettle. (From Kister, H. Z., and M. A. Chaves, Chemical Engineering, p. 26, February 2010. Reprinted Courtesy of Chemical Engineering.) Figure 7.16 distinguishes two regions along the kettle length. In the inlet region, which stretched from the channelhead to just to the left of vapor outlet V2, the temperatures were only slightly higher (by no more than 4–6°F) than the kettle inlet temperatures. In the second region, which stretched from V2 to the liquid draw, the kettle temperatures began rising right after V2, finally reaching the liquid draw temperature. Temperatures measured in the disengagement drum above (drum shown in Figure 6.21) were slightly (about 4°F) higher than the kettle liquid inlet temperature. The temperature in V1 was significantly colder than in V2. In the kettle, the process inlet region was the vigorous boiling zone. Here, the fraction of the liquid vaporized was low, so less lights were removed from the liquid. This lights-rich liquid persisted all the way to the vapor nozzles. The lower temperatures observed in this region reflected the low vaporized fraction. Vapor line V1 was coldest, because it carried a vapor–liquid mixture from the region of intense boiling. The action in this region had similarities to the action in horizontal thermosiphon reboilers in that the quantity of vapor generated resulted in a low-density froth which promoted liquid flow to this region as opposed to the denser liquid in the less aerated zones. There was a net flow of liquid from the reboiler inlet region toward the overflow baffle since this was the only manner (other than entrainment) in which the unboiled liquid could permanently exit the kettle reboiler. As one moves closer to the overflow baffle, the liquid contained progressively less lights. This resulted in less vigorous boiling and a denser froth in this region. This was actually observed in the neutron backscatter (Figure 6.21). This was the one region that actually operated like a kettle. In this region, there was not much entrainment, as verified by the neutron backscatter, and there was a lot of disengagement space, both of which promoted true kettle behavior. As the flow of the reboiler feed liquid through this region was relatively low and the lights gradually disengaged along the path from vapor line V2 to the overflow baffle, the temperatures in this region gradually increased as observed in the temperature surveys (Figure 7.16). In this case, the temperature survey provided insight into the entrainment mechanism. A coker scrubber tower separated heavy residue tower bottoms from distillates that exited in the tower overhead vapor (49). The tower had a lower PA bed containing shed decks (baffle trays) and an upper refluxed wash bed containing grid packings. About 1.5 years into the run, significant residue carryover from the tower was observed, along with a steep rise of the wash bed pressure drop. Coking and fouling in this service are common and occur gradually over a three-year cycle, resulting in the entrainment of residue and high grid pressure drop. The sudden rise in pressure drop and entrainment midway through the cycle was unusual. The PA was distributed to the shed decks by a simple H-header ladder-type slotted-pipe distributor (Figure 7.17) with laterals positioned over each top layer of shed decks. It was designed to distribute the PA liquid proportionally to the open area of the slots in the laterals, providing even distribution of the PA liquid to the shed decks below. Normally, shed decks are robust to handle a reasonable degree of liquid maldistribution, but in this tower, due to the very low PA liquid flow rates (very low weir loadings), liquid maldistribution would dry up sections of the shed decks, allowing uncontacted residue to rise through them. Temperature surveys were at the heart of a thorough troubleshooting investigation, which is described in detail elsewhere (49). Figure 7.17 shows the two temperature survey rings taken above the distributor. The unbracketed values were measured at an elevation immediately above the distributor, while the bracketed numbers were measured about 6 ft 9 in. above the first ring. The space between the two rings was vapor space with no packings, shed decks, or other internals. Figure 7.17 Temperature survey showing a hot spot in the northwest quadrant. (Data from Brown Burns, J., D. Hanson, C. Riley, and C. Wicklow, “Targeted Injection Improves Shed Deck Performance,” The Kister Distillation Symposium, Topical Conference Proceedings, p. 119, the AIChE National Spring Meeting, San Antonio, TX, April 29–May 2, 2013.) The temperature survey identified a hot spot in the northwest quadrant, suggesting possible plugging of the laterals in this region. Less liquid descended in the northwest region of the distributor, giving poor separation and allowing heavies to ascend up the tower. Reference 49 reports making good use of additional temperature surveys in coming up with an innovative fix to the problem while the tower was operating and optimizing subsequent operation. In some hot services, where material degradation occurs at high temperatures, subcooled liquid is injected into the bottom sump liquid to keep the temperature down (72). In other cases, it is injected into the vapor space to desuperheat the vapor. In either case, that injection needs to be adequately distributed. This can be checked by a temperature survey as in Figure 7.18. The temperature survey in Figure 7.18 shows a case of uneven quench distribution in the bottom of an FCC main fractionator (72). Although the bottom temperature (which is usually monitored by a thermocouple) showed 680°F, due to the poor mixing some of the sump was at 720°F and would experience a much more rapid degradation (in this case, coking) rate that could lead to severe heat exchanger fouling. Temperature surveys can be very effective for diagnosing floods. Ideally, both the normal and flooded surface temperature profiles should be obtained. This is discussed under “loss of separation” in Section 2.6 and is illustrated in Figure 2.14. Figure 7.18 Temperature survey showing poor mixing of quench liquid in the bottom sump of an FCC main fractionator. (From Clark, D., and S. Golden, PTQ, p. 65, Summer 2003. Reprinted with permission.) While temperature surveys using pyrometers give accurate information on insulated towers and reboilers, they can be laborious and tedious. When towers, condensers, or reflux drums or their piping are not insulated or when it is easy to remove insulation strips, thermal cameras can provide troubleshooters with invaluable information. Thermal cameras are effective for observing temperature changes with time and can provide temperature profiles over large areas, rather than capturing single spots at specific moments of time. With insulated towers, thermal cameras can identify sections of damaged insulation where energy is lost. Thermography detects and measures variations in heat emitted by objects. Thermal cameras detect radiation in the IR range of the electromagnetic spectrum. The amount of radiation emitted by an object increases with temperature. The IR energy detected is transformed into electrical signals, which in turn are converted to visual signals that form thermal images. These images display a range of colors that correspond to temperatures. The colors identify the temperature distribution in the image. Thermal cameras can be operated in photo mode or video mode, just like cell phone cameras. Just like pyrometer surveys, successful thermal imaging requires valid and reliable measurements. It is crucial to verify the data by extensive consistency checks. Invalid or unreliable temperature measurements lead to incorrect diagnostics. In one case, a thermal camera survey through a number of cuts in the insulation in a baffled column bottom sump gave such an inconsistent pattern that it had to be abandoned and successfully replaced by pyrometer readings. The key to successful temperature thermal imaging is reliability, repeatability, and consistency. Here are some guidelines for achieving them: Emissivity varies with the surface of the object and also with temperature and wavelength (7, 22, 105, 306, 495). Metals, especially polished metals, pose problems due to their low emissivity, with values below 0.2 (495). Emissivity may vary considerably as a result of surface structure. While a polished metal may have a low emissivity, the same but roughened metal can have an emissivity as high as 0.8 (495). Radiance of a surface also depends on the viewing angle; an object that is observed normal to its surface will emit more radiation than when observed at an angle. Emissivity also depends on wavelength; emissivity of metals usually decreases with longer wavelengths (495). Several practical methods for setting emissivity are available, with emissivity tables being the most common (22, 105). These are found in thermal camera manuals and in the literature. These values had been recorded under specific measurement conditions and, if they vary from the measurement at hand, may not be accurate for that measurement. The influence of errors in emissivity can be minimized by calibration against a surface of the same material at a known temperature. Measure the temperature at a location near a thermocouple. Adjust the emissivity to give that temperature. For shiny surfaces of low emissivity, painting or taping is practiced (495), in a similar manner to step 18 in Section 7.1.1. However, when using thermal cameras, the area surveyed may be large, and painting or taping may not be practical. Two acid gas scrubbers were operating in parallel, removing all the water and CO2 from excess ammonia (22, 23). CO2 was fully consumed by the excess ammonia, yielding concentrated ammonia as the top product. The reaction between CO2 and ammonia is exothermic, so the top two random-packed beds were PA beds cooled by an external cooler to remove the heat of the reaction. One of the two scrubbers was experiencing top temperature instability, with swings of ±10°C, posing a contamination risk to the overhead product. In the past, the tower was very stable. The parallel tower remained very stable. Several troubleshooting checks were performed, but the key lead came from a thermal scan of the towers (Figure 7.19, TPA bed). Tower 1 was the one experiencing the problem, while tower 2 was the stable one. The thermal image of tower 1 showed a 27°C temperature gradient from left (hot) to right. For tower 2, the difference was about 2°C. Tower 1 profile conclusively showed liquid and/or vapor maldistribution, while tower 2 showed good distribution. Turnaround inspection found that the liquid distributor and bed limiter were incorrectly installed in tower 1, causing channeling which promoted fouling in the bed. The fouling was so severe that individual pieces of packings conglomerated and stuck in the bed limiter above the packing. The packings were then replaced by the same type, the distributor cleaned, and the bed limiter replaced. All were inspected for proper installation. Following restart, very stable operation returned to tower 1. Once the location of the cold or hot region is identified, a strip of insulation can often be removed and a thermal scan taken. This scan is invaluable for confirming or denying a theory and can save the elaborate scaffolding often needed for a detailed pyrometer survey (e.g., as in Section 7.1.3). Below are two examples where this technique led to the correct diagnosis and fix of operating problems. After a long production run, separation deteriorated in a chemical packed tower. With the hot, reactive vapor feed, plugging at the bottom of the bed was the prime suspect. To investigate, a strip of insulation a few feet wide was removed from the bottom of the bed, about half the column perimeter, and a thermal scan was shot along the wall. The scan showed that the wall right across from the vapor inlet (Figure 7.20a) was hot, at about the same temperature as the feed. Other sections of the wall were much cooler. This verified the plugging theory, with a vapor jet ascending near the hot wall. Figure 7.19 Thermal scans of two acid gas scrubbers operating in parallel. (a) Tower 1 shows a highly maldistributed profile, with a 27°C temperature gradient from left (hot) to right. (b) Tower 2 shows uniform temperature from side to side, indicating good distribution. (From Barnard, H., Chemical Engineering Progress, p. 21, January 2017. Reprinted Courtesy of Chemical Engineering Progress [CEP]. Copyright © American Institute of Chemical Engineers [AIChE].) When the tower was opened, deposits were found at the base of the bed near the center of the tower (Figure 7.20a). The plugged packings were replaced by in-kind. Upon restart, the tower worked well. A new thermal scan showed even distribution. A similar technique can be applied to troubleshoot liquid maldistribution. In one refinery vacuum tower, the spray header bringing cooled liquid to the top (light vacuum gas oil, LVGO) bed appeared to have failed, as could have been inferred from the sudden reduction in the sprays pressure drop (Section 4.15). This led to severe maldistribution, poor heat transfer, hot overhead temperature, and slop in the overhead. In an endeavor to implement a fix without a unit shutdown, it was important to identify the failure location. Figure 7.20b shows a multitude of laterals and flanges, each one with the potential for failure. Figure 7.20 Two situations where removing a strip of insulation and shooting a thermal scan helped diagnose an operating problem. (a) Plugging near the bottom of a packed bed, generating vapor maldistribution. (b) Failure of a spray header sheet metal cap causing liquid maldistribution. A temperature survey using contact thermocouples at the top platform showed much colder temperatures at the end of the main header. To learn more, the plant stripped insulation at this end of the tower and shot a thermal scan. The scan showed a cold region propagating throughout the entire bed (a few feet long). This and gamma scans identified the failure of a thin-gauge metal cap at the end of the header (Figure 7.20b) as the most likely cause. Based on this diagnosis, the refinery was able to devise a fix that kept the unit operational and performing well until the next scheduled turnaround. The tower shown in Figure 7.21 used a monoethanolamine (MEA) solution to absorb and remove H2S from a gas stream on one-pass trays. Figure 7.21a presents a thermal scan during normal operation. Tray liquid (yellow) and vapor space above (orange) can be clearly distinguished. This scan shows higher temperatures in the liquid than in the gas. A common design practice in ethanolamine absorbers is to keep the lean amine temperature >10°F hotter than the gas temperature to prevent condensation of foam-promoting heavy hydrocarbons into the amine (192, 286, 476). A close look into Figure 7.21a shows the lean amine entering at approximately 90°F and the gas at 80°F, in accordance with this practice. Figure 7.22a shows normal operation, but with the reverse pattern, on single-pass trays in a methyldiethanol amine (MDEA) absorber (476). Again, the tray liquid (orange) and gas (yellow) can clearly be distinguished, but here the tray liquid was cooler than the gas. In this tower, the lean amine entered at 83°F, much colder than the gas inlet that entered at >120°F, giving this reverse pattern. Lower liquid than gas temperatures were observed in other gas absorption towers (e.g., Figure 3 in Ref. 475). In both Figures 7.21a and 7.22a, the thermal scans show the trays to be in place with froth heights about halfway up the tray spacing. Figure 7.21 Thermal scans of an amine absorber: (a) normal operation; tray liquid (yellow) and gas space above (orange) can be clearly distinguished. Note that the scan shows higher temperatures of the liquid than of the gas. (b) The same tower a year later when it was foam-flooded. Note that the liquid and gas spaces cannot be distinguished. Figure 7.22 Thermal scans of an amine absorber: (a) normal operation; tray liquid (orange) and gas space above (yellow) can be clearly distinguished. Note that this scan shows higher temperatures of the gas than of the liquid, the converse of Figure 7.21a. (b) The same tower during a foaming upset. (From Teletzke, E., and B. Madhyani, Gas 2018, p. 35. Reprinted with permission.) In both Figures 7.21a and 7.22a, the hottest temperatures appear near the bottom. In Figure 7.21a, the hottest temperature is in the bottom sump; in Figure 7.22a, it is just above. The reaction of amine with H2S is exothermic, and most occurs near the bottom. Figure 7.21b shows a thermal scan of the tower as in Figure 7.21a taken about a year later, when it was experiencing foam flooding and had a high pressure drop. Amine absorbers are prone to fouling, and the solids (such as corrosion products) catalyze foam (Section 2.10). The tray elevations can no longer be seen throughout the tower. Instead, two distinct temperature zones can be distinguished, with the upper one about 8–9°F hotter. The reaction between the amine solution and H2S appears to mostly take place on the upper trays. The tower in Figure 7.22a experienced foaming upsets daily between noon and the evening. The rest of the time, the tower was stable. Figure 7.22b shows a thermal scan of the tower at a foaming upset. As the foaming upset progressed, the liquid was seen to move up the tower, eventually leaving the tower as entrainment in the overhead gas. Under the foam flood conditions, the tower temperature was quite uniform, just like in the foam-flooded region in Figure 7.21b. In the tower in Figure 7.22, the foaming was caused by condensation of heavy hydrocarbons and was eliminated by improving temperature monitoring of the inlet gas that enabled operators to keep the lean amine hotter than the inlet gas. In a recent article (477), Teletzke and Roberts extended the application of thermal scans to detect tray channeling, excessive weeping, and tray damage. Weeping and channeling at low rates was recognized by an irregular path of liquid flow down the tower instead of the well-formed liquid paths shown on Figures 7.21a and 7.22a.The scans showed heavy liquid flow on one side of the tower, somewhat similar to the pattern in Figure 7.19a. In another tower where the bottom trays were dislodged or damaged, the thermal scans showed an irregular low temperature pattern across the damaged zone. Ideally, an amine absorber maximum temperature, indicating the location of the exothermic rection, is at the bottom third of the tower (430). In the top two-thirds of the tower, the gas is polished to the desired specifications (475, 477). Thermal imaging is ideal for checking whether this is achieved and can diagnose damage, foaming, or insufficient amine circulation. Figure 7.23 Thermal scan of an amine absorber compared with a temperature profile from a rate-based simulation, temperature bulge throughout most of the column, solvent to gas mass ratio 0.87. (From Sheilan, M. H., and R. H. Weiland, “Troubleshooting AGRUs in an LNG Train,” LNG Industry, August 2015. Reprinted with permission.) A liquefied natural gas (LNG) plant (430) had two process trains using MDEA for absorbing CO2, which was 2.4% of the feed gas, to an overhead gas spec of 50 ppmv. There was no H2S present. The absorbers contained X-type structured packings, and the regenerators were trayed. After years in operation, the regenerator in one train started experiencing foaming, making the operation unreliable and leading to periodic amine discharges. The amine content of the MDEA solution was >50% weight, which is likely to promote corrosion, in turn producing solids that catalyze foam, and its heavy hydrocarbon content was 2–4%, also likely to promote foams. Figure 7.23 compares the thermal image of the absorber with the temperature profile from a rate-based simulation. This simulation has an excellent track record in amine systems. Both show a temperature bulge throughout most of the tower, indicating significant CO2 presence in the upper parts. The design solvent to gas mass ratio was 1.1, and the bulge was supposed to be in the bottom, but since the operating ratio was only 0.87, not enough CO2 was absorbed in the lower part, so the bulge spread out to the upper part of the tower. While the bottom sections had stainless steel cladding, the upper parts were non-cladded carbon steel, prone to corrosion at high CO2 concentrations and hot temperatures. The authors (430) noted that the temperatures measured by thermal imaging were slightly lower than those from the simulation, possibly due to the temperature gradient through the thick vessel walls. Figure 7.24 shows the bulge descending to the lower part of the tower after the solvent to gas mass ratio was raised to 1.01. Both temperatures and CO2 concentrations in the non-cladded upper part of the tower were largely reduced, thus alleviating the corrosion and improving the operation. Figure 7.25 shows amine absorber temperature profiles as a function of liquid to gas (L/G) ratios from a rate-based simulation (432, similar plots were also produced in Ref. 477). Note the sharp change of the bulge over a relatively small L/G range from 0.91 to 1.12 compared with the much smaller changes at higher and lower L/G ratios. Combining a rate-based simulation of the bulges with thermal scans can provide valuable diagnostics for amine absorbers. Figure 7.24 Thermal scan of an amine absorber compared with a temperature profile from a rate-based simulation, temperature bulge descending to the lower part of the tower, solvent to gas mass ratio 1.01. (From Sheilan, M. H., and R. H. Weiland, “Troubleshooting AGRUs in an LNG Train,” LNG Industry, August 2015. Reprinted with permission.) Thermal images can show excess liquid levels at the tower base in services where there is a large difference between the liquid and gas temperatures. The same can apply to the liquid level on a chimney tray, as long as the vapor and liquid temperatures differ. When the tower is insulated, a vertical strip of insulation can be removed, and a thermal scan shot. Figure 7.26 shows the bottom sump of an amine absorber that was experiencing premature flooding (475). The small cylinder to the left of the tower is the guided radar level transmitter that controls the base level. Figure 7.26 shows that the actual liquid level was above the span of the transmitter and rose above the vapor inlet (the purple pocket on the right). The level transmitter showed 55% at the time. Liquid levels rising above the gas inlet are known to cause massive entrainment, which initiates a premature flood in the tower (Section 2.13). Lowering the level setting to 45% on the transmitter was enough to stop the massive entrainment and eliminate the flood (475). A tower in parallel had an almost identical experience. A deethanizer tower in a newly licensed unit experienced premature flooding initiating at its bottom. One lead in the troubleshooting investigation was the observation that the reboiler inlet and outlet process temperatures measured by the control room thermocouples were 30–40°F hotter than the design. Nothing else in that region appeared suspicious; the bottoms temperature was the same as the design, and the bottom level behaved normally. The bottom of the tower contained a preferential baffle (Figure 7.27), dividing it into a reboiler draw compartment and a product draw compartment. The purpose was to divert all the lower-boiling bottom tray liquid into the reboiler. The seal pan for the bottom downcomer had a tall weir above the bottom draw compartment and a short weir over the reboiler draw compartment, with all liquid overflowing the short weir. The baffle arrangement supplemented the reboiler draw with some reboiler return liquid to provide sufficient circulation in the thermosiphon reboiler. The rest of the reboiler return liquid was intended to overflow into the bottom draw compartment. The design flows, with the design temperatures next to them, are shown in non-bold print in Figure 7.27. Figure 7.25 Amine absorber temperature profiles from a rate-based simulation as a function of solvent to gas mass ratios. Note the sharp change of the bulge over a relatively small L/G range from 0.91 to 1.12. (From Shiveler, G., and H. Wandke, “Steps for Troubleshooting Amine Sweetening Plants”, in Kister Distillation Symposium, p. 96, AIChE Spring Meeting, Austin, Texas, April 26–30, 2015. Reprinted with permission.) Figure 7.26 Thermal scans of the bottom sump of an amine absorber that experienced flooding due to entrainment from a high base level. (From Teletzke, E, and C. Bickham, Chemical Engineering Progress, p. 47, July 2014. Reprinted Courtesy of Chemical Engineering Progress [CEP]. Copyright © American Institute of Chemical Engineers [AIChE].) To investigate the high temperatures in the reboiler circuit, insulation was removed and thermal camera shots were taken between the top of the cover baffle and the seal pan. Two observations were striking: one, the liquid descending from the seal pan was 25°F hotter than the design bottom tray temperature, and two, the temperatures between the seal pan and top of the cover baffle were 12–15°F colder than the reboiler return temperature. Combining this with the observation that the liquid out of the bottom draw compartment was slightly colder than the liquid out of the reboiler draw compartment conclusively demonstrated that the baffle arrangement was not working like it was intended and that there was unexpected mixing taking place. The observation that the liquid coming down from the seal pan was 25°F hotter than the design bottom tray temperature, with the rest of the tower temperature profile close to the design, implies liquid entrainment from the reboiler return region into the bottom tray. To explore, gamma scans were shot through the bottoms draw compartment and above it all the way to the fifth tray above the bottom. The scans showed liquid as dense as the liquid in the bottoms draw compartment filling the space above the cover baffle all the way to the seal pan, with flooding with less dense froth propagating to the bottom tray and beyond. This verified that the flood initiated in the baffle arrangement. Further analysis determined that the flooding was due to flashing occurring where the hot reboiler return liquid met the cold, lights-rich liquid from the bottom tray. The vapor generated upon the flash entrained the liquid attempting to descend in the narrow space between the two vertical baffles, this entrainment flooding the bottom trays. Again, the takeaway was the value of thermal scanning in providing invaluable troubleshooting information. Figure 7.27 Design flows and temperatures at a tower base (non-bold print), compared with actual temperature measurements (bold print). Bold print numbers in rectangles are control room temperature measurements. Bold print numbers with no rectangles are thermal camera measurements. An electric power failure resulted in an emergency shutdown of an atmospheric crude tower (310). The unit started up two days later, and it was observed that the light diesel oil production was cut by half. The light diesel draw temperature was 18°C less than normal, and the heavy diesel draw, which was the next draw down, was 35°C colder than normal. Thermograph readings were taken close to the light diesel drawoff nozzle (Figure 7.28). With the draw valve open, temperature right at the outlet was 209°C, while a few inches away in the pipe, the temperature declined by 28°C to 181°C. The lower temperature indicates a gas pocket in the pipe. When the valve was closed (Figure 7.28), the temperature at the top of the pipe became uniform at 200°C, indicating liquid filling the pipe above the valve. This suggested that the draw pan was holding liquid and that the reason for the low light diesel flow was tray damage rather than pan damage. Gamma scans verified extensive tray damage in the region, including the draw tray. The unit was shut down and the damage repaired. Figure 7.28 Thermal scans of the light diesel draw pipe to check whether the diesel draw pan was leaking. (From Marchiori, A., A. L. Wild, A. Y. Saito, A. L. de Souza, C. Mittmann, C. C. Anton, F. S. Duarte, S. L. A. Pereira, and S. Waintraub, “More Tower Damages Caused by Water-Induced Pressure Surge: Unprecedented Sequence of Events,” in “Distillation 2013: The Kister Distillation Symposium, Topical Conference Proceedings,” p. 421, the AIChE National Spring Meeting, San Antonio, TX, April 29–May 2, 2013. Reprinted with permission.) The damage resulted from a pressure surge during restart, caused by water entry via a liquid relief valve discharging into the heavy diesel circuit underneath. The discharge piping contained dead pockets that could have accumulated water and were not drained during the short shutdown. Thermal images are highly effective in showing the liquid levels in condensers and drums. Figure 7.29 (22) shows a thermal image of a partially flooded tower overhead condenser. The tower experienced unstable overhead pressure, and inability to condense was one theory. The thermal scan proved that condensation was taking place, sending troubleshooters to seek another root cause. The issue was found to be a manual block valve that had been left open since startup. Closing it reinstated good operation. Figure 7.30 shows the liquid level in a reflux drum using a hot vapor bypass (HVB) control system. The system operated well, and the thermal scan was only used to verify. Notice the sharp change from colder liquid to hot vapor, with a temperature difference of 10°F between them. The temperature gradient took place over a few inches. The sharp change is also seen in Figure 7.29. Process liquids are excellent thermal insulators, hence the very short length over which the temperature gradient takes place. Thermal images are effective for troubleshooting condensers, reboilers, and other heat exchangers around the tower. Case 1 Plugged tubes in air condenser Figure 7.31 shows the application of thermal scans to identify plugged tubes in an air condenser. The condenser, switched from another service, was performing below the expected heat transfer. Figure 7.31a shows why. The purple tubes are cold, and the yellow are hot. For comparison, Figure 7.31c shows an active bay operating well (yellow) next to an inactive bay (purple), which is cold. As all the tubes in the condenser were active, the cold (purple) tubes indicated plugging. This thermal scan changed the solution from buying an expensive new exchanger to inexpensive cleaning of the tubes. Figure 7.29 Thermal scan of a partially flooded overhead condenser, showing a liquid level at the bottom and a very sharp temperature transition going from liquid to vapor. (From Barnard, H., Chemical Engineering Progress, p. 21, January 2017. Reprinted Courtesy of Chemical Engineering Progress [CEP]. Copyright © American Institute of Chemical Engineers [AIChE].) Figure 7.30 Reflux drum in a hot vapor bypass system. Note the very distinct difference between the liquid and vapor temperatures and the sharp transition from liquid to vapor. Figure 7.31 Plugged tubes in air condenser. Yellow shows hot tubes, and purple cold tubes. Case 2 Identifying cause of poor heat transfer in air condenser A large chemical tower and its air condensers were started up in 2014 (251). By September 2020, the air condenser performance fell well short of the design. The air condenser was unable to achieve the design heat duty at the design air temperature of 35°C. Figure 7.32a compares the design conditions to test data at the same tower overhead flow rate and a colder air temperature. The measured condensate temperature was well above the design. The condenser was a total condenser. The boiling range was about 10°C. At 66°C, the condensate was near its bubble point and not 8°C subcooled like in the design. About 10% of the condensation took place in the chilled water condenser, which consumed energy. The air condenser had five bays, two parallel bundles of finned tubes per bay, arranged in two passes, four rows in the upper pass, two rows in the lower pass. Each bundle had two vapor inlet nozzles, two condensate outlet nozzles, and one vent nozzle. The test in Figure 7.32a was accompanied by a detailed thermal camera survey (Figure 7.32b). All temperatures in Figure 7.32b were measured by a thermal camera, except for the shaded values that were measured by control room thermocouples. The excellent consistency between the readings as well as between the thermal camera readings and the thermocouples attests to the accuracy of the thermal camera survey. The vent lines leaving bays 1–5 (marked in black just above the bays, two vent lines per bay) were at 74–77°C, only 2–3°C cooler than the incoming vapor, so the vented vapor had not undergone much cooling. Temperatures measured in the horizontal header that collected the individual vent streams (marked in black in the common vent header) were about 14–17°C colder. The lower temperatures persisted throughout the vent header, all the way to the chilled water condenser. This compares well with the thermocouple measurement of 61°C. The temperature drop was most likely due to the entrainment of condensate from the air condenser into the vent lines. There is little separation in the head of an air condenser, and the vents were likely to drag with them liquid drops, which flashed at the expansion of the vent lines into the vent header. Condensation was complete at about 10°C below the inlet temperature, i.e., at 66°C. At the measured condensate header temperatures of 65–68°C the condensate was close to its bubble point. All but one of the condensate outlet temperatures from bays 3 and 4 (marked in blue in Figure 7.32b) were in the 67–71°C range, indicating the presence of some uncondensed vapor in many condensate outlets. Results of heat transfer calculations were expressed as oversurface percent, defined as the ratio of the heat exchange area available to the heat exchange area needed to achieve the condensation less 1. An oversurface of zero percent means the heat exchange area in the condenser equals the heat exchange area required to achieve the condensation and the specified outlet temperature, so the exchanger performs as expected. To get a zero percent oversurface in the air condenser, the condensate would have come out subcooled to 40°C. The high oversurface percent indicated that the exchanger was oversized for the measured condensation and subcooling duties. For the test data, and assuming the design air temperature difference, the oversurface was 99%, showing that the condenser had about twice the area needed to achieve the measured heat duty. Different fouling factors were tried, but even with a fouling factor five times the design, the condensate outlet temperature at zero oversurface would still have been highly subcooled at 46°C. So the reduced heat transfer coefficient due to fouling would not go anywhere near the length required to explain the high oversurface. Figure 7.32 Air condenser thermal survey. (a) Tower overhead scheme. (b) Thermal camera survey temperatures, °C. (c) Looking at bay 3 tubes from underneath. The next troubleshooting endeavor explored operating data from the initial running period of the column, shortly after the 2014 startup. At that time, the tubes had been in service for only a short period and therefore were reasonably clean. At the same condensation rate and an air temperature of 35°C, the condensate was subcooled to 55°C, giving an oversurface of 23%, indicating a much better heat transfer. This raised the question of whether the exchanger ΔT has diminished over time due to airflow restriction. Photographs were taken of the bottom rows of condenser tubes, looking up (Figure 7.32c). The photographs showed extensive plugging of the fins, to the point that they were hardly visible. The passages between the tubes were narrowed. The bottom row of tubes was covered with a layer that would not only form insulation around the tubes, giving very little heat transfer, but would also restrict the air passage, reducing the airflow, which in turn will raise the air outlet temperature and lower the condenser ΔT value. Lieberman and Lieberman (293) stated (in the fourth edition of their book), “A finned tube bundle acts as an air filter. Air is drawn up through the lower two rows of fins where much of the dust, dirt, bugs and moths are filtered out, and this restricts air flow.” Measurements on the air side verified the diagnosis. The measured temperature difference between the air in and air out was 30°C, much higher than the temperature difference of less than 20°C based on no fouling restriction to airflow. It is likely that the heavy fouling of the bottom row of tubes was due to dust, dirt, and corrosive materials. During plant commissioning and early operation, there were episodes of a nearby grinding workshop releasing dust, some of which is likely to have been inspirated into the condenser air intake, settling in the bottom rows. A lot of powder is believed to have covered the surface of the fins in the first two years. Later in the run, the plant changed the grinder, but by that time, the plugging had already occurred. In addition, in the early years of the plant, chlorinated organics were present, which would have generated HCl upon hydrolysis in wet air. The plant had improved the maintenance and emissions management to the point that this was no longer an issue, but by that time, the plugging had already occurred. Case 3 Channelhead leaks in horizontal thermosiphon reboiler Figure 7.33 (400) is a thermal image of the channelhead of a horizontal thermosiphon reboiler, showing a sharp change in temperature at the condensate (tube side) liquid level. At this elevation, the temperature difference is likely to subject the channelhead flange to severe thermal stresses, causing leakage at the gasket. As the level moved up and down with the change of reboiler duty, the elevation at which severe thermal stresses occurred is likely to shift, and additional leakage points were likely to develop. The circles on the left photograph show the places where the channelhead gasket leaked. Figure 7.33 Right: thermal scans of the channelhead of a horizontal thermosiphon reboiler, showing a sharp change in temperature at the condensate (tube side) liquid level. Left: circles show the resulting channelhead leak spots. (From Risko, J. R., Chemical Engineering Progress, p. 43, July 2021. Reprinted Courtesy of TLV.) Disclaimer The information provided in this section, including Figures 7.34 parts a through c, expresses the opinions of the authors and may not reflect the views of Valero; any use of the information is at the reader’s risk. Case History A hydrocracker unit (HCU) revamp (145) increased the naphtha (overhead product) yield and main fractionator reflux requirement. To accommodate this, the overhead air condenser E-28 capacity was increased by 50% (Figure 7.34a) and the reflux/product pump debottlenecked. No changes were made to the overhead accumulator or its internals nor to the water trim cooler E-30. Liquid from the water cooler entered the drum via a slotted pipe, which was not changed. Following restart, the tower overhead system experienced severe instability, with large pressure and accumulator level fluctuations accompanied by cyclic banging noise emitted from the trim cooler. The hot vapor bypass (HVB) control system was struggling to respond quickly enough to the drum pressure changes. Troubleshooting was immediately started, focusing on the accumulator, condenser, and cooler. The temperature changes in the accumulator as the HVB was opening and closing signaled that vapor was mixing with subcooled liquid and collapsing onto it. Physically touching the cooler outlet pipe during a cycle showed that temperatures would increase and then decrease in concert with the banging. The problem was diagnosed by an innovative application of thermal imaging: shooting thermal videos of the temperature in the liquid line from the cooler E-30 (Figure 7.34b). Six static shots from a typical video are shown in Figure 7.34c over a 72-second time period. The temperature rose from 70.3°F to 83.3°F before dropping back to 67.8°F over about 1 minute and then started rising again. Subcooling tremendously lowers the vapor pressure of the liquid. The vapor pressure of the subcooled liquid from the cooler was well below the drum pressure, so instead of coming out of the slots in the pipe, the subcooled liquid sucked vapor into the pipe via the slots. The vapor collapsed onto the subcooled liquid, causing the hammering. Once the liquid was heated up by the condensing vapor, its vapor pressure would rise, it would no longer suck vapor from the drum, and liquid would flow into the drum via the slots, as intended. The hot liquid in the pipe returned to the drum and was replaced by the subcooled liquid from the cooler again, and the cycle would repeat. Figure 7.34 Troubleshooting by thermal videos. (a) Overhead system of a hydrocracker main fractionator that was debottlenecked to increase product yield and tower reflux. (b) Positioning of the thermal camera used to shoot the condensate line temperature video. (c) Static shots from a typical video of the condensate line temperature, showing large temperature cycling over one minute. (From Hanson, D., “Details Matter When Diagnosing Hot Vapor Bypasses,” in Kister Distillation Symposium, Topical Conference Proceedings, AIChE Spring Meeting, San Antonio, Texas, March 26–30, 2017. Reprinted with permission per disclaimer at the front of Section 7.2.11.) The problem did not occur before the revamp because the subcooling was small, only 5–10°F. Upgrading the air condenser largely increased the subcooling, causing low vapor pressure and initiating the cycles. The problem was resolved by closing the HVB and adding an inert gas blanket to the accumulator, which would not condense onto the subcooled liquid. Energy balances are invaluable for validating simulations, forming a basis for vapor and liquid loading calculations, and identifying leaks, including internal leaks, entrainment, and insufficient reboil or reflux. Simulations are the primary tool to tell troubleshooters whether the tower performs like it should and where to look for problems. The energy balance is a key tool for validating these simulations. Step 8 in Section 3.1.3 emphasizes the importance of compiling a valid energy balance with a closure of ±5% (4, 192). Flooding A reflux rate significantly higher than the rate that would match the measured reboil rate often indicates massive entrainment of liquid from the top of the tower, i.e., flooding. One debutanizer tower returning to service after turnaround (280) had a measured reflux rate the same as normal, but the reboil rate was very low. This signified that reflux liquid was not descending down the tower but had been entrained back to the reflux drum and recirculated. Poor Separation When the measured reflux rate is higher than the actual, so is the condenser duty based on this measurement. An energy balance based on the reboiler duty and tower feed will give a lower condenser duty and reflux rate than those inferred from the measured reflux rate. This may identify a reflux measurement issue where insufficient reflux is the root cause of a separation problem. Case 2.6 in Ref. 201 describes a tower that experienced poor separation even though the reflux rate and temperature profile appeared normal. The cause was an undersized orifice plate in the reflux line giving a misleading high reflux reading. The tower had a fired heater reboiler, making it difficult to compile an energy balance. The energy balance would have indicated a reflux flow too high to balance the low reboiler duty and would have identified the metering problem. When the undersized orifice plate was replaced by the correct one, the plant saw a large increase in fuel gas consumption at the same reflux reading (which was correct this time). Another Poor Separation An olefin gasoline fractionator produced off-spec gasoline after returning from turnaround (216). During the turnaround, the impulse line to the reflux meter orifice plate was repaired, but no other changes were performed to the tower or auxiliaries. An energy balance performed by an intern following the turnaround revealed a reflux rate much lower than measured. A check of the orifice by the instrument foreman and technicians did not reveal any problems with the meter. The mystery was explained after the intern found a flange with the old orifice plate in the scrap heap. Apparently, to repair the impulse line, the installers cut out the orifice flange, replacing it by in-kind. The old flange disappeared in the scrap heap. The installers fabricated a new orifice plate, with the orifice size provided by the instruments department. The orifice size in the instruments records was outdated, so the replacement orifice diameter was smaller, giving a misleading high reflux reading. One More Poor Separation In a chemical tower, steam consumption was high, giving the appearance of low packing efficiency. The plant was considering replacing the packings and distributor. While preparing a simulation to provide vapor and liquid loads to the packing vendor, it was noticed that the reboil was disproportionally higher than the reflux. Upon close investigation of the discrepancy, it was discovered that the reboiler lost its liquid seal, so some steam was blowing straight into the condensate header without condensing. This increased steam consumption, but not due to poor packing efficiency. Good or poor Packing Performance? In a chemical packed tower, the measured reflux rate was 25% higher than the reflux rate that would have matched the measured reboiler duty. The reason for the discrepancy was not identified, so both cases were simulated. The simulation based on the measured boilup gave reasonable HETPs in the tower, indicating the packing and distributors were working quite well. The simulation based on the measured reflux rates required HETPs that were twice higher, indicating poor performance of the packings or distributor. Until today, we do not know whether the packings performed well or not. Flashing in the Reflux Distributor This is the chemical tower discussed in Sections 6.4.1 and 7.1.7. Temperature surveys and CAT scans established that flashing was taking place in the reflux distributor, but the reason for the flash remained obscure. A number of theories were put forward, but they turned out to be either inconsistent with the plant data or thermodynamically flawed. In an endeavor to get to the bottom of the flashing, instruments were closely checked and calibrated, and a simulation was compiled to match plant data. A rather small discrepancy in the energy balance, about 7%, was noticed, with the boilup being lower than the matching reflux. This signaled the possibility of an additional heat source and led to the evaluation of the heat tracing on the reflux line, which accounted for this discrepancy. This heat tracing was under heavy insulation, and until the energy balance was compiled, no one in the team considered it. Proprietary Trays Not Meeting Their Guaranteed Efficiency Reference 234 describes a case where a tower achieved excellent separation but was unstable when operating at maximum rates. The problem was thought to be a control problem. A simulation was prepared, based on the vendor’s guaranteed tray efficiency. A comparison of the simulation with the plant data (Figure 7.35a) indicated that the simulated reflux was 18% higher than the measured, while the simulated boilup was 19% lower than the measured. The simulation values are always energy-balanced, so they provide an excellent benchmark for the closure of the measured energy balance. As the reflux and boilup deviated in different directions from the energy-balanced solution, Figure 7.35a indicates about 30–40% nonclosure of the measured energy balance, with reboiler heat duty well in excess of the heat duty that would match the measured reflux rate. Such a large discrepancy pointed out a measurement issue. The instrument engineers were invited to join the task force, and a detailed investigation of the key flow meters (reflux and reboil) was initiated. The investigation identified a valving problem on the reflux meter that was undetected in previous instrument checks due to the inaccessibility of the meter. In addition, meter density correction factors needed updating. Once both problems were rectified, it was found that the reflux in the tower was 37% higher than previously thought and 16% higher than previously simulated. The simulation was revised to match the correct reflux measurement (Figure 7.35b), which also gave a good match to the revised boilup measurement. The only way that the simulation could have matched these higher reflux rates is by using a low tray efficiency, well below the guaranteed. The higher reflux and boilup rates (needed to achieve the good separation) hydraulically loaded up the trays to the verge of flooding. The instability had little to do with controls and a lot to do with operation right at the flood point. So getting the energy balance to close changed the diagnosis of the problem from that of a control problem to one of low tray efficiency, below the vendor’s guarantee. Figure 7.35 Energy balance troubleshooting that completely changed diagnosis on this tower (all flows are in tons/h). (a) Initial simulation compared with plant measurement, showing a mismatch between reflux and boilup. (b) Revised energy balance, after measurements revised, showing much higher reflux and poor tray efficiency. (Reprinted with permission from Kister, H. Z., S. Bello Neves, R. C. Siles, and R. da Costa Lima, Hydrocarbon Processing, p. 103, August 1997.) Unnecessary Shutdown Case 25.2 in Ref. 201 describes a large C3 splitter tower that experienced poor separation, with the propylene product being only marginally on-spec and high propylene content in the bottoms. The reflux orifice plate was pulled out (which required tower shutdown) and found good. Damage or incorrect assembly was suspected. The tower was shut down. It took three weeks to purge and vent this huge tower and to remove its 700 manways. Neither damage nor installation problems were found, and the trays were clean. The reflux orifice plate was again checked and again found good. Eventually, heat and mass balances were compiled. An imbalance was found, with the reflux higher than the flow rate needed to match the reboil. An accurate kilowatt/hour meter was installed in the power supply to the reflux pump motor, and accurate pump curves were obtained from the pump manufacturer. Data collected showed the reflux flow meter to read 24–33% higher than the flow obtained from the kilowatt/hour meter. A subsequent investigation found that the reflux pump discharge piping was a spiral-wound (seamed) pipe, even though a seamless pipe was specified. Spiral flow in the proximity of an orifice meter can yield readings that are out by up to 50%. As replacing the pipe would have been expensive, the plant decided instead to calibrate the reflux flow meter to match the flow rate calculated from the pump curves. The operators raised the actual reflux to the design value. Tower operation was tremendously improved, and the propylene product came on-spec even at above the design rates and at the design reflux ratios. The energy balance now closed within ±5%. Incorrect Internal Flowrates This system is similar to the one shown in Figure 7.36. The measured liquid flow rates in the upper PA loop did not match the simulation (41). The cause was that a small portion of the lower (heavy vacuum gas oil, HVGO) product was cooled, used as a seal liquid to the vacuum pump (not shown), and then recycled to the tower via the lower (HVGO) return sprays. This stream was ignored in the simulation. Since the ignored seal oil return was much colder than the rest of the PA, there was a significant error in the heat balance. Energy balances are the primary tool for identifying internal leaks and overflows in direct contact cooling services, such as cooling circuits removing the heat of reaction or absorption, PAs in most refinery main fractionators, and chemical, olefins and sulfur plant quench towers (201). To demonstrate this technique, an application to the top section of a refinery fuels vacuum tower is shown in Figure 7.36. This section contained a PA, which was a direct contact total condenser (negligible vapor product) consisting of a packed bed and a total draw chimney tray underneath. Some of the liquid collected on the chimney tray was drawn as the LVGO product, whereas the rest was cooled and returned to the top of the packed bed where it cooled and condensed the ascending vapor. The tower had difficulty achieving the desired vacuum. During troubleshooting, an energy balance was compiled on the upper section. Since it is a total condenser (the chimney tray is a total draw tray), the flow rate of vapor into this section equals the flow rate of the LVGO product out. The LVGO section heat duty is therefore: Figure 7.36 Top section of the refinery vacuum tower in Section 7.3.2. (From Kister, H. Z., “Distillation Troubleshooting,” John Wiley and Sons, NJ, 2006. Reprinted by permission.) where QLVGO is the heat duty in Btu/h; HV and hL are vapor and liquid enthalpies in Btu/lb, with the subscripts indicating the temperature basis for each enthalpy; and MLVGO is the LVGO product flow rate in lb/h. Altogether, 20 MM Btu/h was removed from the vapor in this section. The LVGO section heat duty can also be calculated from the heat removed in the coolers: where MPA is the PA flow rate (as measured on the flow meter, Figure 7.36) in lb/h and CP is the specific heat in Btu/h lb°F. The heat removed by the coolers was much larger than that required to condense the LVGO product. Instruments were checked. Flow rates were compared with values calculated from control valve openings, pump curves, and spray nozzle pressure drops. The checks verified that none of the measured numbers was in gross error. The first heat duty calculation above, from the difference between the entering vapor and leaving liquid enthalpies, assumes that all the vapor entering the LVGO section exits as the LVGO product. This assumption is valid only if the condensed liquid does not escape in some alternate route. There are two plausible alternate routes: entrainment from the top of the tower or leakage/overflow from the chimney tray. Entrainment from the top of a refinery vacuum tower is readily detectable as liquid product (“slop”) in the ejector steam condensate. In this tower, little slop was produced. This leaves leakage/overflow from the chimney tray as the only plausible explanation. The energy balance permits the calculation of leakage/overflow. At 200 Btu/lb enthalpy difference between the entering vapor and condensate (above) and a heat duty of 50 MM Btu/h calculated from the heat removed by the coolers, the total condensate make in the LVGO section is So a total of 250,000 lb/h LVGO was condensed. Of this, 100,000 lb/h became the LVGO product. The balance leaked or overflowed down the chimney tray. In this tower, the leaking or overflowing LVGO ended up in the lower (HVGO) section, where it reduced the bubble point and HVGO draw temperature, causing a heat transfer bottleneck in the HVGO coolers. Seal welding of the chimney tray at the next turnaround solved the problem. Overflow/leakage over time can be logged. The above energy balance is repeated in regular intervals, typically once per day, and the leakage logged against time (Figure 7.37). An upward trend may indicate progressing corrosion or operators running a higher level. An upward trend can be reversed by lowering the level control set point, as was done on week 15. The log shows how effective the action is. Figure 7.37 Leakage from an LVGO collector tray logged against time. Other Cases References 128 and 130 describe very similar cases, where a chimney tray leaking cold LVGO generated heat removal problems in the HVGO circuit, which in turn led to difficulty in achieving the desired vacuum. Reference 443 described lower LVGO temperature due to overflow from a uniquely designed collector limiting preheat in the crude unit. Case 9.2 in Ref. 201 describes a similar case of leakage from the LVGO chimney tray in another refinery vacuum tower. In this case, the leak was so large that the level on the chimney tray was falling even when the LVGO product route was blocked in. To avoid losing prime on the pump, the refinery needed to pump a liquid bleed from the section below (the HVGO in Figure 7.36) into the LVGO section that would establish an LVGO draw and level control on the chimney tray. This bleed solved not only the pump problem, but also the vacuum problem. The HVGO bleed served as absorption oil that absorbed lighter components from the overhead vapor and unloaded the ejectors. In that case, product purity was not a concern. Case 9.4 in Ref. 201 describes a case of a refinery FCC main fractionator where a major leak in the bottom chimney tray was diagnosed by a heat balance. The leaking liquid was revaporized in the hot slurry section underneath, inducing excessive vapor recycle in the tower that flooded the upper trays. This diagnosis led to lowering the level set point on the chimney tray, which effectively reduced the leak and the vapor recycle and eliminated the flooding. When a chimney tray overflows or liquid leaks from the upper part of the chimneys, an energy balance can lead to completely eliminating the leak, as demonstrated by the case history below (158). Figure 7.38 shows the bottom section of an FCC main fractionator. Superheated feed from the reactor is first cooled in a packed bed by a circulating slurry PA stream by direct contact heat transfer to remove the superheat. The vapor leaving this bed ascends to the light cycle oil (LCO) PA bed, where part of it is condensed. The condensed liquid is collected by a chimney tray. Some of the chimney tray liquid is cooled and sent to the top of the LCO PA bed, some of it is sent to the top of the slurry PA bed as reflux, and the balance is drawn as the LCO product. The FCC main fractionator in this case worked well until halfway in the five-year run. At that time, there was a step change where the bottom slurry product became lighter, with no major change in the quality of the side product drawn above it. This was accompanied by severe operational upsets in which the bottom level was lost abruptly and there were also steep temperature changes near the vapor feed and smaller changes in other temperatures in the region. An extensive troubleshooting investigation combining operating charts analysis, product sampling, gamma scans, and wall temperature measurements yielded invaluable information and is described in detail elsewhere (158). A major lead was the input from operators that one action that helped restore the loss of the bottoms level was to reduce the LCO pumpdown (Figure 7.38). This was counterintuitive, but could make sense if there was a leak from the LCO draw tray. An energy balance was compiled around the LCO draw tray. It showed that an additional 3000 BPD liquid was condensed in the LCO PA and not accounted for in the product or pumpdown meters. To independently quantify the leak, transient heat balance data were collected in a special test. The data showed that the slurry section heat duty was 86.3 MM Btu/h when the LCO collector tray level was above 50% and sharply rose to 89.9 MM Btu/h when the level was reduced below 50%. The difference in duties corresponded to a leak of 2500 BPD, which was close to the figure obtained from the LCO PA heat balance at above the 50% level. This verified that lowering the level below 50% would eliminate the leak. The most likely cause is a leak consistent with a weld seam failure that resulted in a concentrated liquid stream pouring out into the lower section, violently vaporizing there and causing the operational upsets. A detailed explanation of the mechanism is provided in the original Ref. 158. Figure 7.38 Bottom section of the FCC main fractionator that experienced separation problems and upsets. (Based on Hanson, D. W., J. Brown Burns, and M. Teders, Hydrocarbon Processing, 96, p. 37, September 2017.) Other Cases Case 9.3 in Ref. 201 describes liquid overflow from the HVGO chimney tray in a refinery vacuum tower. The level transmitter showed the level to be well below the top of the chimneys, but the energy balance identified 9000 BPD out of the 22,000 BPD condensed in the PA unaccounted for in the product or reflux meters. Experimenting with reducing the level on the chimney tray from 40% to 30% completely eliminated the overflow, allowing more than 90% of the condensed liquid to be recovered. The observation that reducing the level from 40% to 30% completely eliminated the unaccounted for 9000 BPD indicates that the liquid descended by overflowing rather than leakage at the bottom of the chimney tray. If it were a leak, it would have been reduced when the level was lowered, but not totally eliminated. Case 3 in Ref. 127, which is also described in Refs. 128 and 130, is similar to Case 9.3 in Ref. 201. The energy balance showed that out of the condensed 282,000 lb/h in the HVGO PA, 63,000 lb/h was leaking or overflowing from the HVGO chimney tray, reducing the HVGO product yield. Repairing the tray eliminated the leak and raised the HVGO yield by about 63,000 lb/h. In Case 1 in Ref. 127, overflow from the reflux distributor to an LVGO/HVGO fractionation section caused poor separation and low LVGO yield. An energy balance on the LVGO PA, identical to this in Section 7.3.2, determined that the reflux rate was 1358 gpm, well above the design 850 gpm, causing the overflow. Cutting the LVGO PA duty reduced the reflux rate to 750 gpm, eliminating the overflow. Within 8 hours, good separation and the design LVGO yield were achieved. The jet fuel chimney tray in an atmospheric crude tower (Figure 7.39) had a central “hot” compartment, receiving liquid from the tray above, which was meant to be a total draw of the liquid from the tray above (395). Some of the drawn liquid was stripped externally and became the jet fuel product, whereas the rest was cooled and piped to the peripheral “cold” compartments of the chimney tray via the two floor nozzles. From the cold compartments, the liquid descended via side downcomers to the tray below. Each downcomer contained a horizontal impingement plate with two 210 mm × 140 mm openings that permitted liquid descent. Two 220-mm-tall weirs, one on each side of the hot compartment, extending from wall to wall, prevented the hot and cold jet fuel from mixing. Figure 7.39 Jet fuel draw tray having a hot and a cold compartment. (a) Chimney tray sketch, all dimensions in mm. (b) Flow patterns on the chimney tray. (c) Energy balance. (From Rendón, G. T., L. A. Quintero Rivera, J. A. Recio Espinosa, and R. A. Loubet Guzmán, “Troubleshooting Jet-Fuel Production on Crude Distillation Unit in Pemex Cadereyta Refinery,” The Kister Distillation Symposium, Topical Conference Proceedings,” p. 119, the AIChE National Spring Meeting, San Antonio, TX, April 29–May 2, 2013. Reprinted with permission.) The tower experienced an inability to maintain the liquid level on the chimney tray, which led to reflux, product, and temperature fluctuations, lights in the jet fuel, and loss of jet fuel yield to a lower product. One theory was that the openings in the impingement plates caused the overflow of liquid from the cold to the hot compartment. This theory was denied by the observations that the level on the hot compartment of the chimney tray tended to be low and often lost and that the jet fuel yield was low. To troubleshoot the problem, a heat balance was compiled on the upper section of the tower (Figure 7.39c). There were no PAs at or above the jet fuel draw, so all the heat entering and leaving the section was contained in the streams shown. The enthalpies were compiled from the mass balance. The overhead stream flow rate equaled the top product (naphtha) flow rate plus the top reflux rate, and its enthalpy calculated from this flow and the overhead temperature. The steam, jet fuel, and reflux flow rates were all metered, and from the flows and temperatures, their enthalpies were calculated. The upflowing vapor flow rate was calculated from a mass balance and its enthalpy from that flow and the measured temperature. The energy balance showed that the heat entering the section was 792 MM Btu/h, and the heat going out 760 MM Btu/h, an imbalance of 32 MM Btu/h. Like in the cases in Sections 7.3.2 and 7.3.3, this indicates unaccounted for liquid going down past the chimney tray. This was also consistent with the lower temperatures below the chimney tray and the loss of jet fuel yield to the lower product. The first suspect was leakage or overflow, like in the cases in Sections 7.3.2 and 7.3.3. Leakage tests were performed prior to the run, and showed no leakage. The next turnaround was close, and the leakage test was repeated, again showing no leakage. The root cause of the problem was identified with the help of the sketches in Figure 7.39a and 7.39b. Liquid from the seal pans above was meant to drop into the central hot compartment. However, the horizontal distance between each seal pan overflow weir and the top of the weir separating the compartments below was only 25 mm, so some of the hot liquid landed in the cold compartments (Figure 7.39b) and went to the trays below unmetered and unaccounted for. The amount descending into the cold compartments would vary, leading to level fluctuations in the hot compartment and in the reflux and product flow rates. Based on this diagnosis, the weirs separating the hot and cold compartments were installed further apart, ensuring all the hot liquid descended into the hot compartment. Also, the openings at the downcomer impingement plates were widened to prevent future bottlenecks. This completely eliminated the problem. Many towers have preheaters, precoolers, and other heat-integrated reboilers and/or condensers. Each one of these may be prone to leakage. The leak will always proceed from the high-pressure to the low-pressure side. However, in many systems, the pressure on one or both sides may alternate, and so would the direction of the leakage. Exchanger leaks into or out of the tower cause product or utility contamination and, in many cases, also safety and/or environmental hazards that may be severe. A complete book can be written on the safety and environmental hazards of leaks, and these are dealt with at length in most safety and environmental texts. The few pages here cannot do justice to this topic, so these hazards are outside the scope of this book. The discussion below focuses on some contamination considerations, although it may also be useful for diagnosing the hazards mentioned above. Also discussed, but not so well appreciated, is that leaks into the tower from heat exchangers can induce premature flood or other instability issues in the tower. Component Analysis Analyzing both the process and the heat transfer streams leaving the exchanger is invaluable for identifying exchanger leaks. Focus on analyzing a sample from the lower-pressure stream(s) leaving the exchanger. Alternatively, when the heat transfer fluid is at a higher pressure than the tower, analyze the tower top and bottom products for components in the heating or cooling fluids. In one refinery vacuum tower (443), detecting light components in the naphtha and kerosene range in the slop top product, and having the slop rate doubled, diagnosed the leakage in a vacuum gas oil PA cooler that preheated crude oil. If a steam or cooling water leak is suspected, check for water in the bottoms or top products and for the presence of cooling water chemicals. When the tower pressure is higher than the heat transfer fluid pressure, analyze the heat transfer stream leaving the exchanger for process components. In some cases, these components are gases, which can be detected where the heat transfer stream is vented. With steam-heated (or other vapor-heated) reboilers controlled by a valve in the steam (or vapor) line, the condensing pressure in the reboiler varies with the heat load and with the reboiler fouling, so the direction of the leak may vary with the process conditions. In contrast, when the control valve is in the condensate line from the reboiler, the condensing pressure is that of the steam or vapor supply, so the direction of a leak is well defined. However, with the condensate control scheme, a variable portion of the tubes is submerged in the condensate. With condensate density being orders of magnitude higher than that of steam, the quantity of condensate leaking will be much higher if the leak is in the tube portion submerged in the condensate (208). Similar considerations may apply to a condenser, depending on whether its control valve is in the inlet or outlet. In vacuum towers, leakage of air or other non-condensable gases (including steam, which may act as a non-condensable under deep vacuum) can destabilize the tower pressure control, especially when using an internal condenser (210). Theunick’s statement (479) “Effectively managing the vapor inventory is the key to controlling the pressure” summarizes this issue, as has been demonstrated in a number of case studies (210, 479, 491). Accordingly, destabilization of a pressure control scheme may be a symptom of leakage of non-condensables or steam. An analysis of the vent gases may sometimes provide a valuable clue. Field Tests As the leak will always proceed from the high-pressure to the low-pressure side, a valuable field test, if feasible, is changing the pressure on one of the sides, so it rises above or falls below that of the other side. A change in the performance or in the composition of the streams exiting the exchanger indicates a change in the direction of the leakage. The case study by Lieberman (286, 295) cited in Section 1.2 is a classic illustration of the effectiveness of this technique. Tests in which the heat duty of the exchanger is varied can help diagnose a leak as demonstrated in Case 1. In a few cases (like in Case 2), it may be practical to temporarily cut the heat transfer stream and check for process components on the heat transfer side. Tracer techniques (Section 6.5) have been very effective for leak detection. Energy and Mass Balances A mass and heat balance can be valuable for diagnosing, as illustrated in the cases below. Figure 7.40 Hydrotreater fractionator with three feeds and two feed-bottoms interchangers. (From Kister, H. Z., “Distillation Troubleshooting,” John Wiley and Sons, NJ, 2006. Reprinted with permission.) Case 1 (201) A series of flashes split the feed to a hydrotreater fractionator into three streams (Figure 7.40). The lower feed was the main tower feed. The upper and lower feeds were preheated by the tower bottoms, and their temperatures automatically controlled by manipulating bypasses on the heating sides of the preheaters. Following a debottleneck in which the trays above the top feed were retrofitted by high-capacity trays, the tower flooded at well below the design loads. The flash point of the bottom product was low, while the end point of the top product was high, indicating poor separation. A tower simulation based on operating conditions gave a good match between all measured and simulated values, except that the simulated reboiler duty was much less than the measured duty. The possibility of a feed preheater leak was considered. The fractionator bottoms was analyzed for feed components that usually end up in the overhead, but those were not found. The possibility of an exchanger leak was discounted. At one time, the feed from the upper preheater was running hot even though the bypass around the preheater was fairly wide open. In an attempt to lower the feed temperature, the manual valve MV downstream (Figure 7.40) was throttled. This should have reduced the upper feed temperature, but instead, this temperature increased. The only plausible explanation is massive leakage from the bottoms side into the feed side of the upper feed preheater. A tower resimulation with a leak of 19,000–20,000 BPD fully matched plant data, including reboiler duty. At the next opportunity, the system was taken off-line and the leak repaired. Following the fix, the flooding disappeared and separation was good. Case 2 (286) This case is described in detail in Section 1.2. In this case, a debutanizer reboiler was heated by hot oil from the main fractionator in an FCC unit. When the debutanizer pressure exceeded 130 psig, the debutanizer bottoms leaked into the fractionator. The light naphtha debutanizer bottoms leaking into the hot fractionator vaporized, which doubled the rate of naphtha production from the fractionator and flooded the top of the fractionator. At pressures less than 130 psig, the hot, heavy fractionator oil leaked into the debutanizer and would have been detected upon analysis. Case 3 (described in detail as Case 20.4 in Ref. 201). A rosin tower operated at 37 mmHg abs. in a tall oil refinery had two separate PA cooling loops to remove heat and generate reflux. At one time, following a reconnection of one side-draw line, the top PA low-flow alarm sounded. Initially, it was thought that its strainer was plugged, but switching to the spare pump (that had its own strainer) did not help. It was then realized that the line reconnection raised tower pressure to 50 mmHg abs., indicating a steam leak into the tower, with steam acting as a non-condensable at these low pressures. The steam leak was from a nipple connected to the draw line. Disconnecting the draw line returned the pressure back to 37 mmHg abs. The top PA came good and remained good after the leak was fixed and the draw line reconnected. The reason for the low top PA flow was the shift of heat duties between the PA loops. At the higher pressure, the temperatures at the lower PA loop were higher, which condensed more of the vapor. The upper PA loop was thus starved of the vapor needed to condense and sustain the PA flow.
Chapter 7
Thermal and Energy Troubleshooting
7.1 WALL TEMPERATURE SURVEYS
7.1.1 Dos and Don’ts for Temperature Surveys
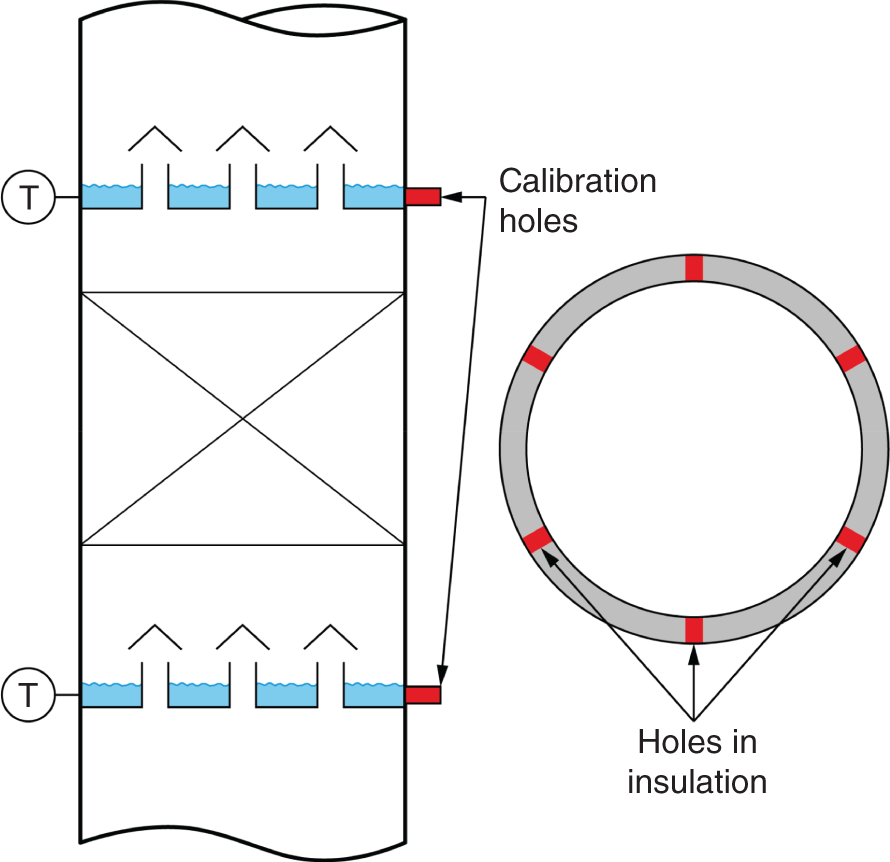
7.1.2 Diagnosing Internals Damage
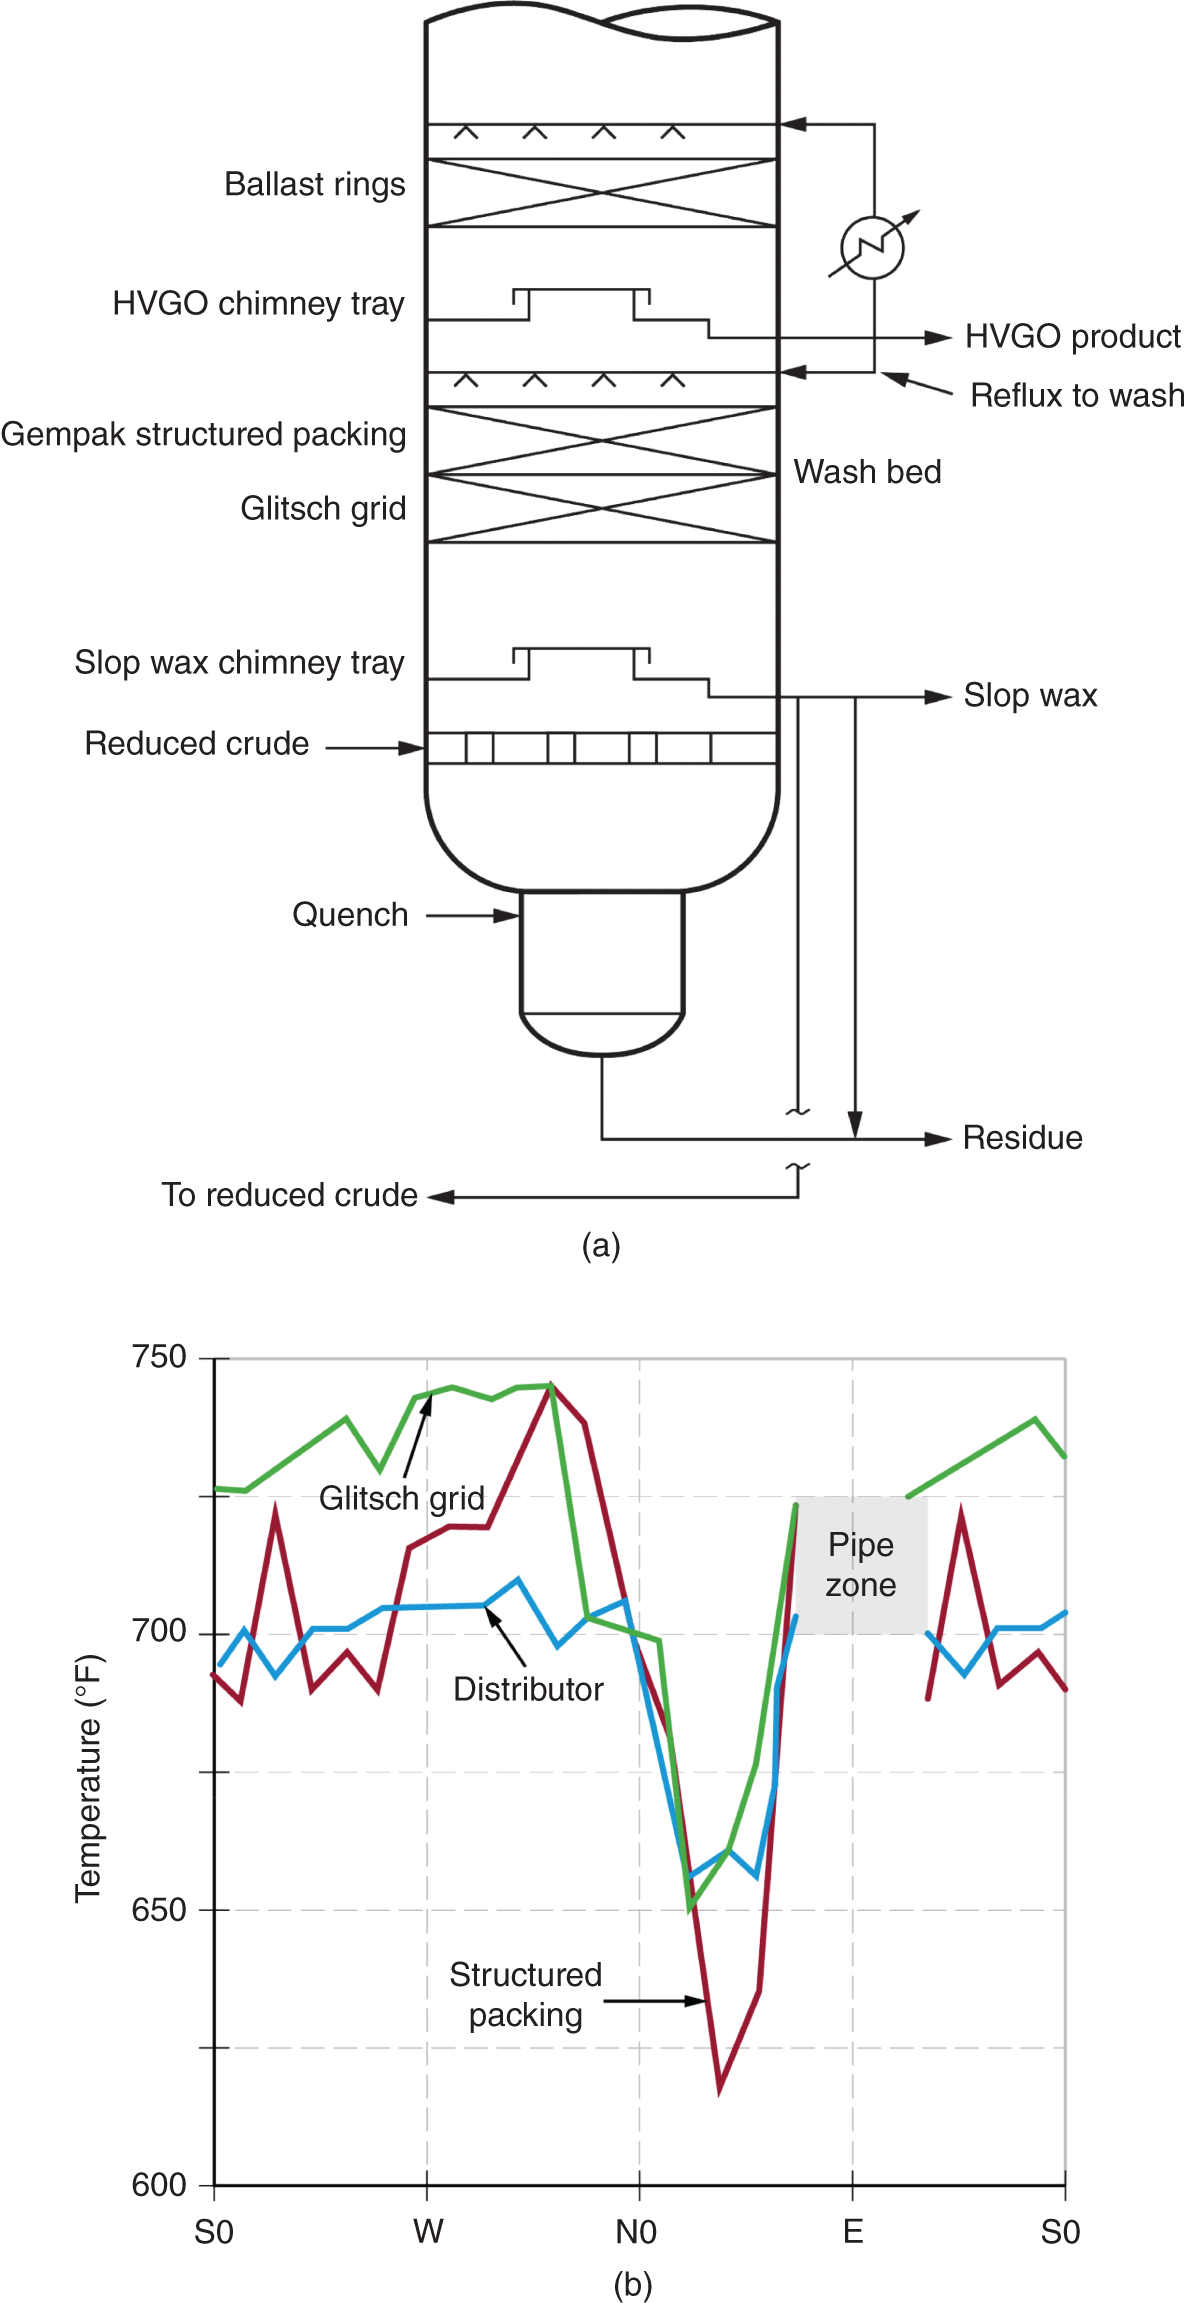
7.1.3 Diagnosing Packing Maldistribution
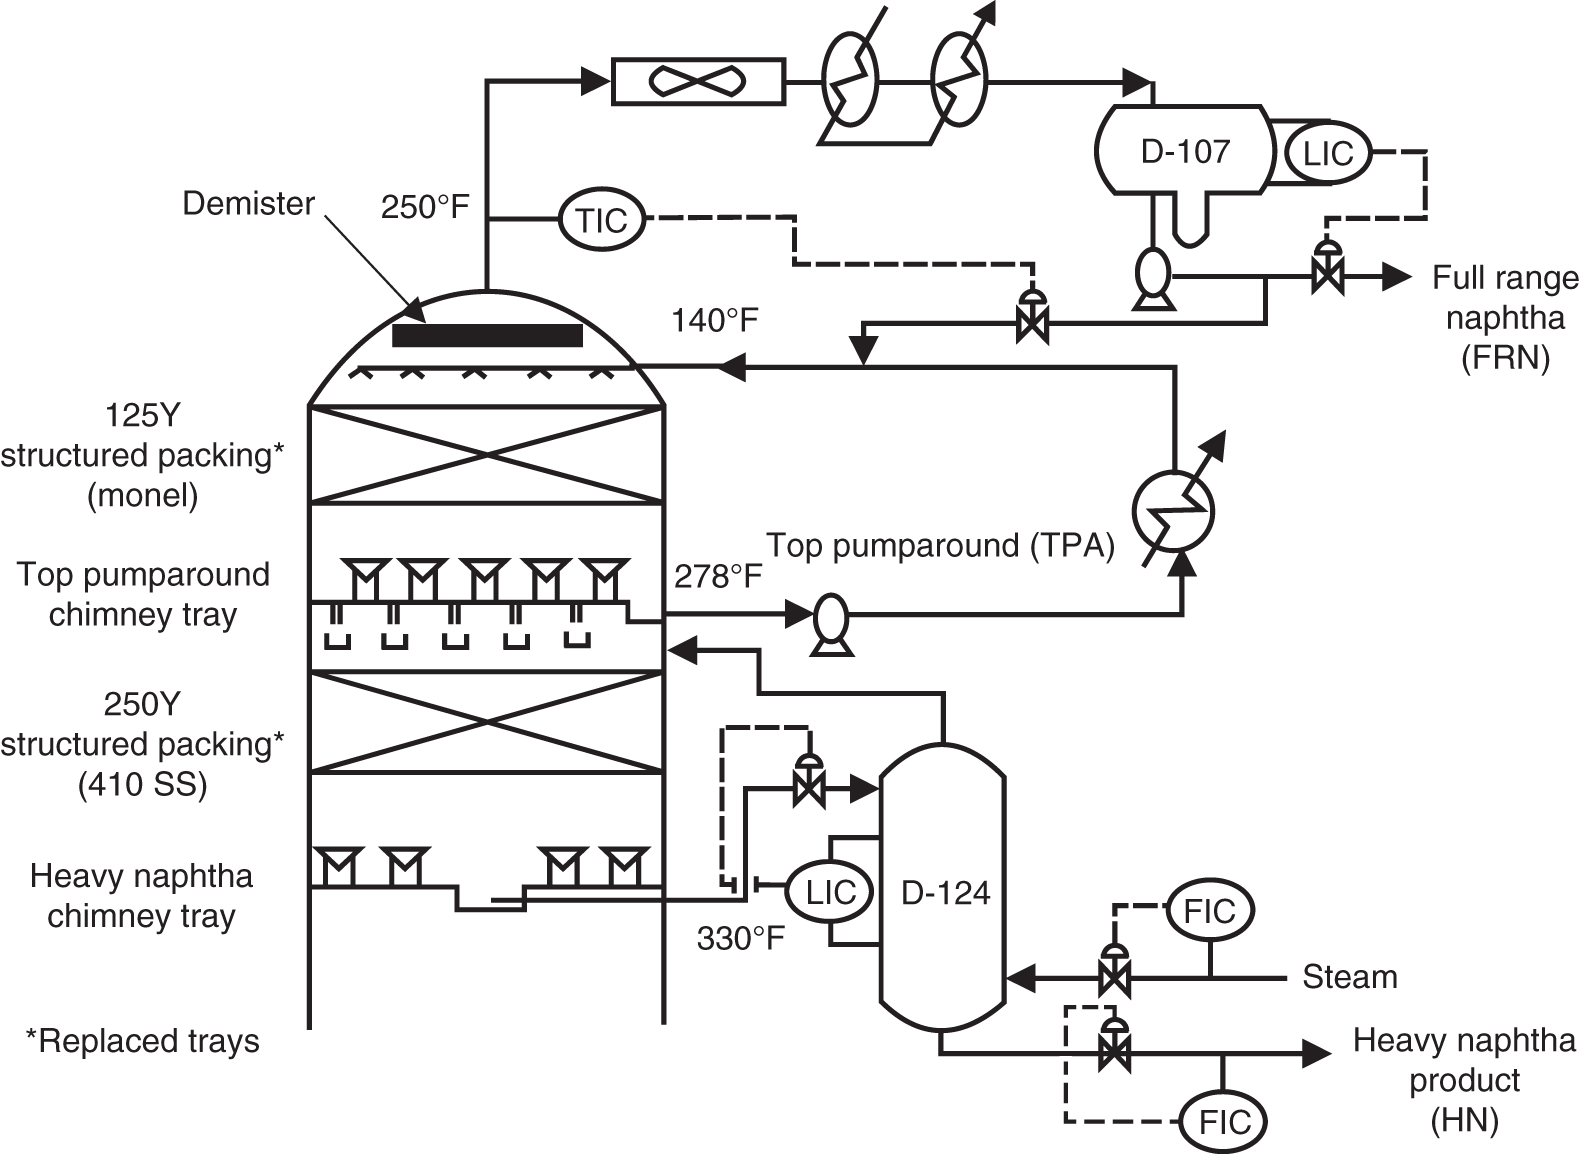
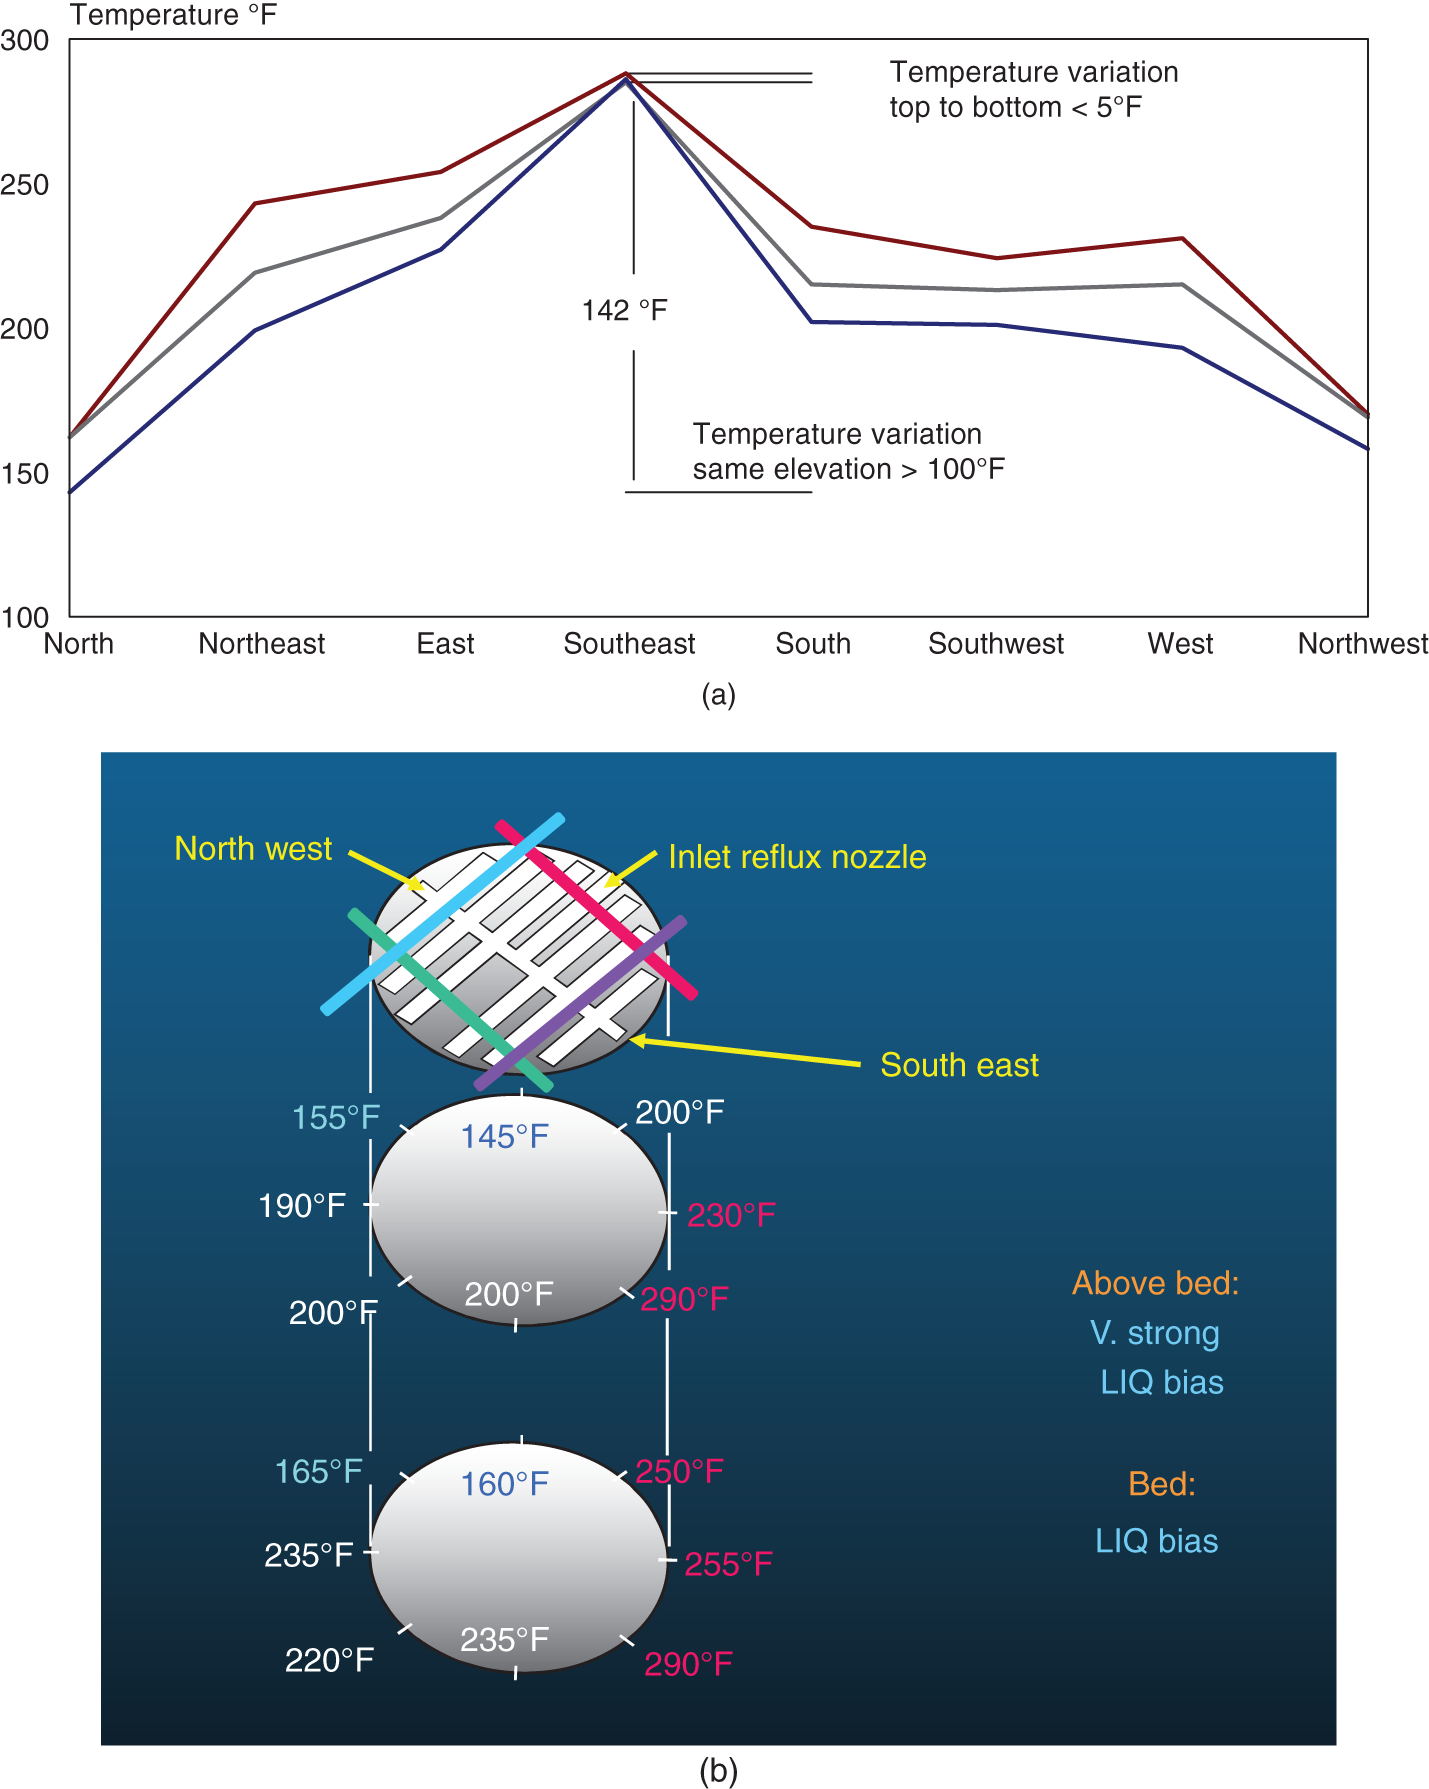
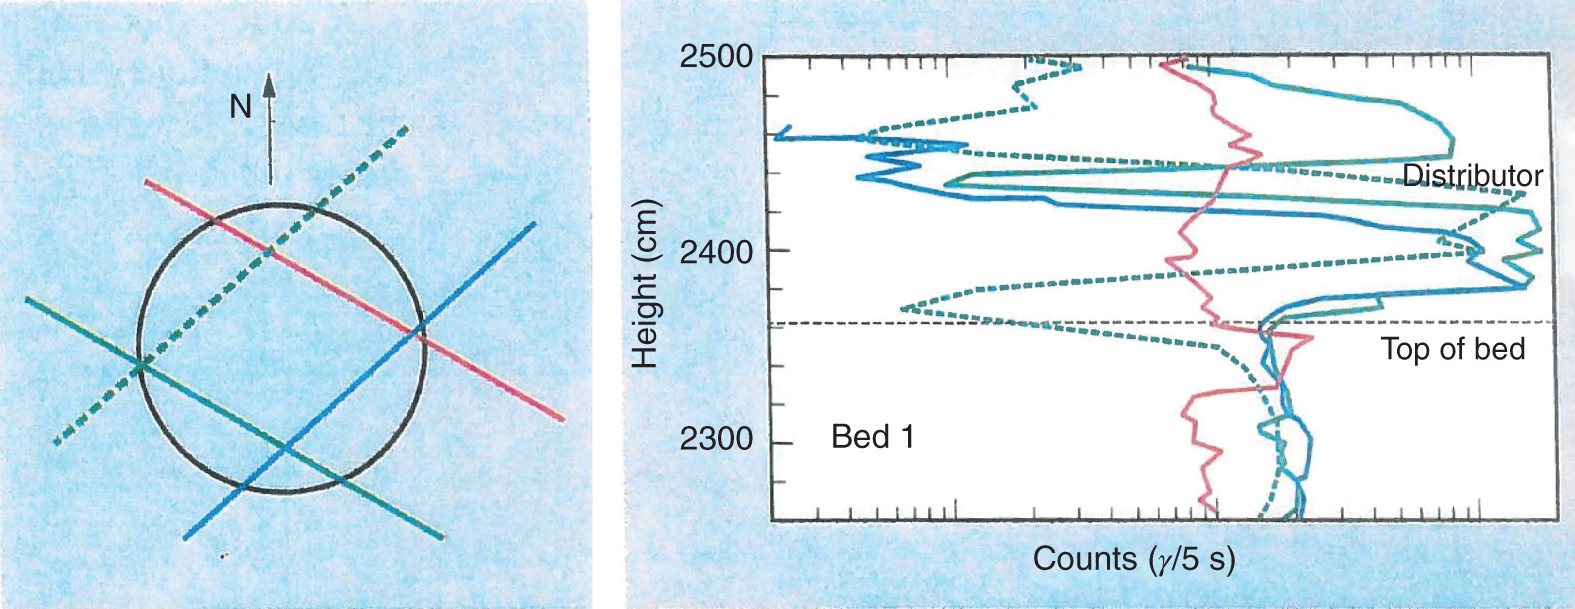
7.1.4 Time Study for Diagnosing the Nature of Instability
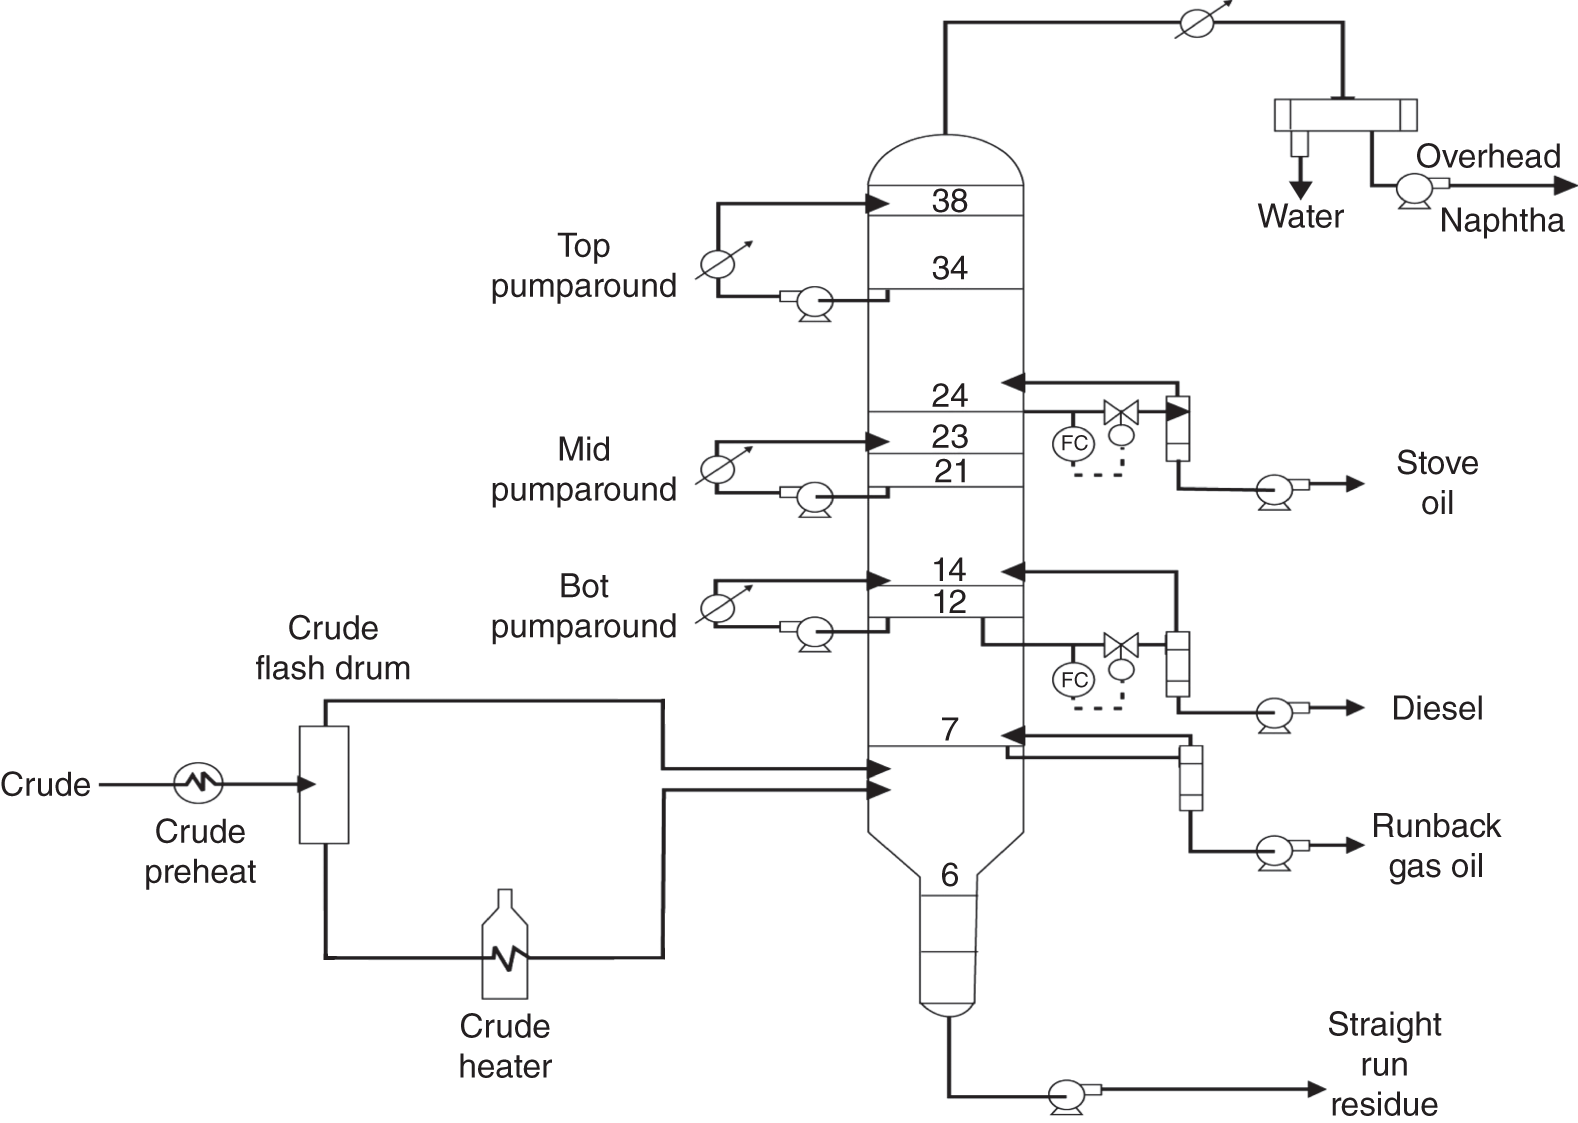
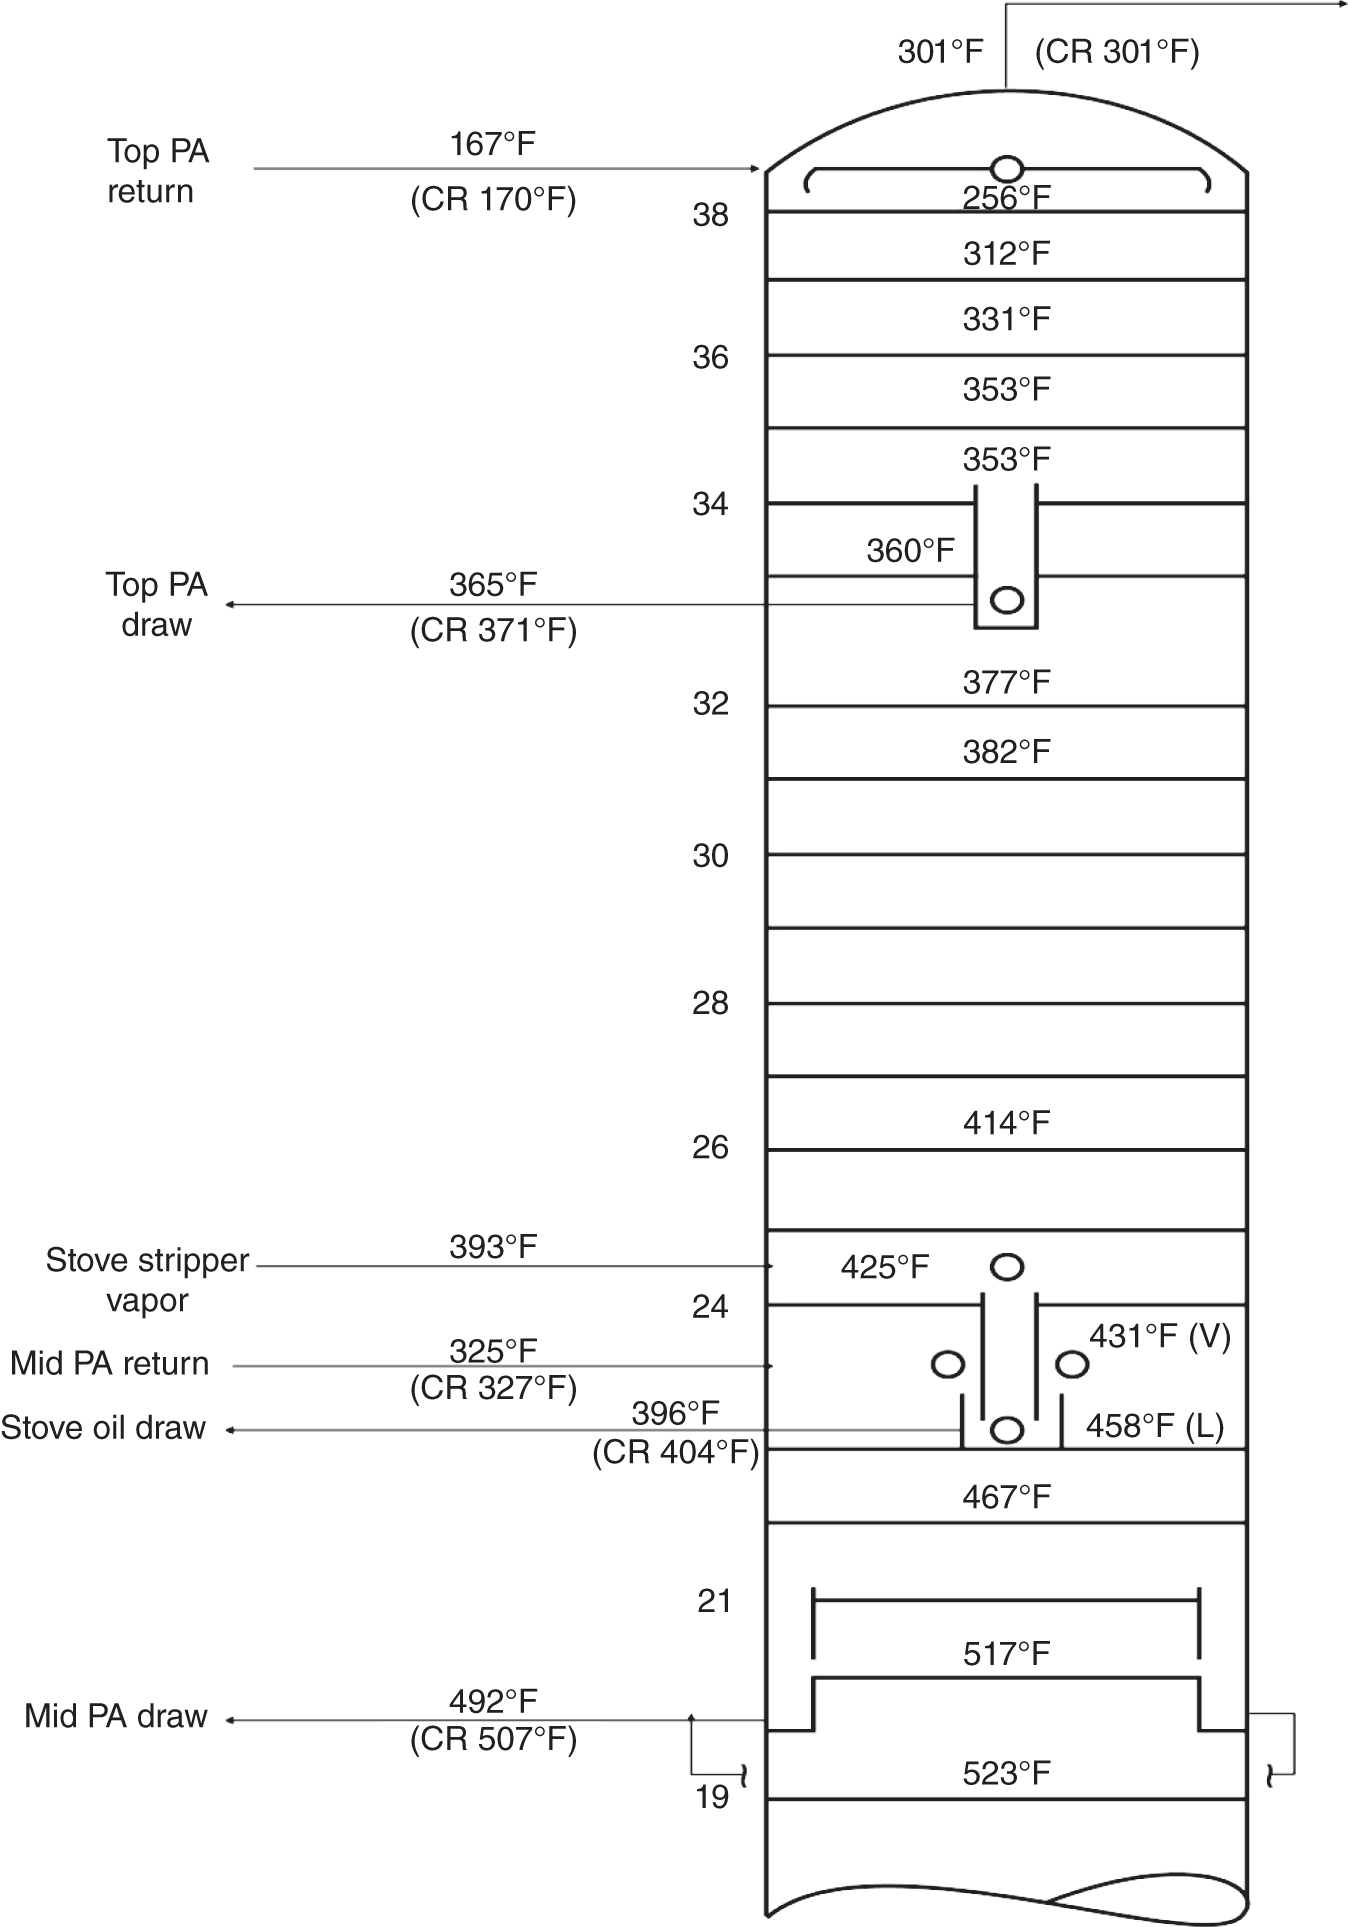

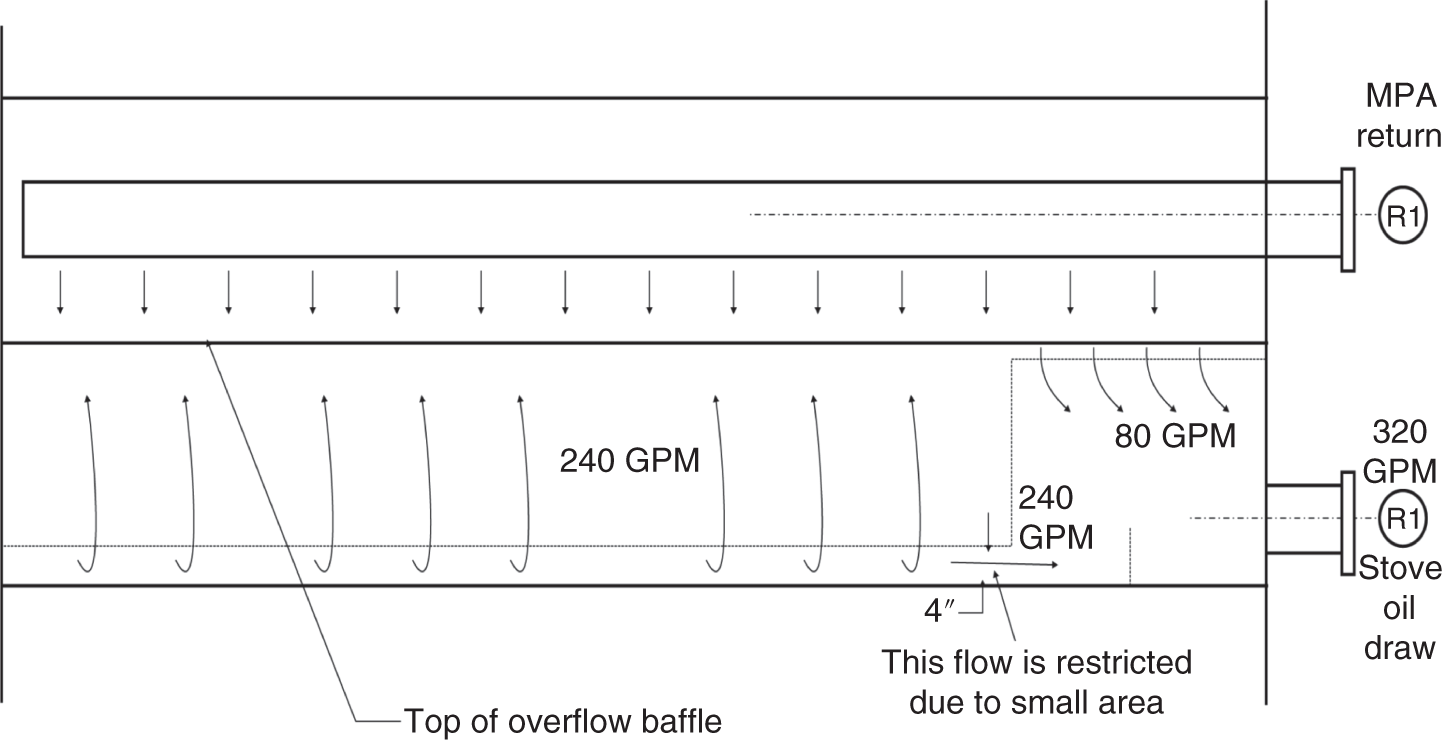
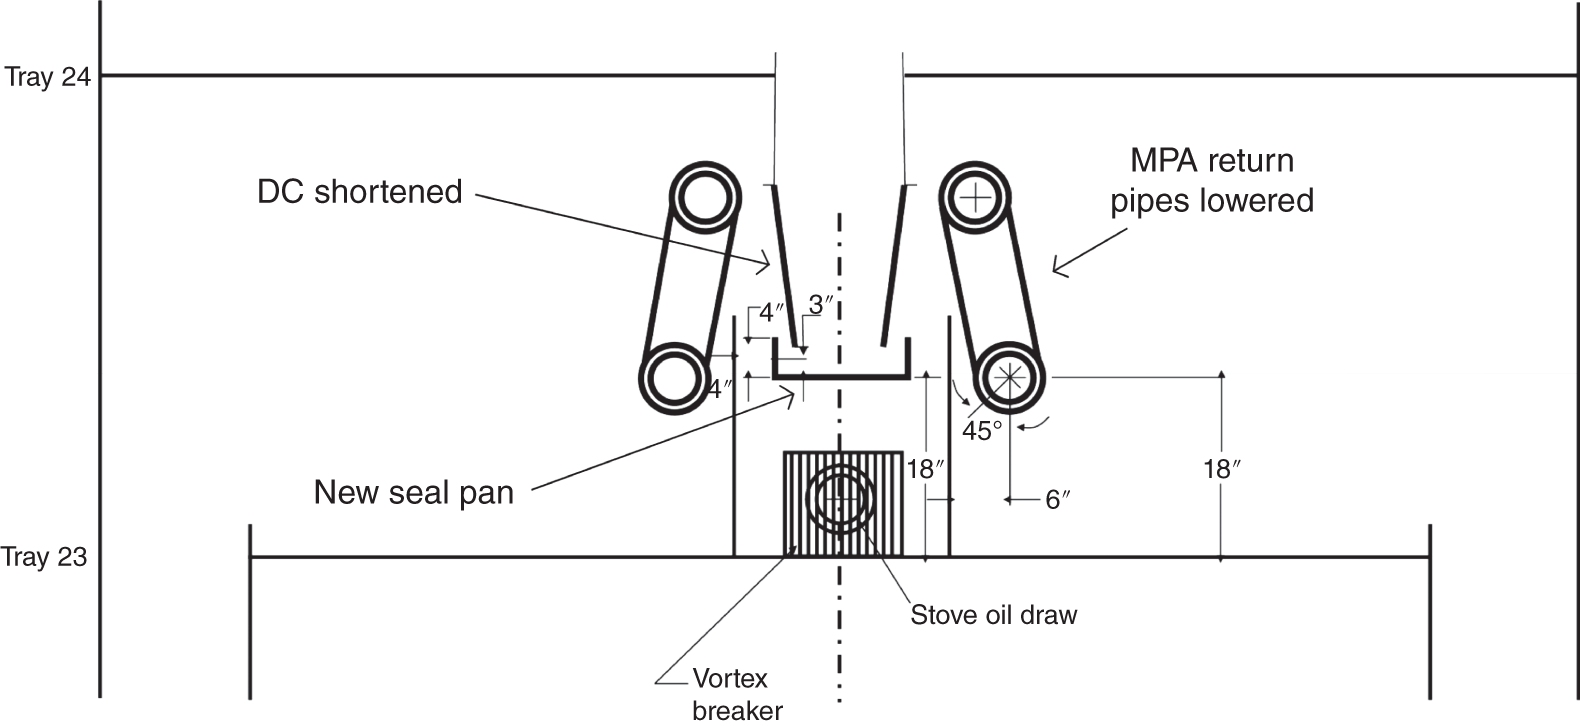
7.1.5 Diagnosing an Unexpected Second Liquid Phase
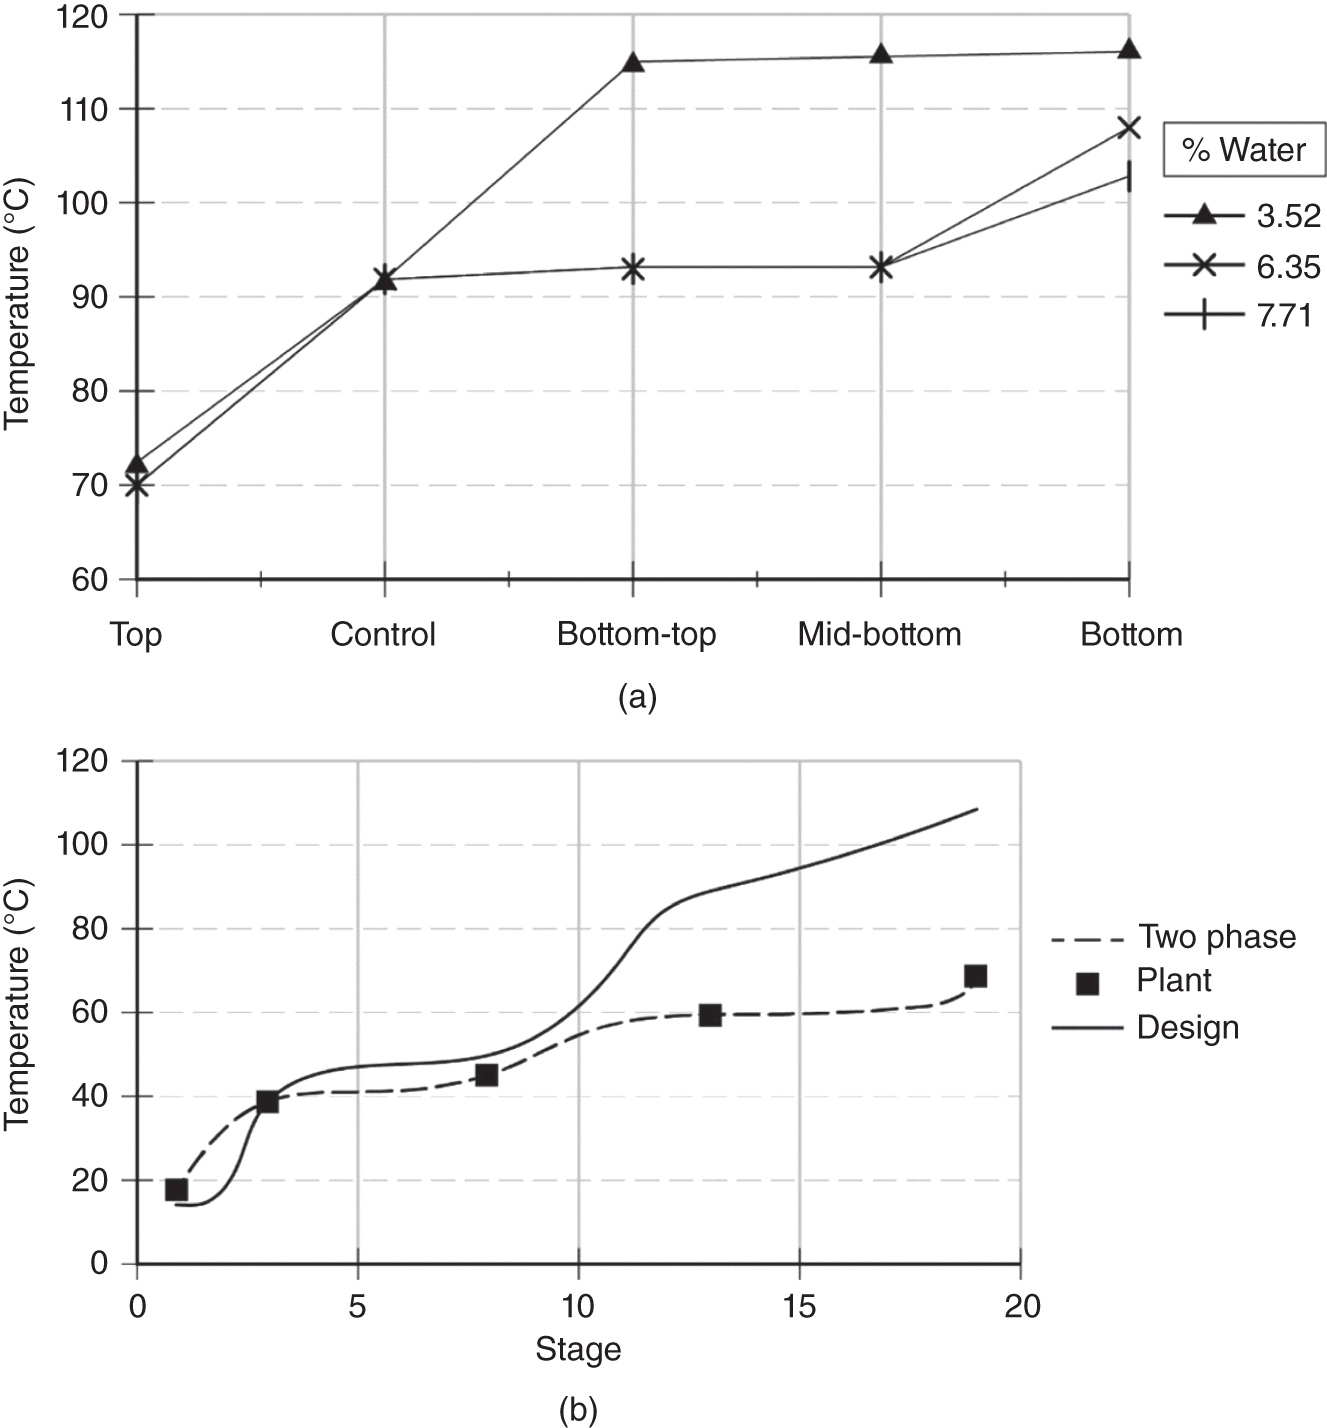
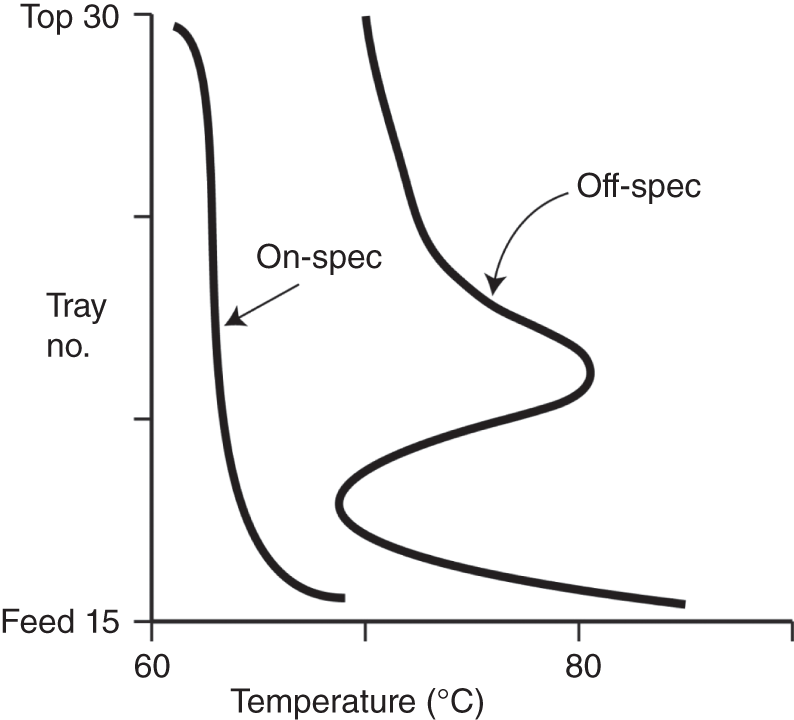
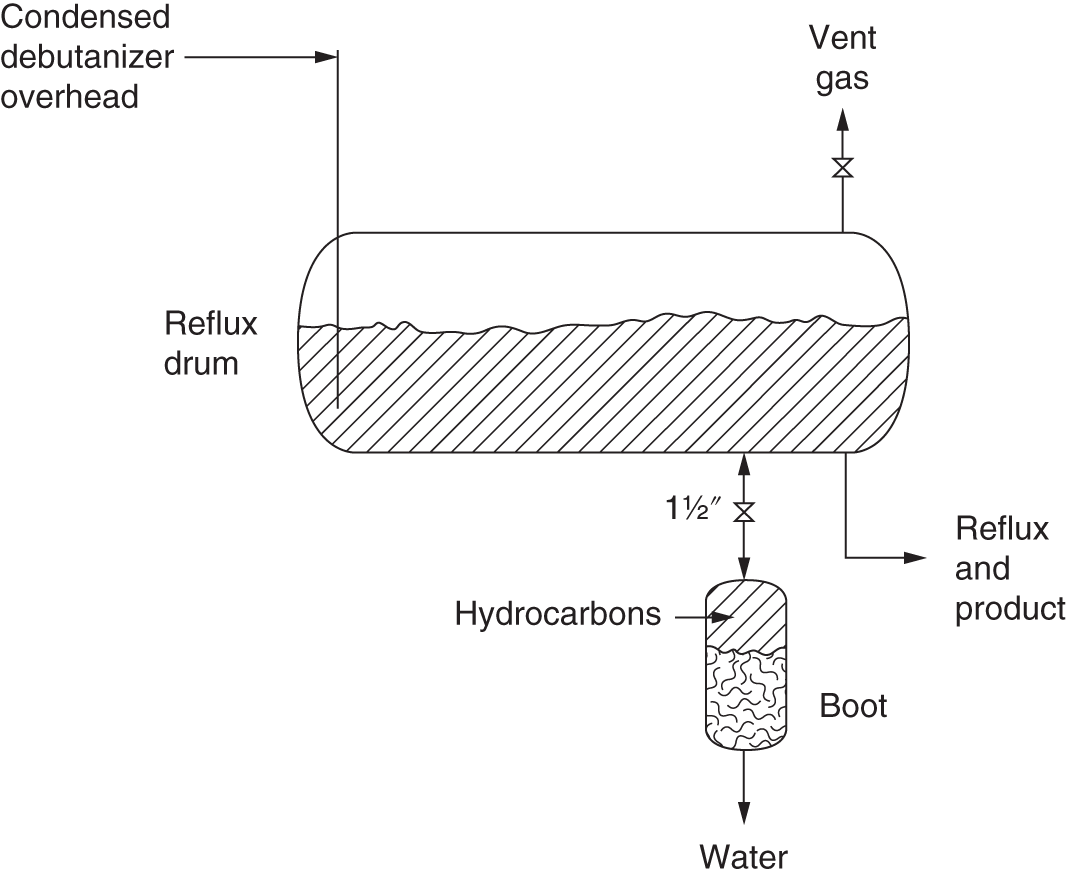
7.1.6 Diagnosing Poor Mixing in a Packing Distributor
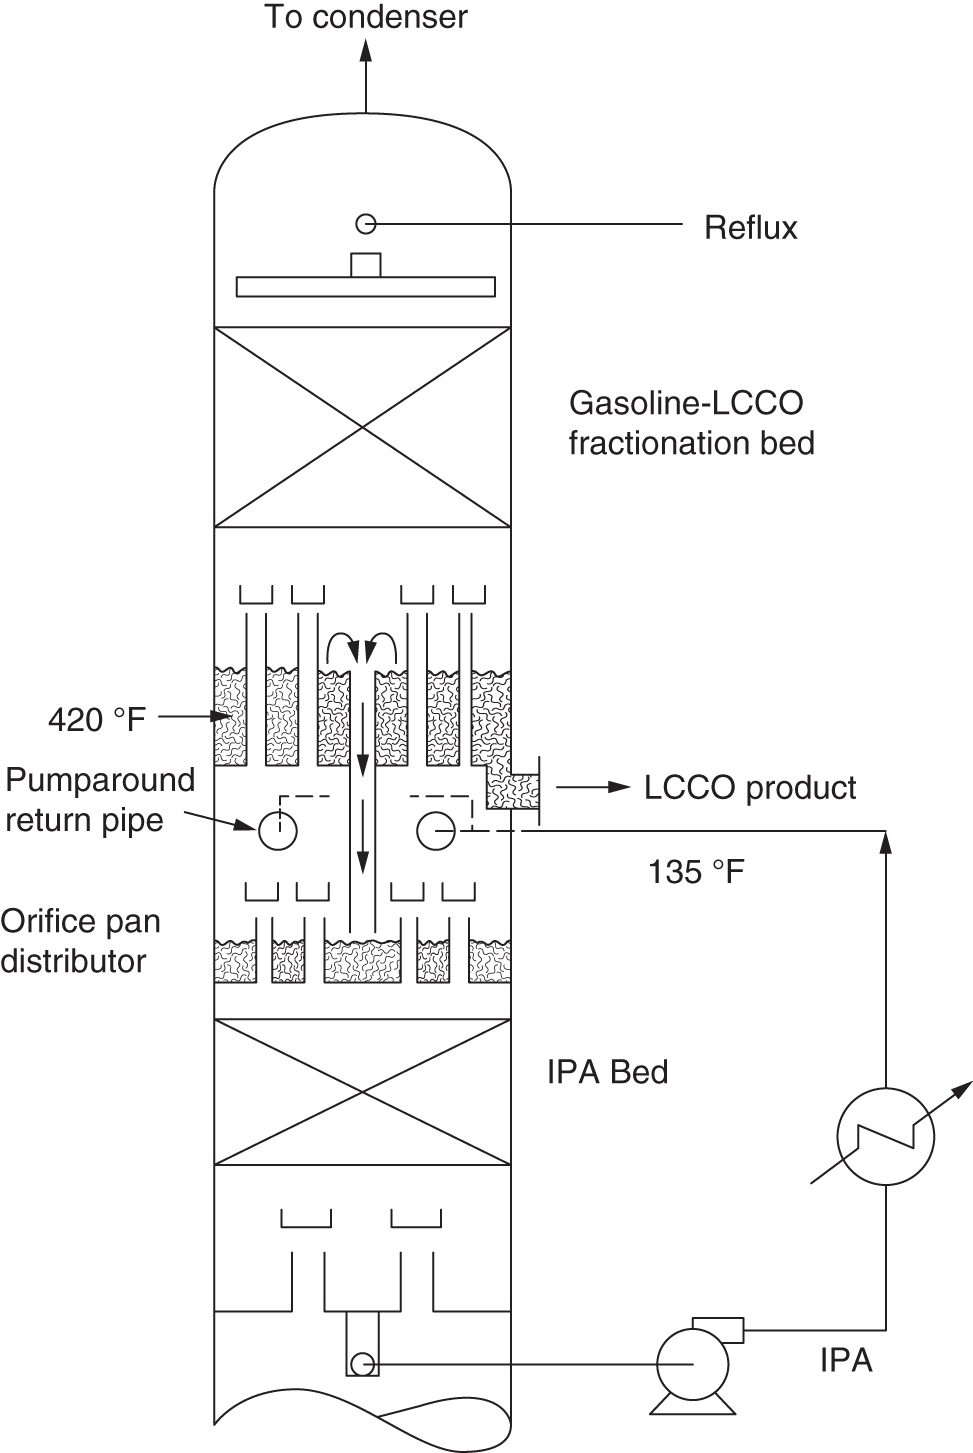
7.1.7 Diagnosing Flashing in a Packing Distributor

7.1.8 Identifying Various Boiling Regions in a Kettle Reboiler
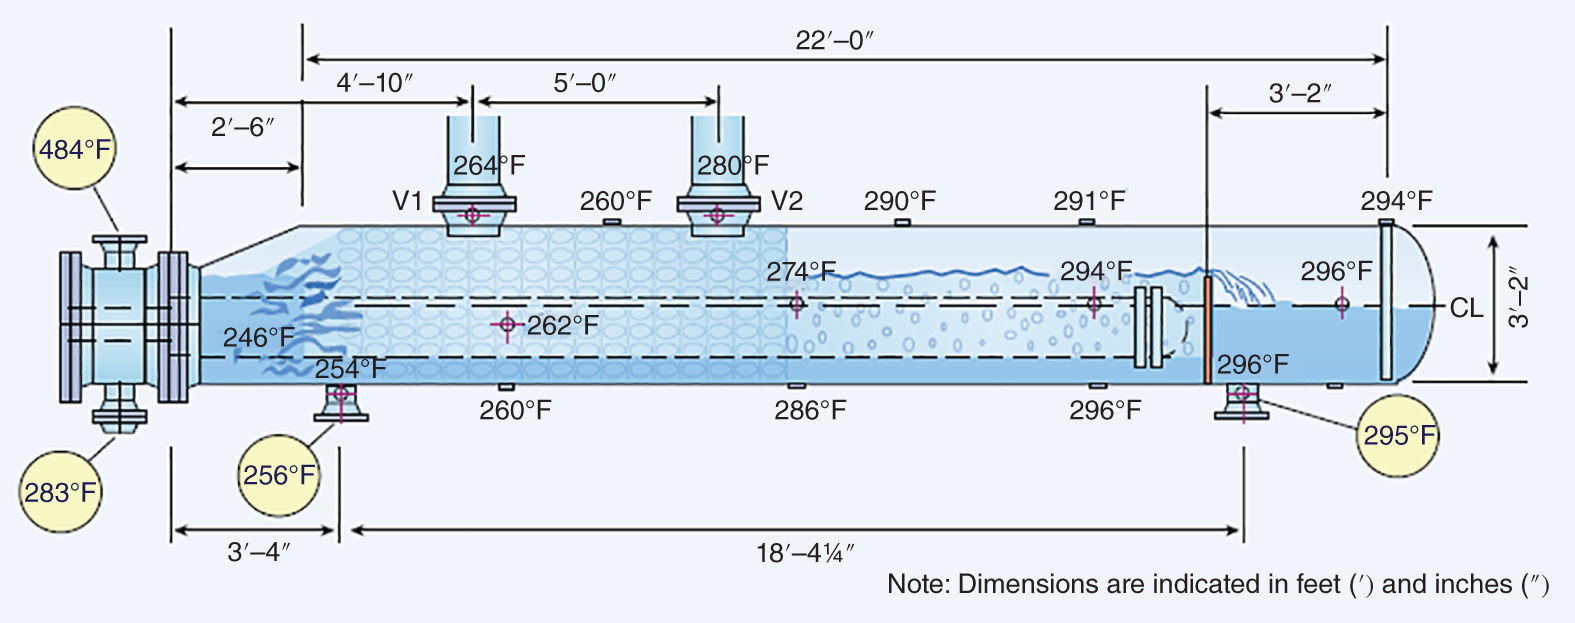
7.1.9 Identifying Plugging Zone in a Ladder Pipe Distributor
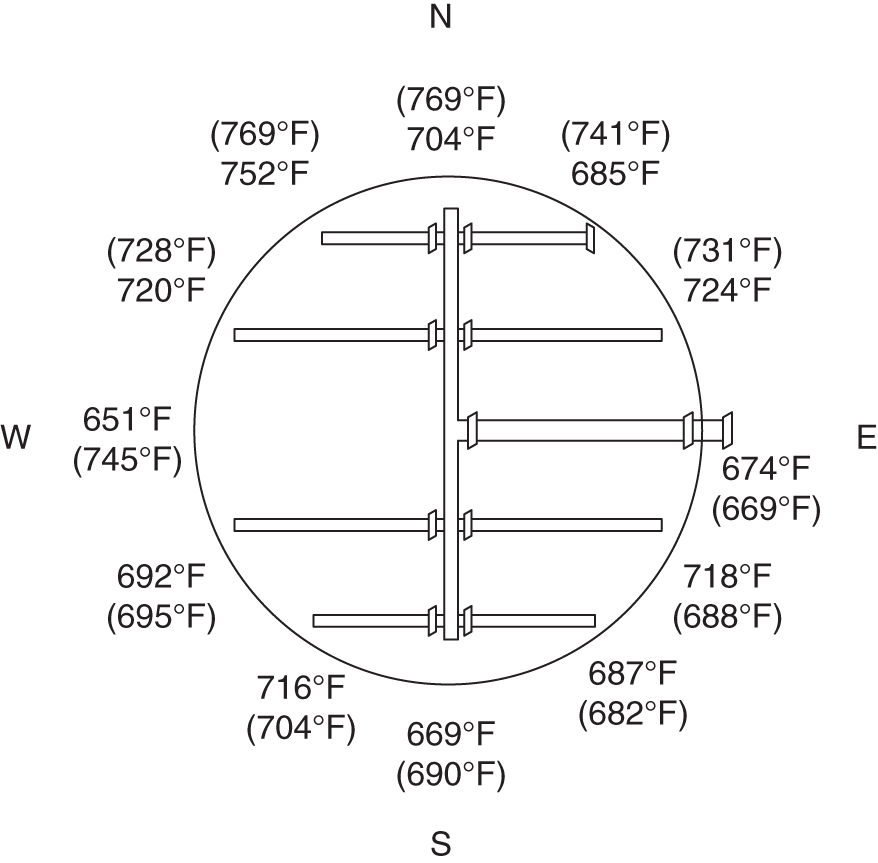
7.1.10 Identifying Uneven Quench Distribution in a Bottom Sump
7.1.11 Identifying Flood
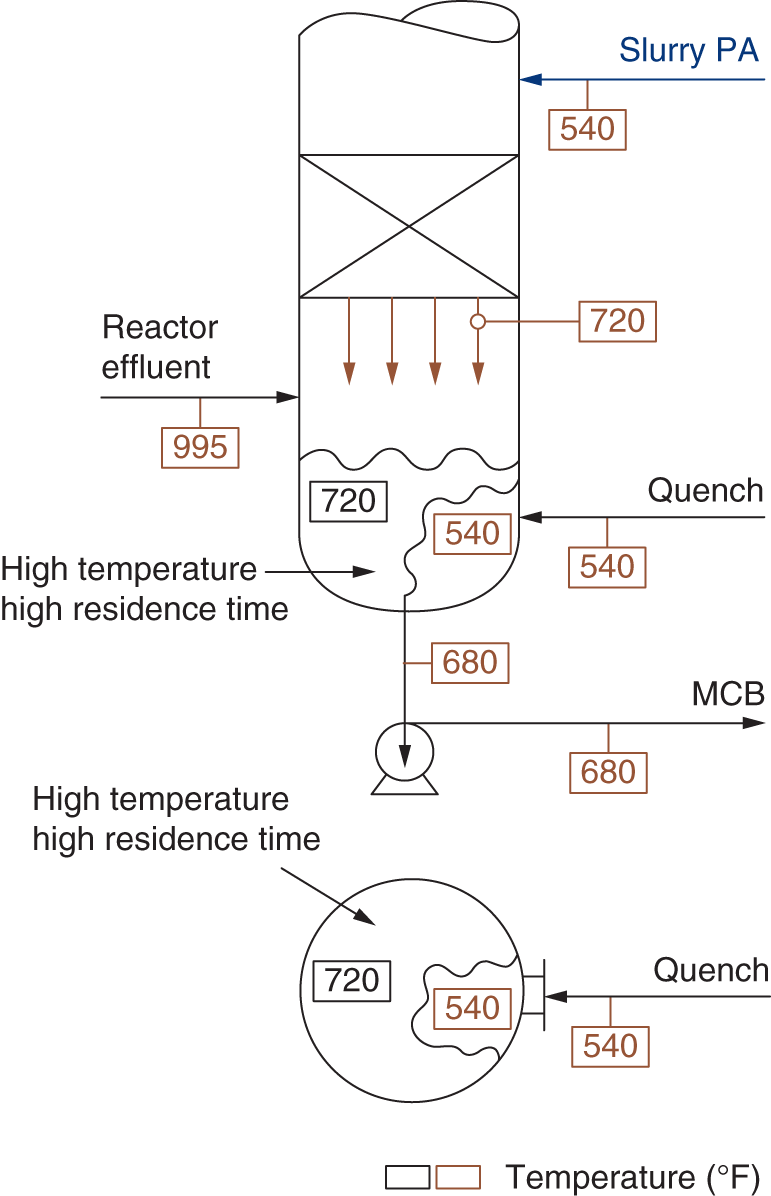
7.2 THERMAL CAMERA (THERMOGRAPHY) APPLICATIONS
7.2.1 Dos and Don’ts for Thermal Camera Imaging
7.2.2 Diagnosing Packing Maldistribution
7.2.3 Diagnosing Vapor or Liquid Maldistribution in Insulated Towers
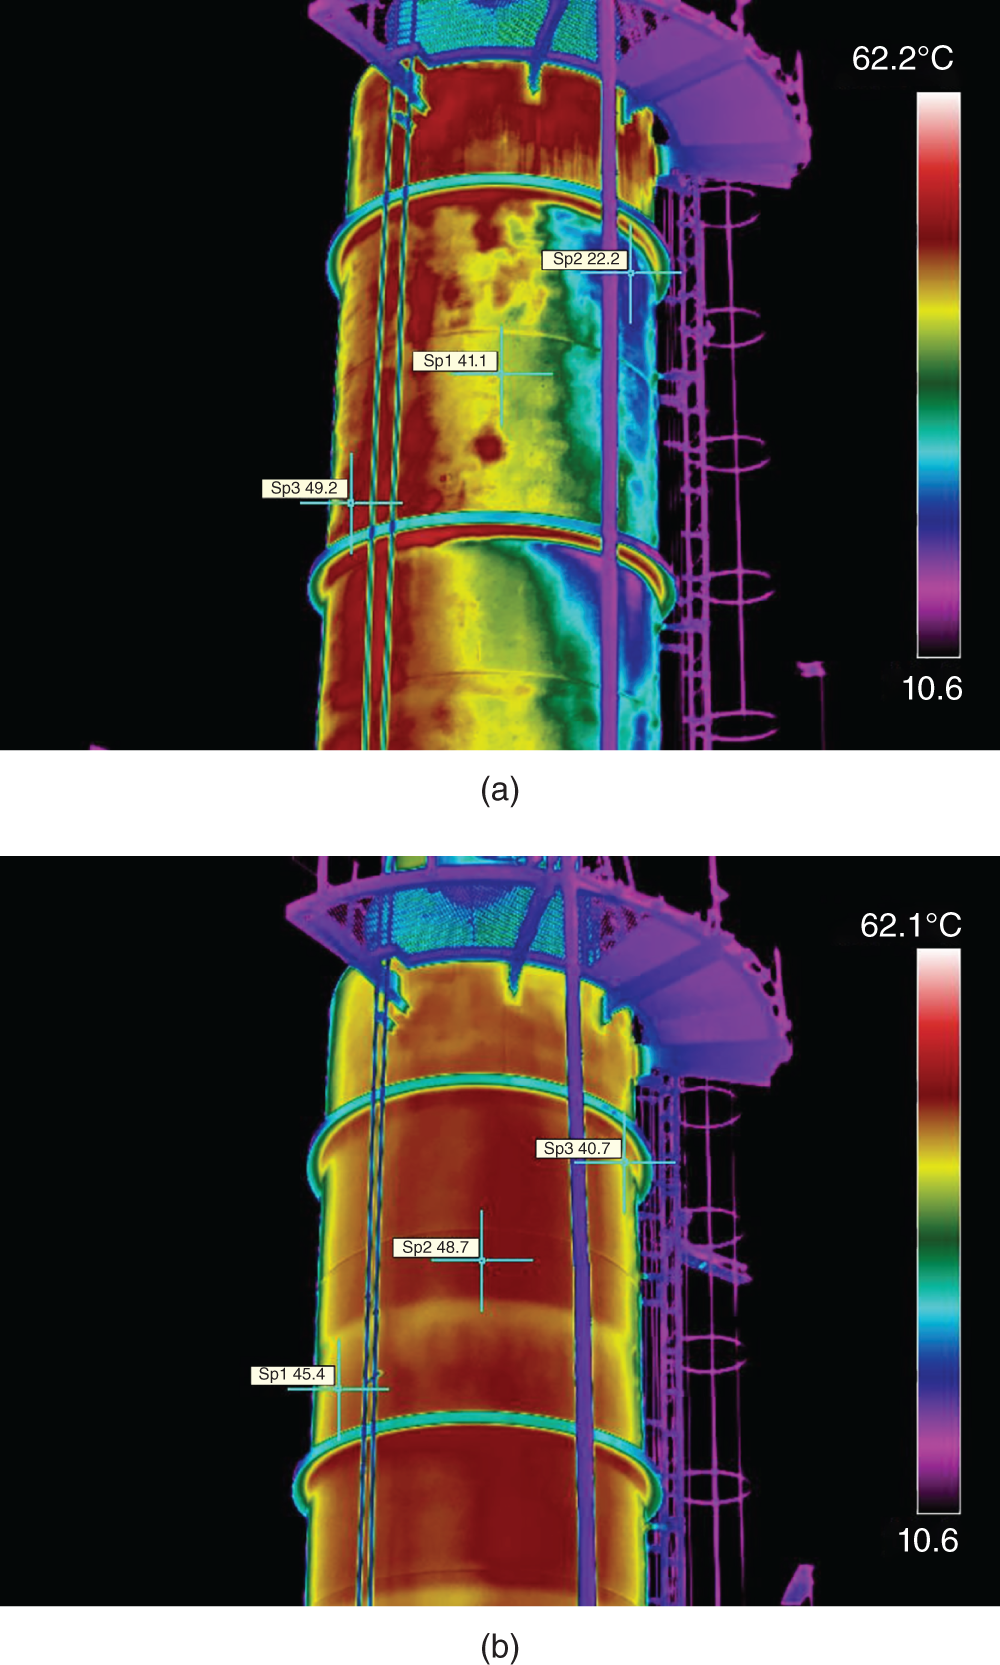
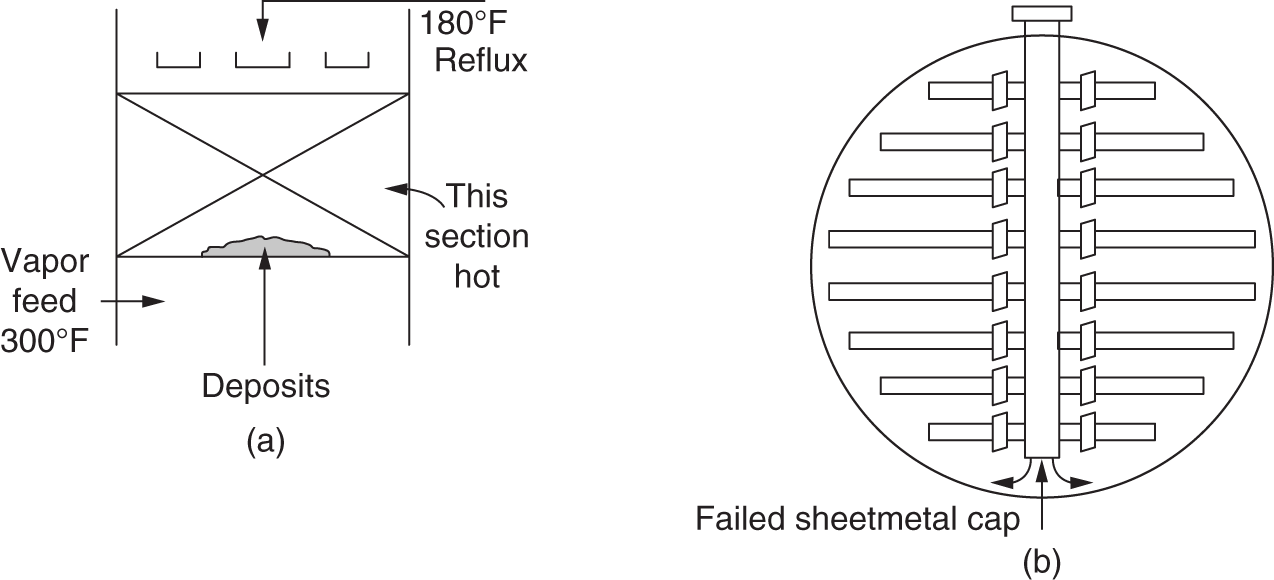
7.2.4 H2S Amine Absorber Temperature Profile, Foam, and Flooding
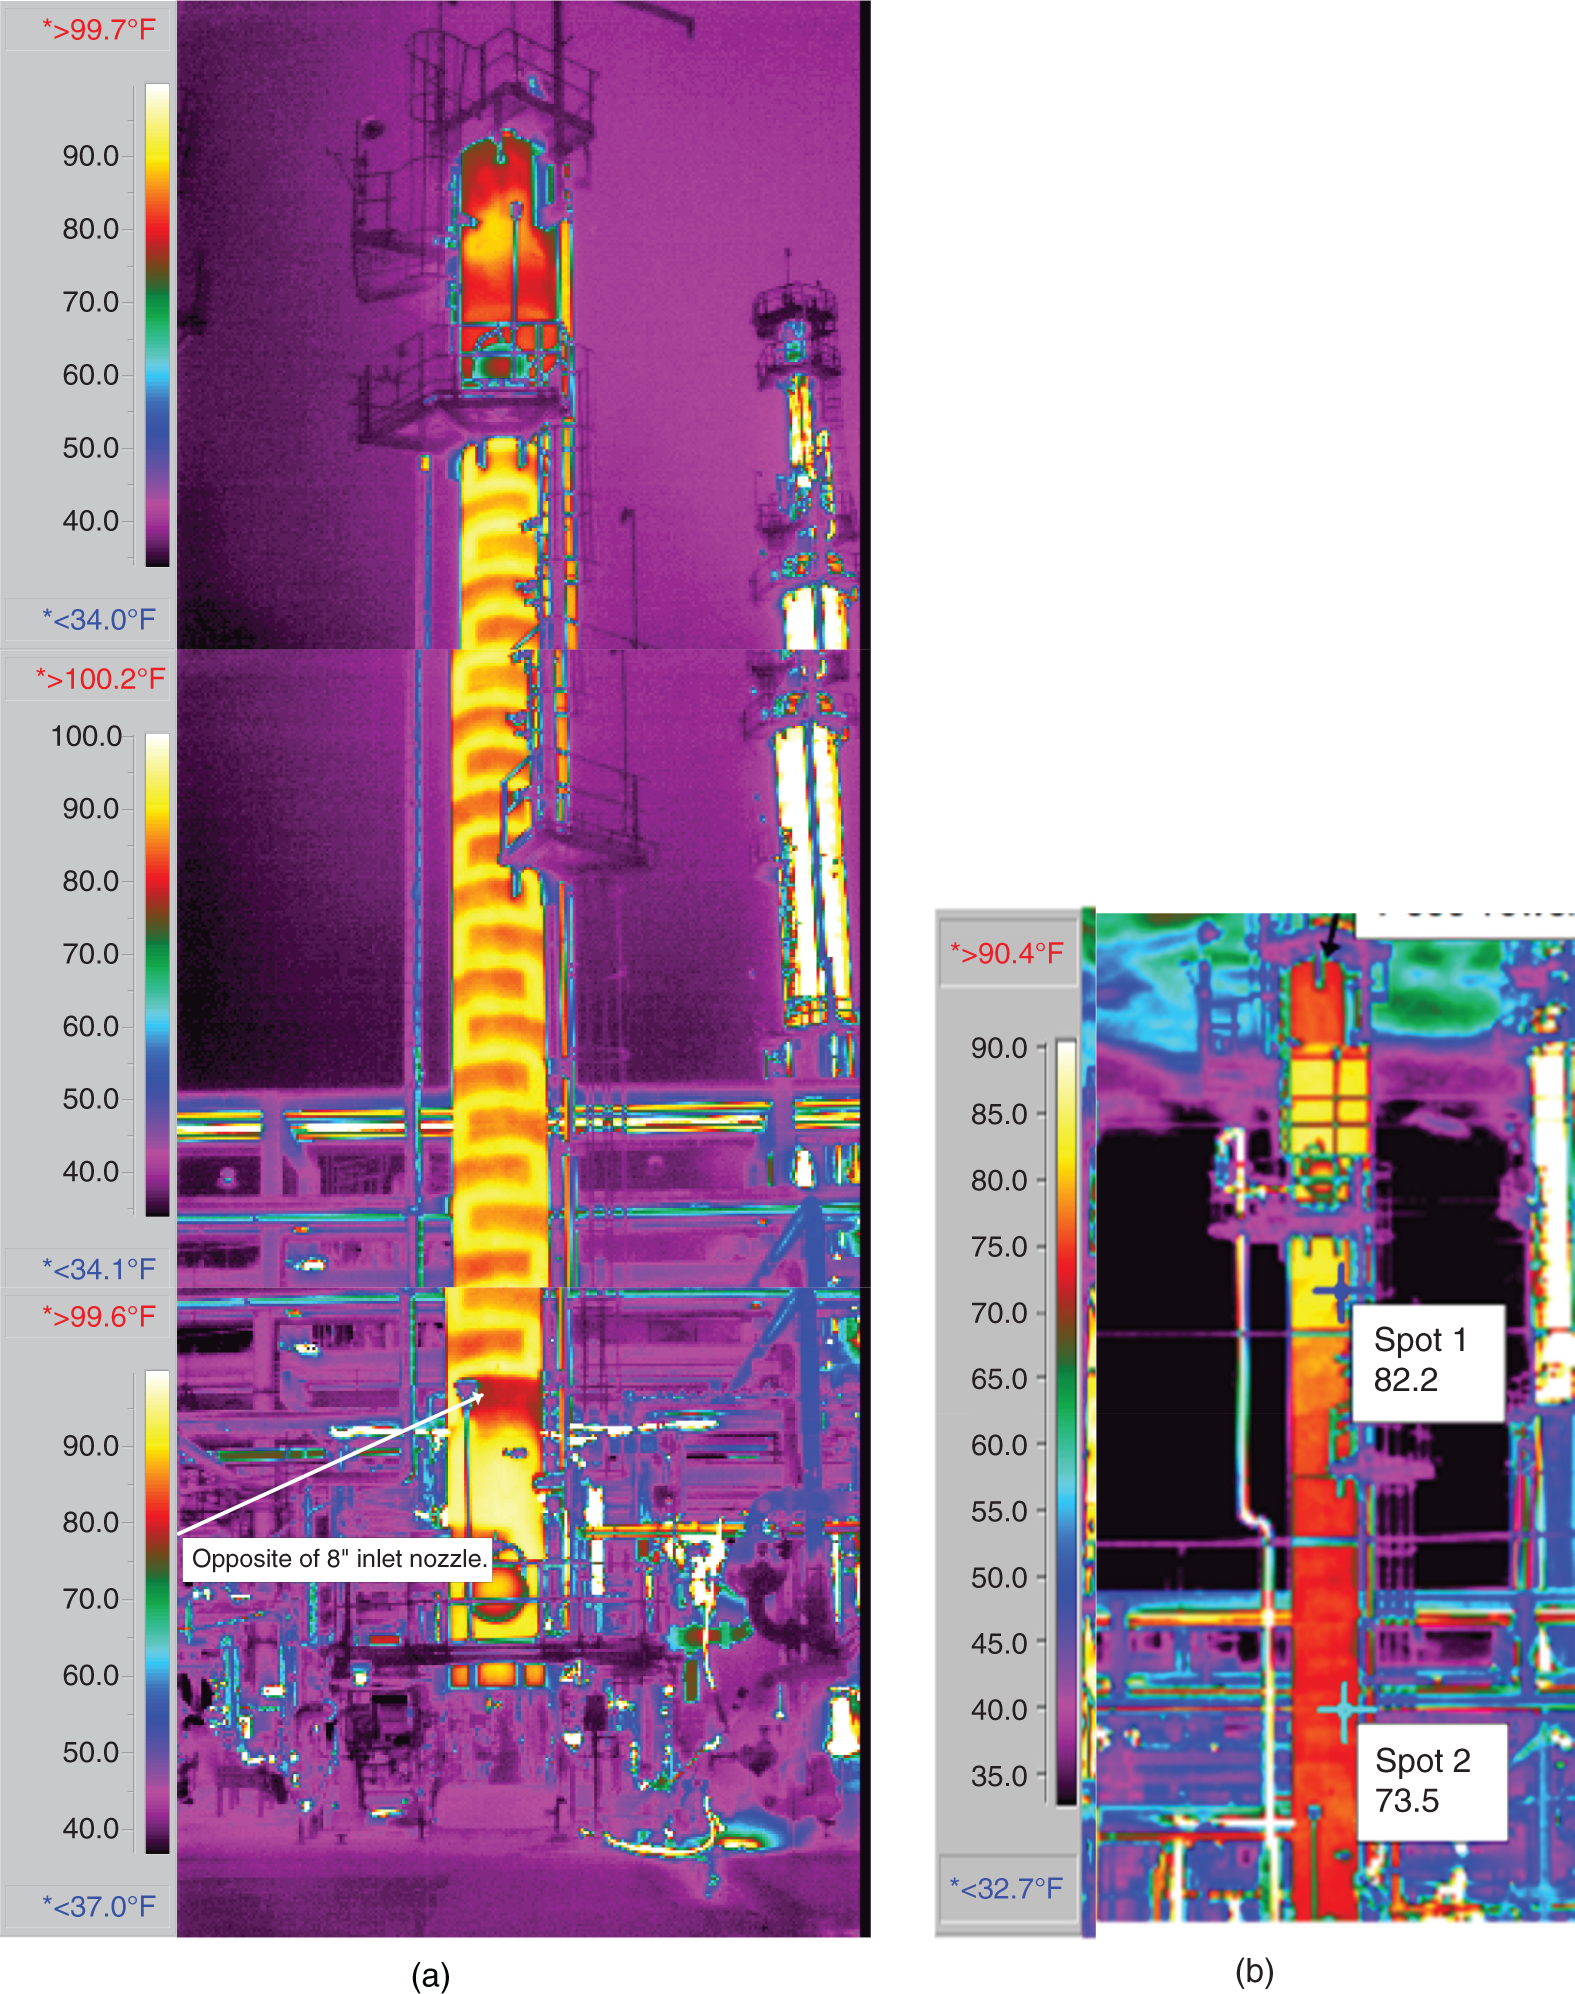
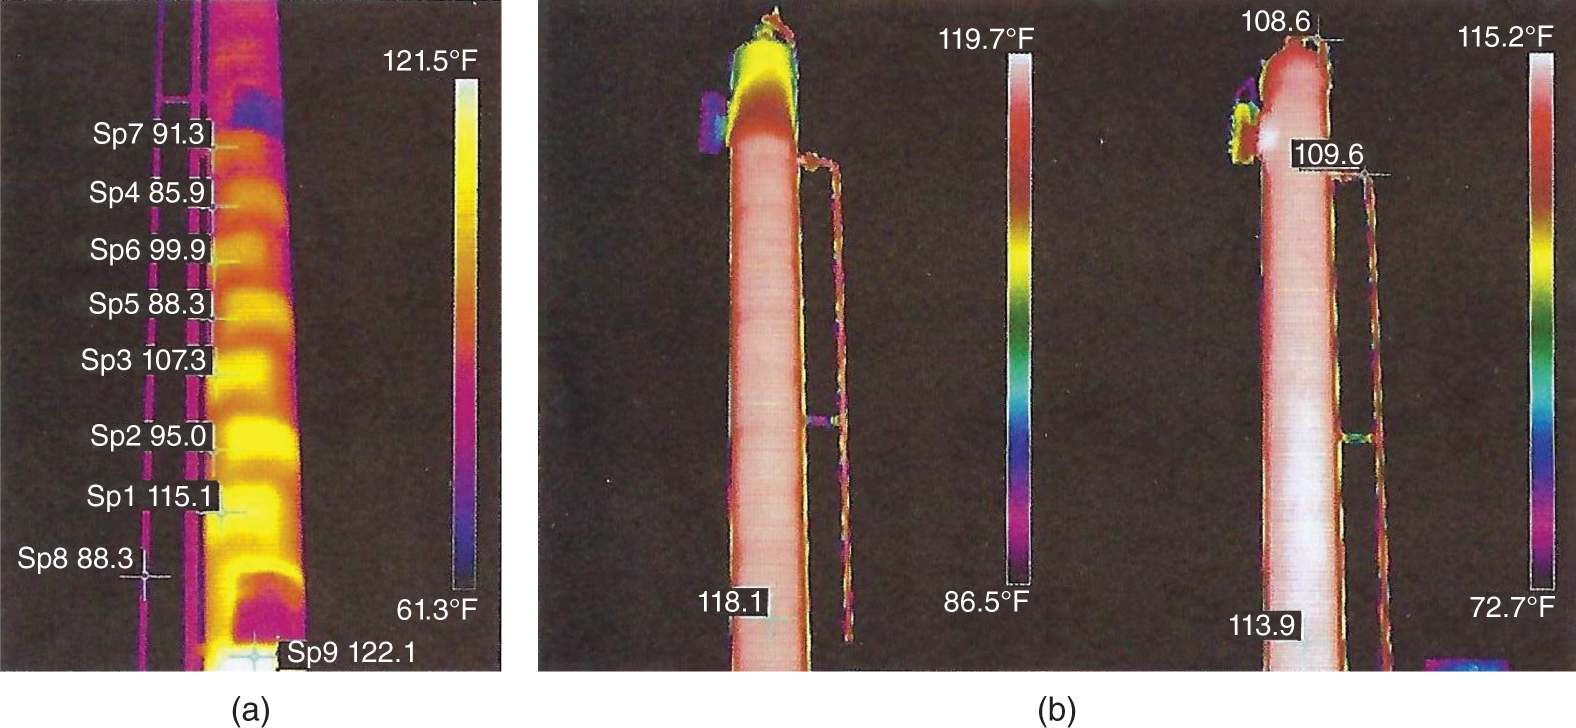
7.2.5 Temperature Bulges in CO2 Amine Absorbers
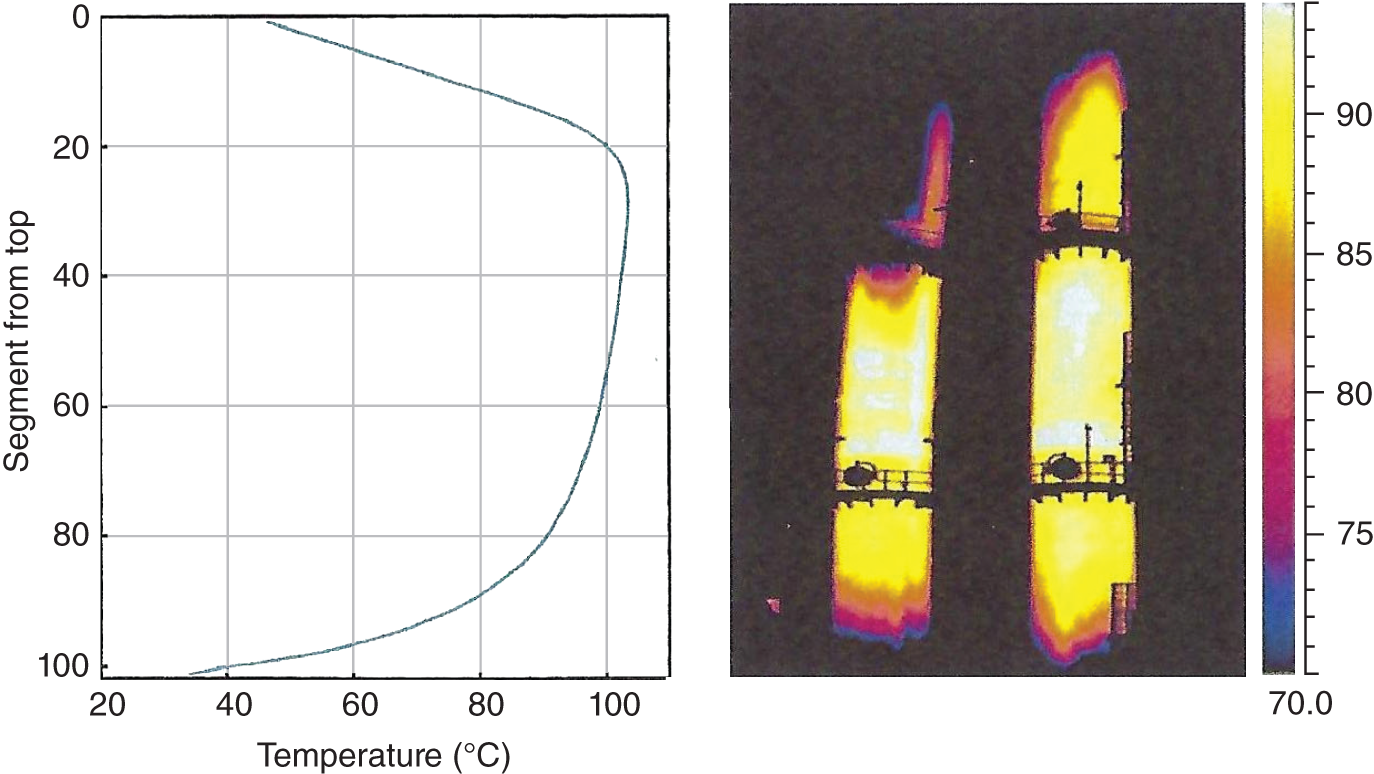
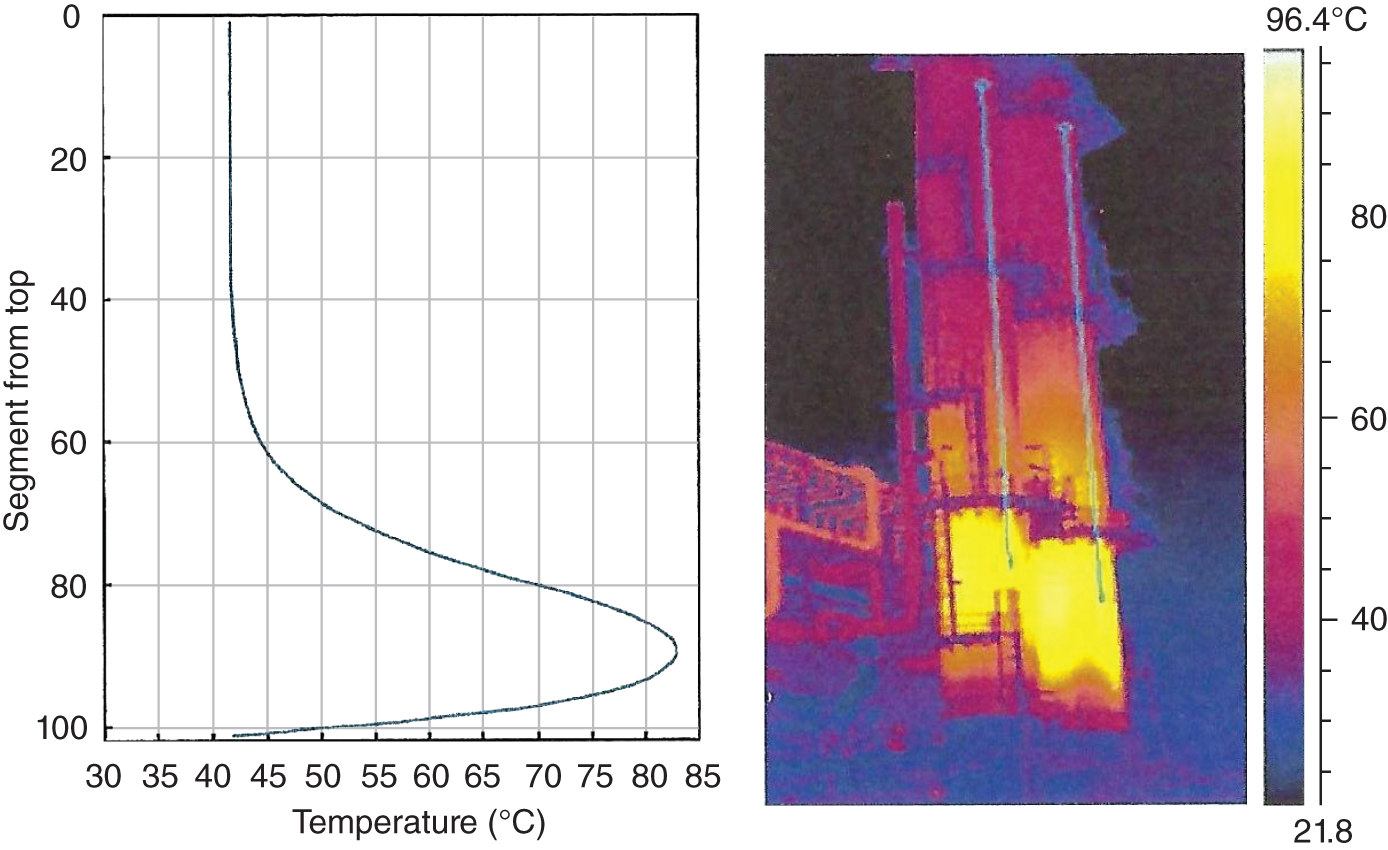
7.2.6 Excessive Liquid Levels
7.2.7 Diagnosing a Flood due to Bottom Baffle Malfunction
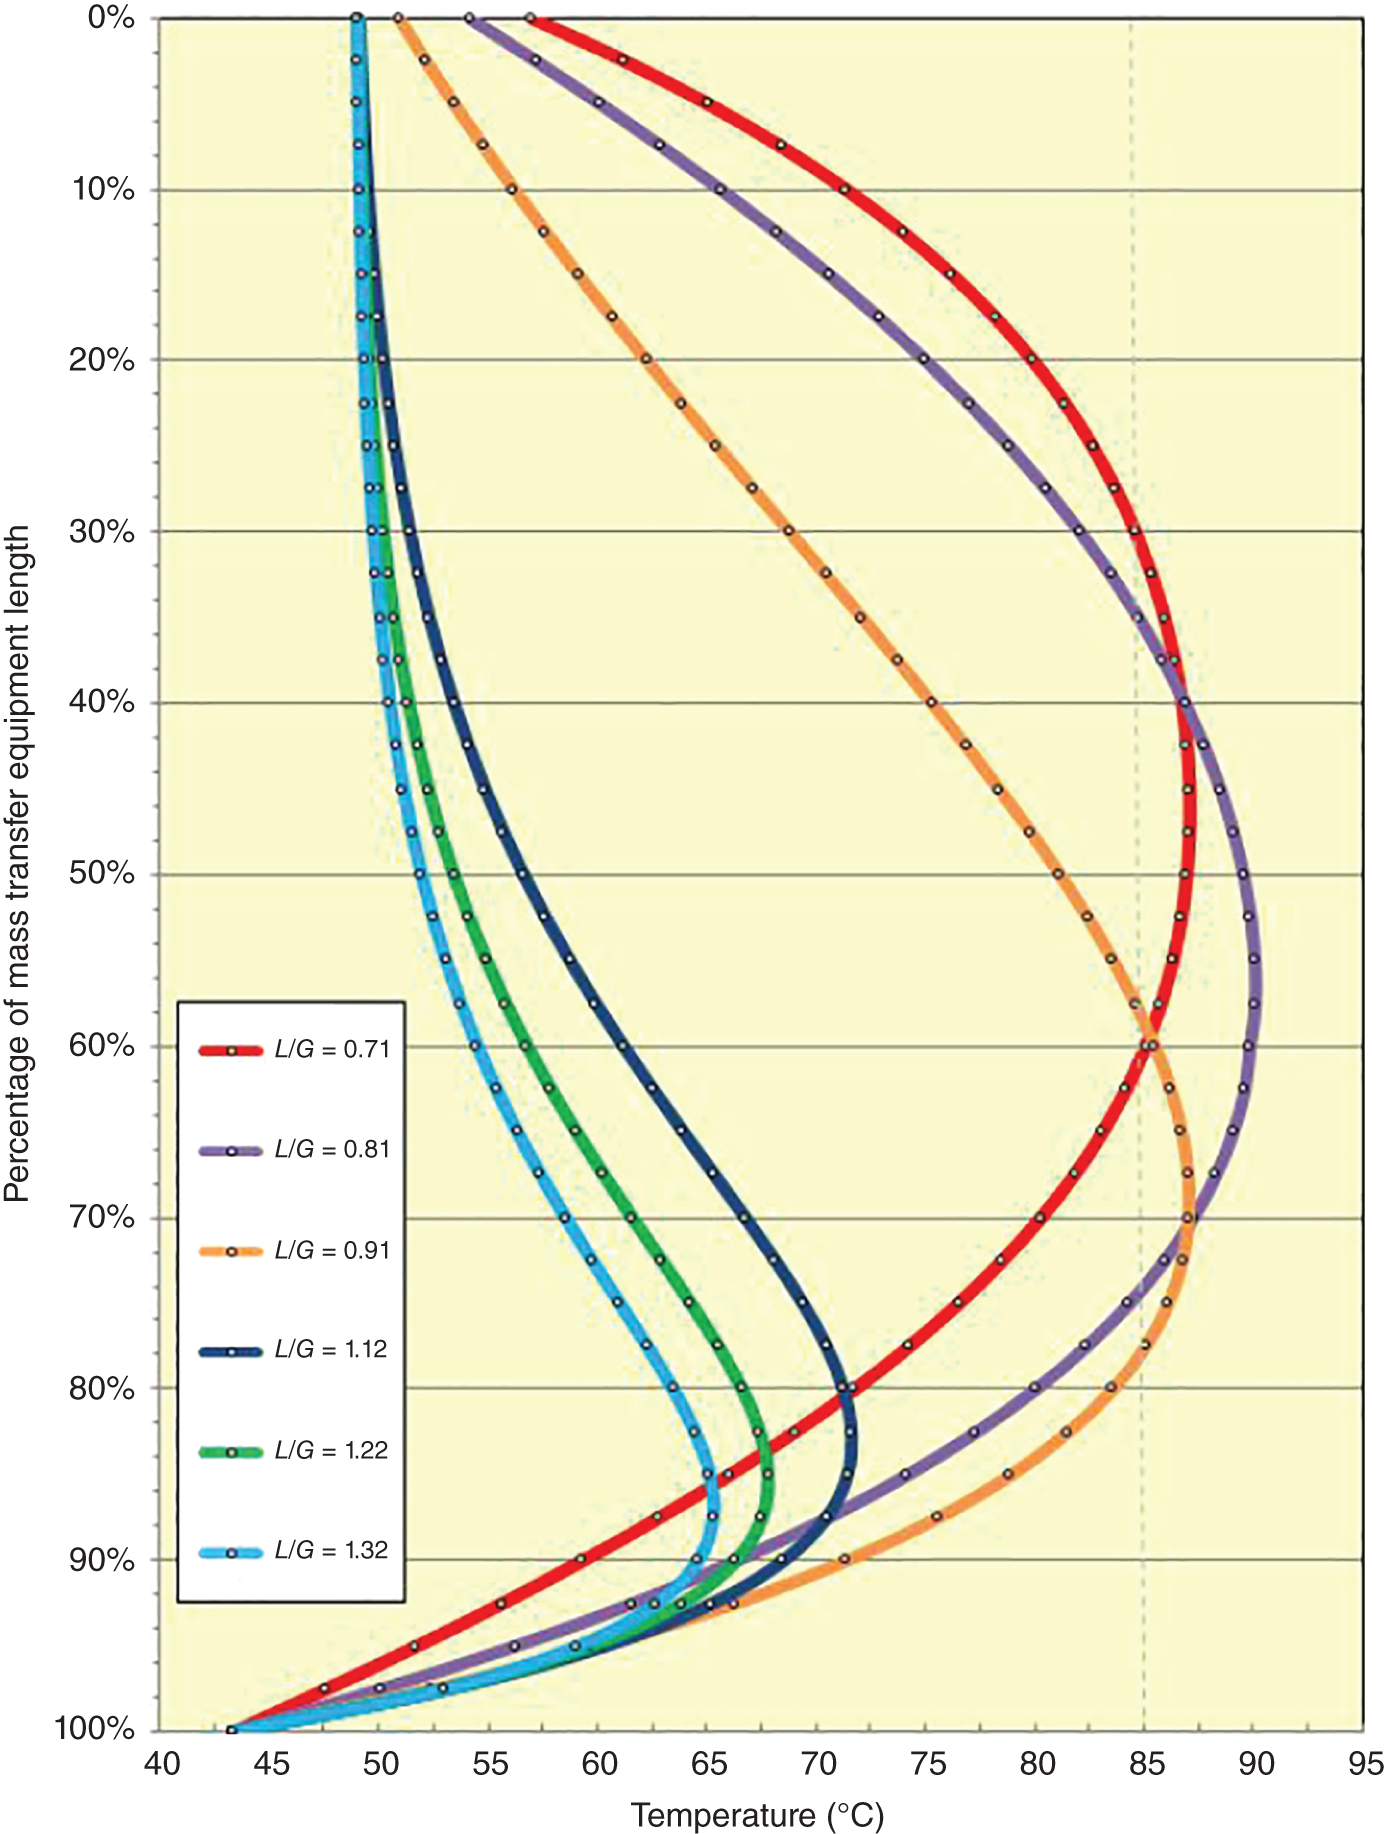
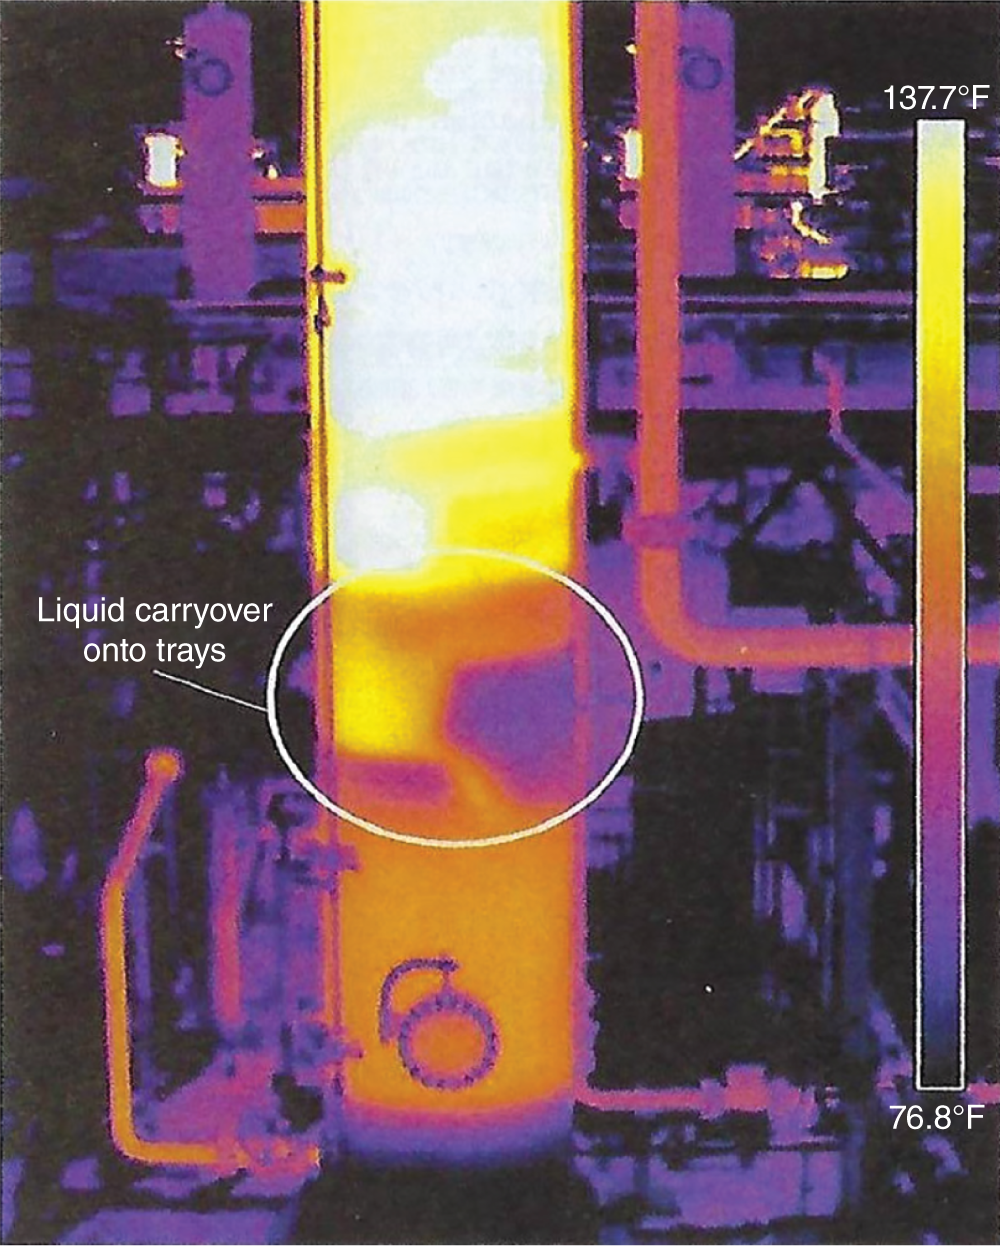
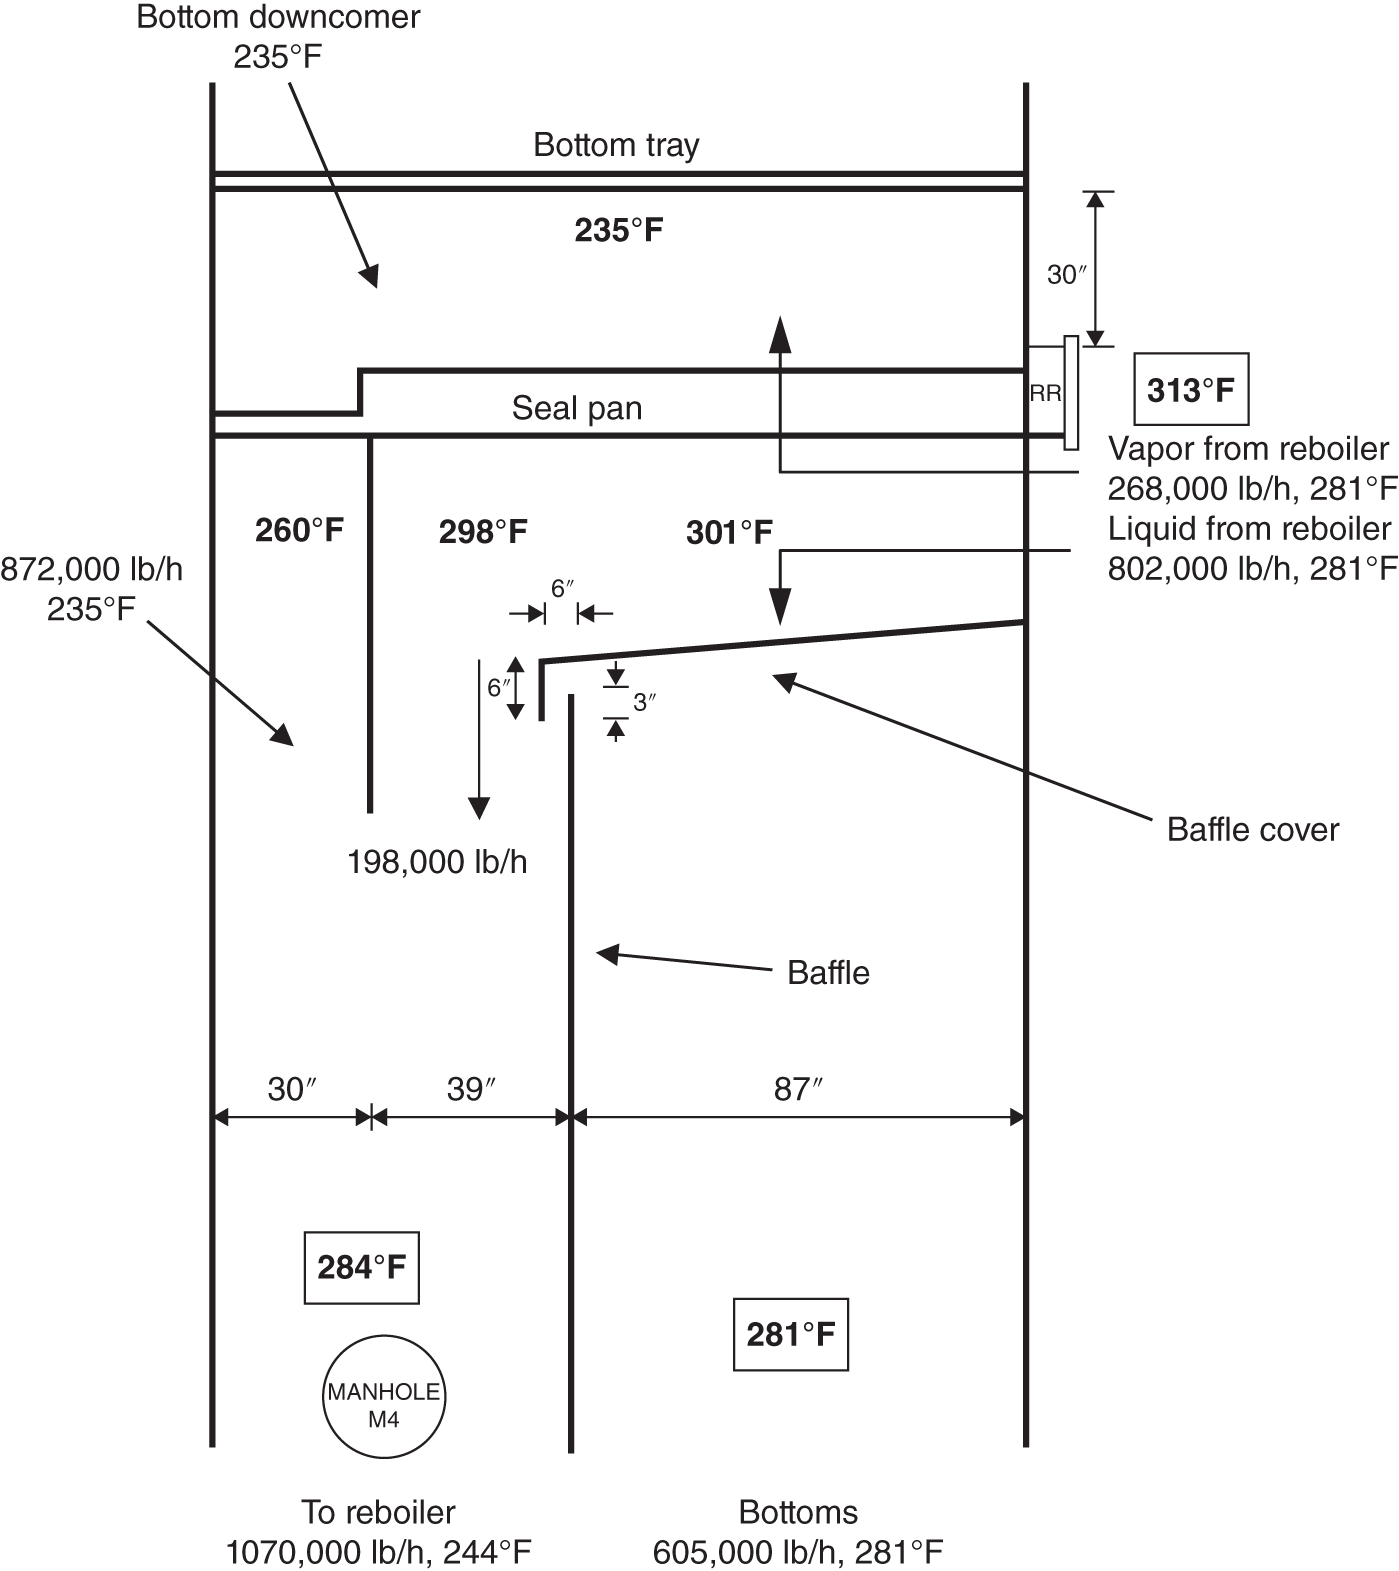
7.2.8 Diagnosing a Damaged Draw Pan
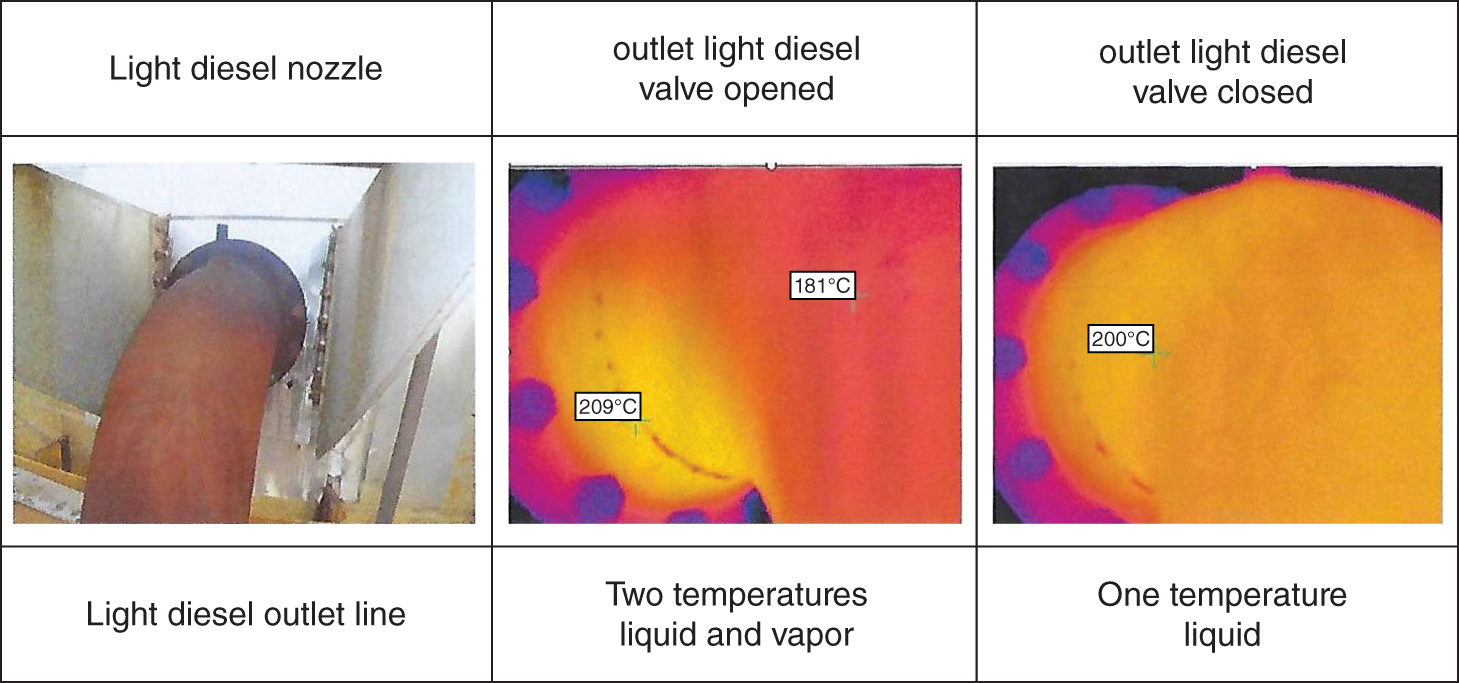
7.2.9 Liquid Levels in Condensers and Reflux Drums
7.2.10 Troubleshooting Condensers and Reboilers
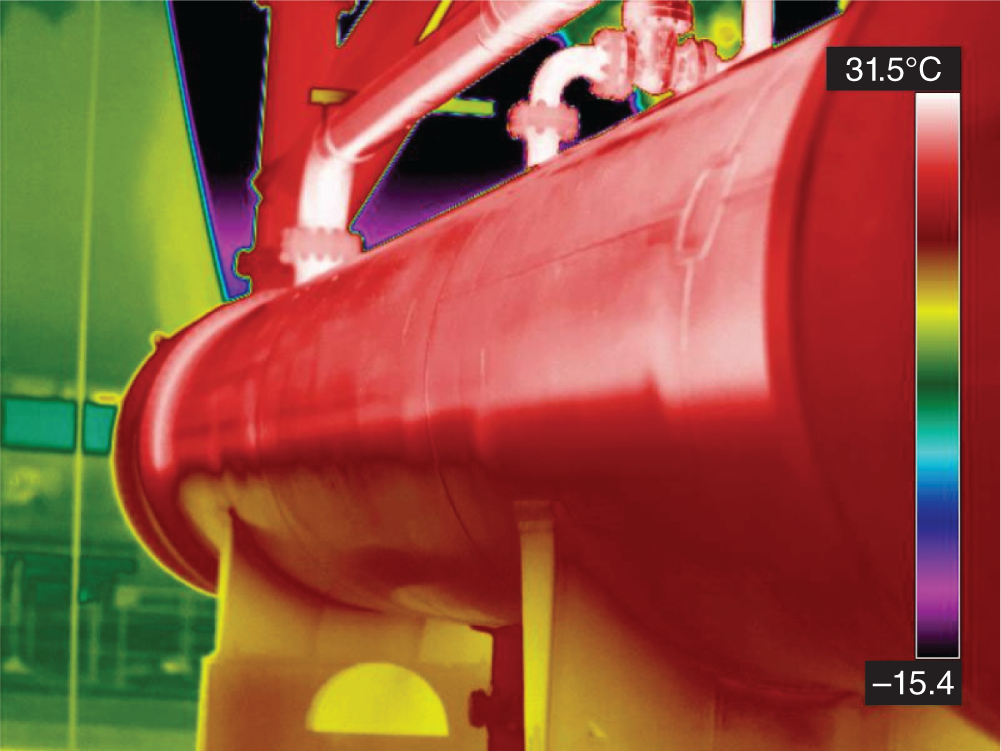
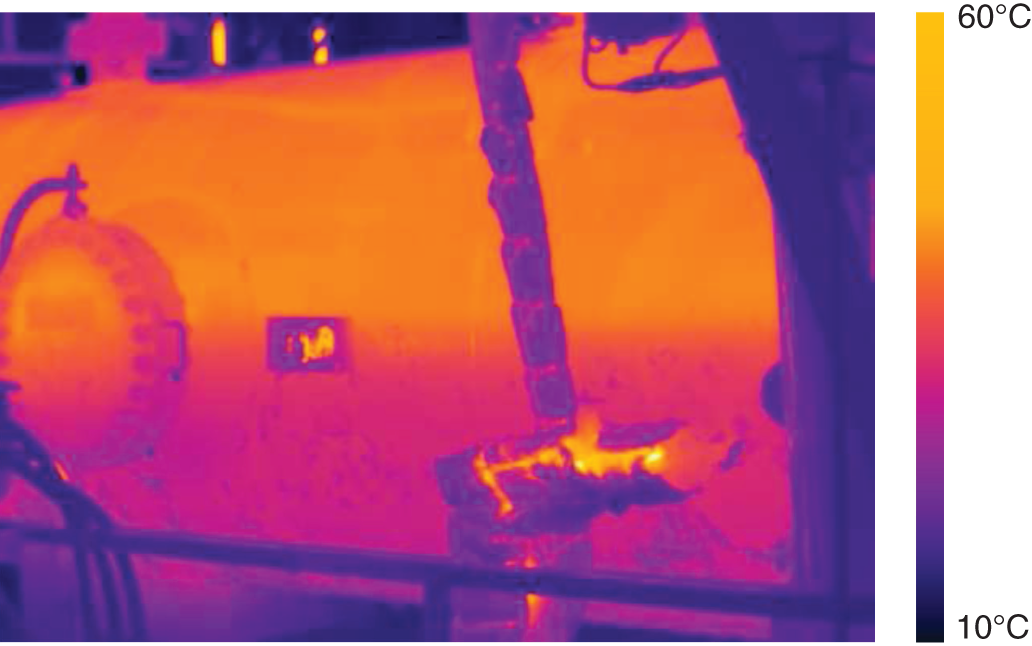
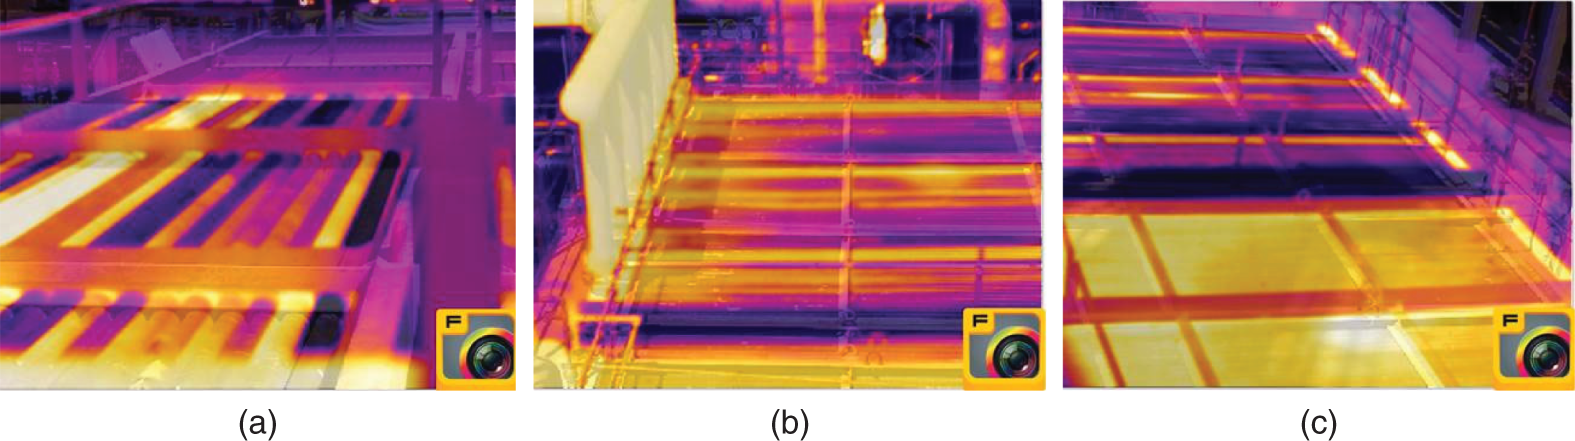
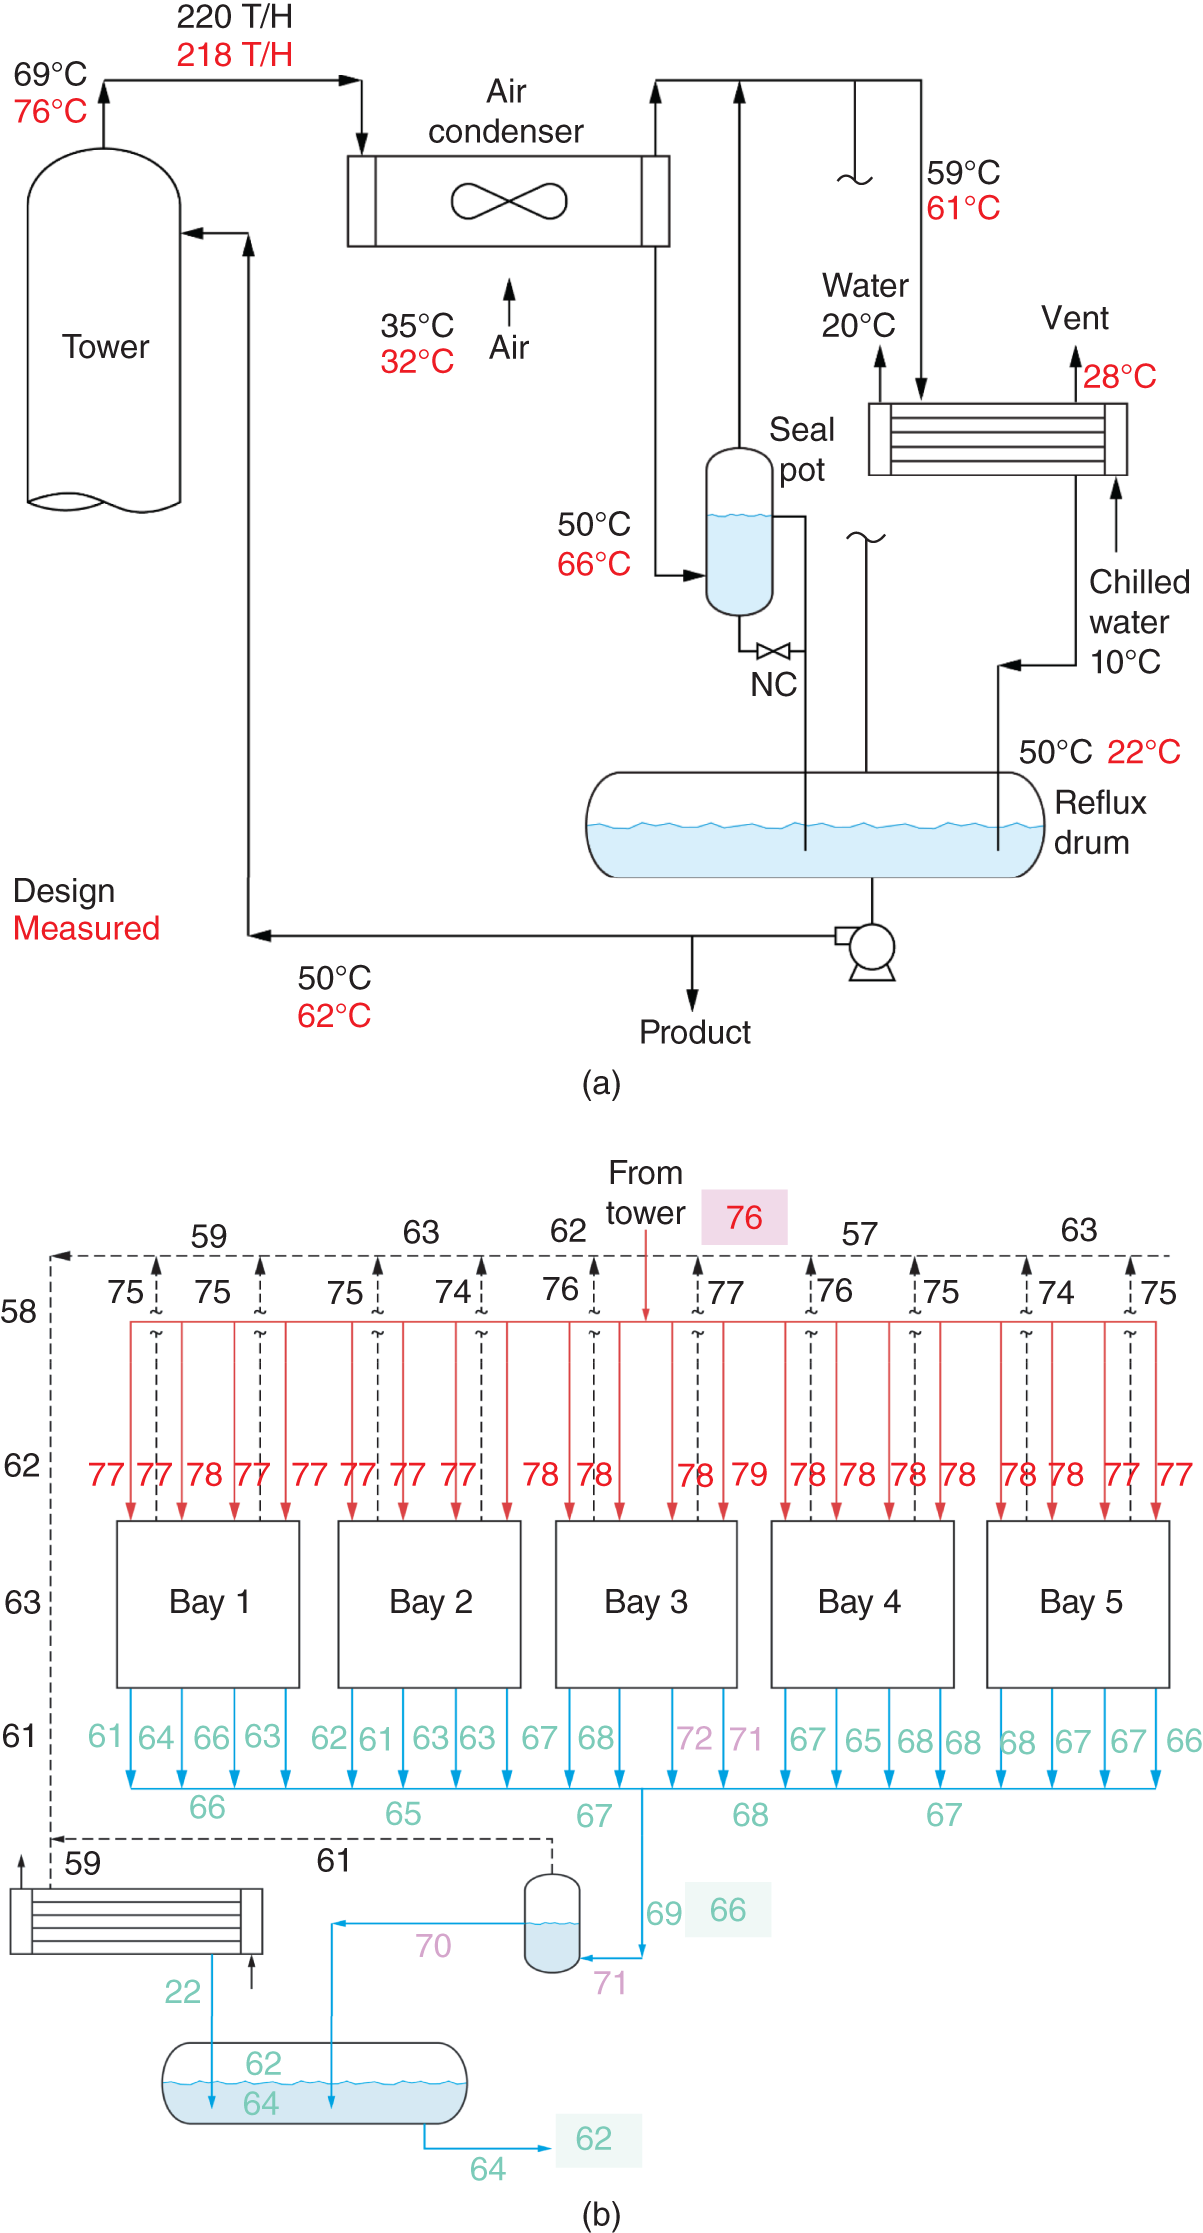
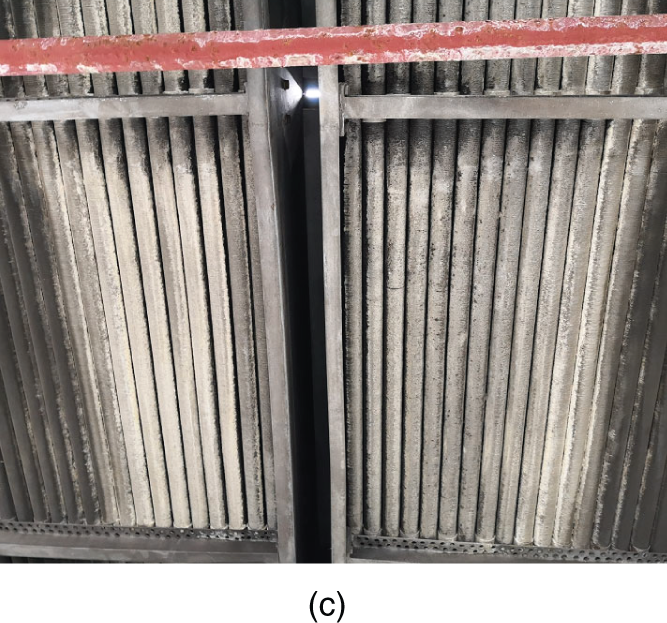
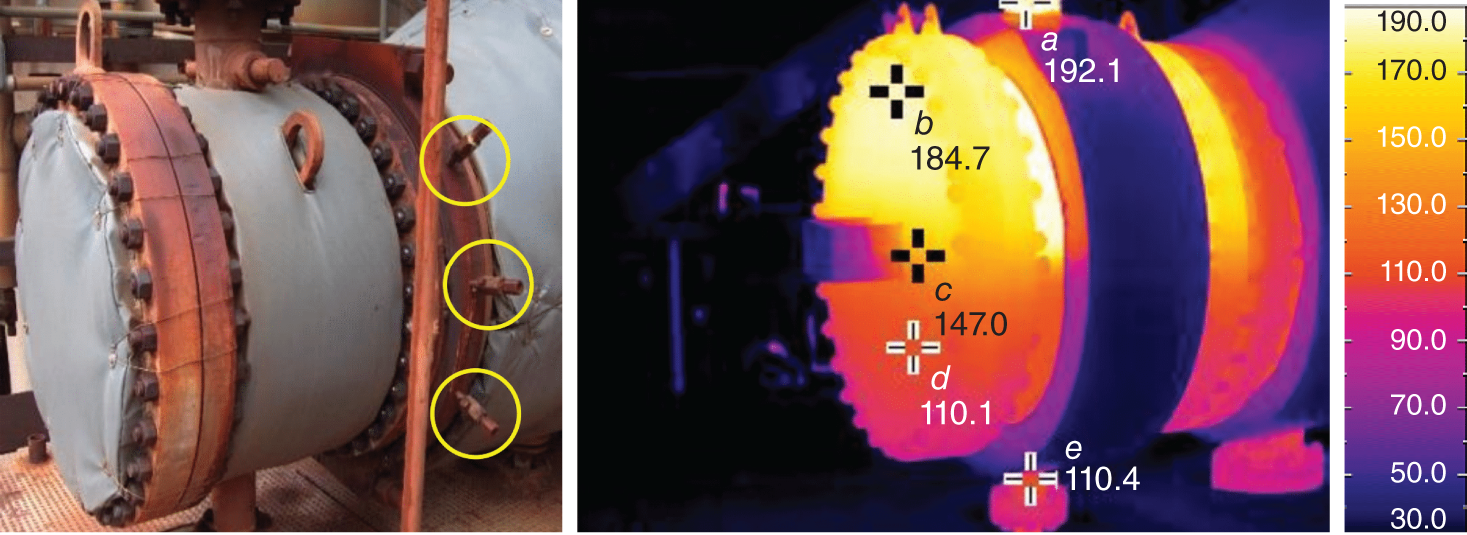
7.2.11 Thermal Video Diagnoses Cause of Pressure Instability
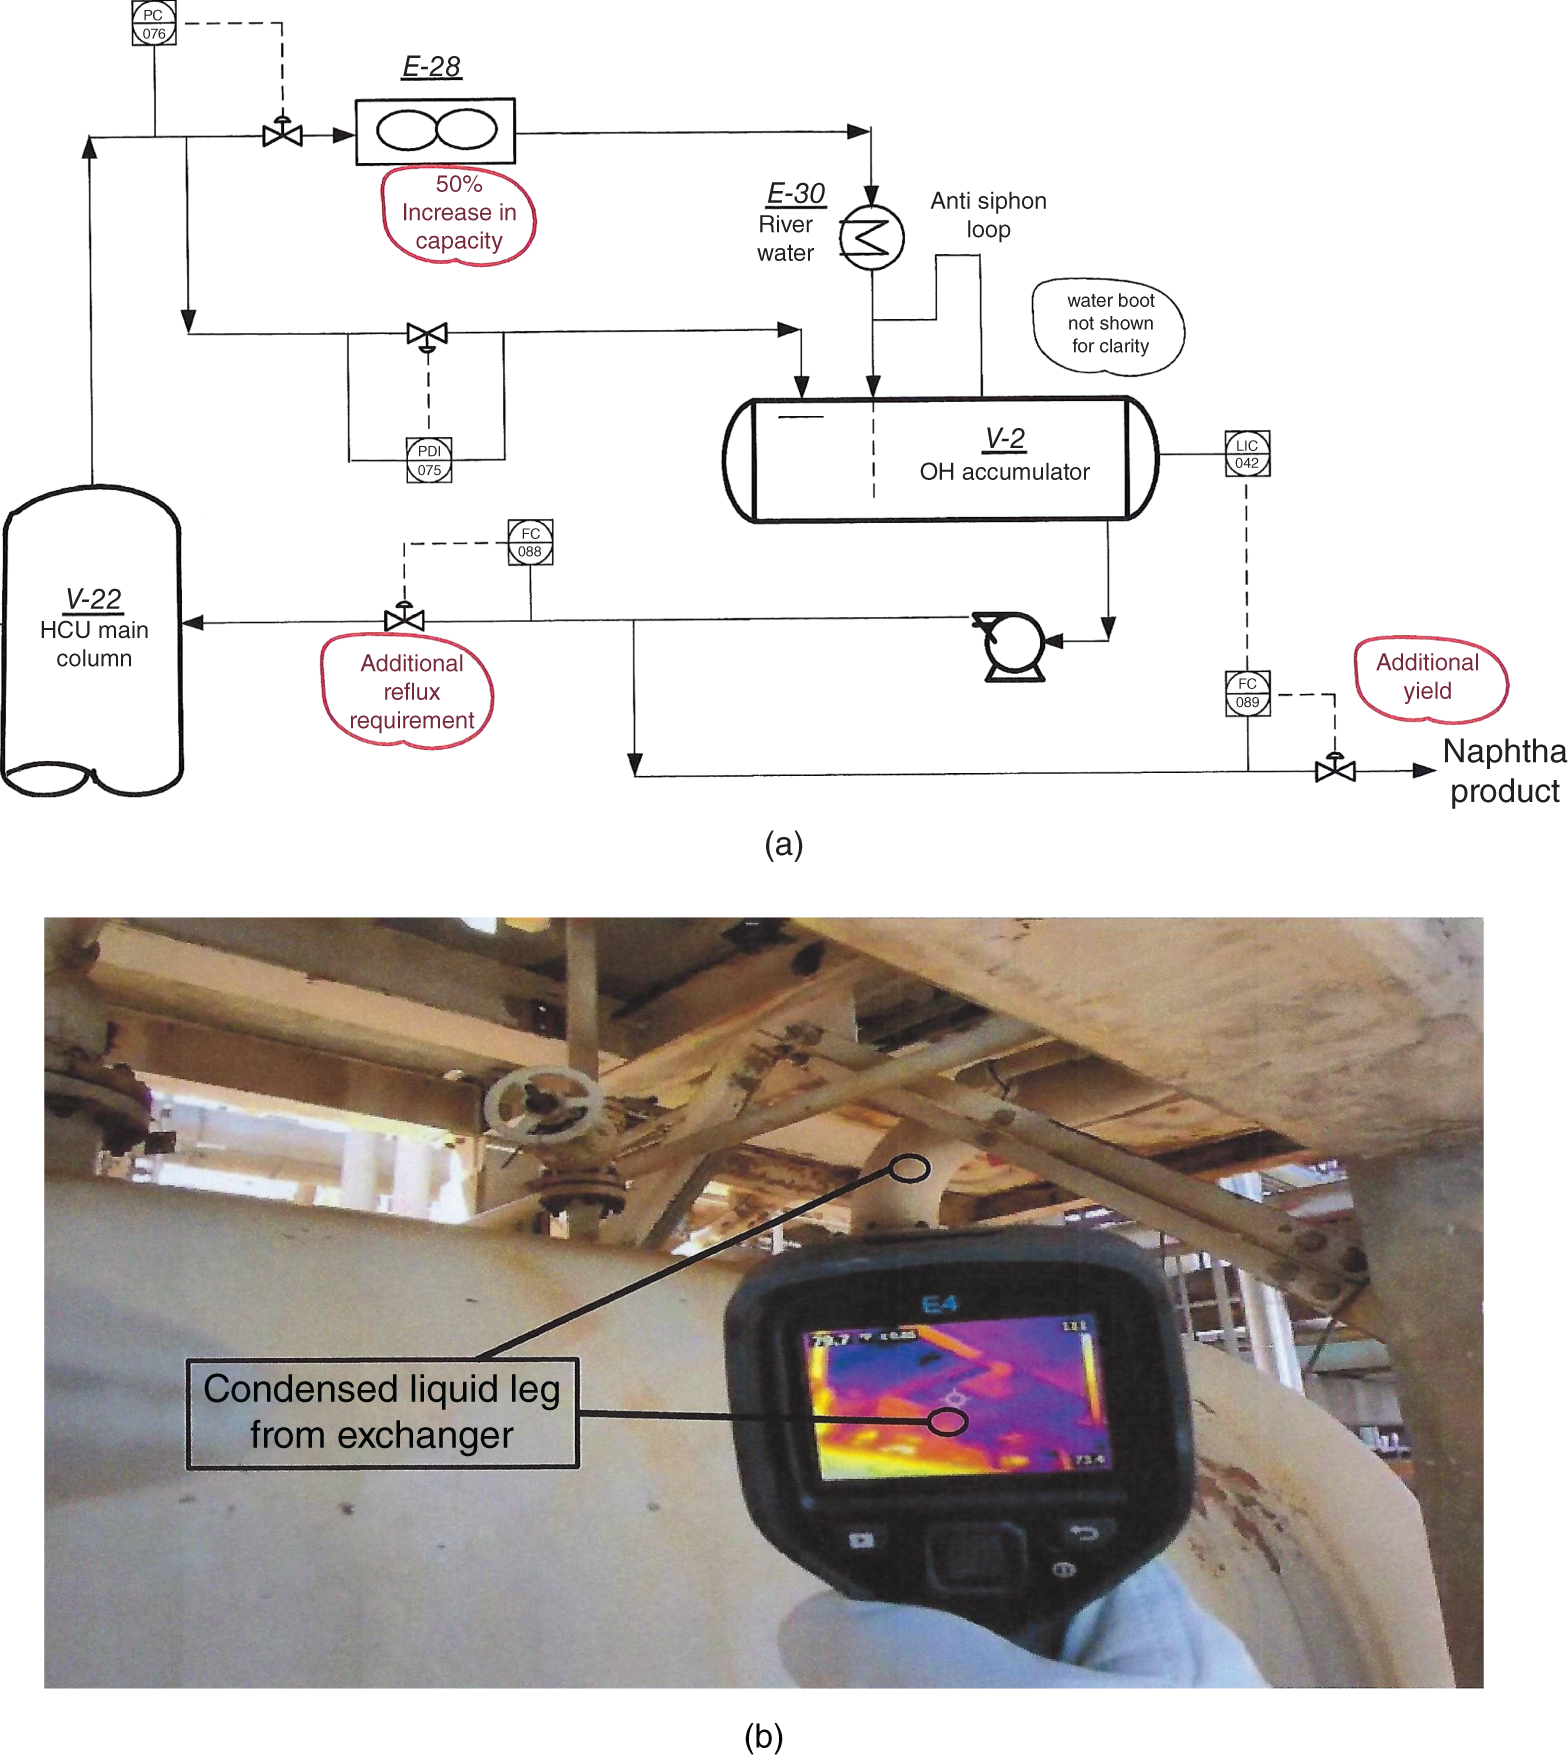
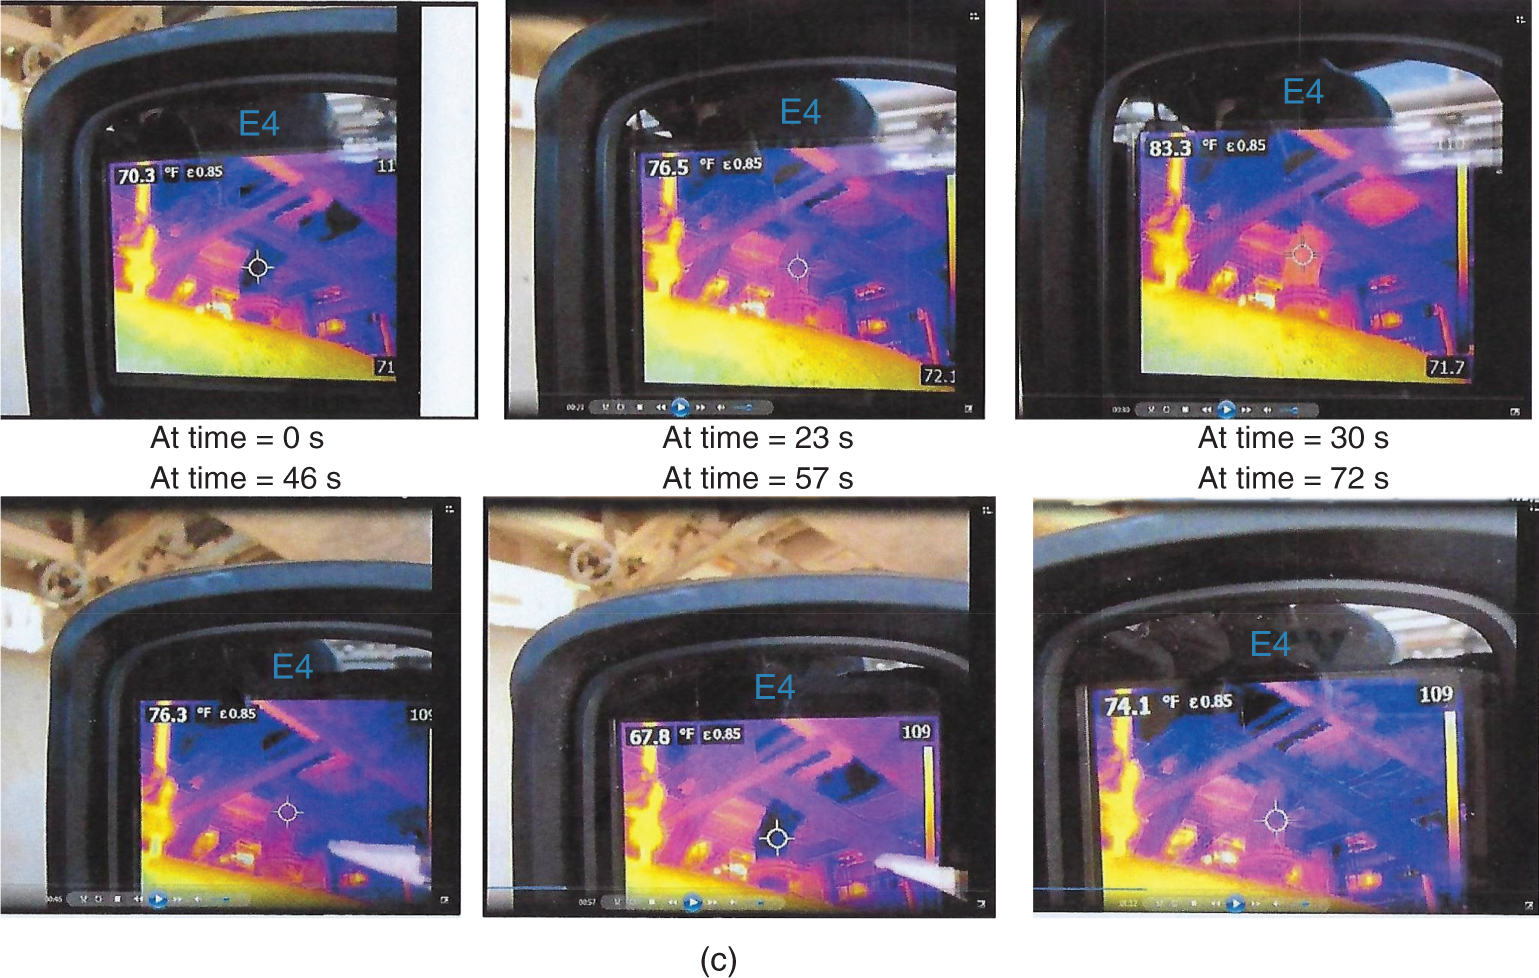
7.3 ENERGY BALANCE TROUBLESHOOTING
7.3.1 Energy Balance Application for Correctly Validating Simulations and Correctly Diagnosing Tower Problems
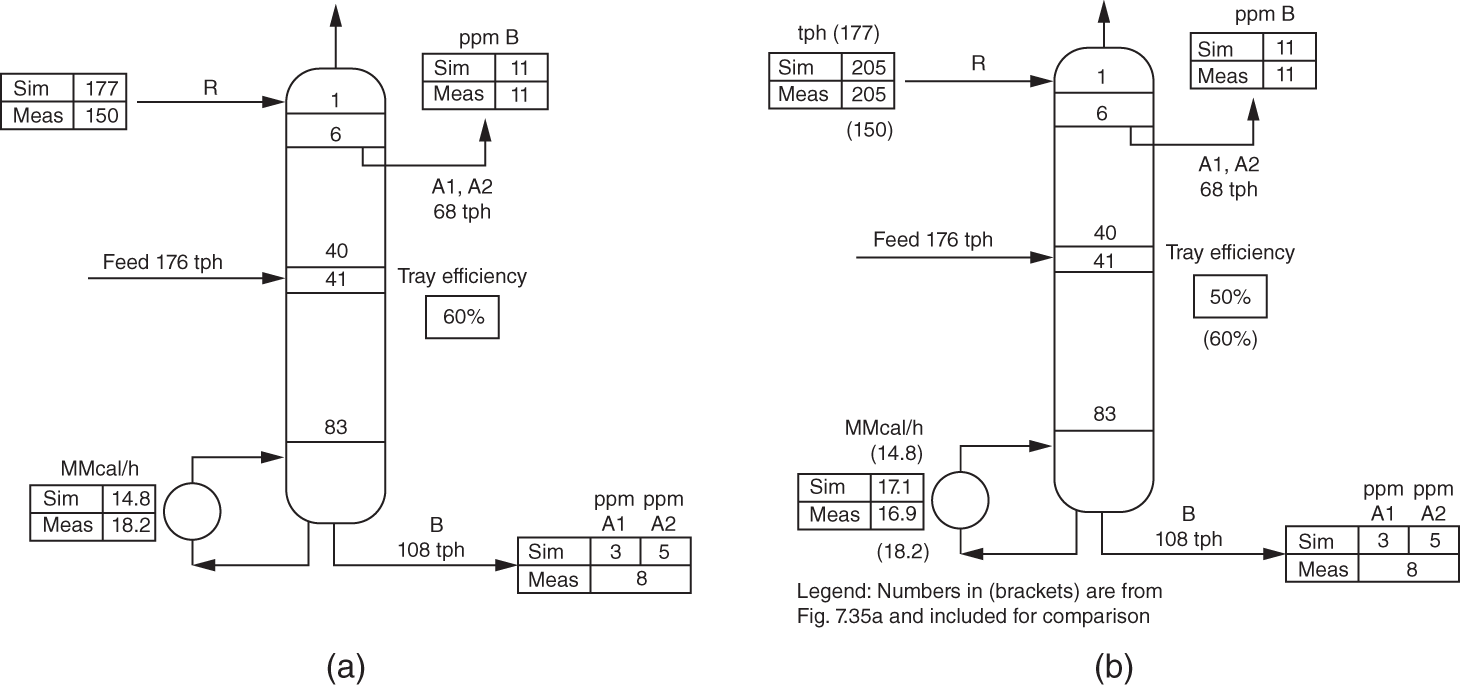
7.3.2 Energy Balance Troubleshooting to Detect Internal Leaks
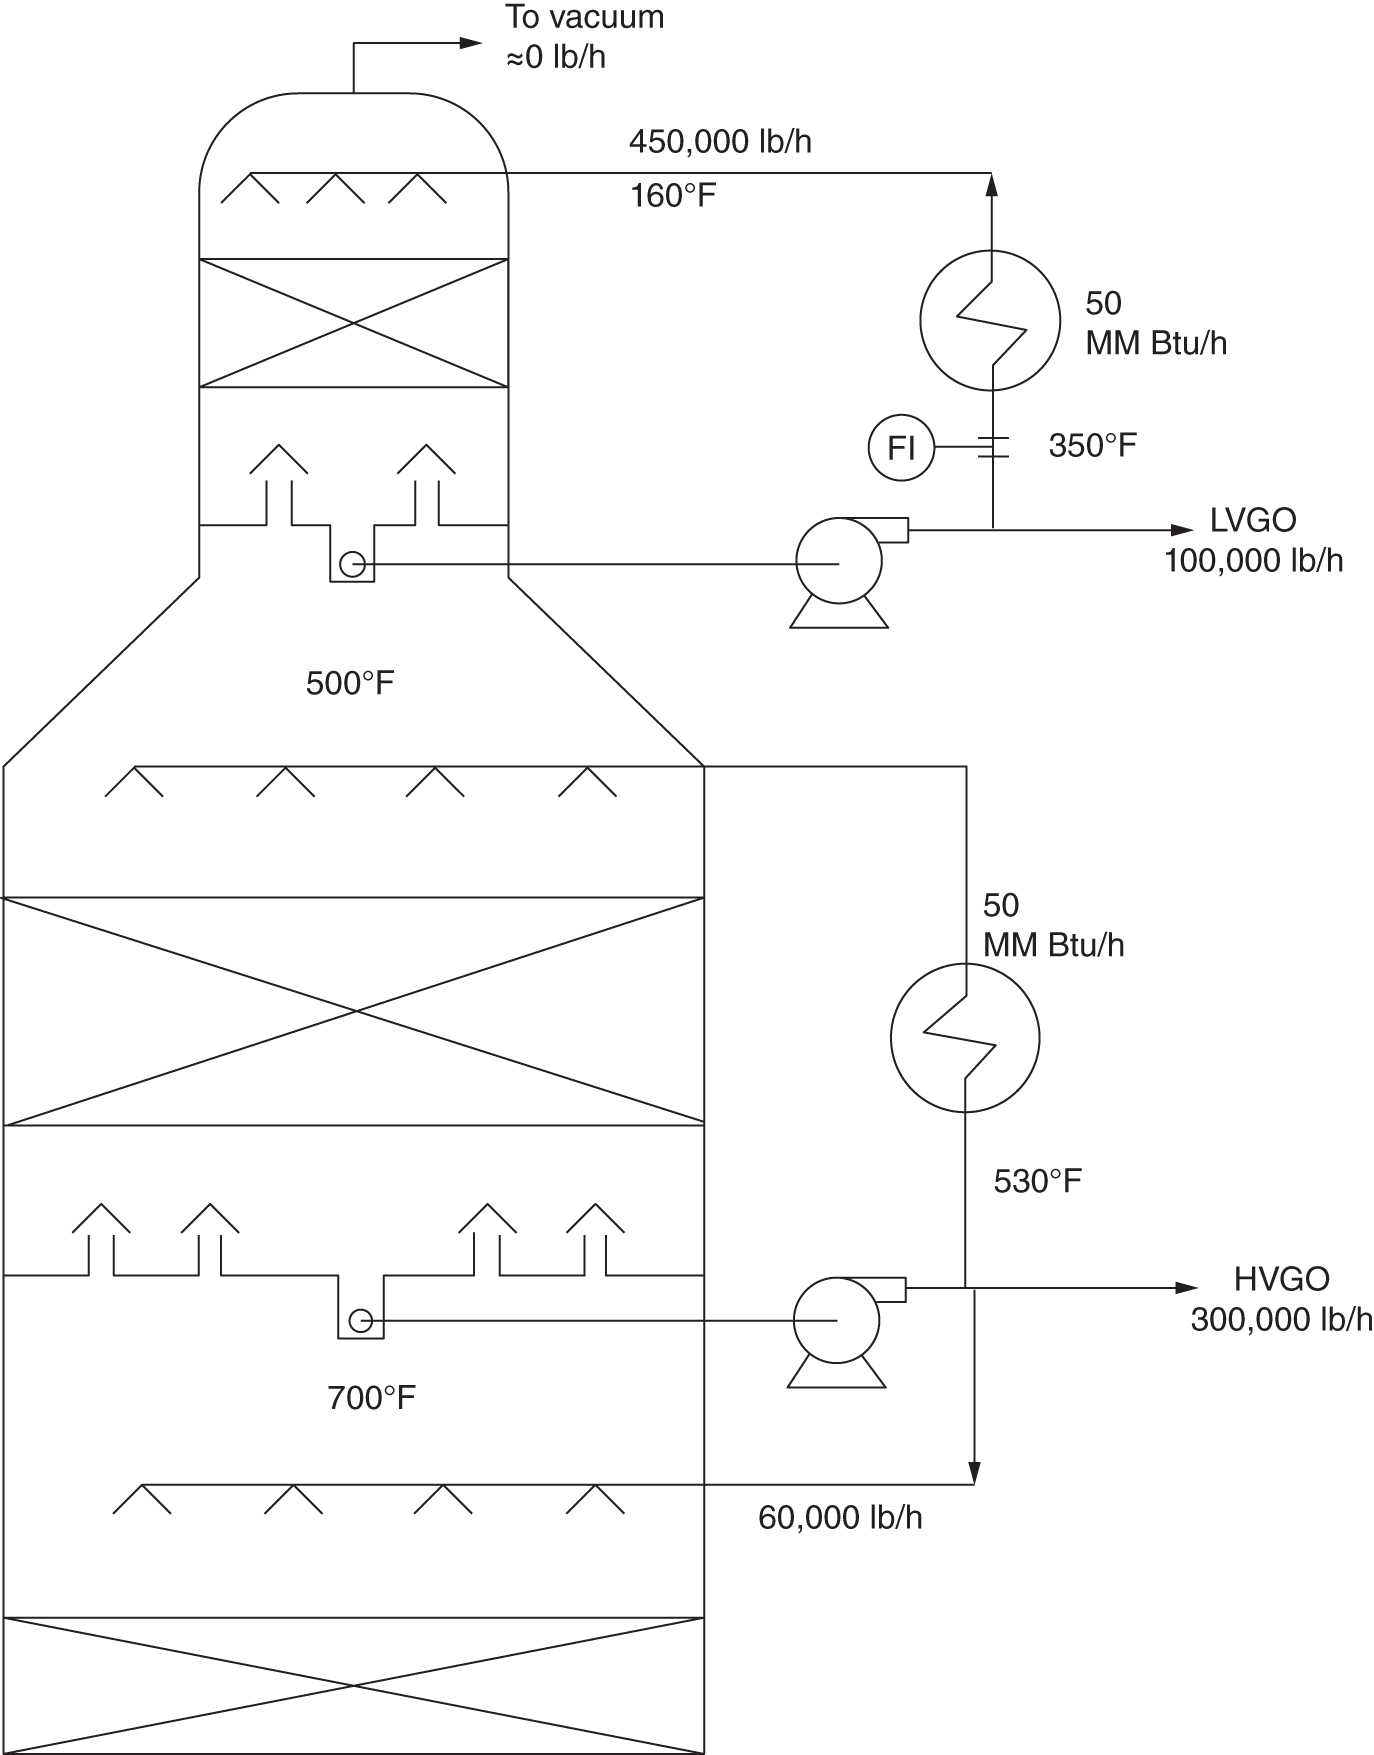


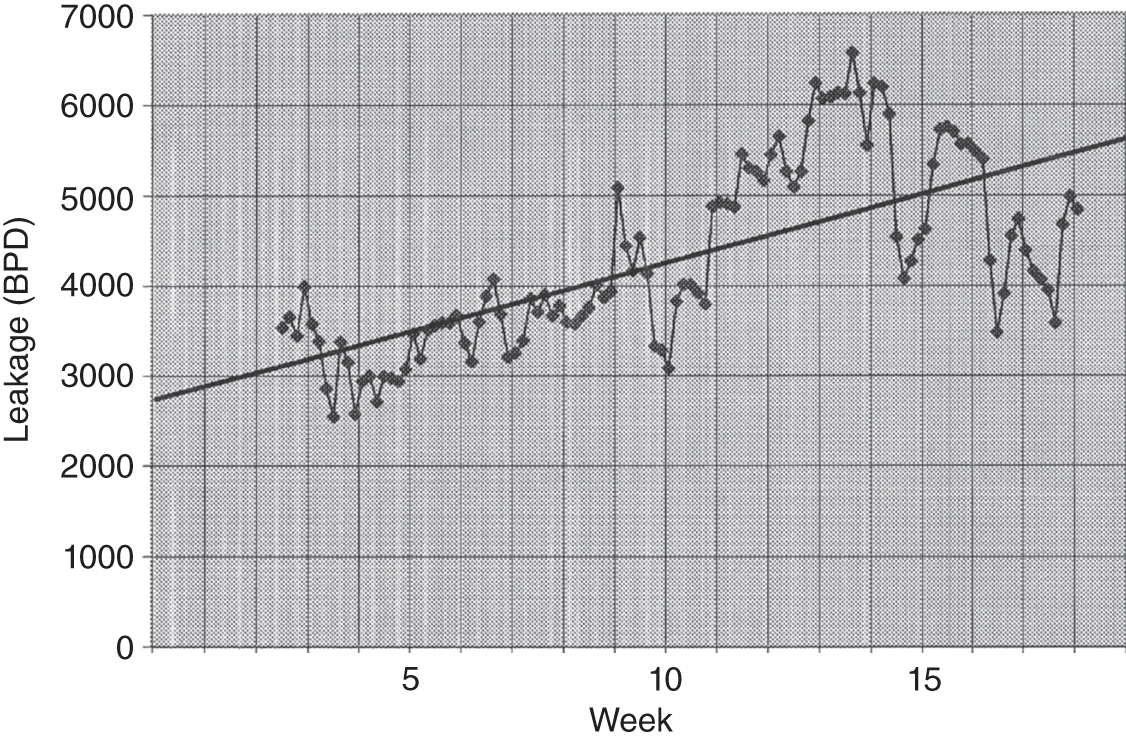
7.3.3 Energy Balance Troubleshooting to Eliminate Overflows or Leaks in the Upper Parts of Chimneys
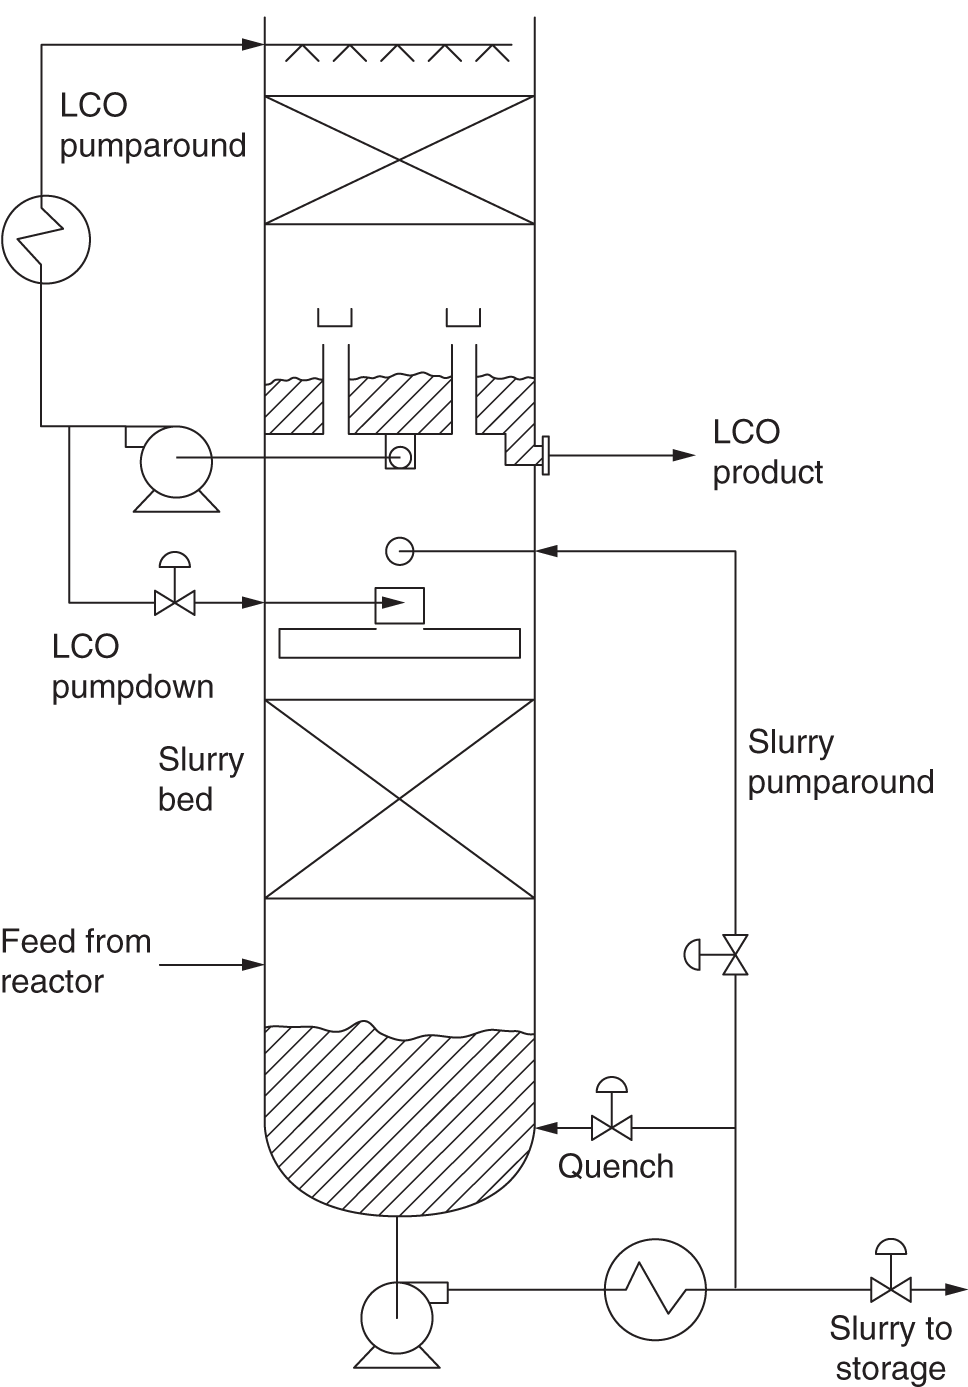
7.3.4 Energy Balance Troubleshooting of a Two-Compartment Chimney Tray
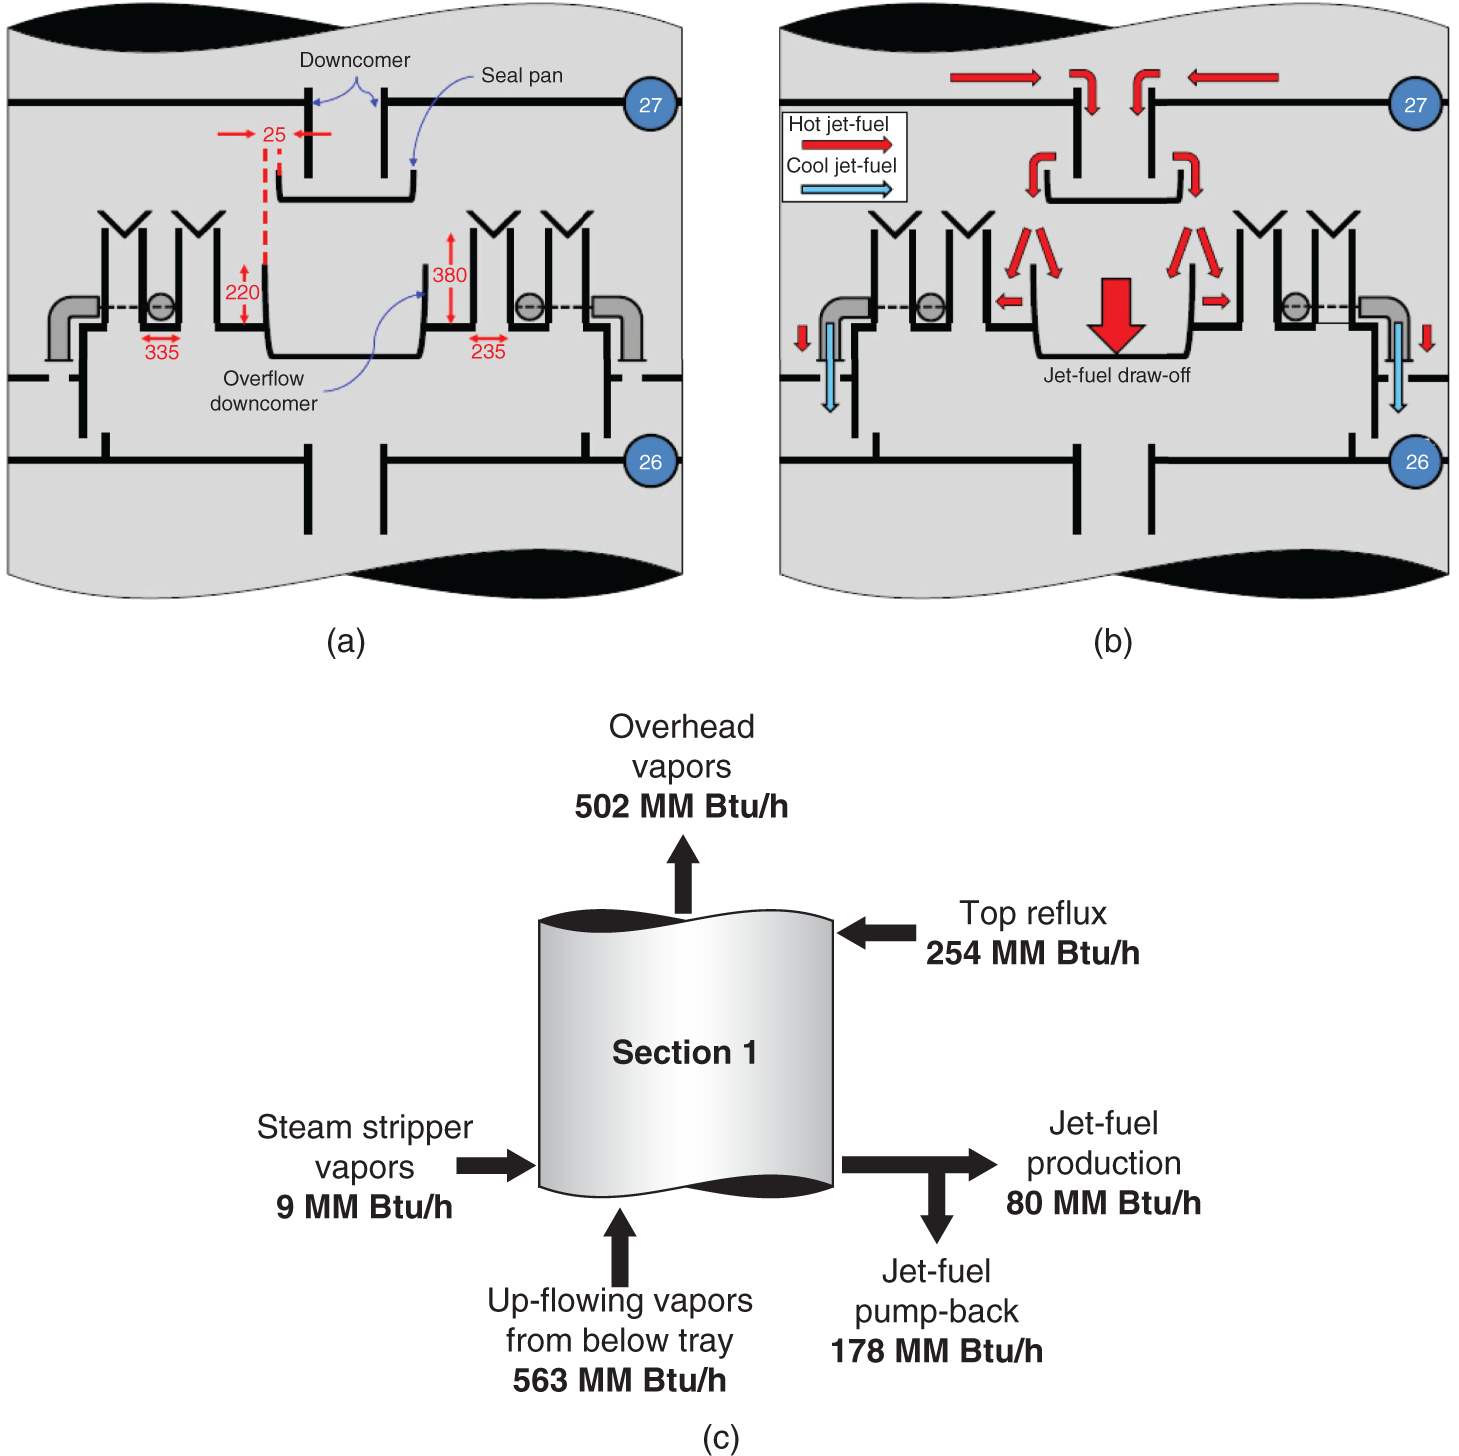
7.3.5 Leaks from Heat Exchangers: The Role of Mass and Energy Balance in their Troubleshooting