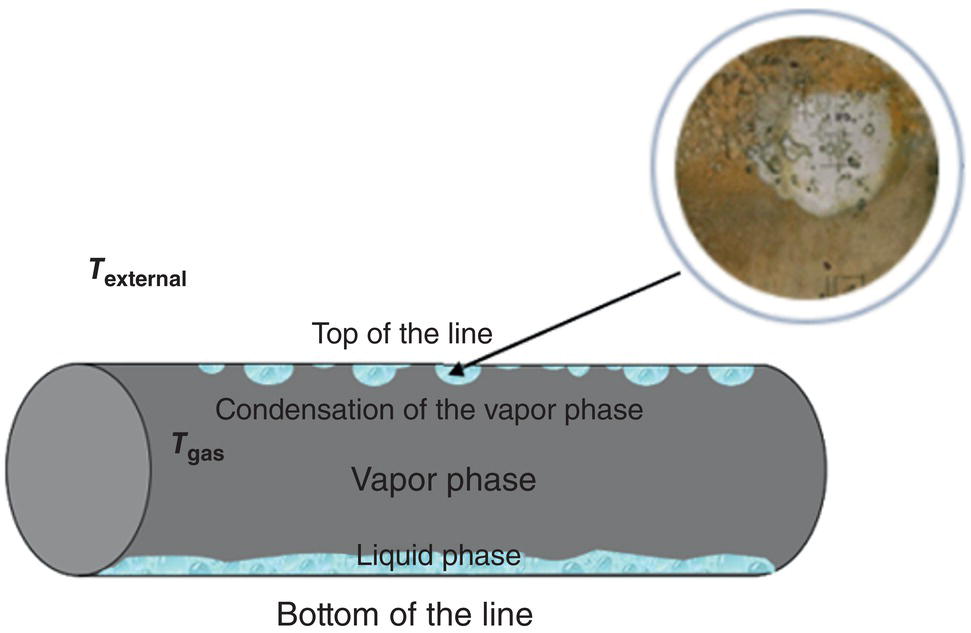
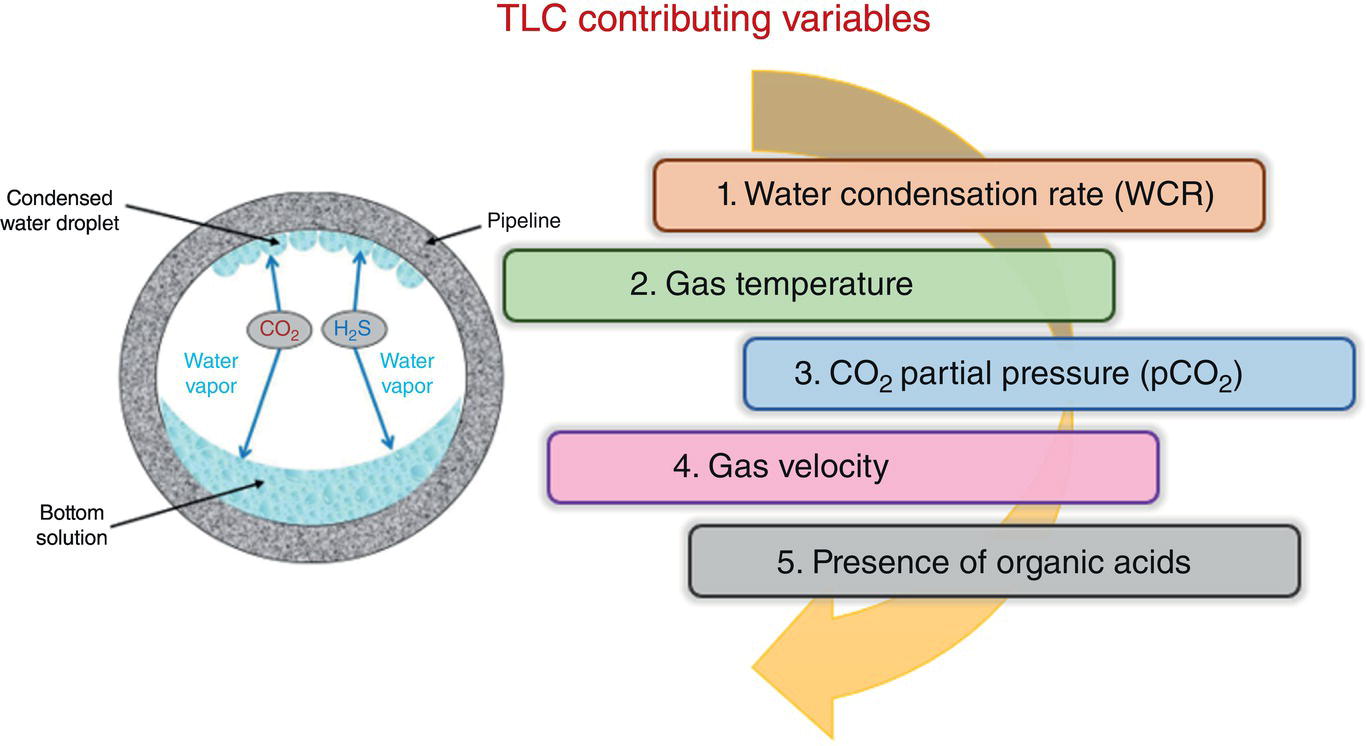
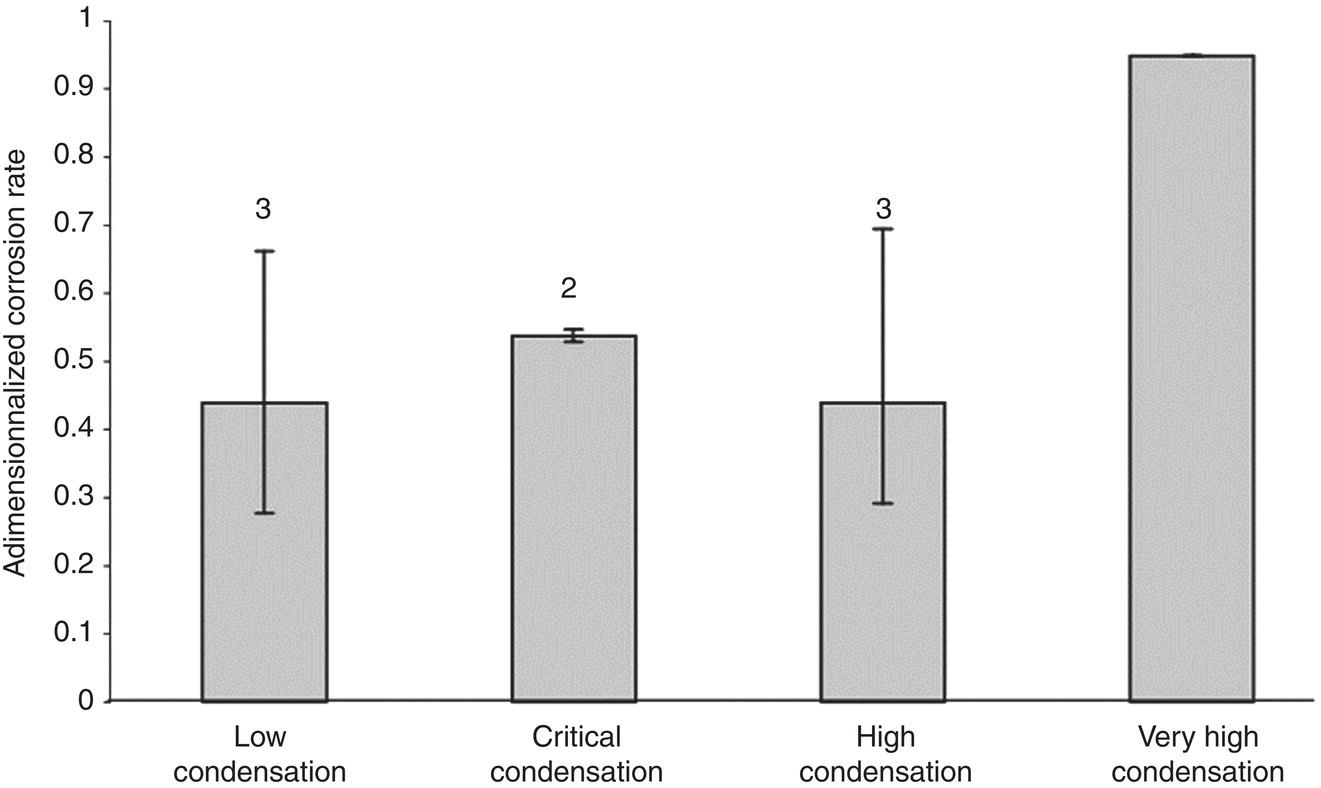
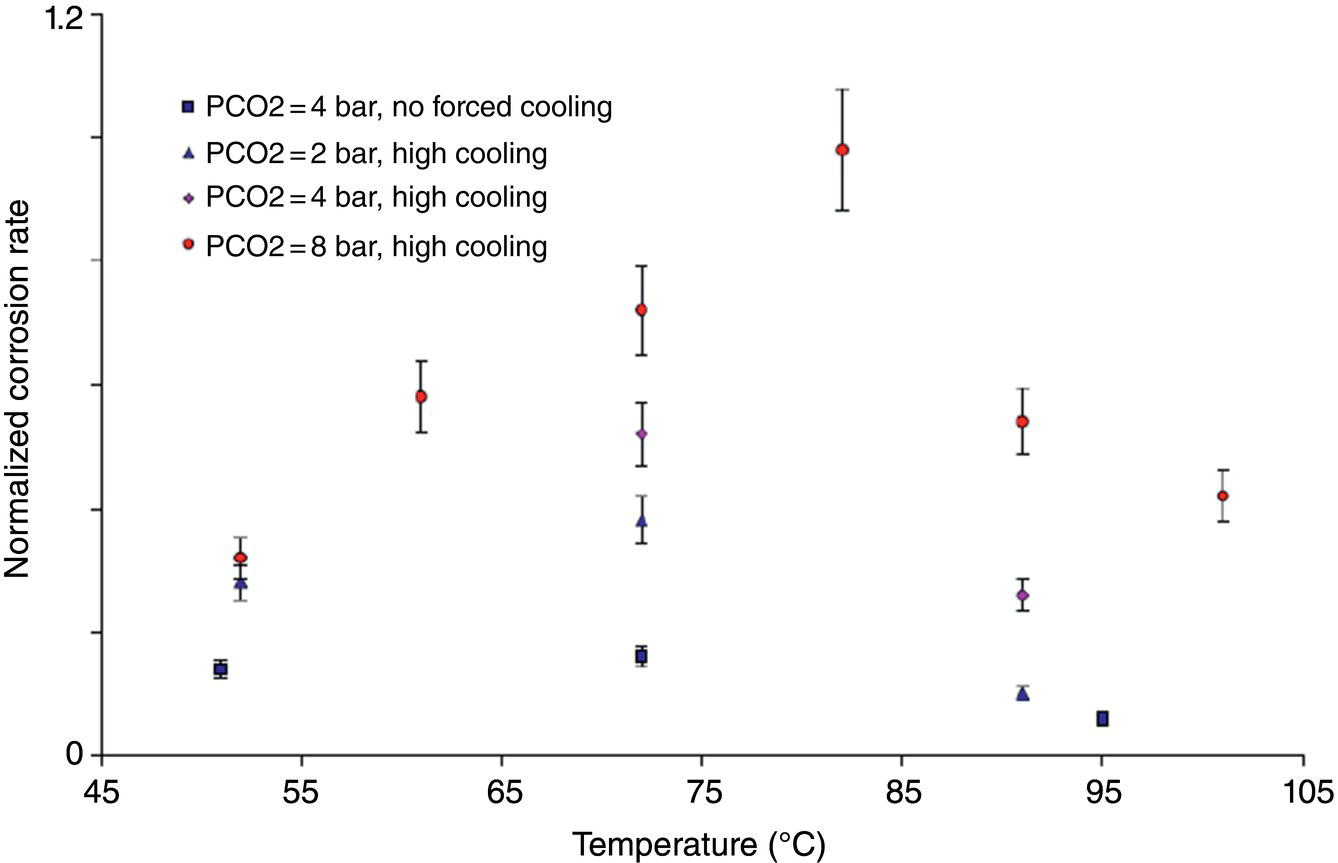
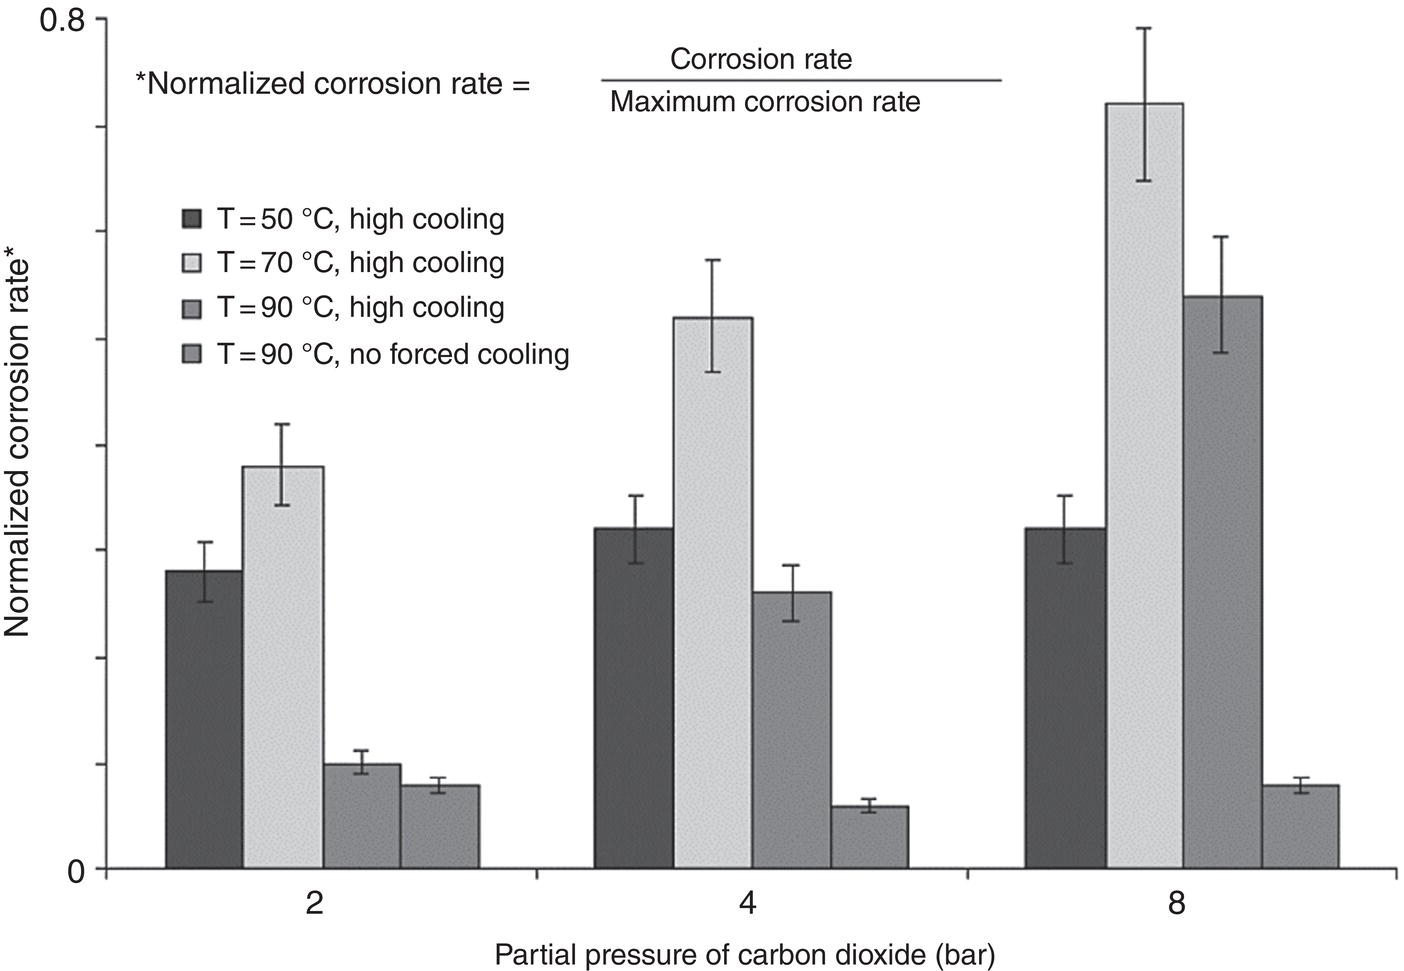
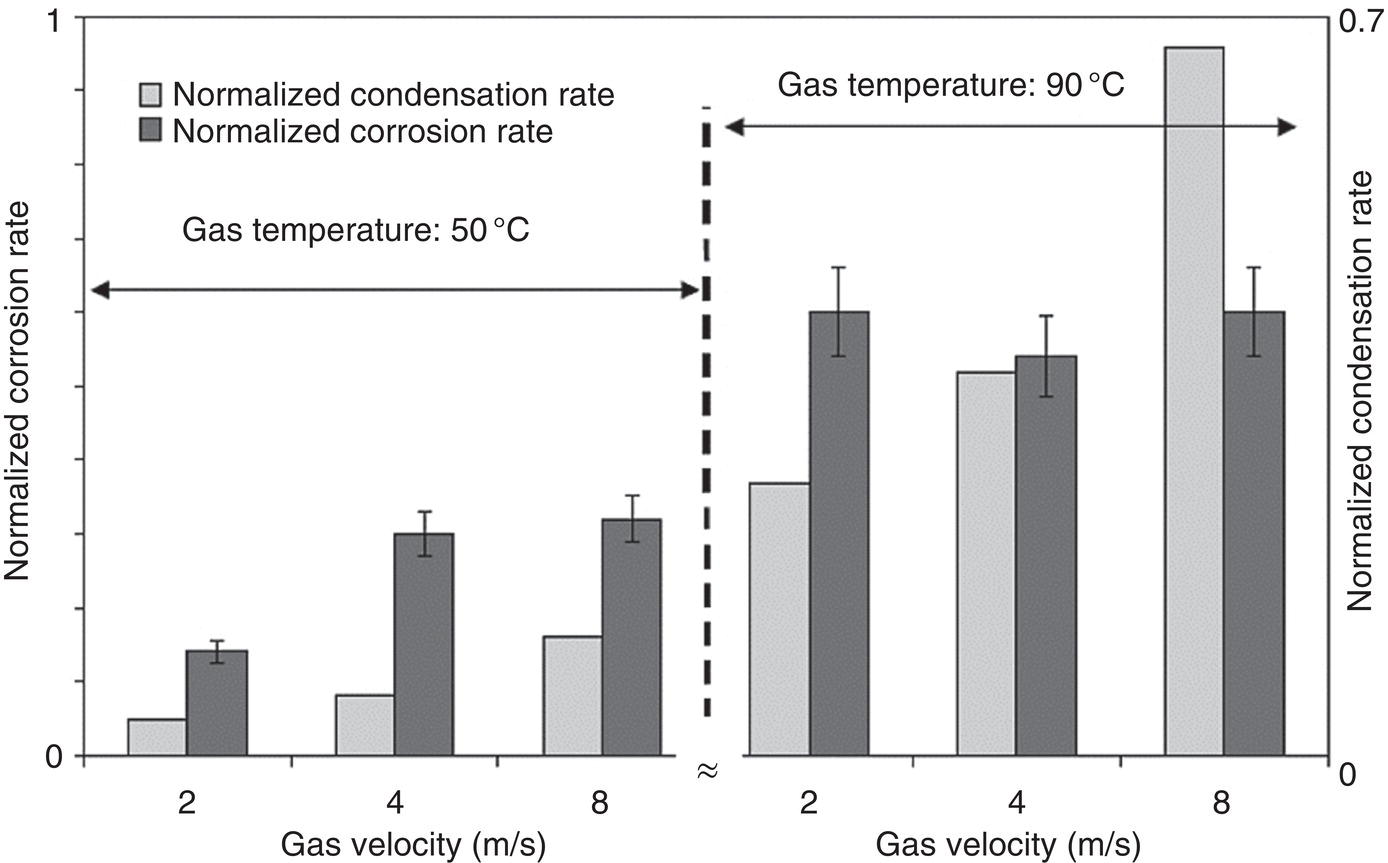
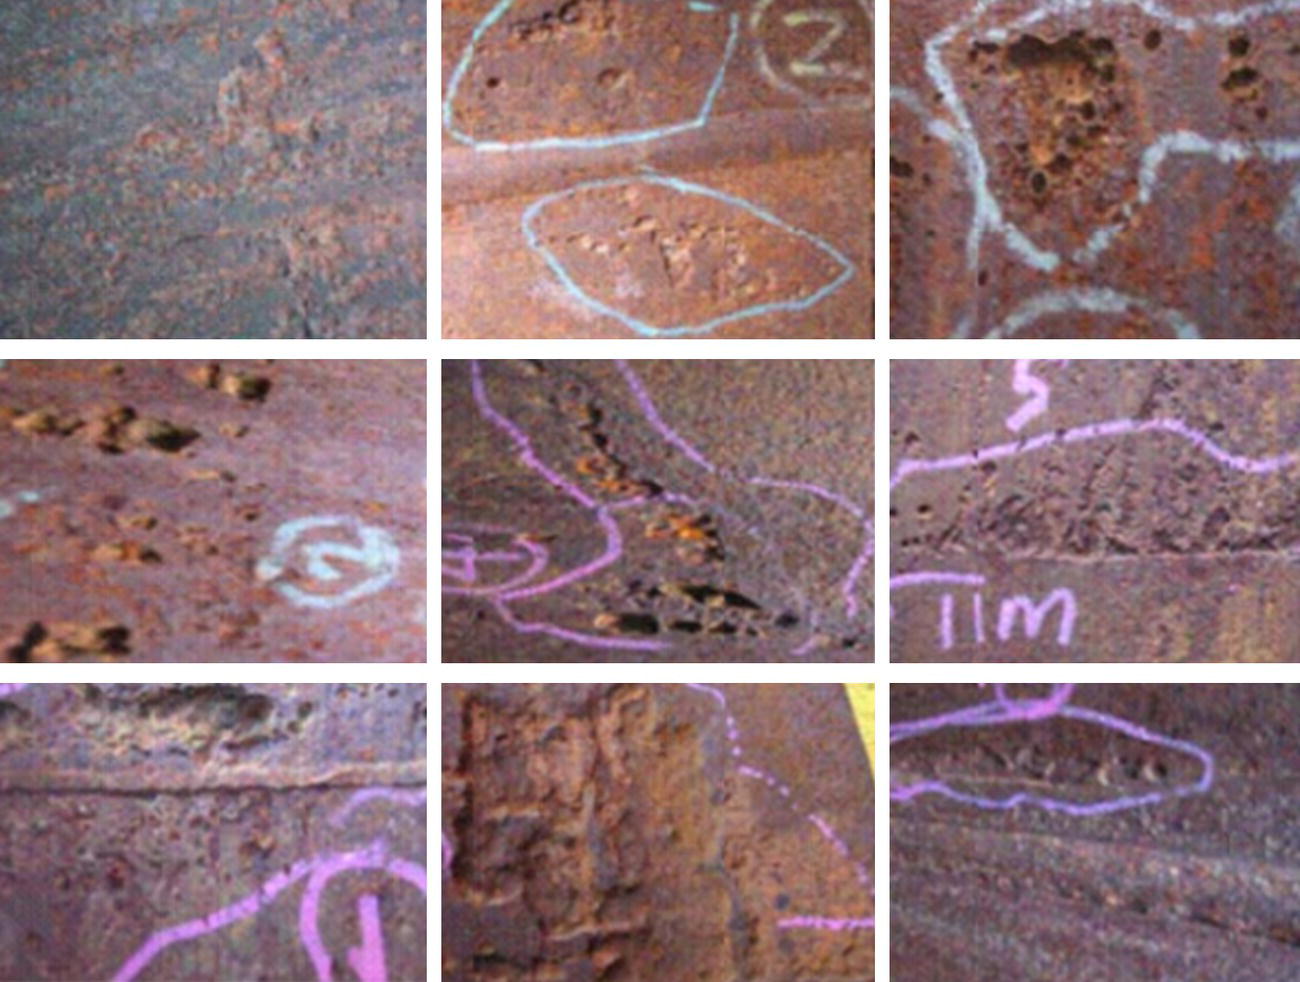
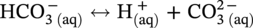
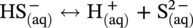
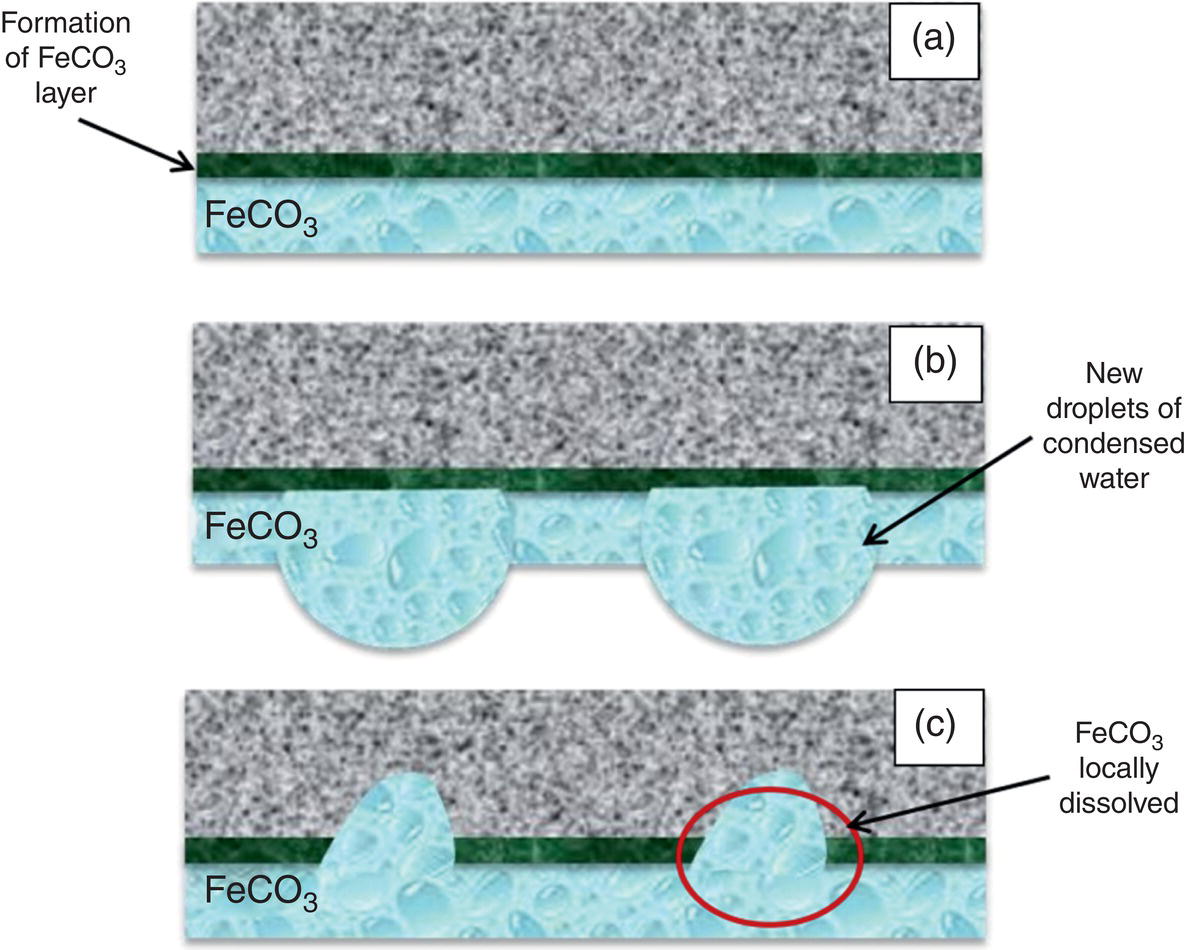
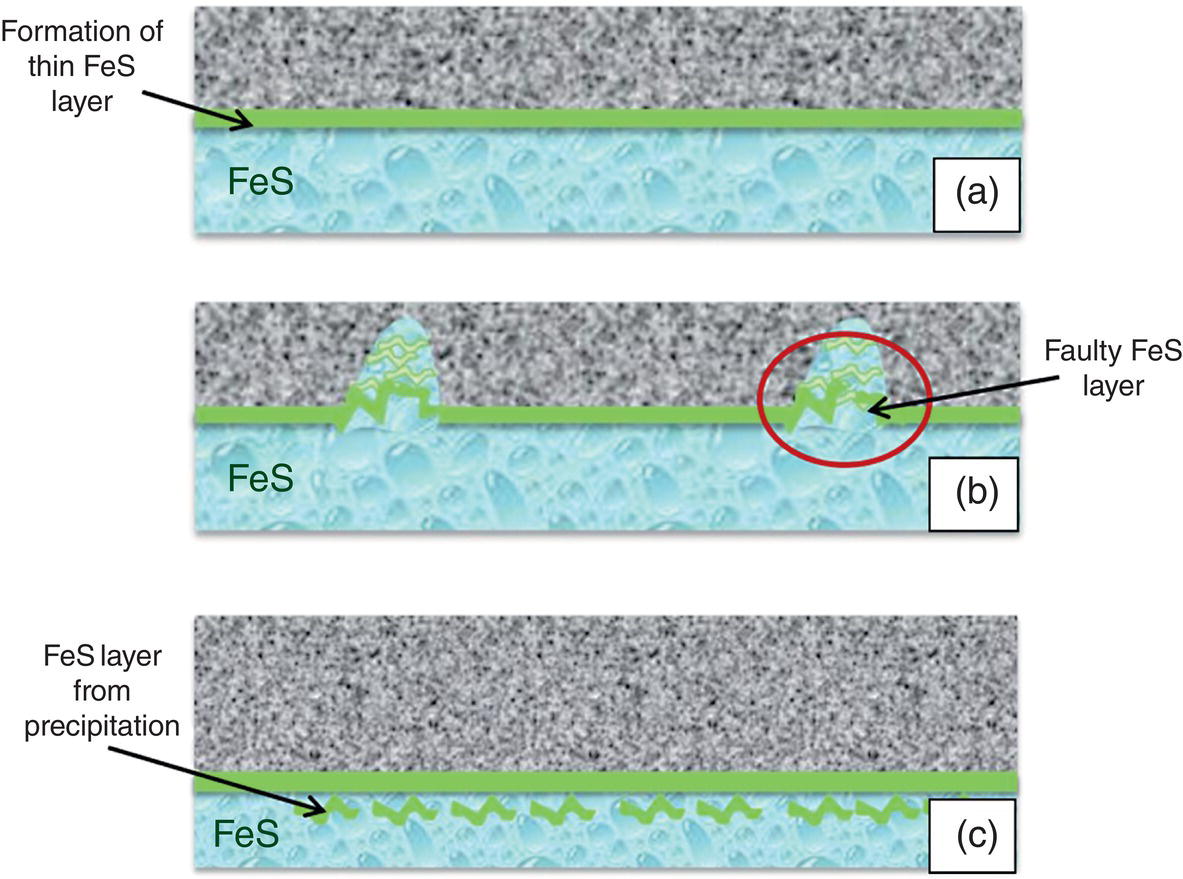
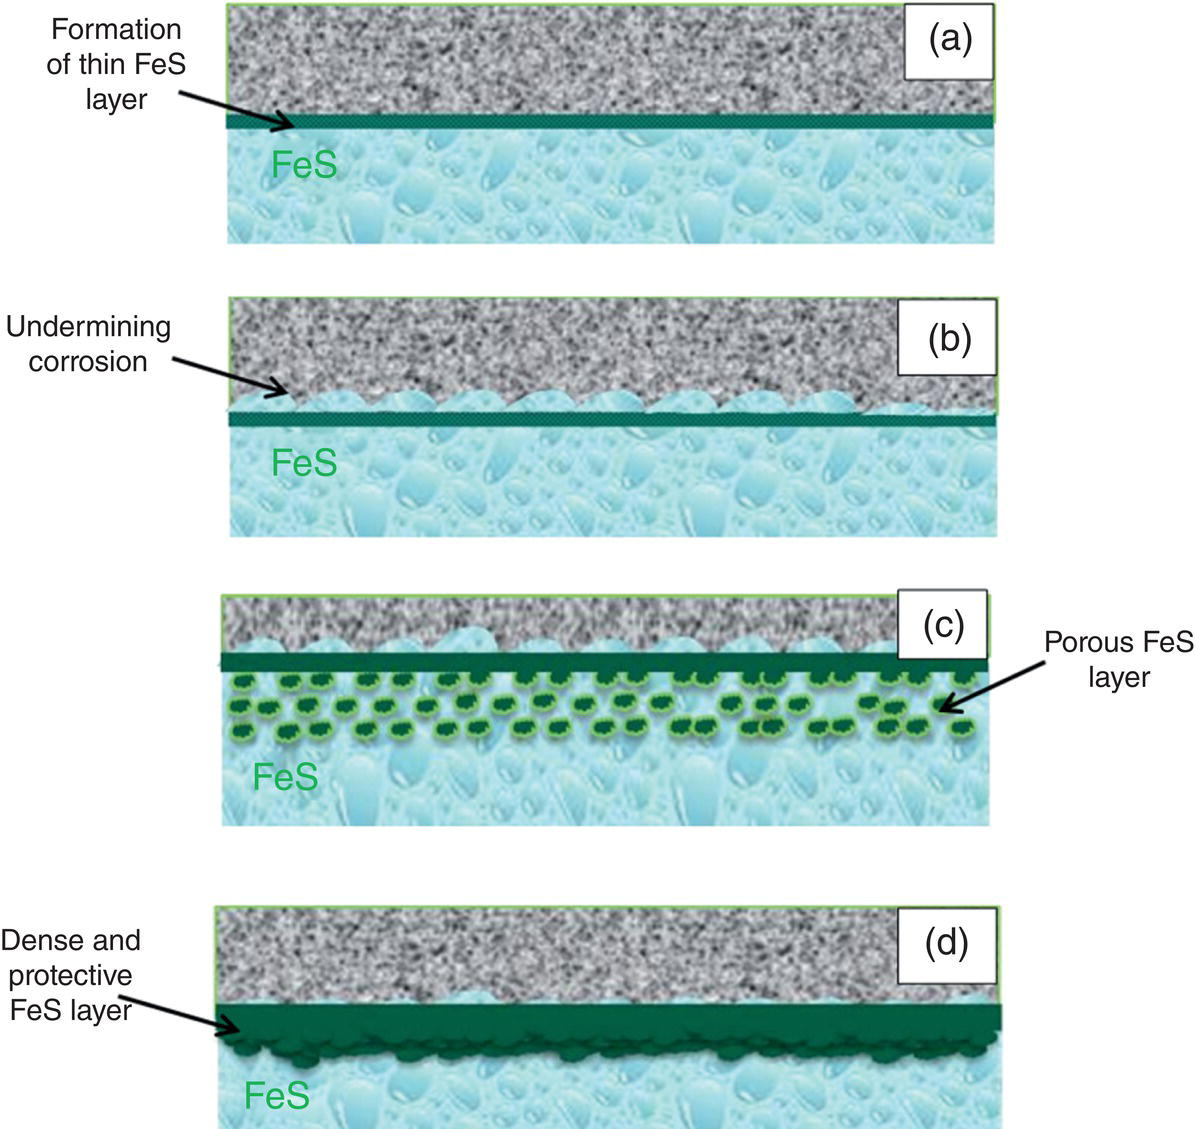
Aisha H. Al-Moubaraki1 and Ime Bassey Obot2 1Chemistry Department, Faculty of Science–Alfaisaliah Campus, University of Jeddah, Jeddah, Saudi Arabia 2Interdisciplinary Research Center for Advanced Materials, King Fahd University of Petroleum and Minerals, Dhahran, Saudi Arabia The petroleum sector is the foundation of the technological-energy world matrix, and the transportation of oil and gas is one of its key responsibilities. Numerous failures in this industry are primarily caused by corrosion phenomena, with all the potential negative effects on people, business, and the environment. Multiphase well streams are still being transported over long distances from wells to main platforms, installed on nearby fields, or processed at onshore processing facilities. These facilities use carbon steel pipes due to their comparatively low cost, good mechanical strength, and availability. Solids, acid gases, and water are all byproducts of the oil and gas extraction process. Water from the manufacturing process causes corrosion issues inside the pipe. Top of the line corrosion (TLC), which often associated with wet gas lines, and bottom of the line corrosion (BLC), which is typical for all lines, are the two broad categories into which internal corrosion in the oil and gas transportation system can be divided. Over the past few decades, extensive research efforts have been carried out to enhance our understanding of the mechanisms underlying both BLC and TLC. While considerable progress has been made in elucidating the mechanisms of BLC, TLC mechanisms continue to be an area of ongoing research and investigation. TLC is identified as one of the worst types of internal corrosion in wet gas transportation. TLC often occurs when the thermal insulation of the pipeline fails entirely, partially, or when it is absent altogether. The co-produced water vapor contained in the gas phase condenses around the whole circumference of the line’s interior walls because of external cooling that creates significant temperature differences. When the partial pressure of acidic gases (CO2, H2S, organic acids) is high, the condensed water becomes extremely corrosive and is in equilibrium with the gas phase in these circumstances. The first TLC failure was recorded in a French sour gas field, as reported by Paillassa et al. [1] in 1963. Water condensation at the top side of the pipeline operating in a stratified flow regime and low gas velocity was clearly identified as the failure’s primary cause. Another case of TLC was published by Gunaltun et al. [2] in 1999. TLC was discovered in a multiphase pipeline in Indonesia’s Mahakam River delta. An in-line inspection tool detected high wall thickness loss in the area where the pipeline was not buried. As a result, the interior and external temperatures of the pipeline were widely different, which caused a high rate of water condensation at the top of the internal pipe surface. A unique case of TLC called a cold spot corrosion was reported in 2010 [3]. Cold spot corrosion occurs where corrosion develops on small areas of the pipe surface, because the localized water condensation rates (WCRs) are much higher than those of the surrounding pipe sections. This also occurs where the thermal insulation is flawed or not applied evenly. Cold spot corrosion is regarded as the worst type of TLC due to its very localized and penetrating corrosive characteristics. The production and transportation of oil and gas pose significant challenges within the petroleum industry. These operations involve intricate systems and processes that necessitate a thorough understanding of corrosion-related issues. The goal of this chapter is to provide readers with a fundamental understanding of TLC, including its causes, contributing variables, and underlying mechanisms. Transporting production gases and fluids from offshore platforms to onshore processing facilities can be difficult for the oil and gas sector. A multiphase complex mixture of hydrocarbons, organic acids, carbon dioxide, water, and other substances can be found in the product fluids and gases that emerge from the reservoir [4]. Through carbon steel pipelines, the fluids and gases can be transported across great distances in an affordable and practical manner. Water, dissolved salts, particulates, carbon dioxide, and organic acids are all harmful because they exacerbate internal corrosion issues in carbon steel pipelines. TLC is an internal corrosion phenomenon that affects the inner wall of gas transmission pipelines at the upper portion (between the 10 and 2 o’clock positions) because of condensation of water vapor. The pipes that are vulnerable to TLC are frequently operated in the stratified and wavy-stratified flow regimes. A schematic of the possible flow regimes in horizontal pipelines is shown in Figure 46.1. The flow regimes that can lead to TLC are emphasized [5]. TLC happens when there is a difference in the pipeline’s internal and external conditions, which causes water vapor containing corrosive gases like H2S, CO2, and organic acid to condense (mostly acetic acid-HAc). There are two ways the water vapor in the gas phase condenses on the pipe wall [6]: Due to the difference in chemical composition between condensing water and the formation of water flowing at the bottom of the pipeline, corrosion caused by water condensation (TLC) differs significantly from general corrosion that may develop there. Table 46.1 lists the species that are frequently present at the top and bottom of the pipeline [7]. Numerous species could be present in the formation of water at the bottom of the line. Only volatile species or their derivatives, however, are present at the top of the line because the liquid there condenses from the vapor phase. Figure 46.1 Two-phase flow regimes that are feasible in a horizontal pipeline. Top of the line corrosion can happen in flow regimes with stratified, wavy-stratified, and rolling wave patterns. ([5]/with permission of Ohio University.) Table 46.1 Species Typically Present in a Pipeline [7] TLC is a multipronged phenomenon involving multiple processes that interact together [8]: Under these circumstances, carbon steel can corrode quickly, which might cause a pipeline to lose its integrity and possibly fail. The consequences of such corrosion can extend beyond a reduction in production output, potentially compromising the integrity of the pipeline and leading to possible failures. Figure 46.2 Schematic of top of the line corrosion. (Aisha Al-Moubaraki.) Figure 46.2 shows the scheme of the wet gas pipeline showing TLC conditions. According to practical experience, pipelines are frequently buried in the soil or seabed, which serves as thermal insulation, but the upper portion of the pipe is either not buried or is improperly insulated, which causes water condensation at the upper wall of the pipeline where the temperature gradient between the cold environment (outside) and the heated fluid (within the pipe) is maximum. The BLC and the TLC experience different corrosion rates. TLC rate is affected by several factors, including gas temperature, WCR, CO2 partial pressure, the presence of organic acid, and gas velocity. The development of TLC mitigation techniques to prevent pipeline failure while in service requires a clear understanding of the various parameters that affect the corrosion mechanisms of TLC. Various parameters influencing the rate of TLC are discussed in the following section and presented in Figure 46.3. TLC is greatly influenced by the WCR, which is also greatly influenced by several other factors, such as gas temperature, sub-cooling temperature, noncondensable gas concentration, gas velocity, system pressure, and internal pipe diameter. In general, it is anticipated that the corrosion rate will be low at low condensation rates and rise with condensation. The idea is that at higher condensation rates, the rate of renewal of the condensed droplets is faster [9]. If liquid remains adhered to the metal surface for a longer period, FeCO3 saturation with the droplets in a low condensation regime that produces stationary droplets is more easily accomplished. The growth and nucleation of the liquid droplets that will eventually fall to the ground due to gravity during the condensation process can potentially affect the corrosivity of the condensed liquid, altering the chemistry on the metal surface, however, it requires further. The droplets will significantly raise the pH and Fe2+ concentration, which favors the production of scale. When the condensation forms as a continuous film on the metal surface, it is said to be filmwise. When the condensation forms as droplets, however, which reach a critical size before running off or dropping off the surface, it is said to be dropwise [10]. As a result, the metal’s surface will remain relatively “dry” during dropwise condensation, and another drop with a lower pH and more aggressive corrosivity will start to form. However, it should be noted that a thin liquid layer typically exists between the droplets, even during dropwise condensation. Localized corrosion is caused by this cycle, which alters the FeCO3 layer’s protective capacity. Due to a high condensation rate, localized attack is always more noticeable near the top of the line. Under normal conditions, the rate of pitting and the surface area covered by the localized attack both rise as the condensation rate rises. However, it is important to note that at very high WCRs, there is a threshold beyond which general corrosion can occur instead of localized pitting. According to reports, the type, size, and retention period of the condensed liquid on the metal’s surface have a significant impact on how corrosion behaves on TLC. Figure 46.3 Factors affecting the rate of TLC. (Aisha Al-Moubaraki.) The literature’s value for WCRs ranged from 0.001 to 2.25 ml/m2/s [9, 11–17]. In conditions with low concentrations of organic acids (below 100 ppm), the critical WCR was calculated to range from 0.15 to 0.25 ml/m2/s, above which significant TLC can be anticipated [18]. However, other important parameters, such as the presence of organic acids, temperature, and complexing anions, might affect the precipitation of FeCO3 and further lower the value of the critical WCR. Figure 46.4 shows how WCR affects corrosion rate. To comprehend the impact of gas flow rate on WCR and eventually the overall effects on corrosion rate, four comparable probable findings were made by various authors [20, 21] as stated below: Figure 46.4 Influence of the condensation rate on the corrosion rate at the top of the line Tgas = 70 °C, Gas velocity = 5 m/s, HAc = 171 ppm—Partial pressure of CO2 constant. ([19]/with permission of NACE International.) In conclusion, several important variables can be identified when determining if a pipeline would experience severe WCR [8]: Gas temperature has been identified as the primary factor that influences TLC due to its effect on the rate at which condensation forms, the types of corrosion products that result, and ultimately, the rate at which corrosion occurs. The thickness of the condensate film, the rate of condensation, and the temperature of the film are all influenced by the temperature of the gas and the surrounding environment (which causes condensation as a result of excessive cooling). The influence of low and high gas temperatures on corrosion rate has been the subject of various conflicting publications to date. The rate of condensation is believed to be relatively low at low gas phase temperatures, and the electrochemical reaction of the condensed water regulates the rate of corrosion. However, a higher gas temperature causes a thicker condensate film and a higher rate of condensation, both of which ultimately speed up corrosion [22]. The impact of a wide range of gas temperatures, from 40 to 100 °C, on TLC was researched by Vitse et al. [23, 24]. TLC increased as temperature increased, peaking between 70 and 80 °C. After that, as the temperature increased further to 90 °C, the trend of the corrosion rate reversed, as shown in Figure 46.5. The initial increase in the TLC rate that occurred with increasing gas temperature (70 °C) was caused by an increase in reaction rate. However, at higher temperatures (>80 °C), other mechanisms were hypothesized, including: (1) the increased condensation rate makes the condensed liquid film thicker and hence restricts the mass transfer of corrosive species, (2) FeCO3 precipitation occurs on the surface protecting the surface partially, and (3) higher corrosion rate may enrich the concentration of ferrous ion which in turn elevates the pH and alters the mechanism of electrochemical reaction. The nature of the produced corrosion product was found to be dependent on gas temperature, as observed by Singer et al. [9, 19]. Their research revealed that at lower temperatures (40 °C), a largely porous FeCO3 corrosion product was generated, which exhibited reduced protective properties. Although the initial corrosion rate increased over the first few days at this temperature, it remained lower compared to higher temperatures, which are controlled by the low temperature in TLC conditions. Conversely, at higher temperatures (>70 °C), a dense and protective FeCO3 film formed. Consequently, while the initial corrosion rate was higher at these temperatures, it gradually decreased as the protective FeCO3 film developed. Figure 46.5 Influence of gas temperature on the corrosion rate at different pCO2 and different cooling rate; Vgas = 8 m/s. An empirical model has been developed by Nyborg and Dugstad [25] as stated in Equation (46.1) for calculating the TLC rate. where CR is the TLC rate in mm/year, Rcond shows the WCR in g/m2s, CFe represents the solubility of iron in ppm, and T is the temperature in °C. Based on this model, the increase in TLC depends on various factors including gas temperature. The model predicts a corrosion rate ranging from 0.03 to 0.14 mm/year as the gas temperature increases from 30 to 90 °C, considering higher condensation rates. It is important to note that this model focuses on the influence of gas temperature but does not consider the corrosion protection provided by the formation of FeCO3. A change in gas temperature can influence the condensation rates and temperature on the inner wall of the pipeline, subsequently influencing the mechanisms of the TLC and the characteristics of the resulting corrosion products. TLC rates are observed to increase in response to increasing CO2 partial pressure (pCO2), and the extent of this effect depends on temperature and condensation rate. Specifically, the impact of CO2 partial pressure on TLC becomes more pronounced at high temperatures and high condensation rates. Singer and coworkers [9] postulated a proportionate link between the average TLC rates and the pCO2. The characteristics of the corrosion products generated on the surface were also associated with pCO2 in the study. The authors showed that a lower pCO2 (0.13 bar) does not favor the development of protective FeCO3 layers because of the low supersaturation that results in a low but consistent corrosion rate over time. While the initial corrosion was more aggressive at high pCO2 (>2 bar), the average corrosion rate gradually decreased with time. Higher supersaturation in the condensed liquid was reached, which was attributed to the creation of protective FeCO3 layers. Vitse et al. [23, 24] conducted a study to investigate the impact of pCO2 on TLC across a range of 1–8 bar, at bulk temperatures of 50, 70, and 90 °C, and under both low and high condensation rates. The results indicated that at 50 °C with cooling and 90 °C without forced cooling, pCO2 had no significant impact on the corrosion rate. However, it is important to note that these findings were obtained from short-term tests, and caution should be exercised when extrapolating the results to long-term scenarios. The study findings indicated that the corrosion rate remained unaffected by pCO2 at low WCRs. However, at a high WCR, pCO2 demonstrated a significant impact on the TLC process, particularly at temperatures of 70 °C and at 90 °C with high cooling, as depicted in Figure 46.6. Supersaturation cannot occur at higher condensation rates because of the rapid replenishment of condensed liquid. In this case, a rise in the pCO2 made the atmosphere more corrosive by lowering the pH of the condensed liquid. In contrast, at low condensation rates, the condensed liquid reaches saturation or even supersaturation with the corrosion product, which raises pH and slows the CO2 kinetics of the corrosion reaction. By performing studies at constant condensation rates (0.18 ml/m2/s) and at wall temperatures of 25 and 55 °C, Ojifinni and Li [12] were able to determine that pCO2 has a less impact on TLC. It was discovered that when pCO2 was raised from 3.45 bar to 18 bar, a slight increase in TLC rates was seen at both temperatures. The competing involvement of CO2 and corroded Fe2+ in altering the pH and supersaturation of the condensed liquid was used to explain the minimal influence of pCO2. Oehler [26] also showed a slightly higher TLC rate with increasing pCO2 from 5 to 20 bar at constant condensation rates and without the presence of acetic acid (HAc). In conclusion, pCO2 affects TLC in a variety of ways, both positive and negative. On the one hand, it aids in the formation of FeCO3, which can provide some corrosion protection and lower corrosion rates. On the other hand, it lowers the pH of the condensed liquid, which enhances the medium’s corrosivity. However, other environmental factors, such as WCR, can have a significant impact on TLC. Gas velocity impacts the rate of condensation, which in turn affects the rate of corrosion. The mass transfer constraint for condensation existing in the gas phase can be used to explain how the gas velocity affects the rate of corrosion. As was previously discussed, the condensation rate has a complex relationship with the corrosion rate and is influenced by all other factors. As a result, when the condensation rate crosses a certain threshold, the corrosion rate increases dramatically. This is consistent with the idea that the corrosion rate is controlled by the saturation level of corrosion products in the condensed layer. The corrosion rate consequently depends on the corrosivity of the liquid phase when the condensation rate is high enough above a threshold that can prevent the liquid film from reaching saturation [11]. Figure 46.6 Influence of the pCO2 on the corrosion rate; Vgas = 8 m/s. According to the research done by Vitse [23], as shown in Figure 46.7, it was found that gas velocity has a direct impact on the condensation rate, which in turn has a direct impact on the corrosion rate. According to the study, the gas velocity affects the rate of condensation and corrosion at both 50 and 90 °C, and the rate of condensation reduces as the gas velocity goes from 8 to 2 m/s. In addition, it was established that at low gas velocities, the mass transfer is less significant because there is less water available for condensation at the wall, which results in low heat loss and delays the phase shift of the water phase. There is a strong likelihood that at low condensation rates, saturation will be reached in time to generate an iron carbonate scale, which is only protective at high temperatures. According to Singer et al. [9], the gas condenses at low velocity by creating stationary droplets at the top of the pipe wall. It is anticipated that the saturation level of FeCO3 in these stationary still droplets will be quite high, favoring the development of thick protective layers. When the gas velocity increases, the condensation regime transitions from stagnant droplets to moving droplets, typically around the 10 and 2 o’clock positions on the pipe wall. However, as the condensed liquid droplets slide, they traverse the pipe’s top and eventually reach the bottom. Although the sliding droplets may not have prolonged contact with the pipe steel to form a FeCO3 film, they do accumulate Fe2+ ions, which can contribute to FeCO3 formation. Meanwhile, the stagnant droplets provide a protective film. Along the liquid channels, nonprotective Fe3C can form. As a result, two distinct layers are often formed at the top of the pipeline. Major droplet sites tend to develop protective FeCO3 film, while preferred liquid paths may form nonprotective Fe3C layers. Figure 46.7 Influence of the gas velocity on the condensation rate and on the corrosion rate (high cooling and pCO2 = 8 bar). ([23]/with permission of Ohio University.) Most wet gas transportation pipelines contain organic acids that come from either the natural gas reservoir or from regenerated glycol, which contributes to some deterioration. The typical range of organic acid concentrations is 100–3000 ppm, with acetic acid (HAc) predominating and accounting for 50–90% of all organic acid routes [10]. The three main organic acids that are frequently found in oil and gas wells are formic acid, acetic acid, and propionic acid [27]. Table 46.2 lists their physical and chemical characteristics. It has been observed that with increasing condensation rate, there is a tendency for the concentration of organic acids in the condensed liquid to decrease. This decrease can be attributed to factors such as dilution and the washed effect. However, it is important to note that the impact of condensation rates on organic acid concentration can vary depending on specific experimental conditions and system parameters. The concentration of organic acids in the condensed liquid can be influenced by condensation rates, although the relationship is complex and dependent on several factors. While it has been observed in certain experimental conditions that high condensation rates can lead to a reduction of the top of the line organic acid concentration to approximately 75% of the bottom of the line concentration, it is crucial to consider additional factors such as pH, which plays a significant role in TLC. The exact influence of condensation rates on organic acid concentration can vary depending on specific system parameters, and further research is needed to elucidate these relationships. The literature agrees that the presence of HAc degrades the pipeline’s integrity and increases both the uniform and localized TLC rates. It was suggested that HAc increases the rate of corrosion by either accelerating the cathodic process or by altering the corrosion product’s solubility and protectiveness [11, 19, 26, 28]. According to Hinkson et al. [28], organic acids have three main effects on the rate of TLC: (1) increasing the cathodic rate of reaction (HAc is a source of protons and can do so); (2) inhibiting the anodic dissolution reaction to some extent, as studies by Crolet et al. [29] and Sercombe et al. [30] have shown that HAc can have a slight inhibiting effect on the anodic dissolution of iron, particularly at low temperatures; and (3) modifying the protectiveness and solubility of the corrosion films. Table 46.2 Physical and Chemical Properties of Organic Acids [27] Due to its volatility, acetic acid can be transferred in the gas phase and condensed with the water on the upper wall, increasing the corrosivity of the condensed water and posing a threat to the FeCO3 layer’s integrity. A TLC pipeline failure that occurred underwater was caused by water condensation in the presence of CO2 gas and volatile organic acids (acetic and formic acids). The condensation rate was increased by the interaction between organic acids present in the produced fluid and water from the external environment [27]. According to Nyborg and Dugstad [25], in a CO2 environment, HAc increases the solubility of FeCO3 in condensed water. Furthermore, Okafor and Nesic [10] reported that an increase in HAc concentration would accelerate corrosion by promoting a higher concentration of undissociated HAc in the droplet, resulting in increased contact between HAc and the metal surface. It is important to consider the effect of pH in this context. In dropwise condensation, the droplet is in direct contact with the metal surface, and the dissolved CO2 and undissociated HAc present contribute to the initial higher corrosion at the points of contact. During corrosion, the reduction of proton (H+) and the oxidation of iron lead to the release of ferrous ions (Fe2+) into the condensed droplets, increasing the pH. This pH increase promotes higher supersaturation by FeCO3, which is known to drive the precipitation rate of FeCO3. In addition, the increase in pH affects the speciation of species in the droplet and modifies the mechanism of electrochemical reactions at the metal surface. The precipitated FeCO3 crystals subsequently deposit on the metal surface. In another study by George and Nesic [31], it was determined that the presence of HAc increases the corrosion rate as a result of a shift in the bicarbonate/acetate ratio. This shift occurs because, at a certain point, HAc becomes the main source of fluid acidity, resulting in a lower pH compared with H2CO3. Similar explanations for why HAc accelerates carbon steel corrosion in a CO2 environment were provided by Gunaltun and Belghazi [18]. According to a report, HAc acts as a buffering agent, lowering the pH and contributing to the corrosion process. The corrosion rate is influenced by the formation of iron acetate, a complex compound that exhibits high solubility in acidified water. The formation of iron acetate can impact the corrosion process by interfering with the formation of FeCO3, which is a protective corrosion product. In addition, HAc is thought to have a higher acidic buffering effect than bicarbonate [32]. Moreover, HAc can influence the solubility of FeCO3 and the thickness of the formed carbonate layer, potentially impacting the CO2 corrosion process. Because acetate ions can create iron acetate and transfer iron away from the steel surface, the production of thinner iron carbonate layers, which are not protective, is to be blamed for the increasing rate of corrosion [33]. By accelerating the cathodic reaction, HAc can affect how quickly corrosion occurs. Two alternative pathways can lead to this influence. HAc serves as a source of H+ ions in the first scenario. These ions are then reduced to atomic hydrogen, which combines and is released as molecular hydrogen. In the second case, the effect of HAc on corrosion is similar to that of carbonic acid. However, it is important to note that the direct reduction of HAc and carbonic acid to produce hydrogen gas has been refuted by several authors [29]. The characteristics and mechanisms of TLC in sweet and sour corrosive environments are presented in the following sections. TLC is generally defined as localized corrosion in numerous field inspections. In the oil field, “localized uniform corrosion” rather than “localized corrosion” is used to describe corrosion when it appears to be so severe. The first instance of TLC was defined as “large regions of corrosion formed by the joining of sharp-edged pits” as previously documented [2]. When corrosion occurs in sweet environments (i.e., those where CO2 predominates), it is known as a mesa attack because the pipe is not uniformly corroded but the pits are large, devoid of any layers, flat-bottomed, and surrounded by regions with intact corrosion (Figure 46.8) [8, 34]. Okafor and Nesic proposed a mechanism for corrosion in HAc-containing liquid droplets [10]. They linked the presence of shielded and unprotected zones to the localized corrosion under drop-wise condensation. The findings suggested that galvanic cells developed between areas covered in a FeCO3 film and those that were film-free. Singer [8, 35] presented a prediction model after closely examining the localized TLC. According to the study, TLC rates are correlated with condensation rates, gas temperature, and HAc levels in condensed water. Localized corrosion is initiated by the local disintegration of the FeCO3 layer due to the renewal of the condensed water. Furthermore, the precise location of the droplets was not associated with the area of the limited attack. Amri et al. [36–38] published the initial experimental research that investigated the TLC phenomena. They provided a conceptual model of pit dispersal, but more research is still required. In a sour environment (i.e., one where H2S predominates), uniform and pitting corrosion can take place. Here, the method of corrosion attack is still not clear. Research on the uniform H2S corrosion mechanism is still needed [39]. As reported by Camacho et al. [40], corrosion in the presence of CO2/H2S in various ratios was strictly uniform, and no signs of localized attack could be identified. The main source of corrosion on the surface of carbon steel has always been thought to be the FeS layer. In a follow-up study to Camacho’s work, Singer et al. [41] found that the presence of HAc in the presence of H2S appeared to affect the FeS film’s cohesiveness and cause localized corrosion. Figure 46.8 Typical TLC failure in CO2-dominated environments. (Reference [34]/with permission of NACE International.) Localized corrosion was discovered in the investigation by Yaacob and colleagues [42] when the H2S partial pressure was less than 0.08 mbar. However, it has been noted in the work by Zhang [6] that the ingress of O2 is a significant factor contributing to localized attack. Furthermore, a comparison between gas temperatures of 40 and 60 °C revealed a more severe extent of localized corrosion at the lower temperature. The presence of a non-homogeneous corrosion layer and an imbalance between the rates of protective layer formation and corrosion are believed to be contributing factors to localized corrosion. As stated by Esmaeely et al. [43], localized corrosion was caused by flaws in the corrosion layer that allowed corrosive particles to reach the steel surface at low concentrations of H2S. In the oil and gas industry, corrosion phenomena are typically classified into two main categories: sweet corrosion, which occurs in the presence of CO2 and sour corrosion, which involves the presence of corrosive species such as H2S as previously mentioned. The composition of the corrosion product layer (either FeCO3 or FexSy) can provide valuable insights into the dominant corrosion mechanism. However, this principle can only be applied in failure analysis when such data are easily accessible. A corrosive condition described as “sweet corrosion” results from the presence of CO2 (without H2S) in the system. As part of the corrosive mechanism, there are a number of general chemical reactions that are illustrated here [44, 45]. Aqueous CO2 is created when gaseous CO2 dissolves in water and is subsequently hydrated to produce carbonic acid (H2CO3): Bicarbonate ( Then, as a result of Further electrochemical reactions should be taken into account while studying CO2 corrosion in carbon steel. The oxidative solubility of iron in an aqueous solution causes the anodic reaction: The reduction of H+, H2CO3, Consequently, the following can be written to represent the total response of steel to an aqueous, sweet TLC environment: According to thermodynamics, the supersaturation level and temperature affect the conditions under which precipitation occurs. Likewise, it has been noted that organic acids can change the properties of the corrosion layer [29, 46, 47]. If mechanical damage, abrupt chemical changes, or changes in operating conditions do not threaten the cohesiveness of FeCO3 layers, they often offer protection against CO2 corrosion. Is typically considered sour when a substantial concentration of H2S is present, and it is common for CO2 to be present as well. Unlike their CO2 counterparts, H2S TLC’s corrosion mechanisms have rarely been investigated [48]. Although it may seem that the governing factors for the two mechanisms are different, these variations are primarily due to the traits associated with each form of corrosion. Dissolution results from the presence of H2S in the gas [49, 50]: Immediately after dissolving in the solution, aqueous H2S can dissociate. The following reactions illustrate how sulfide (S2−) and bisulfide (HS−) species might arise during the dissociation processes: Acidic H2S can provide an extra supply of hydrogen ions, similar to the sweet environment. There is also a chance of reducing H2S: Finally, the general response of steel in a sour TLC environment might be expressed as follows: Various forms of FeS are generated depending on the environmental factors (troilite, cubic FeS, and mackinawite). Experimental tests demonstrated the existence of two distinct layers: an exterior layer that is porous and thick and an inner layer that is dense and thin [51]. TLC and the traits of the corrosion layers are closely connected. Therefore, choosing whether to expect FeS or FeCO3 precipitates is important for TLC predictions [52–54]. The following are a few potential sour corrosion characteristics [35]: The schematics in Figures 46.9–46.12 illustrate the characteristics of the TLC mechanisms based on the previous discussion. The schematics depict characteristics of TLC in settings that are sweet (Figure 46.9), slightly sour (Figures 46.10 and 46.11), and extremely sour (Figure 46.12) [55]. As illustrated in Figure 46.9a, in sweet environments, steel initially corrodes uniformly as water droplets condense on the steel surface. The TLC rate decreases when the FeCO3 corrosion product layer is formed. With the passage of time (Figure 46.9b), acidic droplets of water continue to condense on the surface, resulting in a surface pH of 3.5–4.0 and an unsaturated solution of FeCO3 since FeCO3 saturation requires a pH between 5.5 and 6.0. When the FeCO3 layer dissolves at local sites, Figure 46.9c, the bare steel surface is exposed to the acidic condensed water at these sites, where localized corrosion occurs. Schematics illustrating corrosion in slightly sour environments are presented in Figure 46.10. Initially, a thin layer of FeS is formed on the steel surface through the direct contact of the steel with H2S, Figure 46.10a. At low H2S partial pressures (less than approximately 0.03 mbar), the FeS layer is not fully protective, resulting in corrosion at local sites, as shown in Figure 46.10b. At higher H2S partial pressures (greater than approximately 0.1 mbar), a more protective FeS layer develops, and more FeS precipitates on the surface result in a lower rate of TLC, Figure 46.10c. The effect of exposure time on TLC in slightly sour environments is illustrated in Figure 46.11. Initially, as shown in Figure 46.11a, a thin FeS layer forms on the surface of the steel by the direct reaction of H2S with Fe. The thin FeS layer is not protective at low H2S partial pressures (less than approximately 0.03 mbar). Localized corrosion pits form at random sites where the FeS layer fails, Figure 46.11b. With the passage of time, the pits fill with FeS, which inhibits the expansion of the pits. Corrosion of the steel continues, as shown in Figure 46.11c. Figure 46.9 Localized corrosion schematics illustrating the TLC mechanism in sweet environments. (a) initial general corrosion and formation of FeCO3 corrosion product layer, (b) with time, water continues to condense on the surface, (c) localized corrosion occurs at sites where the FeCO3 corrosion product layer is dissolved. (Reference [55]/with permission of Ohio University.) Figure 46.10 Localized corrosion schematic of TLC mechanism in slightly sour environments. (a) Initial general corrosion and formation of thin FeS corrosion product layer, (b) at low H2S partial pressures, corrosion occurs at local sites, (c) at higher H2S partial pressures, a more protective FeS layer forms by precipitation leading to a lower rate of TLC. (Reference [55]/with permission of Center for Reliable Energy Systems.) In Figure 46.12, schematics illustrating TLC in extremely sour environments are presented. Initially, as shown in Figure 46.12a, a thin layer of FeS forms through the direct reaction of Fe and H2S. Because the thin FeS layer is non-protective, corrosion of the steel continues (Figure 46.12b). Precipitation leads to the formation of a second FeS layer. At low temperatures, this layer is porous and non-protective, Figure 46.12c, whereas at higher temperatures, this layer is dense and protective (Figure 46.12d), reducing the rate of TLC. The specific temperatures at which these transitions occur can vary depending on the specific conditions and materials involved and are not explicitly defined in the literature, but it is generally accepted that the properties of FeS layers, including their protective capabilities, can change significantly with temperature [56]. Figure 46.11 Localized corrosion schematic of TLC mechanism in slightly sour environments: effect of exposure time. (a) Formation of thin FeS layer as a result of direct reaction of Fe and H2S, (b) thin FeS layer breaks down at local sites, where pits form and, in time, fill with FeS, which inhibits the growth of the pits, (c) corrosion continues to take place, reducing the thickness of the steel. (Reference [55]/with permission of Center for Reliable Energy Systems.) Figure 46.12 Schematics for TLC mechanism in extremely sour environments. (a) Formation of thin FeS layer as a result of direct reaction of Fe and H2S, (b) because the thin layer of FeS is nonprotective, corrosion of the steel surface continues, (c) a second layer of FeS forms that is porous and nonprotective at lower temperatures, (d) at higher temperatures, the second layer of FeS is dense and protective, reducing the rate of TLC. (Reference [55]/with permission of Center for Reliable Energy Systems.)
46
Top of the Line Corrosion (TLC): Causes and Mechanisms
46.1 Introduction
46.2 Fundamentals of TLC
46.2.1 Causes of TLC

Species
Symbol
Present in BLC
Present in TLC
Dissolved carbon dioxide
CO2, aqueous
√
√
Carbonic acid
H2CO3
√
√
Bicarbonate ion

√
√
Carbonate ion

√
√
Hydrogen ion
H+
√
√
Hydroxide ion
OH−
√
√
Iron ion
Fe2+
√
√
Chloride ion
Cl−
√
Sodium ion
Na+
√
Potassium ion
K+
√
Calcium ion
Ca2+
√
Magnesium ion
Mg2+
√
Barium ion
Ba2+
√
Strontium ion
Sr2+
√
Acetic acid
CH3COOH or HAc
√
√
Acetate ion
CH3COO−or AC−
√
√
Dissolved hydrogen sulfide
H2S, aqueous
√
√
Bisulfide ion
HS−
√
√
Sulfide ion
S2−
√
√
Bisulfate ion

√
Sulfate ion

√
46.2.1.1 Water Condensation Rate (WCR)
46.2.1.2 Gas Temperature
46.2.1.3 CO2 Partial Pressure (pCO2)
46.2.1.4 Gas Velocity
46.2.1.5 Presence of Organic Acids
Properties
Formic Acid
Acetic Acid
Propionic Acid
Formula
HCOOH
CH3COOH
CH3CH2COOH
Molecular weight
46.03
60.07
74.00
Boiling point, °C
100.80
118.10
141.00
Acidity, (pK a )
3.75
4.76
4.88
46.2.2 Characteristics of TLC
46.2.3 Mechanisms of TLC
46.2.3.1 Sweet TLC Environment


 ) and hydrogen ions (H+) are produced when H2CO3 is dissociated into the solution.

 dissociation, another H+ and
  reproduced:
 , and/or H2O is covered by the cathodic reactions:


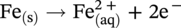
46.2.3.2 Sour TLC Environment


46.3 Summary: Overall TLC Characteristics in CO2/H2S Environments
References
Top of the Line Corrosion (TLC): Causes and Mechanisms

(46.2)
(46.3)
(46.4)
(46.5)
(46.6)
(46.7)
(46.8)
(46.9)
(46.10)
(46.11)
(46.12)
(46.13)
(46.14)
(46.15)
(46.16)