“Troubleshooting, revamping, and eliminating waste offer huge benefits in reducing capital investment, downtime, carbon dioxide emissions, and energy consumption. Unfortunately, the attention paid to this resource in the energy-transition era has been too little to reflect its tremendous potential.” —(Henry Kister, author) Flooding is accumulation of liquid in the tower. This accumulation propagates upward from the flood initiation zone, filling the regions above with frothy liquid. The accumulation may build up all the way to the top of the tower, or to a point where an abrupt change in hardware design or flow conditions (e.g., feed point) interrupts further accumulation. The flood may or may not propagate above that point. The capacity of most distillation and absorption towers is limited by flooding. Flooding is a common cause of deterioration in tray or packing efficiency, separation falling off, and product purity going off-spec. When the accumulation builds up to the top of the tower, massive liquid entrainment may occur from the tower and reach downstream units, causing contamination and sometimes equipment damage. Flooding may generate intermittent steps of liquid buildup and dumping, which destabilize the tower. This instability may propagate to downstream or thermally coupled units. Liquid accumulation in the tower lowers the bottom flow rate, sometimes starving the bottom pump and causing its cavitation. To prevent the adverse effects of flooding, operators cut throughput, and the plant loses capacity. The diameter of new towers is set to sustain operation a comfortable margin (typically 20%) below the flood point. In existing towers, throughput is limited by the onset of flooding, which may bottleneck the entire plant. The maximum throughput for tower revamp designs is usually restricted by the approach to (typically 10%) the flood point. Troubleshooting for flood is mandatory for correctly diagnosing the root cause of poor tower performance and/or debottlenecking it. There are many alternative causes of poor separation, including inefficient trays or packing, poor liquid distribution, excessive weeping, or damage to internals. Liquid entrainment from the top of the tower may be caused by poor reflux piping. Instability may result from oscillating control loops, poor controller tuning, or feed rate fluctuations. Pump cavitation may result from air leak into the pump suction (under vacuum) or from undersized suction piping. If flooding can be ruled out, the troubleshooter can focus on one of these alternative causes. It is equally important to correctly identify the location and nature of the flood. The author has seen many cases where misdiagnosis of the root cause or the location of flooding led to ineffective solutions or debottlenecks. When misdiagnosed, the flooding persists and even worsens, and engineers lose their credibility, if not their jobs. Once the flood, its root cause, and location are correctly diagnosed, an adequate solution can be devised. The solution usually involves hardware modifications to tower internals or auxiliary equipment, or process re-optimization (e.g., changing feed preheat, tower pressure). This chapter aims to provide engineers with the tools needed to distinguish flooding from other issues and to diagnose the nature of the flood, its location, and its likely mechanism. Only nonradioactive techniques for flood diagnosis are covered in this chapter. Radioactive techniques such as gamma scans and neutron backscatter are highly effective for diagnosing flood and are discussed at length in Chapters 5 and 6. As stated in Section 2.1, flooding is accumulation of liquid in the tower. This accumulation propagates upward from the flood initiation zone. This applies regardless of the mechanism described below. In tray towers, there are four different major mechanisms that lead to this liquid accumulation: Entrainment (jet) flood is the most common flood mechanism for towers operating below 100 psia. The active areas of trays are sized to keep tower operation within a comfortable margin from jet flood (typically keeping the design vapor rate 10–20% below the jet flood vapor rate at a constant liquid to vapor ratio). Entrainment flood is always primarily a vapor flood. If liquid has an effect, it is very secondary. The key parameter for jet flood is the C-factor, given by Figure 2.1 Unflooded and Flooded Tray (a) Unflooded, froth height about 12 inches; (b) Jet-flooded, froth height exceeding tray spacing. (Copyright © FRI. Reprinted Courtesy of FRI.) All of these increase with higher liquid rates; tray pressure drop also increases with higher vapor rates. When the backup of aerated liquid fills up the downcomer (i.e., exceeds the [tray spacing + weir height]), it will start accumulating on the tray above, causing downcomer backup flooding. In the absence of fouling or foaming, aerated downcomer backup usually does not rise above 16–18 in. Downcomer backup is therefore an uncommon flood mechanism at tray spacings of 24 in. and higher. The lower the spacing, the more likely it is to run into a downcomer backup flood. When the tray spacing is 18–20 in. or less, it is important to closely check for downcomer backup. When tray holes or valves plug up, downcomer backup shoots up parabolically. The dry pressure drop (vapor friction pressure drop incurred by the vapor flow through the tray openings in the absence of liquid) is proportional to the hole velocity squared. The dry pressure drop across a tray is typically 2–3 in., which incurs the same clear liquid backup in the downcomer. This would translate to about 5 in. of aerated liquid. If half the holes plug, the dry pressure drop will escalate by a factor of two squared, from 2 to 8 in. The additional 6 in. liquid head will raise the downcomer froth by about 10 in., which can easily rise to the tray above and initiate accumulation. A plugging/fouling flood is almost always a downcomer backup flood because of the parabolic rise in vapor friction (dry) pressure drop as holes or valves plug up. Figure 2.2 Downcomer backup in heads of clear liquid. (Copyright © FRI. Reprinted Courtesy of FRI.) Downcomer backup flood is also common in foaming services. Foam formation increases the aeration (i.e., the vapor content) of the downcomer liquid, which in turn raises the height of the foamy dispersion in the downcomer to the tray above, initiating accumulation there. Criteria for downcomer backup flood calculation are available in most distillation texts (34, 193, 245, 299, 451, 492). This phenomenon is analogous to liquid pouring out of a bottle or a cup. When a water-filled open bottle is turned upside down, air entering upward to take the place of the outflowing water impedes the water downflow rate at the neck of the bottle, and the bottle will empty slowly. In contrast, if a water-filled glass is turned upside down, the area at the neck will be too large for the air to impede the water downflow, and it will empty instantaneously. Just like in the analogy, downcomer choke flood is primarily dependent on the cross section area at the entrance to the downcomer. Downcomer choke floods are always primarily liquid floods. If vapor has an effect, it is very secondary. The key parameter is the liquid velocity at the downcomer entrance. Criteria for the maximum downcomer inlet velocities can be found in many distillation texts (34, 193, 299, 451, 492), with the most updated list in Ref. 245. Downcomer choke flood is common in high-pressure distillation where liquid loads are high and the liquid is foamy. Over 90% of the floods experienced by the author at pressures 165 psia and above were downcomer choke floods. Downcomer choke floods are also common with foaming systems, where the foam has difficulty entering the downcomer and disengaging from the liquid. Finally, downcomer choke floods are commonly experienced with high liquid rates. In packed towers, there are three flood mechanisms: This is by far the most common packing flood mechanism. Again, it is characterized by the C-factor (Eq. 2.1), but here the C-factor is based on the entire tower cross section area rather than the tray active area. Theoretically, the cross section area occupied by the packing should be subtracted from the tower cross section area, but with modern metal or plastic packing this area is small (typically 1–3% of the tower cross section area) and is neglected. A procedure for calculating the flood velocity is described elsewhere (193, 245). Calculating the proximity of flood limits is invaluable in diagnosing the root cause and location of a tower flood or capacity problem. Hydraulic procedures are available in most distillation texts (e.g., Refs. 34, 193, 299, 451, 492), with the most updated in Ref. 245, for calculating the percent of flood, i.e., the proximity of each tray or packed bed in the tower to the points of initiation of each of the various flood types. Hydraulic calculation software is also available from technology suppliers like Fractionation Research Inc. (FRI), from equipment vendors, and in tower simulation software. First, a tower simulation is prepared per the guidelines in Chapter 3 to provide valid internal vapor and liquid loads and physical properties for each stage in the tower. The simulation should be based on the highest throughput before the tower runs into trouble. Adherence to the procedure in Chapter 3 is important, as internal vapor and liquid loads based on a simulation that incorrectly represents plant data will lead to invalid hydraulic analysis and a misleading diagnosis. The highest internal vapor and liquid loads in each section of tower are then used in the hydraulic calculations together with the relevant physical properties. A case where the hydraulic analysis was sufficient to diagnose the root cause of a tower flood (24) is illustrated in Table 2.1. This tower was an olefins plant demethanizer, 6 ft diameter at the bottom, swaging to 3 ft at the top. When the feed rates were raised, flooding was observed just above the swage. The tower was simulated based on plant data at the maximum throughput. Capacity limits were calculated using the FRI software on the basis of the simulation and tray/downcomer geometry. The upper six rows of Table 2.1 list the geometrical parameters. The next three rows list the key calculated hydraulic parameters. The next three rows present the calculated results as “Jet flood, %,” “Froth in the downcomer, %,” and “Downcomer choke velocity, %.” These describe the proximity of the operating parameters to main capacity limits. A value approaching or exceeding 100% for any of these parameters indicates likely flooding by this mechanism. Table 2.1 Demethanizer hydraulic analysis that diagnosed tower problem. (From Bellner, S.P.,W. Ege, and H. Z. Kister, Oil & Gas Journal, November 22, 2004. Reprinted Courtesy Oil & Gas Journal.) Table 2.1 shows all the trays to operate a comfortable margin away from jet and downcomer choke floods. In the top section, froths in the downcomers were also a large margin away from flood. In contrast, froth heights in the downcomers of trays 15 to 25, immediately below the swage, exceeded 100%, suggesting a likely flood due to excessive downcomer froth heights. On trays 26–73 below, the froth heights in the downcomers approached flood but did not get there yet. This analysis concluded that the observed flood most likely originated just below the swage (trays 15–25), and definitely not above it as was previously thought, even though the symptoms appeared above the swage. To diagnose the root cause, the bottom five rows of Table 2.1 list the calculated hydraulic factors that contribute to the downcomer backup. The downcomer backup is the sum of the inlet clear liquid height, the tray pressure drop, and the head loss under the downcomer (34, 193, 245, 451, 492), as illustrated in Figure 2.2. Table 2.1 shows that below the swage, most of the downcomer backup is due to the pressure drop, particularly the dry pressure drop. The dry pressure drop is the friction head incurred by the vapor flow through the tray openings when no liquid is present. To give high dry tray pressure drop takes a small open area on the tray. So the hydraulic analysis identified low open area as the root cause. The hole areas below the swage were indeed low, 3.2% of the tray active area, compared to typical values of about 8–12%. Low hole areas may or may not lead to flood, and this is why it is important to compile a hydraulic analysis like in Table 2.1. The Table showed that the low hole areas led to flood on trays 15–25. Based on this finding, the sections below the swage were retrofitted with trays containing larger hole areas. This eliminated the flood and debottlenecked the tower. These graphics, also referred to as “performance diagrams,” plot the operating limits for a given tray design and operation. Within these limits, a region (“window”) of satisfactory operation is defined. They were introduced by Bolles (38), and offer visualization of the proximity of the tray operation to the surrounding limits. Operating window diagrams were advocated by many authors (e.g., Refs. 28, 99, 305, 464–466) and extensively discussed in Refs 99 and 305, 464–466. Figure 2.3 is an example of an operating window diagram for a tower operating at a slight positive pressure, containing trays at 24 in. tray spacing. The x-axis is the liquid weir load, which is the tray liquid flow rate (gpm) divided by the outlet weir length (inches). The y-axis is the C-factor from Eq. 2.1, representing the vapor load. To maintain constant product purity, towers usually operate at a constant reflux ratio, i.e., a constant ratio of liquid to vapor. For instance, if the vapor rate is raised, the liquid rate will be raised proportionally to keep a constant liquid-to-vapor ratio. The operating line is the long-dashed sloped line in Figure 2.3. The hard limits are plotted in Figure 2.3 as continuous lines, while the softer limits as short-dashed lines. The shaded region is the region of stable operation for the system and tray design, and is often referred to as “stable tray operation window.” The limits plotted are as follows: Figure 2.3 shows that both the SL and JF limits primarily depend on the vapor load and are only slightly affected by the liquid loads. This is typical of these limits. Figure 2.3 also shows that the jet flood limit at 24 in. tray spacing is not too far below the system limit. Figure 2.3 Example of a Tray Operating Window Diagram, showing the hard limits as continuous lines, and the softer limits as short-dashed lines. The shaded region is the region of stable operation. (From Kister, H. Z., “Practical Distillation Technology,” Course Manual. Copyright © 2013; reprinted with permission.) Additional limits may apply. A minimum liquid rate may apply for specialty trays containing truncated downcomers that do not have positive liquid seals (28). Below this limit vapor may enter downcomers. A dumping limit, in which all the liquid weeps through the tray and nothing gets to the downcomer, is also sometimes included; this is associated with severe loss of fractionation and often with instability. A pressure drop limit may apply in some cases (99). Even reboiler and condenser limitations can be included (29). Bernard (28) demonstrates the use of this technique to depict effects of changing the operating line, feedstock, design variables, and fouling. Summers (464, 466) and Engel (99) demonstrate application of this technique to optimize tray design. While recognizing their merit of providing a graphic illustration of the relevant limits and the stable operating region, the author’s experience has been that for the nonexpert user, these diagrams may be misleading. The limits are often specific to one set of operating conditions. The diagrams often make very poor distinction between “hard” limits and those that can be violated at a minor or no penalty. Some limits depend on inaccurate correlations. Some limits like “80% of jet flood” may be important for design, but not for operation or troubleshooting, where “100% (or 95%)” of jet flood is more meaningful. Limits like channeling are seldom shown. Foaming and fouling are often not represented, poorly represented, or based on guesswork. The author recommends caution with the application and interpretation of operating window diagrams for any specific situation. Startup Stability Diagrams One situation where the author and others (26, 28) found the stability diagrams particularly useful is for addressing startup conditions. Here, the above-listed limitations are usually not an issue, as the limits are few and high accuracy is not required. In many startups, vapor is introduced to the tower before the liquid. This vapor will flow both through the trays and the downcomers. If the vapor velocity through the downcomers exceeds the system limit (based on the downcomer area), it will not allow liquid descent into the downcomer and cause flooding in the tower. This is a downcomer unsealing flood, as described in Section 2.11. An attempt to introduce liquid before the vapor is unlikely to help, because in the absence of vapor the liquid will dump through the tray openings and bypass the downcomers without sealing them. The startup stability diagram, showing both the critical vapor velocity (downcomer unsealing flood limit) at which the vapor will prevent liquid descent in the downcomer and the liquid dumping limit, is invaluable for defining the stable region on the vapor–liquid map at which neither limit will be restrictive and the tower can be started up. Once started up, the tray liquid will seal the downcomers, and the critical vapor velocity will no longer be a limit. Successful applications of this technique have been reported (26, 28, 190). To determine the flood point, the tower is first set in non-flooded conditions at high rates. Then the tower internal vapor or liquid flow rates or both are raised. Usually both are raised, because raising one without the other will adversely affect the tower material balance, generating a poor-purity product before flooding conditions are reached. The vapor and liquid rates during flood testing are typically raised by one of the following procedures: With all the above procedures, reflux and reboil flow rates are varied. The procedure of varying these rates influences the results and must take the tower control system into account. In most tower control schemes, the composition (or temperature) controller manipulates either the reflux or reboil, directly or indirectly. The stream that is not controlled is regarded as “free,” i.e., on flow control. During flood testing, this “free” stream flow rate is usually raised, with the temperature control automatically adjusting the controlled stream to maintain product purity. Figure 2.4 shows a tower with the temperature control on the boilup and the “free” stream the reflux rate. Flood testing in this tower raises the reflux rate, which cools the control tray, so the temperature controller will raise boilup. The net result is that both boilup and reflux are raised, and a new steady state is established. Figure 2.4 Distillation tower with reflux on flow control and temperature control manipulating boilup. Flood initiates near the top in this example. (From Kister, H. Z., “Practical Distillation Technology,” Course Manual. Copyright © 2013; reprinted with permission.) This procedure may overshoot the flood point. The higher liquid rate may take some time to reach the tray where flooding initiates, to fill the packing voids, or to accumulate on trays and downcomers to a detectable extent. So following the change, the tower may appear stable for some time, even though the flood reflux and boilup rates have been exceeded. This issue is most common in towers containing a large number of trays or in towers where the volume is large and the internal liquid flow rate is small. In the meantime, the test may progress, and the vapor and liquid rates may be raised further. The flood point thus determined will be higher than the actual one. “Undershooting” the flood point is just as common. Its occurrence depends on the tower dynamics. For instance, increasing boilup can raise the froth height and thus the inventory of liquid on the trays (or in the packings). This extra liquid holdup may take up enough of the void space in the packing or the disengagement space between the trays to initiate premature flooding. The flood point thus determined will be lower than the actual one. To avoid overshooting and undershooting, vapor (or liquid) rates should be raised in small steps, followed by long stabilization periods between steps. This is critical in towers with a large number of trays. A preliminary flooding test, with relatively large and fast steps, will indicate when to slow down in the final test. Typically, vapor (or liquid) rates are raised by 5–10% increments at 15- to 30-minute intervals during the preliminary test (4, 192). Increments as small as 1–2% are preferable, even at the preliminary test. It was found (187) that frequent small increases in vapor (or liquid) rates are less likely to prematurely upset the tower and generally require shorter stabilization periods (4, 187). Although the preliminary test may suffer from overshooting or undershooting, it is likely to determine the flood point within ±10% and often within ±5% (4, 192). The results of this test provide a good starting point for the slow test. The preliminary test was found effective both for improving accuracy and reducing time requirements for flood point determination (187). Accurate material and energy balances are required for flood point determination, should close within 3% and 5%, respectively (4, 187), and be checked before and during the test. The author encountered one case where an energy balance error of 25% made it impossible to determine whether the tower was flooding prematurely or at the intended hydraulic loads. Generally, there is no need for accurate component balances, as these have a relatively small impact on the tower hydraulic loads. Ambient conditions should be recorded during the flood test (4). Flood tests should be avoided under extreme weather conditions, as instability may set in and heat losses (especially in smaller, poorly insulated towers) may affect the results. Many of the guidelines described in Section 3.1.3, particularly those pertaining to material and energy balances, also extend to flood testing. However, flood tests are far less sensitive to analytical errors than efficiency tests and therefore require a much lower level of effort. Recapping the key concepts, flooding is accumulation of liquid in the tower. Almost always, this accumulation propagates from the lowest flooded region upward. Accumulating liquid backs up into the tray (or packed section) above, until the whole column fills with liquid or until an abrupt change in flow conditions (e.g., feed point) or tray/packing design is reached. Flooding may or may not propagate above that point. One or more of the following symptoms indicates flooding: Pressure drop measurements across various tower sections are the primary tool for flood detection. Excessive Column Pressure Drop The liquid accumulation that characterizes flooding incurs high pressure drop. In general, a normal tray pressure drop is 4–5 in. of liquid. For most organic and hydrocarbon systems whose specific gravity is around 0.7–0.8, this gives 0.1–0.14 psi per tray. If the measured pressure drop per tray is 0.15 psi per tray with an organic or hydrocarbon system, possible flooding should be suspected. Once the measured pressure drop exceeds 0.2 psi per tray and the measurement is correct, flooding is highly likely. For aqueous systems, as well as other higher-density systems like chlorosilanes with a specific gravity of about 1.0, the normal pressure drop can be somewhat higher (about 0.18 psi/tray), possible flooding occurs when the measured pressure drop is above 0.2 psi/tray, becoming highly likely when the measured pressure drop exceeds 0.25 psi per tray, and the measurement is correct. With packed towers, the flood pressure drop is given by the Kister and Gill Equation (193, 220, 245, 462) where The values of packing factors to be used in Eq. 2.2 should be taken from the 9th Edition of Perry’s Handbook (245). Packing factors originating from other sources may not be compatible with Eq. 2.2 and can lead to inaccurate or even incorrect predictions. Measured pressure drops significantly higher than the value predicted from Eq. 2.2 indicate flooding. While a high pressure drop (per the above criteria) almost always signifies flooding, many towers flood, yet the pressure drop remains low. The pressure drop rise is due to liquid accumulation. When the liquid accumulation is small, the pressure drop rise is small. Typical scenarios include flooding near the top of a tower (only a short packed length or a few trays accumulate liquid), flooding with channeling (the channeled vapor bypasses the accumulated liquid), flooding in vacuum-packed towers (accumulation is channeled and the vapor bypasses the accumulation zone), and flooding at low liquid rates (slow rate of liquid accumulation). Techniques for pressure drop measurements are discussed elsewhere (4, 54, 192, 410). Watch out for the dynamic velocity head of a vapor feed or reboiler return adding to the pressure drop reading. In Case 4 in Section 8.16, the dynamic velocity head of the vapor–liquid reboiler return mixture converted into static pressure at the tap, giving a reading of 165 psig, compared to 160 psig at a neighboring tap. Likewise, the pressure drop across the wash bed in a refinery vacuum tower (335) declined from 3.1 mmHg (indicating flood) to 0.7 mmHg (indicating normal operation) when the pressure measurement tap was switched from the feed (flash) zone to a point above the chimney tray just below the bed. The high pressure at the feed zone tap was due to impingement of the high-velocity vapor/liquid feed. Watch out for reranged differential pressure transmitters in towers where trays were replaced by low pressure drop internals like packings (166). The accuracy of a reading is a fixed percentage of the range of the sensing element. Reranging the output signal to go full scale at a lower value increases the fractional error. Lower-range transmitters should be used instead. Closely audit the location of the pressure drop points, especially when trays are replaced by packings. In one revamped tower (442), a pressure drop of 1.1 psi was measured across the top packed bed, more than double the design. The lower pressure tap was in the overhead vapor line. The real pressure drop across the bed was only 0.4 psi, while the remaining 0.7 psi was the entrance loss into the overhead vapor pipe. In high-pressure (>50–100 psig) packed towers, depending on the measurement method, the vapor static head between the lower and upper taps may need to be subtracted from the pressure drop reading. This pressure drop may exceed the packing dynamic pressure drop (4, 54, 512). In dP cells, the gas filling the measurement leg may have a different density than the vapor in the tower, and the difference would affect the pressure drop measurement. A detailed procedure allowing for both of these effects is very well illustrated by Xu et al. (512) and by Cai and Resetarits (54). Sharp Rate of Rise of Pressure Drop A sharp rate of rise of pressure drop with vapor load is a more sensitive flooding indicator than the magnitude of pressure drop. Pressure drop rises with increasing vapor loads. Upon flooding, the pressure drop rise is largely enhanced by the liquid accumulation. In many cases, once started, the pressure drop will keep rising even when vapor loads are no further raised. The flood point can be inferred from a plot of pressure drop against vapor flow rate. It is the point where the slope of the curve steepens (Figures 2.5 and 2.6). In tray columns, the slope change can be relatively mild (curve 1), or relatively steep (curve 2), as illustrated in Figure 2.5. A mild slope is more common for jet (entrainment) flooding or a small number of flooded trays, while downcomer flooding or flooding that propagates throughout several trays tends to give a steeper slope. It is not unusual to find a vertical slope once the flood point is reached (119, 185). Figure 2.5 Plots of pressure drop versus vapor flow rate for tray column. (From Kister, H. Z., “Distillation Operation,” Copyright © McGraw-Hill, 1990. Used with permission of McGraw-Hill.) In packed towers, inferring the flood point from a pressure drop versus load curve (Figure 2.6) is generally more difficult, because the slope begins changing at the loading point (point B), and the change may be continuous (curve BCD), rather than sharp. Further, many packed towers experience a rapid drop in efficiency well before reaching the hydraulic flood point. Here, the throughput limit is the loss of separation, and the hydraulic flood point may be of lesser practical significance. There are some cases of flood, especially in vacuum distillation, where no point of inflection is observed (232). Figure 2.6 Typical pressure drop versus vapor flow rate for packed tower. (From Kister, H. Z., “Distillation Operation,” Copyright © McGraw-Hill, 1990. Used with permission of McGraw-Hill.) For the best definition of the rate of pressure drop rise, it has been recommended (187, 192, 319) to install differential pressure recorders across each section of the tower prior to troubleshooting and flood testing. This technique (Figure 2.7) can clearly identify the region of flooding initiation. In one case (204), applying this technique to identify the flood initiation zone prevented misdiagnosis and unnecessary shutdown. In another case (363, 383), it conclusively confirmed that the flood initiated in the bottom section of a column. The open circles in Figure 2.8 show the multitude of points where pressure transmitters can be installed. Pressure drops between judiciously selected pairs of points can concisely identify the flood location and nature. In one case (21), at upset conditions, the top packed bed pressure drop fluctuated between 0.24 and 1.75 psi, while the pressure drop between the bottom tray and the top of the tower cycled at the same frequency between 3 and 4.7 psi, roughly the same amount. This proved that the pressure drop increase was in the top packed bed, not on the trays below. There was a pressure measurement point (not marked on Figure 2.8) in the top P/A (pumparound) liquid draw line from the collector tray, which gave a pressure drop of over 2 ft of liquid across the collector tray (the risers were only 10 in. tall), proof that the collector tray was liquid-full and backing liquid into the packing. The collector tray would fill up only if the downcomers of the upper trays below were plugged and backing up. This concise identification of the flood location and nature led to a solution that eliminated the flood without tower shutdown. Figure 2.7 Pressure drop profile obtained with high-speed multichannel strip-chart recorder. (From McLaren, D. B., and J. C. Upchurch, Chemical Engineering, p. 139, June 1, 1970. Reprinted with permission.) Figure 2.8 Pressure drop measurement locations in one complex tower (the upper part of an atmospheric crude tower). dP measurements can be conducted between any two and helped identify flood location and nature of flood. (From Barletta, T., J. Nigg, S. Ruoss, J. Mayfield, and W. Landry, Hydrocarbon Processing, p. 71, July 2001. Reprinted with permission.) A similar technique using a multitude of pressure measurement points enabled Öztürk et al. (354) to diagnose a flood zone between the kero draw and the top in another atmospheric crude tower. Similarly, Barletta and Kurzym (20) used two high-accuracy electronic gauges to identify the top pumparound and the heavy naphtha pumparound to be the two flooded zones out of six zones in an atmospheric crude tower. They took pressure readings simultaneously to ensure column pressure variations would not influence the measured pressure drops. If it can be afforded, a multichannel pressure drop recorder has been highly recommended (166, 319) and successfully applied (119, 319) for flood testing and diagnosis. This instrument can trace the sequence of events, zero in on the location of flood initiation, the conditions when it occurs, how the flooding propagates, and which remedial action is working. This instrument is invaluable for identifying flooding at the top tray (e.g., due to plugging), when the pressure drop rise may be too small to be noticed on the section or tower differential pressure. Figure 2.7 (319) shows an application of this technique, depicting step-by-step initiation and propagation of flood and, later, of the tower getting out of flood, clearly identifying the location and timing of each step. Onset of Fluctuations in Pressure Drop, Bottoms Level, and Tray Temperature This symptom is less common than the previous two, and may be caused by factors other than flooding. It signifies liquid accumulation above a certain point, and when enough liquid builds up, the liquid rapidly dumps. In the Figure 2.8 case cited above (21), at stable operation the top packed bed pressure drop was 0.2 psi, but upon an upset fluctuated between 0.24 and 1.75 psi. The dumping step is usually faster than the buildup step and is accompanied by cooling down below the flooded zone. Figure 2.9 Pressure drop fluctuations due to foam-flooding of a chemical tower. Lower curve, pressure drop of packed bed above the feed, upper curve, pressure drop of trays below the feed. (From Yarbrough, B., T. Cooper, and C. Davidson, “Extractive Column Troubleshooting after Internals Revamp,” Paper presented in the Distillation Symposium, AIChE Spring Meeting, Virtual, August 18, 2020. Reprinted with permission.) Figure 2.9 shows pressure drop fluctuations due to foam flooding of a chemical tower (516). The tower contained a packed bed above the feed, with trays below the feed. Both the trays and packing pressure drops fluctuated, the fluctuation amplitudes varied 6–12 mbars (0.1–0.2 psi). The average tray pressure drop aligned with the design, while the packing pressure drop was higher than expected. Gamma scans showed intermittent loading and unloading of the packed bed, no tray flooding, and signs of foaming throughout. A thorough investigation determined definite foaming in the tower (516). Senger and Wozney (422) reported similar pressure drop behavior “pulsating flood” in some of their tests with another chemical foaming system in a 12 in. ID tower that flooded from the random-packing support up. Pressure drop fluctuations are not unique to foam-flooding. Hanson and Lee (148) report cycles of pressure drop dumping and building resulting from partial trays plugging in a non-foaming service. These were accompanied by temperature excursions and bottom level loss. The author experienced similar cycles in a similar service. The pressure drop fluctuations are often accompanied by bottom level fluctuations that tend to be out-of-phase with the pressure drop fluctuations. A pressure drop peak represents liquid accumulation and will correspond to a bottom level valley. Similarly, a pressure drop dive represents a liquid dump and will coincide with a bottom level rise. In packed towers, the pressure drop peaks tend to occur simultaneously with the bottom level valleys, and vice versa. Trays have time constants of the order of 0.1 minutes per tray, so the pressure drop and bottom level peaks tend to be out of phase. Figure 2.10 shows operating charts from a large chemical column (298). Here, the bottom sump level and tray temperature 10 trays above it (“tray N”) showed very repeatable oscillations at a fixed amplitude and a period of several minutes. The amplitude was small at incipient flood, steeply rising upon the onset of full flood. The plant added an incipient flooding indicator that detected the small-amplitude fluctuations and warned the operators. Adding this indicator reduced the average number of flood episodes per year from 12 to 2 and raised tower capacity by 5%. Figure 2.10 Bottom level and Tray 10 temperature fluctuations upon incipient flooding, intensifying upon the onset of full flood. (From Litzen, D. B., and J. L. Bravo, Chemical Engineering Progress, p. 25, March 1999. Reprinted Courtesy of Chemical Engineering Progress (CEP). Copyright © American Institute of Chemical Engineers (AIChE).) Reduction in Bottoms Flow Rate Reduction in bottom flow is a common symptom of flood, and a primary criterion to determine the flood point (192, 293, 437). Upon flooding, liquid accumulates in the tower, so less liquid reaches the bottoms, and the bottom level falls. Most frequently, the bottom level is controlled by manipulating the bottom flow rate, so the level may stay constant while the bottom flow rate is reduced. While a reduction in bottom flow indicates flooding, many towers flood with no significant decline in bottom level or flow rate. For instance, if the feed is mostly liquid and flooding occurs above the feed, the bottom section may continue to operate normally with no significant decline of bottom level or flow rate. Also, if the flood location is well above the bottom, the time delay from the onset of flooding to the reduction in bottom level or flow may make accurate measurement of the flooding conditions difficult. Generally, reduction of bottoms flow rate is a good indicator of flooding in towers that flood near the bottom and in towers that are relatively short (437). Rapid Rise in Entrainment A rapid rise in entrainment is another common flood symptom (4, 192, 284). The liquid accumulating in the tower builds up to the top and is entrained in the tower overhead vapor stream. When the tower overhead vapor stream goes to a knockout drum (e.g., absorbers), or to the bottom of another tower, this entrainment can be recognized as buildup or rapid rise of a liquid level in the drum or bottom of the downstream tower. In most distillation towers, the overhead vapor stream goes to a condenser, and from there to a reflux drum. The reflux drum level control usually manipulates either the distillate rate (Figure 2.11a) or the reflux rate (Figure 2.11b). Figure 2.11 Typical distillation column overhead systems (a) reflux drum level control connected to the distillate valve (b) reflux drum level control connected to the reflux valve. (From Kister, H. Z., “Practical Distillation Technology,” Course Manual. Copyright © 2013. Reprinted with permission.) When the drum level manipulates the distillate rate (Figure 2.11a), the entrainment rise is often indicated as a significant increase in distillate rate for no apparent reason. When the drum level manipulates the reflux rate (Figure 2.11b), the entrainment is often indicated as an increase in reflux for no corresponding increase in boilup rate. The flooding prevents most of the increased reflux from descending down the tower, so it entrains back into the tower overhead, further increasing the drum level and reflux rate. The reflux flow meter reads high and the reflux valve often opens widely due to the recirculation of entrainment around the tower overhead loop. Alternatively, the entrainment is often indicated as a rise in reflux flow rate that does not raise the heat input required to maintain the same tower temperatures. In one case (280), the primary flood symptom was a normal reflux rate even though the boilup rate was extremely low. In some cases, as in many refinery fractionators, tower overhead temperature (instead of drum level) manipulates the reflux rate (Figure 2.12). Upon flooding, entrainment from the top raises the heavies content of the tower overhead, and therefore the overhead temperature. The temperature controller raises reflux. The flooding prevents the increased reflux from descending down the tower, so it entrains back into the overhead, further increasing the overhead temperature. Here too, the reflux flow meter reads high, and the reflux valve often opens widely due to the recirculation of entrainment around the tower overhead loop (upper operating chart in Figure 2.12). Alternatively and less frequently, with highly subcooled refluxes, the cold reflux entrainment reduces the tower overhead temperature, and the controller cuts back reflux, which in turn heats up the overhead, causing the controller to increase reflux. In this case, the entrainment rise shows up as temperature and reflux flow rate fluctuations (lower operating chart in Figure 2.12). Figure 2.12 Typical refinery fractionator distillation column overhead with top temperature controlling reflux flow rate. Operating charts show the different responses that have been experienced upon top section flooding. (From Kister, H. Z., “Practical Distillation Technology,” Course Workbook. Copyright © Henry Z. Kister. Reprinted with permission.) The entrainment from the tower overhead may overwhelm the condenser gravity drain lines, which are generally sized for the normal process flow rate (reflux plus distillate) and not for the massive entrainment incurred by flooding. Unable to drain, the entrained liquid builds up in the condenser, partially flooding it, thus reducing the area available for condensation. This in turn causes the column pressure to rise. Pressure differential builds up between the column and reflux drum, and eventually becomes large enough to quickly push and empty the liquid out of the condenser. The area available for condensation quickly rises, and with it the condensation rate, causing the tower pressure to dive. Following the fast liquid-emptying step, drainage from the condenser returns to a gravity mode, liquid accumulates, and the process repeats. The end result is severe pressure fluctuations in the tower, which can be as high as 7 psi in a few minutes. So a scenario of steady tower pressure breaking into severe fluctuations is often a symptom of flooding near the top with the entrainment interacting with the condenser drainage. The rapid rise in entrainment indicator is particularly useful when flooding occurs near the top. However, this indicator will fail to indicate a stripping section flood that does not propagate to the rectifying section. Loss of Separation As flooding approaches, the amount of liquid entrained by the vapor sharply rises. At high pressures and/or high liquid rates, the amount of vapor entrained in the downflowing liquid also rises. As either type of entrainment rapidly escalates in the vicinity of the flood point, efficiency and separation decline (Figure 2.13). The decline in efficiency tends to occur closer to the flood point with downcomer floods than with entrainment floods. In Figure 2.13, the limiting mechanism for the isobutane–normal butane system is believed (513) to have been downcomer flood, while that for the cyclohexane–heptane system was entrainment flood. In packed towers, the decline in efficiency tends to take place closer to the flood point with smaller packings than with larger packings. With large packings (e.g., 2 in. or larger random packings, and of surface area per unit volume below 60 ft2/ft3 for structured packings), and/or under vacuum, the decline in efficiency may begin at rates well below the hydraulic flood point. Figure 2.13 Overall tray efficiency, four foot ID tower, at total reflux, illustrating drop of efficiency as the flood point is approached and also at low loads. (Reprinted with permission from Yanagi, T., and M. Sakata, Industrial and Engineering Chemistry Process Design and Development, 21, p. 712. Copyright (1982) American Chemical Society.) Since loss of separation starts before the tower is hydraulically flooded, using it gives a lower flood point than other indicators. This is hardly a disadvantage, because the point at which separation begins to rapidly deteriorate is of greater practical importance than the hydraulic flood point. The point at which the separation begins to deteriorate is often referred to as “the maximum useful capacity,” or “maximum operational capacity,” and the vapor loads at which it occurs are typically about 0–20% below the hydraulic flood point. In most atmospheric and superatmospheric tray towers, this point occurs at flow rates of 5% or less below the hydraulic flood point. The loss of separation is usually inferred from laboratory analyses of column products. A plot of tray or packing efficiency (Figure 2.13) against flow rate at a constant reflux ratio can identify the point where the separation begins to deteriorate as flood is approached. The tower temperature profile is an alternative indicator of the loss of separation. Temperature often rises above the flooded region because the accumulating liquid rising from below is richer in heavies, and also because the flooded region no longer performs an efficient separation. Temperature may also rise below the flooded region because the smaller amount of liquid downflowing from the flooded region leads to heating up below, and also because the higher pressure drop raises the boiling points below. A good knowledge of the normal and flooded temperature profiles under similar feed conditions is invaluable for the successful application of temperature profiles for flood indication. Figure 2.14 shows temperature profiles under normal and flooded conditions (231). The points are pyrometer measurements of wall temperatures taken from the access ladder of an uninsulated tower. All the temperatures are for the even-numbered trays, as the ladder was on the left side of the tower in Figure 2.14, and the side downcomers obscured the odd-numbered trays. The crosses represent the normal temperature profile, showing a discrete reduction in temperature every two trays as one ascends the tower. The circles represent the temperature profile when the bottom three to four trays were flooded. The temperature spread across the bottom four trays completely disappeared, indicating loss of separation. The circles also show hotter temperatures above, due to movement of heavier components up induced by the poor separation on the bottom three to four trays. A similar application of wall-measured temperature profiles to successfully identify flood was reported by Lieberman (284). Figure 2.14 Flooded and unflooded tower temperature profiles. The flooded trays are 7-10 in the high-rate test. Temperatures measured by surface pyrometers. (From Kister, H. Z., K. F. Larson, J. M. Burke, R. J. Callejas, and F. Dunbar, “Troubleshooting a Water Quench Tower,” Proceedings of the 7th Annual Ethylene Producers Conference, Houston, Texas, March 1995. Reprinted with permission. Copyright © American Institute of Chemical Engineers (AIChE).) Section 2.9.1 presents an example of a packed tower under deep vacuum in which neither the pressure drop nor gamma scans provided conclusive evidence for flooding. It was the loss of temperature spreads in the packed bed that provided the conclusive flooding diagnosis. A shortcut for the Figure 2.14 procedure is to look at the differential between two suitable temperatures in the relevant tower section. For instance, in the tower in Figure 2.14, the normal temperature difference between tray 10 and tray 6 was (140 − 108) = 32 °F. Upon flooding, this temperature difference fell to (147 − 137) = 10 °F. A differential temperature indicator between trays 10 and 6 will indicate the onset of flood. It is important to select the correct trays in this procedure. For instance, the temperature differential between trays 6 and 4 in Figure 2.14 will be a poor indicator of flood. A flood-detection method using temperature differentials changing with time was proposed by Dzyacky et al. (91, 92). Generally, temperature differentials change faster than differential pressure and can give an earlier detection of the onset of flood. Caution must be exercised with temperature profile interpretation, because unchanging temperatures may also indicate a “pinch” condition (i.e., poor separation due to insufficient reflux or reboil). In order to tell the difference, reflux and reboil can be raised. If this improves separation, pinching is indicated. If this worsens separation, or does not affect it, flooding is indicated. Other flood symptoms can help the interpretation. In one tower (24), flood was noted by a rise in pressure drop, but the separation stayed good. Reducing reflux got the tower out of flood, but the separation deteriorated. The tower had more trays than needed and operated near a pinch, so its separation was unaffected by the loss of stages upon flooding but deteriorated when reflux was cut. Caution is also required when interpreting packed tower temperature profiles, as it may be difficult to distinguish poor separation due to vapor or liquid maldistribution from one due to flooding. Again, tests of raising reflux and reboil can shed light. If separation improves, it will argue against flooding. In order to reliably establish the column temperature profile, a large number of temperature measurement points is needed. If unavailable, a vertical temperature survey can be conducted. Temperature surveys are discussed in detail in Chapter 7. Temperature profiles provide an effective, low-cost method of detecting flood, but its success depends on the existence of a large enough number of measurement points and on the tower having a large enough temperature gradient under normal operating conditions. If the normal temperature difference from tray to tray is small, as in close separations, the flooded temperature profile does not vary significantly from the normal profile, and temperature profiles will be poor indicators of flooding. Gamma Scanning Gamma scanning is one of the best techniques for detecting flood. It is powerful for diagnosing flood, identifying flooded regions, and gaining insight into the nature of the flood. A detailed discussion is in Chapters 5 and 6. Bleeders Use of vapor bleeders was found effective for flood testing (187) in atmospheric and pressure towers. Each bleeder is located in the vapor space above a tray, or more frequently in the overhead line upstream of the condenser. Upon bleeder opening, only vapor coming out indicates no flooding; liquid spraying out indicates flooding. When the tower is above its atmospheric boiling point, bleeding flashes and chills the liquid. The presence of liquid in the bleeder can therefore be detected as a sharp temperature drop of gas issuing from the bleeder (187), or “weeping” or icing up downstream of the bleeder. The bleeder technique is not very popular and is often hazardous or environmentally unacceptable. Other disadvantages are a shortage or lack of valved bleed points inside the tower, the need to know which trays are most likely to flood, and a lack of indication of an approaching flood condition. Of its few applications, most are bleeders in tower overhead lines that discharge into closed systems. Sight Glasses (Viewing Ports) These provide superb visual indication of flooding (187, 192). Sight glasses are expensive, increase the leakage potential, and upon glass breakage may lead to a chemical release. Supplying a light source that permits adequate viewing can also be an issue. For these reasons, this technique is uncommon in commercial towers, mainly used for towers that process nonhazardous materials at near ambient pressure. Noise Increase This technique was demonstrated in a pilot packed column at the Separation Research facility at the University of Austin, Texas, but not commercially. A sharp increase in the noise signal from the packing indicates the onset of flooding (365), remaining high when the packing is flooded. This is analogous to the fizzling noise of a carbonated drink. Pattern Recognition In many cases, as flood is approached, certain variables were observed to oscillate in a brief, repeatable, systematic pattern (91, 92). For example, liquid inventories on trays rise momentarily, resulting in a temporary decrease of the bottom level simultaneously with a temporary increase in the tower dP, or the onset of erratic movement of either or both. Since prior to flood these variables remained within the normal operating limits, it may be difficult to recognize the pattern from observing the operating charts. In contrast, it was reported (91, 92) that this pattern can be readily recognized empirically using first and second derivatives with time, which change a lot more than the variables. Operators often have expertise in identifying such patterns, and should be consulted. This field-tested pattern recognition technique can provide early detection of flood and permit tower operation closer to the flood limit (91, 92). In a troubleshooting investigation, there are usually many theories. The troubleshooter’s challenge is to reject invalid theories and to narrow down the remaining theories to a manageable number that can be catered for. With flooding, one of the best methods of invalidating incorrect theories is by field tests that determine whether the flood is sensitive to vapor, liquid, or both. For instance, when the test proves the flood to be sensitive to vapor but not to liquid, any theory that argues a liquid-sensitive flood is invalidated. In the author’s experience, good vapor and liquid sensitivity tests discard about half the theories. In one case (Section 9.2.2), vapor and liquid sensitivity tests invalidated 7 out of 12 theories, reducing the number of theories from 12 to 5, a much more manageable number, and later led to the root cause. In another case (385), vapor and liquid sensitivity tests ruled out a theory that was considered a certainty, thus preventing an incorrect diagnosis and ineffective solution. The flood mechanism discussion in Section 2.2 teaches that entrainment (jet) floods, packing vapor-rich floods, and system limit floods are induced by excessive vapor loads and are therefore highly vapor-sensitive. If there is any sensitivity of these floods to liquid loads, it is small. To this list, Sections 2.11 and 2.12 will add downcomer unsealing flood and flood induced by channeling. In contrast, downcomer choke floods and downcomer side draw bottlenecks (Section 2.15) are caused by excessive liquid loads, and therefore are highly liquid-sensitive. If there is any sensitivity to vapor loads, it is small. Packing liquid-rich floods, and floods due to packing distributor overflows, are caused by excessive liquid loads and are therefore highly liquid-sensitive. However, they can show significant sensitivity to vapor loads as well. Downcomer backup flood can be induced by either excessive vapor load or excessive liquid load and can be sensitive to either, depending on the dominant term causing the backup. The example in Table 2.1 and Section 2.3 had the dry vapor pressure drop as the dominant term, so the downcomer backup flood was a vapor flood. Section 2.5 describes common flood test procedures. The most popular of these starts with the tower in normal operation. In the tower in Figure 2.4, reflux is gradually increased until symptoms of flood are observed. This test cannot tell whether the flood is vapor-sensitive, liquid-sensitive, or both. The increase in reflux rate raises the liquid load, but at the same time, it also cools the tower. The temperature controller responds to the cooling by increasing boilup, thus raising the tower vapor load. It is impossible to tell whether the observed flood is due to the initial increase in reflux (therefore, liquid-sensitive), the subsequent increase in boilup (therefore, vapor-sensitive), or due to both. To determine the flood sensitivity to vapor and liquid, the temperature control needs to be disconnected, so the boilup is kept constant (on flow control or in manual). The reflux is raised. If the tower floods, the flood is liquid-sensitive. An issue with this test is that since reflux is raised without a matching increase in boilup, lights are induced into the bottom product, making it off-spec. Similarly, for a vapor-sensitivity test, the reflux is kept constant (in Figure 2.4, it is on flow control, and therefore already constant) and the boilup is raised. In this test, the temperature controller can be kept in auto and the temperature set point is raised. Flooding in this test is vapor-sensitive. This test induces heavies into the top product and makes it off-spec. The good news is that these tests yield quick results; if correctly performed, each test normally will provide the answer within two to three hours. Once both the vapor and liquid sensitivity tests are performed, all the theories are checked against their findings, and those that do not predict the observed sensitivities are invalidated and crossed off the troubleshooting list. There may be other tests that can be useful for testing theories. The key is to test them by changing one variable at a time in the correct direction. In one case (237), a theory postulated that an observed tower instability was caused by losing the downcomer seal. To test it, the tower was set at stable operation, and the liquid flow rate was reduced without changing the vapor flow rate. Neither flood nor instability resulted, invalidating this theory. Overall, the trick for sensitivity tests is to monitor the response of the tower to changing one variable at a time in the correct direction. This extension is mainly applicable to refinery complex fractionators, although it may apply to other complex towers with side draws and heat addition/removal. The trick is the same as in simple sensitivity tests: in one test raise the liquid rate without changing the vapor rate, and in the other raise the vapor rate without changing the liquid rate. Figure 2.15 shows a typical refinery fractionator with naphtha top product, kerosene and diesel side draws, and residue bottom product. There are two pumparounds (PAs), mid-PA (MPA) and bottom PA (BPA), which are direct-contact heat-removal sections. Tray liquid is drawn from the tower, cooled, and returned to the tower a few trays up. Direct-contact condensation of part of the tower vapor by the cooled streams generates most of the reflux to the section below and some of the product. In the example used here, there appears to be a flood bottleneck between the kerosene and diesel draw. It is desired to determine whether the flood is liquid- or vapor-sensitive. For the liquid sensitivity test (Figure 2.15a), the liquid rate below the kerosene draw needs to be raised without affecting the vapor flow rate in this section. Either cutting the kerosene draw rate or increasing the MPA duty will increase the liquid flow rate into the section below. The higher liquid rate should be prevented from continuing below the diesel draw, as changes there may unpredictably affect the vapor flow up the tower. For this reason, the additional liquid rate needs to be drawn as diesel product. Just like in simple sensitivity tests, the liquid sensitivity test here will induce lights (kerosene components) into the diesel product. To keep the vapor rate in the kerosene–diesel separation section constant, the heater and the BPA heat duties need to be kept constant. Keeping the BPA duty constant can be challenging, because letting some kerosene into the diesel product will cool the BPA draw temperature, which will tend to reduce the BPA heat duty. If the BPA duty is allowed to drop, the vapor rate in the section above will increase, which will defeat the test. It is therefore imperative to closely monitor the BPA duty and counter any tendency to fall off (e.g., by closing exchanger bypasses). Figure 2.15 Liquid and vapor sensitivity test in a refinery fractionator (a) liquid sensitivity (b) vapor sensitivity. For the vapor sensitivity test (Figure 2.15b), the vapor rate above the diesel draw needs to be raised without affecting the liquid flow rate in this section. Either cutting the BPA duty or raising the heater duty will increase the vapor flow rate into the section above the BPA. Generally, the BPA duty cut is preferred because raising the heater duty may cause adverse changes below the diesel draw. The additional vapor needs to be condensed either by increasing the MPA duty (preferred, as it will minimize impact on the section above) or by raising the overhead condenser duty. To keep the liquid rate in the kerosene–diesel separation section constant, the diesel product flow rate needs to be kept constant. As more vapor will be condensed at the MPA or overhead condenser, this additional condensate needs to be removed and not allowed to reflux below the kerosene draw. This means increasing the kerosene draw rate and, in some cases, the naphtha draw rate. Just like in simple sensitivity tests, the vapor sensitivity test here will induce heavies (diesel components) into the kerosene product. Section 9.2.5 presents a case study in which vapor and liquid sensitivity tests were extensively used and turned invaluable in determining the location and nature of a fractionator flood. Other such cases are described in Refs. 18, 52, 129, and 180. Pressure drop in a column is usually sensitive to only three factors: vapor load, liquid accumulation (flooding), and abnormalities like plugging or damage. It follows that a plot of dP against the vapor load, similar to those in Figures 2.5 and 2.6, can decouple the effect of vapor load on the dP from that of liquid accumulation. If this plot is generated at different times during the run, it can also decouple the effect of plugging and damage on the dP. It is important to note that while the dP depends on the liquid load, it is not sensitive to the liquid load. The dP depends on the liquid load via the liquid head on the tray. The liquid head equals the weir height plus the head over the weir (34, 193, 245, 451, 492). The weir height is independent of the liquid load, while the head over the weir is only dependent on the liquid load to the 2/3 according to the Francis weir formula (34, 193, 245, 451, 492). Overall, the dependence of the dP on the liquid load is generally very weak. In contrast, the friction (dry) pressure drop, which typically makes up about a third to two-thirds of the total pressure drop, is proportional to the square of the vapor load, making the total pressure drop sensitive to the vapor load. Similarly, the dP in packed towers in the vapor-rich regime is insensitive to the liquid load (34, 193, 245). In this regime, the liquid occupies only a small portion of the bed volume, so its effect on the pressure drop is small. In the liquid-rich regime, the pressure drop becomes sensitive to the liquid load. Criteria for the regime are presented in Section 2.16. In each plot, the measured dP should be plotted against the characteristic vapor flow rate as derived from plant data. For the top section of a simple column, the vapor flow rate equals the sum of the reflux and distillate meters (as in Figure 2.5) plus any vent gas. For subcooled refluxes, the vapor condensed by the subcooling should be added. In the bottom of the tower, the reboiler duty or steam meter gives a measure of the characteristic vapor load. Figure 2.16 shows two applications of this technique. Figure 2.16a, derived from actual plant data, positively affirmed flooding at a steam flow rate of about 60 klb/h. Here, the flood correlated with the steam flow rate. Figure 2.16b is for one C3 Splitter tower (242). In this tower the pressure drop was low, about 0.09 psi per tray, which argued against flood per the guidelines in Section 2.6, but gamma scans showed many flooded trays. To reconcile the two conflicting observations, the measured tower pressure drop was plotted against the tower internal vapor flow rate (Figure 2.16b) calculated from the plant meters. The upper curve is the dP for the entire tower, and the lower curve is the dP for the rectifying section. Both curves show a point of inflection at vapor flow rate just above 2000 MPH. This affirmed that at this operating vapor load, the trays were right at incipient flooding. While some flooding could have started earlier (as seen by the gamma scans), the significant accumulation of liquid (the dP rise) started above this load. Mystery explained. Figure 2.17 shows how dP versus vapor rate plots can track the condition of the tower internals. A reference dP versus vapor load plot is prepared from plant data in the first month or so after the tower returns to service following a turnaround in which the trays were cleaned. During this period the internals are usually clean and non-corroded. If flooding in the tower is due to plugging, the reference curve may show no point of inflection and no flooding. If after a year or two in operation a point of inflection appears, or occurs at lower vapor loads (Figure 2.17a), plugging is indicated. If only a few trays are plugged, or if the plugging is in the downcomers and not the trays, the pressure drops below the point of inflection (at the lower vapor loads) will stay the same as in the reference curve. A vapor load at the point of inflection that gradually declines (moves to the left in Figure 2.17a) over a period of time indicates plugging worsening with time. Figure 2.16 Application of plots of pressure drop versus vapor flow rate to identify floods (a) to affirm flood (b) to reconcile two conflicting observations. (Part (b): From Kister, H. Z., B. Clancy-Jundt, and R. Miller, PTQ, Q4, p. 97, 2014. Reprinted with permission.) Figure 2.17 Use of dP logs to diagnose tower problems (a) plugged downcomer, or a few plugged trays (b) many plugged trays (c) missing or corroded trays. (From Kister, H. Z., “Practical Distillation Technology,” course workbook. Copyright © Henry Z. Kister. Reprinted with permission.) The vapor load at which the point of inflection occurs does not indicate how many trays are plugged, but how badly the trays or packings are plugged. It is enough to have one badly plugged tray to lower the point of inflection severely. If the pressure drops below the point of inflection also rise (e.g., Figure 2.17b), or the slope at the lower vapor loads increases, it is likely that many trays are plugged. Figure 2.17c shows a scenario in which damage occurred, either due to dislodged trays or due to corroded trays or packings. When plotting dP versus vapor rates over lengthy periods, watch out for dP recalibrations. Audit the dP measurement over the period, looking for zero dPs, which would indicate recalibrations. Then compare the dP versus vapor rate curves before and after. Most of the time a recalibration will only give a small bump, but there are other times when it needs to be taken into account. In one tower, flooding was observed after six months of operation. According to the vendor hydraulic calculations, the flooding should not have occurred. The question was whether the trays were plugged or the vendor calculations were optimistic. Figure 2.18a plots the dP against the vapor load in the top of the tower and does not show a clear point of inflection. Plotting the pressure drop against the reboiler duty (Figure 2.18b) gave a much better correlation, suggesting the limit was below the feed. The point of inflection occurred at a reboiler duty of 16 units, which was well above the duties used in the first three months of reference period. Therefore, this plot could not tell whether the limit was plugging or a tray limit. Plotting additional data over the next year showed that the limit did not change, suggesting that plugging was not the issue. Figure 2.18 Application of plots of pressure drop versus vapor flow rate to identify flood nature and location (a) x-axis is the overhead vapor rate (b) x-axis is the reboiler duty. Figure 2.19 (226) shows application of this technique to track changes throughout the run of the top fractionation section of a refinery crude fractionator equipped with moving valve trays. In the winter through summer of 2016, no flooding was observed. In the spring of 2016, the section experienced severe corrosion. In early autumn 2016, the dP shot up, indicating flooding, probably due to corrosion products and popped-out valve floats plugging trays. By the winter of 2016–2017, the dP came down. This was because the corrosion products and the remnants of the popped valve floats were washed away or disappeared due to corrosion. The dP versus vapor load plot enabled tracking this sequence of events, and by doing so, explaining a mystery as discussed in detail elsewhere (226). Figure 2.20 (265) plots the dP of a condensate stripper column against the feed rate. The feed rate is usually not a good representation of the vapor load in the tower and is therefore not the ideal variable to plot on the x-axis. In this case, however, the tower vapor rate varied with the condensate feed rate, making the feed rate a reasonable representation of the vapor traffic. The plot shows high dP at multiple vapor loads and erratic dP rises before the turnaround (TAR). This indicates premature and erratic flood, arguing against a natural flood limit. In this case, the flood was due to foaming combined with a point of transition issue (Section 8.7, Figure 8.7). Foam-flooding (Section 2.10) often gives similar plots. Note the post-TAR curve, after the bottleneck was eliminated showing no flood anywhere. A plot similar to the pre-TAR curve was produced by Kumar et al. (266) in a C2 Splitter tower due to intermittent hydrates (similar to freeze-ups) that caused premature flooding. Figure 2.19 Application of pressure drop versus vapor flow rate plot to track changes in tower performance during the run. (From Kister, H. Z., and M. Olsson, Chemical Engineering, p. 29, January 2019. Reprinted with permission.) Figure 2.20 Application of pressure drop versus vapor flow rate plot to a tower experiencing erratic premature flooding due to foaming and a point of transition issue (Contributed courtesy of Timothy Zygula P.E., BASF Petrochemicals). In Figure 2.21, a pressure drop versus vapor flow plot was applied to diagnose the root cause of separation fall-off in a packed tower. Over the preceding six months, tower feed flow rate dropped by 10% for the same reflux, steam rate, and product purity. There were several theories on the table, including plugged packings, onset of packed bed foaming, and deterioration of liquid distribution. Figure 2.21 Application of plots of pressure drop versus vapor flow rate to diagnose poor performance in a packed vacuum tower. (From Kister, H. Z., “Practical Distillation Technology,” course workbook. Copyright © Henry Z. Kister. Reprinted with permission.) The large circles in Figure 2.21 are measurements before the performance deterioration, and the small circles after. Figure 2.21 shows the before and after values to fall on the same curve, invalidating the plugged packings or onset of foaming theories. Had any of these occurred, the recent points would have lied at higher dP’s than the older points. This left distributor plugging the most likely theory. Distributor plugging (with no liquid overflow) will not lead to higher pressure drop but would maldistribute the liquid, causing separation issues, which were countered by increasing the reflux-to-feed and stripping-to-feed ratios to keep the same product purity. A somewhat similar observation led Lenfeld and Buttridge (281) to state “Drop in column efficiency before there is any noticeable increase in column pressure drop is a sign that the root cause is the liquid distributors rather than the packings.” The rise in pressure drop discussed in Sections 2.6 and 2.8 is caused by liquid accumulation in the tower. When this accumulation is small, or when it does not interfere much with the vapor rise, the pressure drop rise can be small, even unnoticeable. Flooding Near the Top of the Tower A small pressure drop rise, often of the order of 0.3–0.5 psi, is typical when the flooding occurs near the top of a tower. Since only one or very few trays flood, the liquid accumulation is not high, which incurs only a small pressure drop rise. When the tower dP is 3–4 psi, a small dP rise of 0.3–0.5 psi remains indistinguishable from the general noise in the dP measurement. Figure 2.22 shows actual operating charts, with Figure 2.22a being the most common. The chart in Figure 2.22b is from a tray tower in Figure 2.4 with vapor flood at the top. An increase in vapor rate generates flood (the vertical rise in dP). Once liquid accumulates at the top, the liquid downflow drops, and the control temperature rises. The controller cuts back on boilup, reducing vapor upflow, and the upper trays gradually unflood (the sloped downward trend in dP). The unflooding re-instates the normal liquid downflow, the control temperature declines, increasing boilup, and the flood returns (the vertical rise in dP). The typical cycle amplitude is about 0.3–0.5 psi with a period of three to five minutes. The ability of the dP versus vapor rate plot (as described in Section 2.8) to decouple the dP changes due to flooding from regular dP changes makes this plot invaluable for diagnosing flooding near the top of the tower. One 20-trays high-pressure (200 psig) hydrocarbon absorber in foaming service experienced premature flooding at about 67% of the design lean oil rate. Flooding was identified by liquid carryover from the tower top to the knockout drum downstream. The drum normally operated with no liquid in it. The plant always identified flooding by the appearance of a liquid level in the drum. When the operators were asked whether they saw a high dP upon flooding, their answer was “Never. The tower operates with 2 psi pressure drop both under normal and flooded conditions.” Figure 2.22 Typical operating charts for flood near the top of a tower (a) most common, a small rise in pressure drop (b) column swings in and out of flood. (From Kister, H. Z., “Practical Distillation Technology,” course workbook. Copyright © Henry Z. Kister. Reprinted with permission.) Figure 2.23 plots data collected over a two-month operating period. The hollow circles are periods of four hours or longer in which there was no liquid level in the drum, i.e., definite no-floods. The filled circles are periods of four hours or longer in which there was continuous level in the drum, i.e., definite floods. The points fall on two distinct lines, with the difference between them being 3 in. of water (0.11 psi) pressure drop. So the dP versus vapor load curve was sensitive enough to identify such a small pressure drop change. Figure 2.23 Pressure drop versus gas rate data collected over two months for hydrocarbon absorber. Hollow circles, no liquid in downstream knockout drum, filled circles, >4 hours of liquid level in drum. (From Kister, H. Z., “Practical Distillation Technology,” course workbook. Copyright © Henry Z. Kister. Reprinted with permission.) An interesting feature of Figure 2.23 is absence of a point of inflection like in Figures 2.5 and 2.16–2.19. The absence of a point of inflection indicates a flood that is insensitive to vapor load, i.e., a liquid flood. Indeed, in this case it was a downcomer choke flood. Channeling Allows Liquid Accumulation Without Interfering with Vapor Rise Another situation where a tower floods with little or no pressure drop rise is when channeling occurs, and the channeling permits vapor to rise, bypassing the liquid accumulation. This sometimes occurs in packed vacuum towers. One such case is described in detail in Section 2.9.1. In another vacuum tower (65), a CAT scan (Section 6.4) showed that upon flooding a bed of structured packings, liquid accumulated along the periphery, allowing vapor to channel through the center. Grobenrichter and Stichlmair (142) studied pressure drop rise due to crystallization of salt by passing dry air through saturated aqueous solutions in a 6-in. column. With wire gauze packings, there was always a large pressure drop increase due to liquid accumulation. With corrugated sheet packings, the pressure drop rise was high at higher liquid rates, but much smaller at low liquid loads (<12 gpm/ft2 in their tests), suggesting vapor channeling around zones of local flooding. A similar scenario may also occur in tray towers. In the tower described in Section 2.8 (Figure 2.19), after the popped-out valve floats disappeared, the pressure drop came down (the winter 2016–2017 curve). However, the flood experienced earlier (the early autumn 2016 curve) did not go away, as evidenced by gamma scans and off-spec products. Popping out the valve floats induced vapor channeling, which generated a rise path for the vapor without incurring a high pressure drop. A similar experience of flooding without pressure drop rise was reported (226) in a chemical column whose manways were left uninstalled at a turnaround, allowing vapor to channel through the open spaces. The bottom section of a chemical deep-vacuum tower had two beds containing high-efficiency structured packings, with a vapor side draw between. Above the feed, there was another packed bed. The problem experienced was that the side draw product had excessive concentration of the heavy key component. The tower was operated at about 60% of flood. To gain insight into the bed hydraulics, the reboiler duty and reflux rates were raised, and the pressure drop versus vapor load (represented as the C-factor, Eq. 2.1) plot for the test was constructed (Figure 2.24a). The C-factor was highest in the bottom section, became lower above the side draw, and stayed uniform above that. The hollow circles in Figure 2.24a are pressure drops measured across the bottom bed. The filled circles are the pressure drops measured across the two upper beds. The rate of pressure drop rise with C-factor was the same for both, which is not surprising since all beds contained the same packings. This, however, suggests lack of large-scale plugging in the beds, because such plugging would have affected one bed more than the others, and the difference would show on the plot. This is one theory put to rest. The plot shows neither a point of inflection nor a sharp rise in pressure drop, giving no indication of flood. The diagram also shows a comparison to calculated values. Pressure drops were somewhat higher than calculated, but tracked the calculated values quite well. The Kister and Gill equation (2.2) predicted flood at a pressure drop of 1 in. of water per foot of packing for this packing. In Figure 2.24a, this pressure drop was measured in the bottom section at a C-factor of 0.37 ft/s. The pressure drop calculation gave a slightly higher C-factor of 0.4 ft/s. However, Figure 2.24a showed that the 1 in./ft pressure drop was exceeded still without any sharp rise in pressure drop. Figure 2.24 Data analysis to diagnose flood in a packed deep vacuum tower (a) application of a plot of pressure drop versus vapor flow rate (b) loss of temperature spreads near the bottom of the bottom bed at C-factor of 0.36 ft/s, indicating the onset of flood. (From Kister, H. Z., R. Rhoad, and K. A. Hoyt, Chemical Engineering Progress, p. 36, September 1996. Reprinted Courtesy of Chemical Engineering Progress (CEP). Copyright © American Institute of Chemical Engineers (AIChE).) Gamma scans were shot and are described in detail in Section 5.5.15. At C-factors just above 0.36 ft/s and at 0.3 ft/s, the scans showed good liquid distribution throughout the bottom bed except for the lowest 2 ft or so. In these bottom 2 ft, the distribution was good in the 0.3 ft/s scan, but maldistribution occurred in the 0.36 ft/s scan, with two of the four chords shot showing possible accumulation. This suggested channeling that permits vapor rise to bypass the liquid accumulation. Figure 2.24b is a plot of the temperature profile of the bottom bed against the C-factor. There was a good temperature spread at the lowest C-factors. Raising vapor and liquid loads reduced the temperature spreads, indicating lower packing efficiency. This behavior is experienced with wire gauze packings, like the packings in this bed (193). At a C-factor of about 0.36 ft/s, the “near bottoms” temperature abruptly shot up, becoming the same as the bottom temperature, indicating loss of separation between the two points. The packing efficiency sharply dropped in this region. This coincided with the point where the accumulation in the bottom 2 ft was seen on the gamma scans and when the flood pressure drop from Eq. (2.2) was measured. The efficiency drop was due to the channeling or entrainment induced by the liquid accumulation. Overall, the test showed that the flood occurred where expected, and at the low operating C-factor of 0.3 ft/s or less, hydraulic issues were unlikely to have caused the high impurity issue. Further testing showed that the separation issue was due to a very non-forgiving concentration profile (232). Flooding in PA beds can be difficult to diagnose. Being typically used as direct-contact condensers, these have high vapor loads at the bottom of the bed, tapering as one travels up the bed. So the bed may flood at the bottom, but the flood may not propagate past a certain height. Often, flooding may lead to the formation of some stable channeled pattern in the PA bed. Reference 21, a case study of flooding near the top of a refinery atmospheric crude fractionator, gives an excellent description of symptoms typical of PA bed flooding. Operation of the top PA bed (shown in Figure 2.8) was stable, with a pressure drop of 0.16 psi across 9 ft of structured packings (the measurement in Ref. 21, 0.22 psi, includes 0.06 psi in the overhead nozzle) compared to 0.17 that the author calculates from Eq. (2.2). This suggests operation near flood, as at the operating rates the pressure drop should have been significantly less (21). When a PA bed mildly floods, liquid stacks up until there is enough head to push it down in a channeled mode. An equilibrium is established, with liquid stacking at one part of the bed and vapor channeling through another, giving a mild pressure drop rise. This channeled mode hurts heat transfer. This can be inferred from a reduced temperature difference between the PA liquid draw at the bottom of the bed and the vapor exiting from the bed. In the case study in Ref. 21, the difference was 10 °F for two years, where it should have been 25–35 °F had the bed not flooded. In this tower, the flooding initiated at the collector under the bed (Figure 2.8) due to plugging in its downcomers. When the rates through the tower were raised, the “upset conditions” described in Section 2.6 were initiated, in which the bed pressure drop swung between 0.24 and 1.75 psi, indicating the channeled mode transitioned into a “buildup and dump” mode. This mode indicated flooding coming from underneath. The dump takes place through the vapor openings of a collector or distributor, or through the open area of trays. The author is not aware of any PA beds experiencing the “buildup and dump” mode when the flood initiated in the bed itself, i.e., at the bottom layers of packing. A foam (Figure 2.25) forms when the films surrounding vapor bubbles are stabilized to resist gravity drainage. The stabilization could be provided by surface forces, surfactants, or by chemicals helping to form a gelatinous surface layer. The bubbles then persist without coalescence with one another, or without rupture into the vapor space. The lifespan of foams varies. A quickly breaking foam may take five seconds to break, and a moderately stable foam can last two to three minutes (122, 192). The science of foams is extensively discussed in the literature (e.g., Refs. 32, 39, 170, 192, 263, 299, 366, 402, 403, 496). Foams are generated during vapor–liquid contact, especially when the contact is turbulent. High-turbulence regions and impact of liquid jets on liquid surfaces promote foams. In tray towers, foams increase aeration in downcomers, leading to excessive froth backup in the downcomers. Foams also make vapor disengagement from the vapor–liquid mixture entering the downcomer more difficult, requiring lower velocities in the downcomers to disengage the vapor and vent it out. This is analogous to the lengthy draining of a washing machine (after stopping it) during the wash cycle compared to the quick draining during the rinse cycle. Compared to non-foaming systems, foams cause premature downcomer backup and/or downcomer choke flood. Usually foams do not bottleneck trays, they bottleneck downcomers. Figure 2.25 Foam in Structured Packing. (Courtesy of Prof. G. Wozny, TU Berlin.) In packed towers, foams cause premature floods as well. This is most severe in the liquid-rich regime. Random packings allow lateral movement of the foam bubbles, and therefore can handle foams well, even in the liquid-rich regime, but will still flood prematurely under foaming conditions. With structured packings, the corrugated sheets restrict the sideways movement of the bubbles, and also support and often stabilize the foam. The inter-layer channels are therefore prone to choking, some earlier than others, and premature flooding results, with greater severity in the liquid-rich regime. Symptoms A foam flood gives similar symptoms to other floods, namely high pressure drop, entrainment from the top of the tower, reduction in bottom flow rate, and poor separation. However, in addition, it may give one or more of the following symptoms: Where to Look for Foaming A survey of published case histories (198, 201) found foaming to be a service-specific phenomenon. Ethanolamine absorbers that absorb acid gases such as H2S and/or CO2 from predominantly hydrocarbon gases, and their regenerators, account for about one-third of the published cases. Another 10% were also in acid gas absorption/regeneration service, but using alternative solvents such as caustic, hot potassium carbonate (hot pot), and sulfinol. Another 10% were in absorbers of gasoline and LPG from hydrocarbon gases using hydrocarbon solvents. Case histories of foaming were also reported (198, 201) in each of the following services: Figure 2.26 Symptoms of foaming (a) a typical differential pressure chart, indicating foam-induced flooding; (b) non-reproducible flood data, indicating foaming; (c) effect of temperature on foam height. (From Bolles, W. L., Chemical Engineering Progress, 63(9), p. 48, 1967. Reprinted Courtesy of Chemical Engineering Progress (CEP). Copyright © American Institute of Chemical Engineers (AIChE).) There is a rich literature on experiences with foaming problems, with most of the pre-2006 reported cases described on pages 543–557 of Distillation Troubleshooting (201). The discussionbelow briefly describes some of the highlights. The reader troubleshooting a potential foaming problem is strongly encouraged to explore these experiences and see whether one or more can be beneficial to the problem at hand. In about a third of the reported cases (198, 201), suspended solids, corrosion products, or polymers catalyzed foaming. Although not specifically reported, solids could have catalyzed foaming in many of the other cases. The survey by Le Grange et al. (272–274) of 108 foaming incidents in ethanolamine absorber–regenerator systems found that half of them had foam promoting contaminants entering the plant with the feed. Good filtration can often alleviate, even mitigate the foaming, as described by many of the cases abstracted in Ref. 201 and detailed in Refs. 98, 100, and 316. However, solvents may react with the material used in filters, and the reaction products may cause foaming (15, 81, 341, 357). In ethanolamine service, or other alkaline absorber–regenerator systems, chemical analysis or coloration of the lean solvent showing a high solids or degradation product content indicates a high potential for foaming. Solids and degradation products catalyze foams. A qualitative guide correlating appearance with foaming tendency in ethanolamine solutions was presented by Lieberman (286). Engel (98, 100) provides an in-depth discussion of the various root causes of foaming in ethanolamine services. In many cases, the foaming was caused or catalyzed by an additive such as a corrosion inhibitor, in some cases in ppm concentrations. In one reported case (452), as well as many others experienced by the author, severe foaming occurred in amine or caustic absorbers due to a corrosion inhibitor contained in the steam condensate used for solution makeup. Another case was reported (516) of a heavy contaminant coming into the feed of an extractive distillation tower and causing foaming. The author is also familiar with a case where an anti-foulant induced foaming. Ross and Nishioka (403) found that the potential for foaming is maximized near the plait point (near the solubility limit), i.e., where a solution is still homogenous but is near the point of breaking into two liquid phases. Once the plait point is reached, and two phases are formed, one phase may serve as a foam inhibitor and destroy the foam. Alternatively, they may form a foaming emulsion. Hydrocarbon condensation into aqueous solutions (6, 81, 181, 273, 274, 331, 341, 452, 473), or small amount of water in a hydrocarbon system (Case 16.7 in Ref. 201, also Ref. 265, both Olefins condensate strippers), is known to promote foams. One refinery preflash tower (287) foam flooded because water was refluxed into the tower due to malfunction of the reflux drum boot. The flooding stopped when the boot again removed the water. A similar foam flood was experienced in a butyraldehyde column (469) due to refluxing small quantities of water; the problem was solved by adding a water-removal boot to the reflux drum. High pH stabilizes foaming emulsions. The author experienced foaming in one depentanizer and one de-isobutanizer, normally non-foaming services, when small quantities of caustic entered the towers. A foaming problem may occur in one installation but not in another even though both handle the same materials. Often a foaming problem remains “hidden” because a tower or downcomers are oversized, or may not occur in one installation because a surface-active impurity is absent. In one case (39), a new absorption unit experienced foaming while a similar older unit did not. This was because the older unit had oversized downcomers that adequately handled the foam. In another case (1), foaming was observed only after a capacity expansion. Tests by Senger and Wozney (422) showed that foaming with the same chemical system may proceed differently depending on the liquid flow rates and the packings Avoiding local high-turbulence regions may help prevent foaming. In one case (250), a tower foamed when the reflux entering via a downward elbow dropped 12 in. into a liquid pool behind an inlet weir (Figure 2.27a). A gamma scan showed foam on a few trays, but severe foaming only on the top tray. Extending the pipe into the pool (Figure 2.27b) eliminated the foaming. In another case (250), liquid to the regenerator of a hot pot absorber entered via a pipe distributor with holes pointing downwards into a sump behind an inlet weir (Figure 2.27c). Again, gamma scans showed foam on the top tray. To cure, the pipe was fitted with dip tubes that were submerged in the sump liquid (Figure 2.27d). There was no more foaming after this. Figure 2.27 Reflux entry into towers with foaming systems (a) dropping the reflux from a pipe 12 inches into a liquid pool produced tower foaming (b) extending the pipe into the pool eliminated the foaming (c) another foaming system, reflux introduced via a pipe distributor with holes pointing downwards into the pool, foaming produced (d) foaming eliminated by adding dip tubes that brought the reflux below the sump liquid level. (From Kister, H. Z., G. Jacobs, and A. A. Kister, Chemical Engineering Research Design, 191, p. 313, 2023. Reprinted Courtesy of IChemE.) In one amine absorber (223), a retray with low pressure drop trays led to channeling of the inlet gas jet to the region opposite the gas inlet nozzle, generating a high-gas velocity region, and the increased turbulence produced premature foam flood. Figures 2.28 and 2.29 show how increased gas velocities raise foam height and foam decay time in test equipment. Testing Foaming tests were reported in many literature sources (1, 32, 39, 79, 122, 192, 201, 225, 422, 438, 490, 516), and these have been applied with various degrees of success. Experience has shown (39, 122, 222) that when not performed under actual plant operating conditions, foam tests can be inconclusive. Generally, methods 3–7 below reproduce actual plant conditions, and at least one of them is often simple to set up. Common test methods include: Figure 2.28 Testing for foam (a) an apparatus for dispersing gas through a solution sample; (b) a typical foam height and decay time from the test apparatus; (c) an armored level glass technique. (Parts (a) and (b): From Glausser, W. E., Chemical Engineering Progress, 60(10), p. 67, 1964. Part (c): From Bolles, W. L., Chemical Engineering Progress, 63(9), p. 48, 1967. All Parts Reprinted Courtesy of Chemical Engineering Progress (CEP). Copyright © American Institute of Chemical Engineers (AIChE).) Figure 2.29 Foaming tests, antifoams screened and tested and a suitable one was found. (a) column feed 1.8 l/min, no antifoam, tall foam height; (b) column feed 2.1 l/min, 168 ppm antifoam medium foam height; (c) column feed 1.2 l/min, 61 ppm antifoam, low foam height; (d) an excellent result presentation as a plot of foam height versus gas velocity in apparatus, including results for a non-foaming substance (water) as reference. (Contributed Courtesy of Dr. Carine Saha Kuete Achoundong, Dr. Claudio Ribeiro, and Dr. Lihua Liu, BASF.) Figures 2.28b and 2.29 show how this method should be applied. For best results, the foam heights and decay times should be plotted against the superficial gas velocity. The test should first be performed on a non-foaming solution like demineralized water (blue dots in Figure 2.29d). The test is then repeated with the test solution (orange dots in Figure 2.29d). Different antifoam agents, at different concentrations, can then be tested (Figure 2.28b; yellow and dark brown dots in Figure 2.29d). When the tower responds to antifoam, these tests can help find the optimum agent and concentration, as described in one case (81), see also Figure 2.29. To rule out foaming, try a variety of agents and concentrations. It would be a good idea to experiment with them in the lab before injecting into the tower to determine what the best agents and concentrations are to try. If several agents and several concentrations have been tried and the tower has not responded, one can conclude that foaming is unlikely, as described in one case (225) and many other experiences by the author. In the abovementioned case, it was necessary to interrupt operation and perform the water test. In other cases, the trial requires no process interruption. The author is familiar with cases in which a steam condensate makeup was used for caustic or amine solutions, and foaming was experienced. Foaming disappeared within a few days after a trial in which demineralized water replaced the condensate makeup. In addition, there are tests that can help in specific circumstances: Figure 2.30 Inlet contamination foaming in an amine absorber (a) lean amine entering absorber, little foaming; (b) rich amine leaving absorber, severe foaming; (c) sample of liquids in the inlet line. (From Le Grange, P., M. Sheilan, and B. Spooner, “Why Amine Systems Fail in Sour Service”, Sulphur 368, p. 42, January–February 2017. Reprinted with permission.) Cures Three cures have been successful for foaming problems: eliminating the foam-causing chemical (e.g., by eliminating the additive or by filtering out the solids that catalyzed the foams), injecting antifoam, and debottlenecking downcomers (either by using larger downcomers, or by reducing downcomer backup, or by replacing trays by random packings). Injecting antifoam has not always been effective, and some experimentation with the inhibitor type and concentration are often required. These cures are discussed at length in Ref. 192. Cures specific to ethanolamine absorber–regenerator systems are discussed by Le Grange et al. (273, 274). The challenges of handling low liquid loads in tray towers are keeping the little liquid on the tray without drying up, and keeping the downcomers liquid-sealed (198). When a downcomer loses its liquid seal, vapor rises up through it and interferes with liquid descent. This interference has led to downcomer unsealing floods, capacity bottlenecks, poor separation, instability, and total inability to start towers up. On conventional trays, at liquid flow rates exceeding about 2–3 gpm/in. of outlet weir length, the outlet weir generates a pool of frothy liquid (Figure 2.31a). As long as the downcomer clearance is lower than the liquid head in the pool, this liquid pool will seal the downcomer. In this regime, liquid is the continuous phase and vapor is dispersed in the liquid. In contrast, at low liquid flow rates (below about 2–3 gpm/in. of outlet weir), and especially at high vapor velocities, there is a phase inversion. The vapor atomizes the tray liquid, forming a vapor-continuous dispersion known as the spray regime (190, 193) or drop regime. In this regime, there is no frothy pool, and the liquid is dispersed as atomized drops in the inter-tray vapor space (Figure 2.31b). The continuous vapor phase reaches the downcomer outlet. There is no static seal preventing vapor from rising up the downcomer. In the spray regime, the downcomers are prone to seal loss. Many high-capacity trays contain truncated downcomers, which terminate a few inches above the tray floor. These downcomers discharge their liquid through slots or holes at the bottom of the downcomers. Blowby (vapor breakthrough into downcomers, or downcomer seal breakage) is a major potential issue in truncated downcomers because they are not sealed by the tray liquid. Vapor breakthrough into truncated downcomers reverses tray action, inducing some liquid to weep through the trays and some vapor to channel up the downcomers. Severe blowby can lead to a sharp drop in tray efficiency. If the velocity of vapor rise in the truncated downcomer is high, it too can lead to downcomer seal flood similar to that described for the spray regime. Figure 2.32 illustrates how downcomer unsealing can initiate tower flood in the spray regime. Consider a tray with very little liquid on it. The vapor, looking for the easiest path, ascends through both the trays and downcomers (Figure 2.32a). Upon the introduction of liquid, some of it reaches the downcomer (Figure 2.32b). If the vapor velocity through the downcomer is too high, it will not allow the liquid to descend into the downcomer (Figure 2.32c). Unable to descend, the liquid will accumulate on the tray above. This will lead to flooding of the tray, with liquid carry over from the top of the tower (Figure 2.32d). A very similar mechanism occurs in high-capacity trays with truncated downcomers. An alternative scenario frequently occurs. The accumulating liquid head may lead to significant weeping. This weeping may then provide enough liquid to seal the downcomer on the tray below. Once this downcomer is sealed, there is nothing to stop the liquid from descending, and it will pour right down. This will propagate through the trays and dump into the tower bottom. Once the liquid pulse goes through, the downcomer becomes unsealed again, and the process repeats. The end result will be a sequence of liquid buildups and dumps, generating oscillations and instability. Operation personnel usually overcome this instability by increasing the liquid rate, so that the downcomer seal is not lost. Figure 2.31 Flow Patterns on trays (a) froth regime (liquid phase is continuous) (b) spray regime (gas phase is continuous). (From Henry Z. Kister, Chemical Engineering, September 8, 1980. Reprinted with permission.) Figure 2.32 Downcomer Unsealing Flood in the spray regime (a) vapor distributes between tray and downcomer; (b) liquid introduced, reaches the downcomer, attempts to descend; (c) when vapor velocity up the downcomer is too high, the vapor does not permit liquid descent; (d) unable to descend, liquid accumulates on the upper tray, generating flood. (From Kister, H. Z., “Practical Distillation Technology,” course workbook. Copyright © Henry Z. Kister. Reprinted with permission.) The phenomenon of vapor in the downcomer impeding the liquid descent is similar to that of the system limit discussed earlier (Section 2.2). It is therefore a vapor flood. Lowering the vapor rate is a common cure for downcomer unsealing flood. At the reduced vapor rate, the seal will still be broken, and some vapor will still rise up the downcomer, but the lower vapor velocity will permit the liquid to descend, so no flood will occur. The outcome of changing the liquid rate depends on the vapor rate. Below the flood point, adding liquid helps establish the downcomer seal, thereby preventing the unsealing altogether. Above the flood point, adding liquid will aggravate the flood, as this liquid will be unable to descend and will accumulate. The symptoms of this type of flood resemble those of other types of flood: high pressure drop, entrainment from the top of the tower, poor separation, and instability. What makes it unique is that it occurs only in the spray regime or with truncated downcomers, well below the flood point obtained by hydraulic calculations (vendors and technology providers seldom include downcomer unsealing in their hydraulic calculations). One useful indicator is calculating the liquid head loss at the downcomer exit. Head loss values below 0.4 in. of liquid, and especially below 0.2 in. of liquid, suggest that downcomer unsealing is likely to occur (but not necessarily initiate flood, as with large downcomer areas the vapor rise velocity in the downcomer may be too low to initiate flood). Applying the downcomer unsealing model by Kister (190), with its revised equations published in Refs. 192 and 224, or the model by Bernard (26, 28), can shed more light on this issue. An excellent method of diagnosing downcomer seal loss is by neutron backscatter, as described in Section 6.3, and/or downcomer gamma scans (Section 5.3). In multipass trays, it is possible that due to partial plugging, geometry, or maldistribution, the liquid seal is lost on one downcomer but not on the others. Gamma scans or neutron backscatter are the best guides. In the wash trays at the top of one amine regenerator, the gamma scans showed no liquid on one panel and some liquid on the other. Section 6.3.2 and Figure 6.20 (227) describe a similar phenomenon. Downcomer unsealing is unlikely to occur if the downcomer is sealed by an inlet weir or a seal pan, unless the recess area behind it leaks or an instability causes the level in the sump to fall below the downcomer clearance. Large open areas on trays can lead to vapor channeling on the trays. Such channeling leads to the formation of a high vapor velocity zone, accompanied by excessive entrainment and premature flooding, and vapor-deficient zones with excessive weeping. On sieve and valve trays, the most common type of channeling, known as vapor cross-flow channeling (VCFC), was shown to occur when the following four factors come together (194, 228, 245, 406): Hartman (162) showed that at very high ratios of flow path length to tray spacing (>3–4), VCFC can occur even at slightly lower fractional hole areas than in 1 above. Hennigan (169) presented a case of sieve trays performing at about half the expected efficiency, in which all the above limits were violated except for the hole area that as installed was 9%. However, plant data showed the tower dP to have declined steadily during the run, and it is likely that corrosion (which was known to occur in this service) increased the hole area. Resetarits and Papademos (397) show that push valves on the trays may help alleviate the channeling to some degree. Experience by Ruffert et al. (406) teaches that channeling may persist if the forward push is not well-adjusted. VCFC (Figure 2.33) is encountered when, due to a hydraulic gradient, vapor preferentially channels through the tray outlet and middle, generating a high-vapor-velocity region with high entrainment and premature flood. At the same time, the tray inlet region remains vapor-deficient, which promotes excessive weeping and poor tray efficiency. Davies (80) provided a mechanistic explanation for VCFC. The channeling induced by the tray hydraulic gradient is countered by the dry pressure drop (the friction pressure drop through the holes or valves) that tends to keep the vapor distribution uniform. The criterion proposed by Davies (80) is that to avoid VCFC, the hydraulic gradient needs to be kept below 40% of the dry pressure drop. A rule of thumb for sieve and valve trays (203) states that the hydraulic gradient equals 0.2 in. per foot of flow path length for weir loads (gpm per inch of outlet weir length) of 6 and higher, and is zero for weir loads of 2 gpm/in. and less. For weir loads between 2 gpm/in and 6 gpm/in the rule recommends linear interpolation in weir loads. Figure 2.33 Vapor cross flow channeling (VCFC) on trays. (From Kister, H. Z., K. F. Larson and P. E. Madsen, Chemical Engineering Progress, p. 86, November 1992. Reprinted Courtesy of Chemical Engineering Progress (CEP). Copyright © American Institute of Chemical Engineers (AIChE).) VCFC is not the only form of channeling experienced on distillation trays. Other forms of channeling may be due to vapor maldistribution or multipass tray maldistribution (223, 231, 242, 244, 252). One thing they have in common is that they have only been experienced at large tray open areas, high ratios of flow path lengths to tray spacing, and high weir loads. Vapor channeling floods are vapor floods. The symptoms of this type of flood resemble those of other types of floods: high pressure drop, entrainment from the top of the tower, poor separation, and instability. The pressure drop may not increase too much, as the channeling gives the vapor a path bypassing the accumulating liquid. What makes the channeling flood unique is that it occurs prematurely, well below the flood point obtained from hydraulic calculations (vendors and technology providers seldom include VCFC in their hydraulic calculations). It occurs only when the abovementioned four criteria come together; if any one of these factors falls significantly outside the range, channeling flood is unlikely. Another symptom is that once out of flood, turning the vapor and liquid loading down will cause a loss of efficiency due to the intensification of weeping. Finally, multi-chordal gamma scanning with quantitative analysis (Section 6.1) is a superb method for diagnosing channeling. In all channeling, the best prevention is to boost the dry pressure drop. Layton Kitterman, one of the all-time great experts in distillation troubleshooting, estimated that 50% of the problems in the tower originate in the tower base region (253). Over 100 reported case histories out of 900 surveyed (198) testify that indeed, more problems initiate at the tower base than in any other tower region, although the actual percentage may be lower than 50. The survey found little improvement in tower base incidents over the years (198), so it will continue to be a major trouble spot. Numerous case studies are described in Ref. 201. In half of the case studies reported (198), liquid levels rose above the reboiler return or gas inlet. When this happens, the reboiler return vapor entrains the liquid above the nozzle into the bottom tray or packing, causing it to flood, as depicted in Figure 2.34a. Figure 2.34 (a) Liquid level above reboiler return, but level instrument fails to see it due to incorrect upper tap location; (b) Good liquid measurement practice. (Part (a): From Kister, H. Z., “Practical Distillation Technology”, course workbook. Copyright © Henry Z. Kister. Reprinted with permission. Part (b): From Kister, H. Z., Chemical Engineering Progress, p. 16, March 2006. Reprinted Courtesy of Chemical Engineering Progress (CEP). Copyright © American Institute of Chemical Engineers (AIChE).). Faulty level measurement or control was the primary cause of these high levels. A multitude of case studies have reported that faulty base level measurement led to premature flooding (e.g., in Refs. 192, 201, 285, 286, 410, 450, 509). Restriction in the outlet line (including loss of bottom pump, obstruction by debris, and undersized outlets) is another cause. A third major cause is excessive pressure drop in a kettle reboiler circuit, which backed liquid in the tower base beyond the reboiler return inlet. In the majority of cases, high base levels caused tower flooding, instability, and poor separation. Less frequently, vapor slugging through the liquid also uplifted or damaged trays or packing. In even fewer cases, the tower was overfilled with liquid to the top, pouring into the overhead line and reflux drum, at times causing safety and environmental hazards and accidents. In some cases the entire tower shook and appeared like it could collapse. To prevent excessive tower base level, the author endorses the measures recommended by Ellingsen (95): reliable level monitoring, often with redundant instrumentation, and good sump design. One added measure (198, 201) is avoiding excessive pressure drop in a kettle reboiler circuit. These measures are discussed at length in Ref. 192 and are briefly summarized below: Reliable Level Monitoring Some of the lessons learned are as follows: Figure 2.34b shows a good level measurement practice. It features two independent level transmitters mounted on two separate bridles. The upper tap of each transmitter is beneath the reboiler return nozzle. There is a third level transmitter coming from one of the upper level taps and going to another tap just below the bottom tray or packed bed. This transmitter should always read zero. A reading on this transmitter (which can be set to trigger an alarm) indicates a rise of the liquid level above the reboiler return inlet and likely flood initiation. Good Sump Design Some of the lessons learned are as follows: Impingement by the reboiler return or incoming gas on the liquid level generates entrainment that can travel up the tower and flood trays or packings. Reboiler return or inlet gas impingement on instruments gives false readings, which may cause high liquid levels to go unnoticed. Premature floods can also occur due to impingement of the reboiler return vapor on the bottom tray, the seal pan overflow, and the inlet from a second reboiler. Some case studies (201) also reported severe local corrosion due to gas flinging liquid at the tower shell in alkaline absorbers fed with CO2-rich gas, mostly in ammonia plants. Figure 2.35 shows poor arrangements that generated impingement of reboiler return or inlet gas on the liquid level, leading to premature floods or entrainment that traveled right up the tower. Sections 8.14–8.16 contain more cases. Figure 2.35 Practices to be avoided. Each of these can lead to premature flooding starting from the tower base. (From Kister, H. Z., Chemical Engineering, May 19, 1980. Reprinted with permission.) Diagnosis The following can help diagnose flood due to a high liquid level or an impingement issue: Column feed often contains components whose boiling points are intermediate between the light and heavy key components. In some cases, the column top temperature is too cold and the column bottom temperature is too hot to allow those components to leave the column at a rate sufficiently high to match their feed rate into the column. Having nowhere to go, these components accumulate in the column, causing flooding, cycling, and slugging. If the intermediate component is water or acidic, it may also cause accelerated corrosion; in refrigerated columns, it may cause hydrates. A high temperature difference between column top and bottom, a large concentration of the component in the feed, a large number of stages, and a high tendency to form azeotropes or two liquid phases are conducive to intermediate component accumulation. A high activity coefficient at the tower bottom can make an intermediate component, even a heavy component, particularly volatile. For instance, when a tower bottoms is mainly water, organic components such as n-butanol are repelled from the liquid into the vapor and become highly volatile. The same organic can become highly nonvolatile if the top of the tower is rich in methanol or ethanol. For a methanol–water separation column, n-butanol in the feed will tend to concentrate near the middle of the tower. This effect has been discussed at length by Saletan (408) and Kister (199). Figure 3.1 is an example of a column that separates a 50/50 mixture of methanol and heptanol. The reboiler receives a feed of butanol at a rate of about 0.1% of the feed rate. The tiny amount of butanol builds up to 80–90% in the liquid at the middle of the tower, dominating the tower composition (and temperature) profile. The butanol accumulates in the column over a period of time, during which the column will be in an unsteady state. Such an unsteady state period is common to accumulation incidents. Figure 2.36 (the “no decant” curves) is another example. Here, a minor high-boiling impurity in the feed, 2 ppm, formed a heterogenous azeotrope with water and built up to >40% in the tower, generating a two-liquid phase zone from stage 9 to 16. The component builds up toward the equilibrium concentration that reinstates the component balance in the tower. However, when the volatility of the intermediate component near the bottom is high and near the top is low, and/or the number of stages is high, and/or the concentration of the intermediate component in the feed is high, the equilibrium concentration may not be reached. Instead, unsteady state cycling may set in, as described below. Intermediate component buildup most frequently takes place over the entire tower, but there are times when it is confined to the section below the feed or the section above the feed. Excessively subcooled feed (or fouling of a feed preheater) can lead to accumulation of an intermediate component between the feed and the bottom. Similarly, excessive preheat (oversurfaced or clean preheater) may lead to an accumulation between the feed and the tower top. Hiccups (Also Referred to as Burping, Puking, Cyclic Slugging) A typical symptom of nonsteady state accumulation is cyclic slugging, which tends to be self-correcting. The intermediate component builds up in the column, typically over hours or days. Eventually, the column floods, or a slug rich in the offending component exits either from the top or from the bottom. The column end from which the slug leaves often varies unpredictably or according to the operator’s action. Once a slug departs, normal column operation resumes fairly quickly, often without operator intervention. The cycle will then repeat itself. Several experiences have been reported in the literature, many of them described in Refs. 94, 172, 199, 201, 389, and many others cited by the mentioned references. Figure 2.36 Minor high-boiling impurity in the feed, 2 ppm, that forms a heterogeneous azeotrope with water, can build up to >40% in the tower, generating a two-liquid phase zone from stage 9 to 16. Removing a side draw 0.5% of the product take off and decanting to remove the component cuts the two-liquid phase zone to two stages and eliminates the bulge. (From Schon, S. G., “A New technique to Prevent Minor Component Trapping in Distillation”, Paper presented at the Distillation Symposium, AIChE Spring Meeting, San Antonio, Texas, April 2022. Reprinted Courtesy of Steven G. Schon, Arkema Inc.) Intermediate component accumulation may interfere with the control system. For instance, a component trapped in the upper part of the column may warm up the control tray. The controller will increase reflux, which pushes the component down. As the component continues to accumulate, the control tray will warm up again, and reflux will increase again; eventually, the column will flood. Cases describing a similar sequence have been reported (Case 2.13 in Ref. 201, also 94, 389). One of the most fertile breeding grounds for intermediate component accumulation is a condition in which at least some section in the tower operates close to the point of separation of a second liquid phase (201). Either the accumulation itself, a condition in which phase separation equipment in the feed route (a decanting drum, a coalescer) malfunctions, or simply a change in feed composition can induce separation of a second liquid phase inside the tower. The introduction of a second liquid phase changes volatilities and azeotroping, which can aggravate hiccups. Hiccups can cause major upsets in downstream equipment. A slug of lighter material escaping from the bottom of one tower can quickly vaporize in the hotter downstream tower, causing a pressure surge there and possibly lifting its relief valve. Diagnosis Periodic cycling that tends to be self-correcting, with a long time period, is the key symptom for hiccups. The time period is seldom less than one hour, which distinguishes hiccups from other, shorter cycles such as those associated with flooding, hydraulic, or control issues, whose period is typically a few minutes. Typical cycle period for hiccups ranges from about once every two hours to once every week. The cycles are often regular, but if the tower feed or product flows and compositions vary, the cycles may be irregular. Drawing internal samples from a tower over the cycle (or over a period of time) is invaluable for diagnosing accumulation. Such samples will show high and increasing concentrations of the intermediate component over the cycle. Even a single snapshot analysis can detect accumulation of a component. Unfortunately, safety, environmental, and equipment constraints often preclude drawing internal samples. Closely tracking and monitoring temperature changes is also invaluable. Temperature changes reflect composition changes. Accumulation of an intermediate component tends to warm the top of the tower and cool the bottom of the tower. The response of the control system to temperature changes and any rise in pressure needs to be considered when interpreting temperature trends. One symptom is common: at the initiation stage, temperature deviations from normal are small, often negligible. As the accumulation intensifies, systematic temperature deviations (“excursions”) from normal become apparent. Close to the hiccup point, temperature deviations become relatively large. Figure 2.36 illustrates the variations in the temperature profile. The “0.5% decant” curve shows a temperature profile close to normal, practically unaffected by the accumulation. As the component builds up, the curves move closer to the “no decant” curves, first at stage 11 and then progressively to stage 17. In this case, the temperature declines by a sharp step due to the formation of the second liquid phase on these stages. Had there been no second liquid phase, the accumulation would have lowered the temperatures in the accumulation zone below the feed in a more gradual (rather than stepped) manner. Steady state bulges can be readily simulated and recognized on a plot of component concentration against stage numbers, as in Figures 3.1 and 2.36. The simulation needs to be able to correctly simulate a second liquid phase, which may form during component accumulation. With hiccups, steady state simulations are likely to run into convergence problems, reflecting the reality that steady state is not reached. To get around this, “sneak into the solution” by studying a related system that can converge, e.g., input less intermediate component in the feed, or draw a side product. Once a converged solution is reached, slowly proceed toward the actual system (by raising the intermediate component in the feed, or cutting back on the side draw). Track the changes by plotting a concentration versus stages diagram for each step. In the case of a second liquid phase, many stages in the simulation may alternate between a single liquid phase and two liquid phases, making convergence particularly problematic. Either increasing or decreasing the concentration of the second liquid phase can help reach a solution. Gamma scans and dP measurements can detect the intermittent flooding. Gamma scans typically show normal operation at the beginning of the cycle and mid-column flooding when a hiccup occurs. If enough pressure taps are available on the tower, dP transmitters can be just as informative. Finally, sight glasses are extremely useful when safety requirements permit. Cures There are three cures that can effectively mitigate the hiccups and two “band-aid” solutions that can reduce the frequency and severity of the hiccups. These cures are discussed in detail with several examples elsewhere (199, 201, 419): This includes side draw lines to products or reboilers. Bottlenecks at a liquid side draw can cause one or more of the following: Downcomer Draw Boxes Column flooding is likely to initiate in the draw arrangement in Figure 2.37a whenever the liquid flow rate to the draw exceeds the draw hydraulic limit. The excess liquid has nowhere to go, so it will stack up in the downcomer and flood the next tray. From there, the flood will propagate upward. Column flooding is unlikely to initiate in the draw arrangement in Figure 2.37b because the generous clearance under the downcomer will allow excess liquid to drain onto the tray when the draw encounters a hydraulic limit. Depending on the dimensions, column flooding may or may not initiate in the draw arrangement in Figure 2.37c when the draw reaches its hydraulic limit. At the limit, liquid will stack up in the seal pan and in the downcomer up to the seal pan overflow elevation. If the overflow weir is tall enough to back up liquid in the downcomer all the way to the tray above, flooding is likely. It is important to note that the seal pan liquid is likely to be degassed, while the downcomer liquid is likely to be frothy and therefore have a significantly lower specific gravity, typically about half, so the seal pan can back downcomer liquid to about twice the submergence of the downcomer. On the other hand, if there is ample vertical height to allow overflow without excessive downcomer backup, flooding is unlikely. A potential problem with the arrangement shown in Figure 2.37b is vapor entry into the downcomer during excessive draw rates. Should the draw rate exceed the rate of incoming liquid, vapor will be sucked into the downcomer and the draw via the downcomer clearance. The entering vapor may choke the downcomer, the draw, or both. Intermittent flooding or cycling may initiate, producing instability. With arrangements shown in Figure 2.37a and c the downcomers are always liquid-sealed, so vapor entry is unlikely. Figure 2.37 Side draw-off arrangements (a) likely to initiate flooding at excess draw rates; (b) generous clearance under the downcomer allows liquid drainage to the tray, but may be prone to vapor entry into the downcomer; (c) downcomer sealed, preventing vapor entry. Should a side draw bottleneck be suspected, the following checks and field tests can help diagnose: Aerated liquid does not follow the liquid laws; it follows the aerated liquid laws, which state that all the pipes downstream of the draw, all the way to the lowest point, including any horizontal sections, and including the draw nozzle, need to be sized for self-venting flow. A self-venting flow is where liquid descends and any entrapped vapor bubbles rise back up to be vented back through the line and draw nozzle. Just like they do in a downcomer. If the line is not large enough for self-venting flow, the bubbles will accumulate in the line and choke it, initiating flooding or instability. Figure 4.9 is a graphical version of an excellent correlation for self-venting flow by Simpson (439) and later by Sewell (425). Above the diagonal, the flow is self-venting. Below the diagonal the downpipes are likely to choke, backing up liquid in the tower. The correlation straight line extrapolates to larger and smaller pipe diameters. Cases 10.1 and 10.2 in Distillation Troubleshooting (201) describe case studies of premature tower floods due to product lines undersized for self-venting flow. Many more were described in the literature (8, 18, 198, 280, 489). Some of these resulted in poor product quality or instability rather than flood. There are a number of situations where one can often get away with draw lines undersized for self-venting flows: Chimney Tray draws are not immune to side-draw bottlenecks. When they hold liquid, chimney trays usually, but not always, provide sufficient degassing time to degas the liquid (see criterion in item 1 above). In Figure 2.38, the pumpdown draw will benefit from the degassing time on the chimney tray, and if sufficient (>30–60 seconds), there will be no need for self-venting flow. Not so with the side draw in Figure 2.38; the cascade over the chimney tray weir re-entrains vapor into the side draw takeoff sump (250). If the side draw line is undersized for self-venting flow, liquid will back up onto the chimney tray, possibly resulting in instability, and/or overflow and/or a premature tower flood. Figure 2.38 Examples of liquid draws from a chimney tray. The residence time will degas the pumpdown liquid, but not the side draw liquid. (From Kister, H. Z., G. Jacobs, and A. A. Kister, Chemical Engineering Research Design, 191, p. 313, 2023. Reprinted Courtesy of IChemE.) In another case (150), liquid to circulating thermosiphon side reboiler was drawn from a chimney tray, with the reboiler effluent returning to the same chimney tray. Overflow pipes transported the reflux to the tray below. Circulation through a thermosiphon reboiler generated a very large liquid flow through the chimney tray, depriving it from the residence time needed for degassing. The reboiler draw lines were undersized for self-venting flow of the huge recirculating liquid flow and choked. The excess liquid overwhelmed the overflow pipes, so it accumulated in the tower and flooded it, with gamma scans showing 15 ft of liquid piling up above the chimney tray. This scan observation was the key to the diagnosis. The problem was resolved primarily by returning the reboiler effluent to the tray below the reboiler (in essence, converting the circulating thermosiphon reboiler to a once-through thermosiphon reboiler), which eliminated the excessive circulation through the chimney tray and the reboiler draw line. Chimney tray overflow or premature flood due to downpipes undersized for self-venting flow are discussed with reference to packed tower case studies under “collectors” in Section 4.6. Tray case studies are found in Section 9.2.5 and in Refs. 118 and 388. Rules of thumb should always be taken for what they are: rough criteria that reflect the experience of practitioners. They are not meant to replace detailed calculations such as those presented in most distillation texts (34, 193, 245, 299, 451, 492). Their merit is in providing troubleshooters with a preliminary orientation of which path is more likely to lead to problem identification. Most of these rules of thumb apply to systems where there is a lot of experience. A rule may not extend to other systems where the experience is limited. Many systems are not covered by these rules. In addition, every rule of thumb has exceptions. Some rules of thumb useful for distillation troubleshooting are: Figure 2.39 The O’Connel plot for tray efficiency. (From O’Connell, H. E., Transactions of the American Institute of Chemical Engineers, 42, p. 741, 1946. Copyright © American Institute of Chemical Engineers (AIChE). Reprinted with permission.) uexit is in ft/s. The area used in the calculation is based on the most restrictive area for liquid flow at the downcomer exit. where L and G are the liquid and vapor mass flow rates, respectively, consistent units, and ρG, ρL are gas and liquid densities, consistent units, respectively. FLG is dimensionless. The vapor-rich region occurs at FLG < 0.1. The liquid-rich region occurs at FLG > 0.3. where ΔPD is the dry pressure drop and HCL is the clear liquid height, both in inches of liquid. HCL can be calculated from the difference between the total and dry pressure drops or from the Colwell equation (73, 193, 245). When the stability factor exceeds 0.6, weeping is less than 30%, and the tray is stable. Weeping and pass maldistribution rapidly escalate at lower stability factors, with 50% weeping or more by the time the stability factor declines to 0.4. Summers has recently published (467) an updated criterion. The author has extensive good experience with the 2010 version, but only limited experience with the updated criterion.
Chapter 2
Troubleshooting for Flood
2.1 FLOODING: THE MOST COMMON TOWER THROUGHPUT LIMITATION
2.2 FLOOD MECHANISMS IN TRAY AND PACKED TOWERS
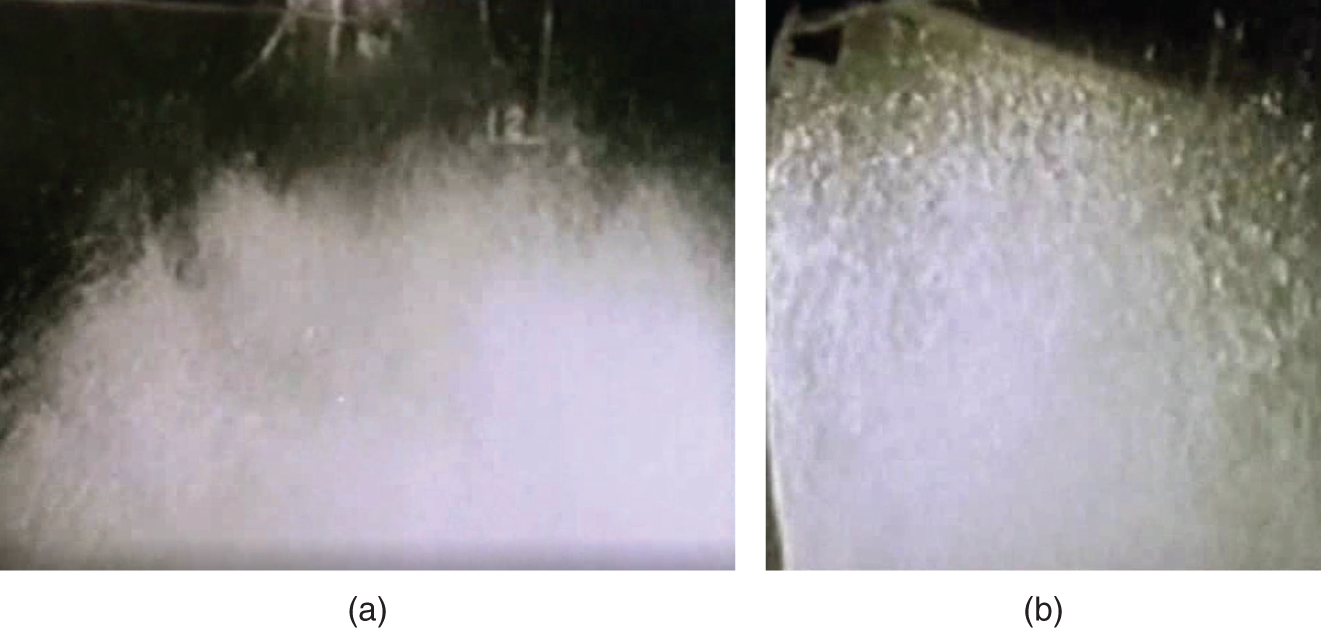
where Cactive is the C-factor (ft/s), i.e., the superficial vapor velocity Uactive (ft/s) based on the active area of the tray, adjusted for vapor and liquid densities (ρG and ρL). The flood point occurs at a maximum C-factor that is calculated from jet flood correlations that can be found in most standard texts (34, 193, 245, 299, 451, 492).
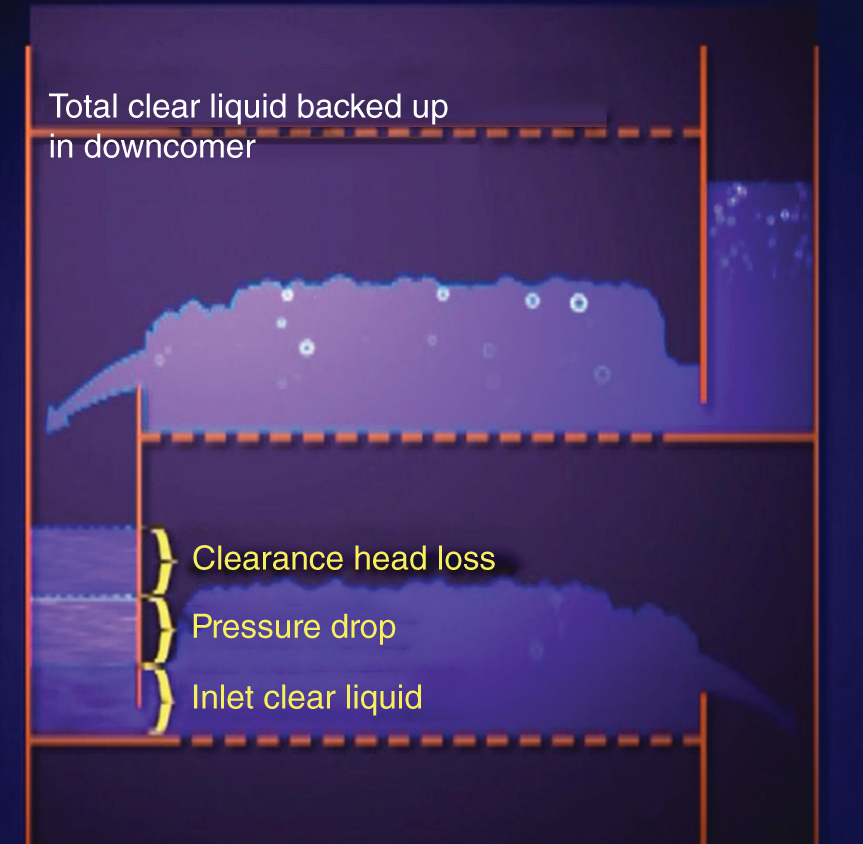
2.3 FLOOD AND FLOOD MECHANISM DETERMINATION: HYDRAULIC ANALYSIS
Top section
Bottom section
Trays
Trays
Trays
Trays
Trays
1–6
7–14
15–25
26–28
29–73
Tower diameter, ft
3
3
6
6
6
Tray spacing, inches
18
18
18
21
23
Hole area, % of active area
6.5
6.5
3.2
5.6
7
Downcomer inlet area, % of tower area
14
14
30
30
30
Downcomer clearance, inches
1.3
1.3
1.5
2.8
2.8
Outlet weir height, inches
1.5
1.5
1.5
2
2
Vapor C-factor, based on net area, ft/s
0.14
0.13
0.08
0.11
0.14
Liquid load, GPM/inch of outlet weir
2.1
2.8
6.3
11.0
13.5
Downcomer inlet velocity, ft/s
0.13
0.18
0.11
0.20
0.24
% Jet flood
47
46
62
65
70
% Froth in downcomer
58
53
106
94
87
% Downcomer choke velocity
51
53
38
65
78
Total downcomer backup, inches of liquid
6.0
6.0
11.8
12.3
12.3
Tray inlet clear liquid height, inches of liquid
2.4
2.5
3.1
4.4
4.4
Head loss under downcomer, inches of liquid
0.2
0.3
1.2
1.1
1.7
Tray pressure drop, inches of liquid
3.4
3.2
7.5
6.8
6.2
Tray dry pressure drop, inches of liquid
2.3
1.9
6.4
4.7
3.7
2.4 OPERATING WINDOW (OR STABILITY) DIAGRAMS
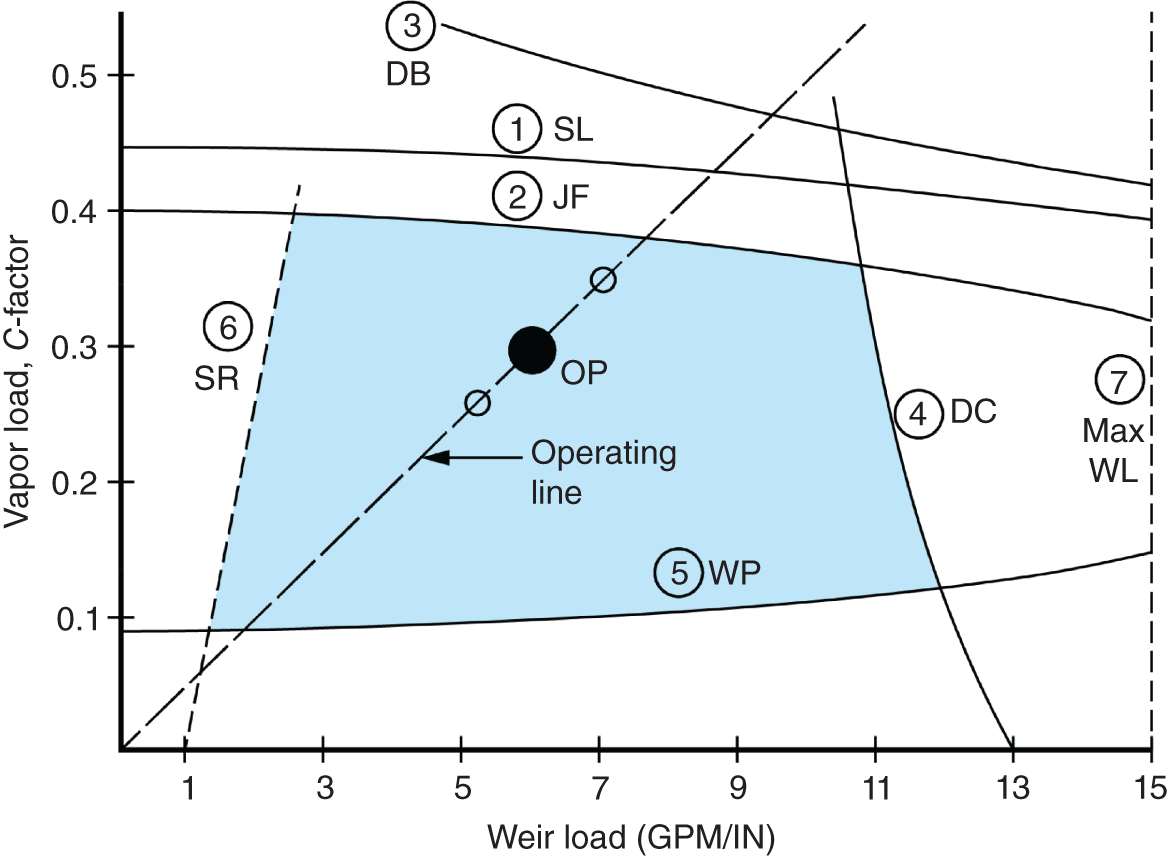
2.5 FLOOD POINT DETERMINATION: FIELD TESTING
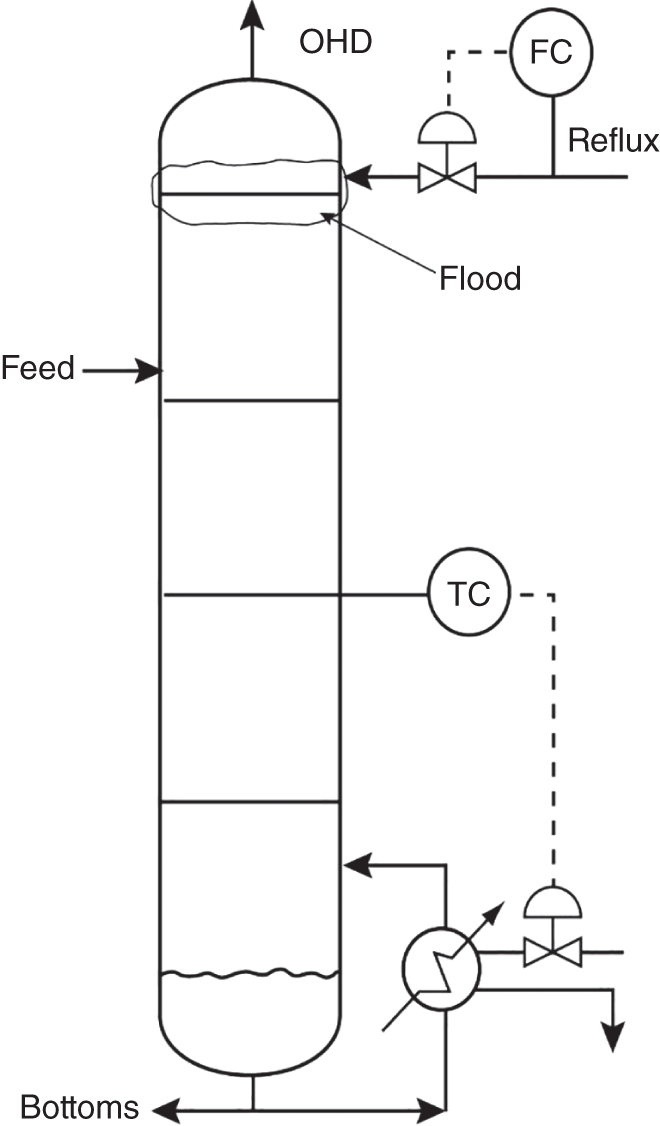
2.6 FLOOD POINT DETERMINATION IN THE FIELD: THE SYMPTOMS

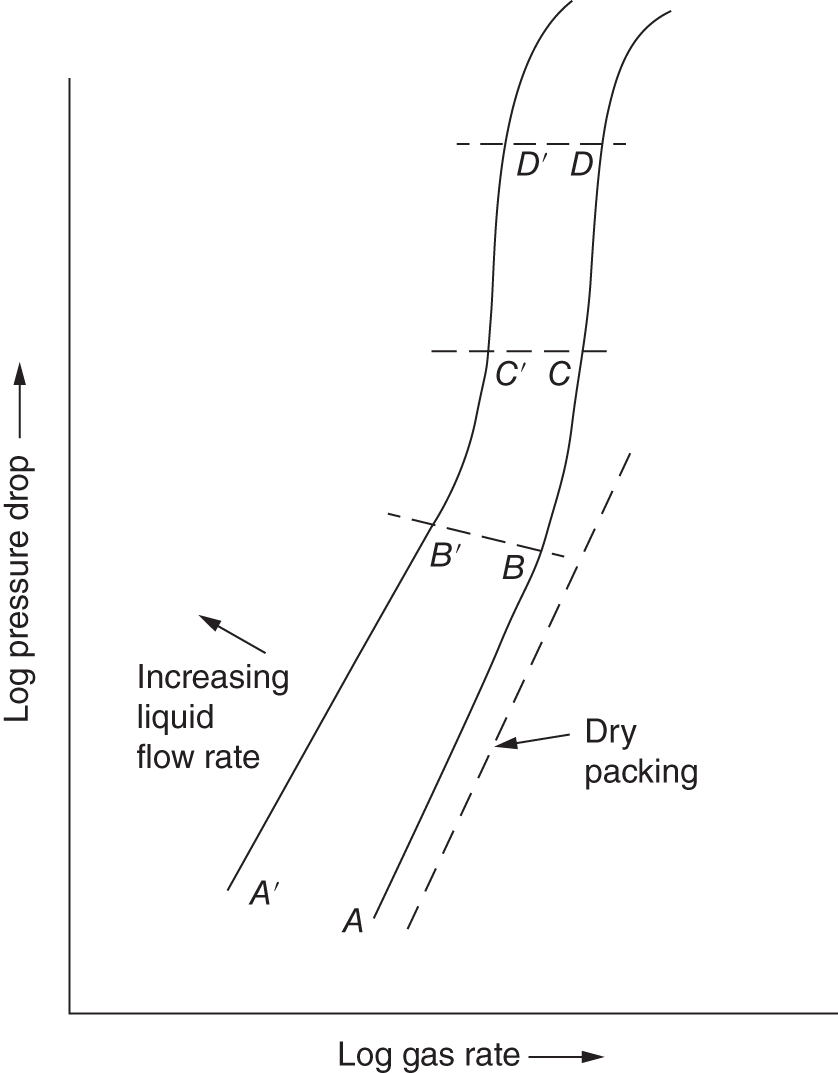
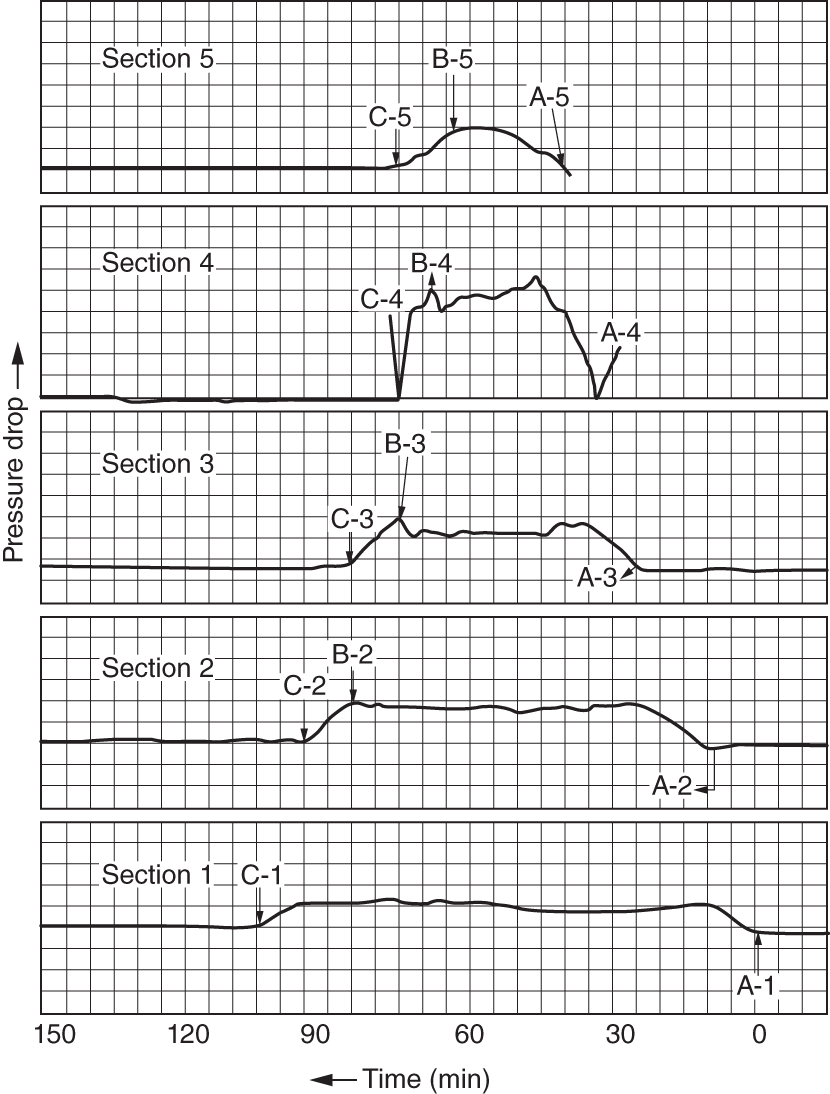
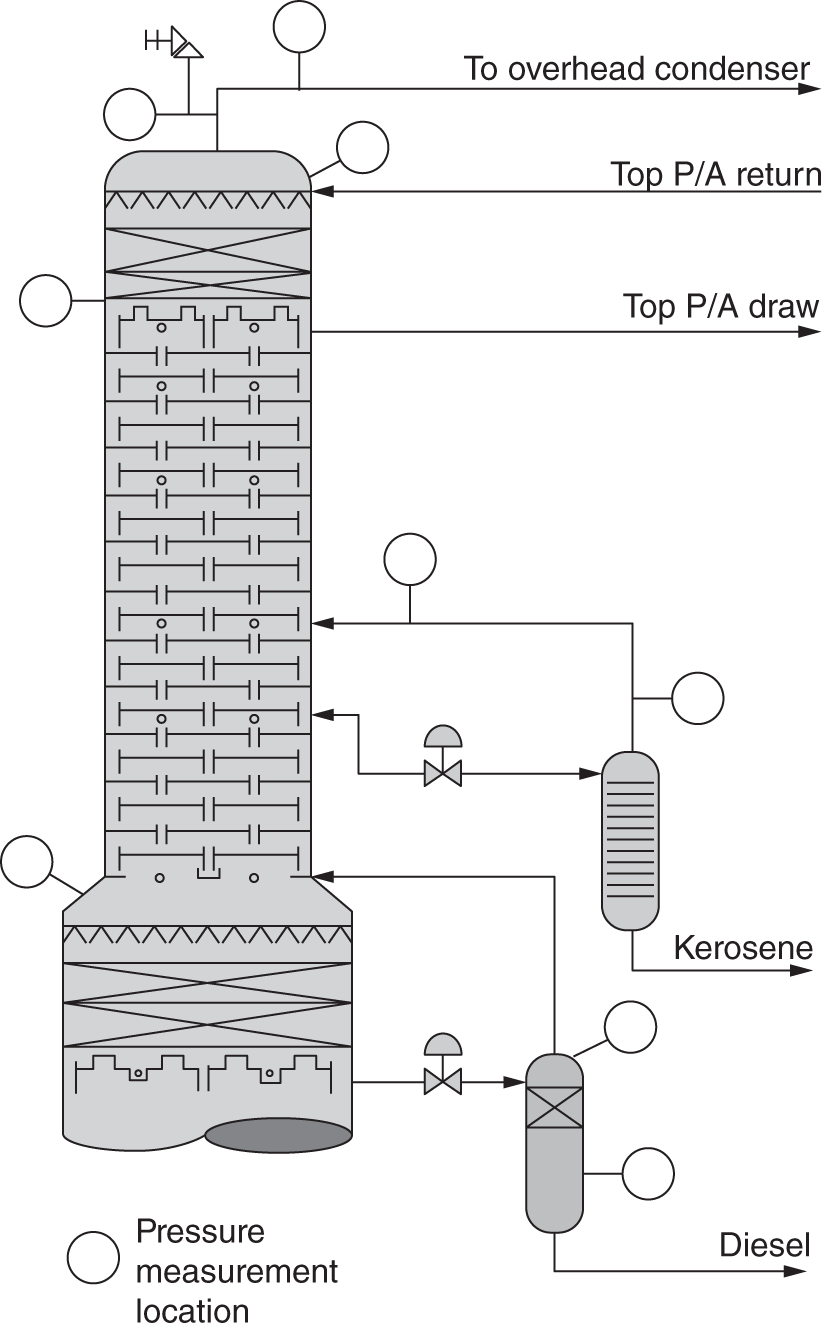
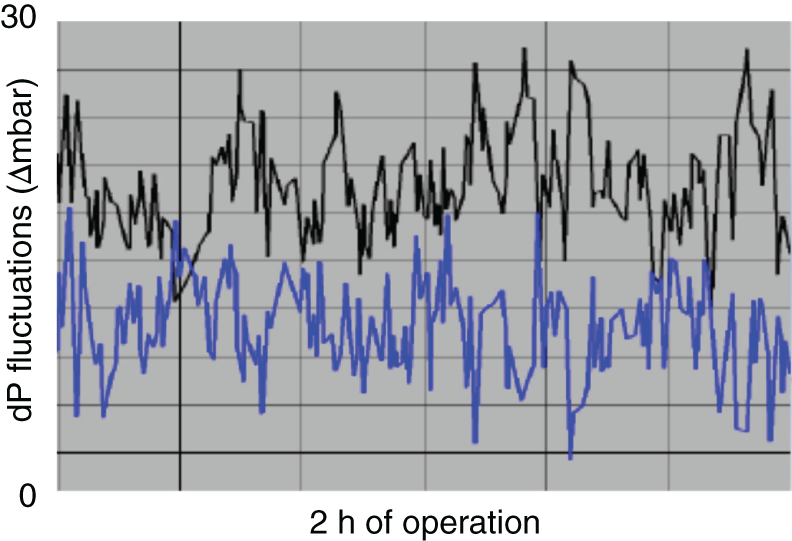
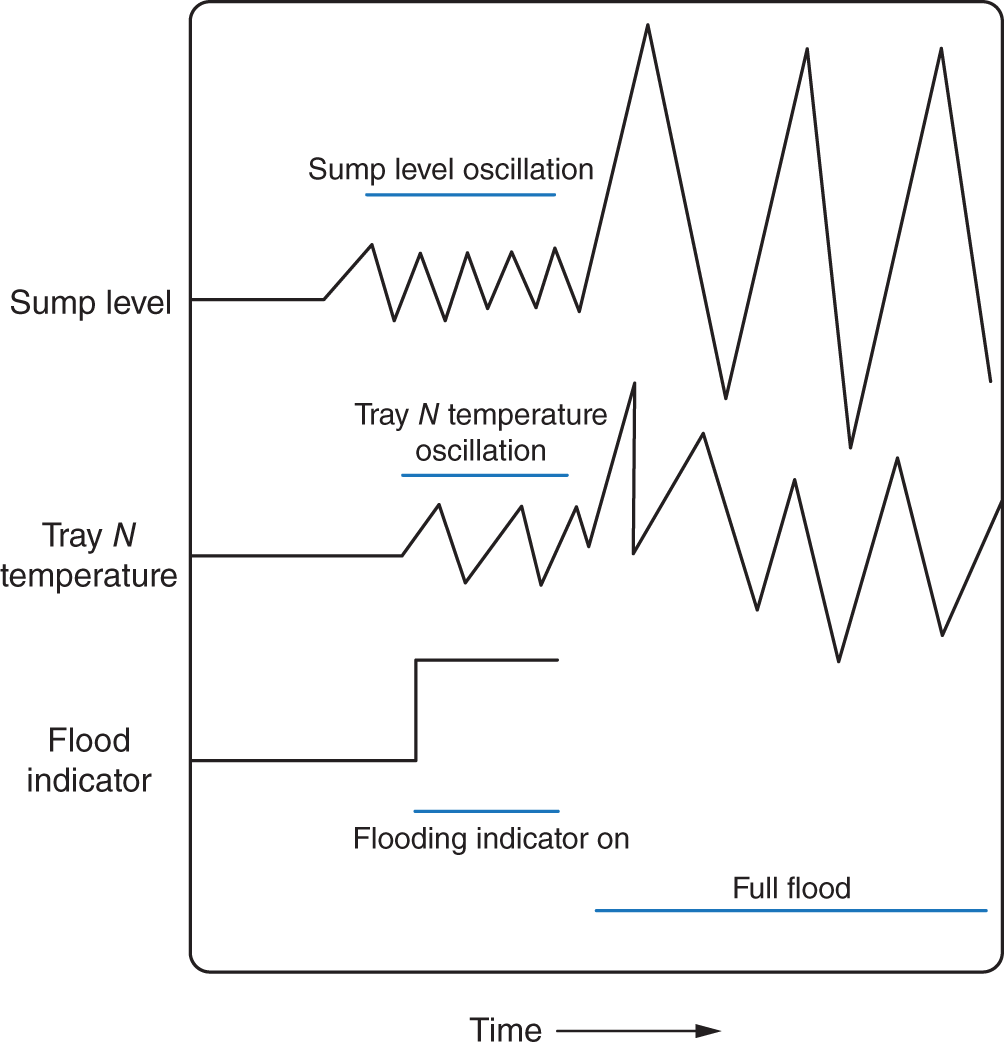
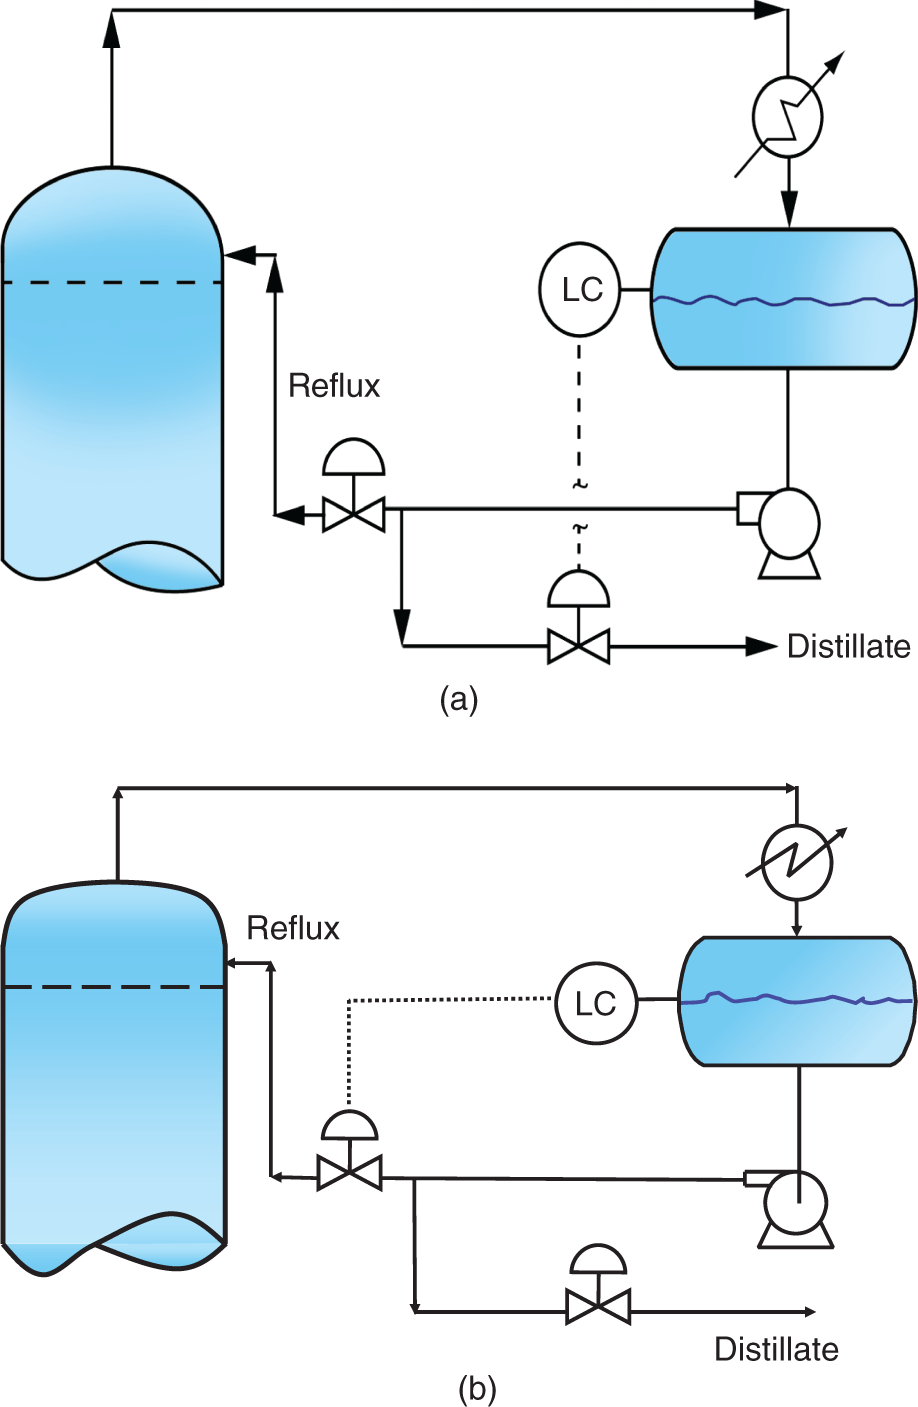

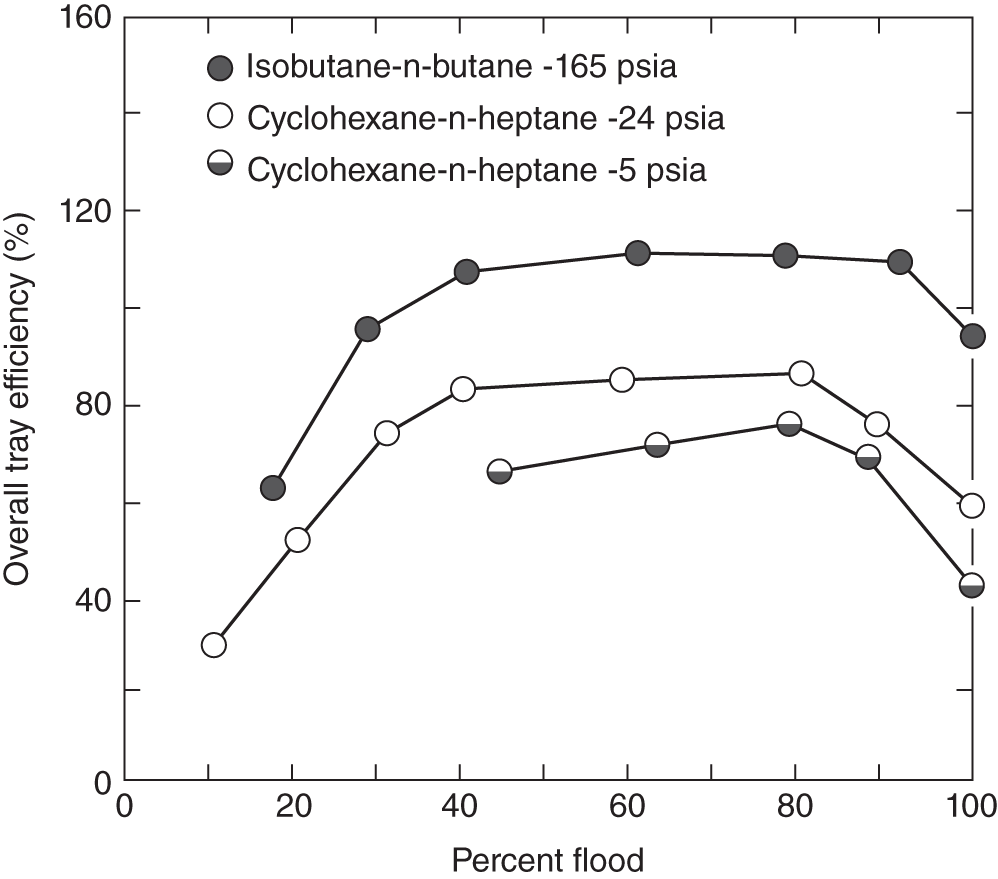
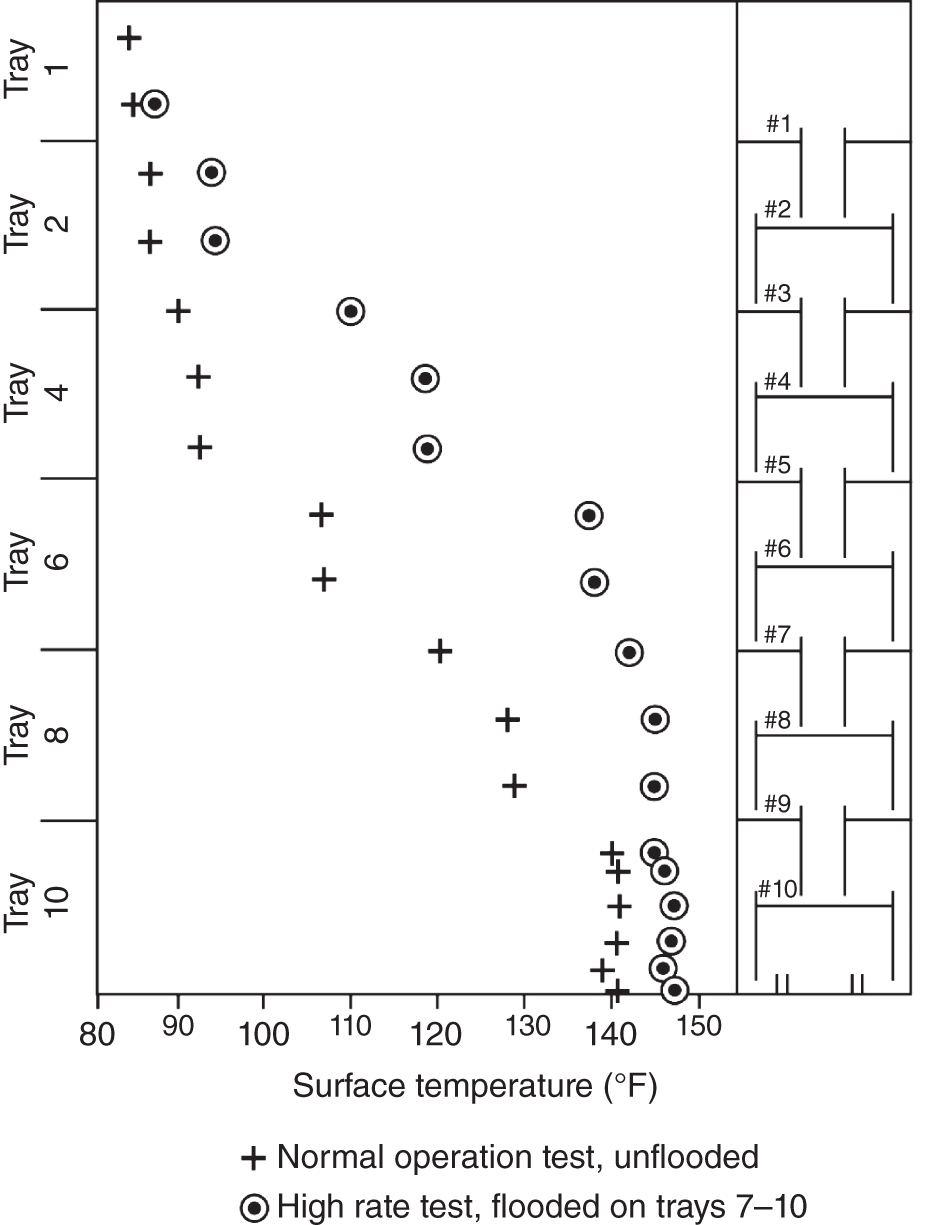
2.7 FLOOD MECHANISM DETERMINATION: VAPOR AND LIQUID SENSITIVITY TESTS
2.7.1 Extension of Vapor/Liquid Sensitivity Tests to Complex Fractionators
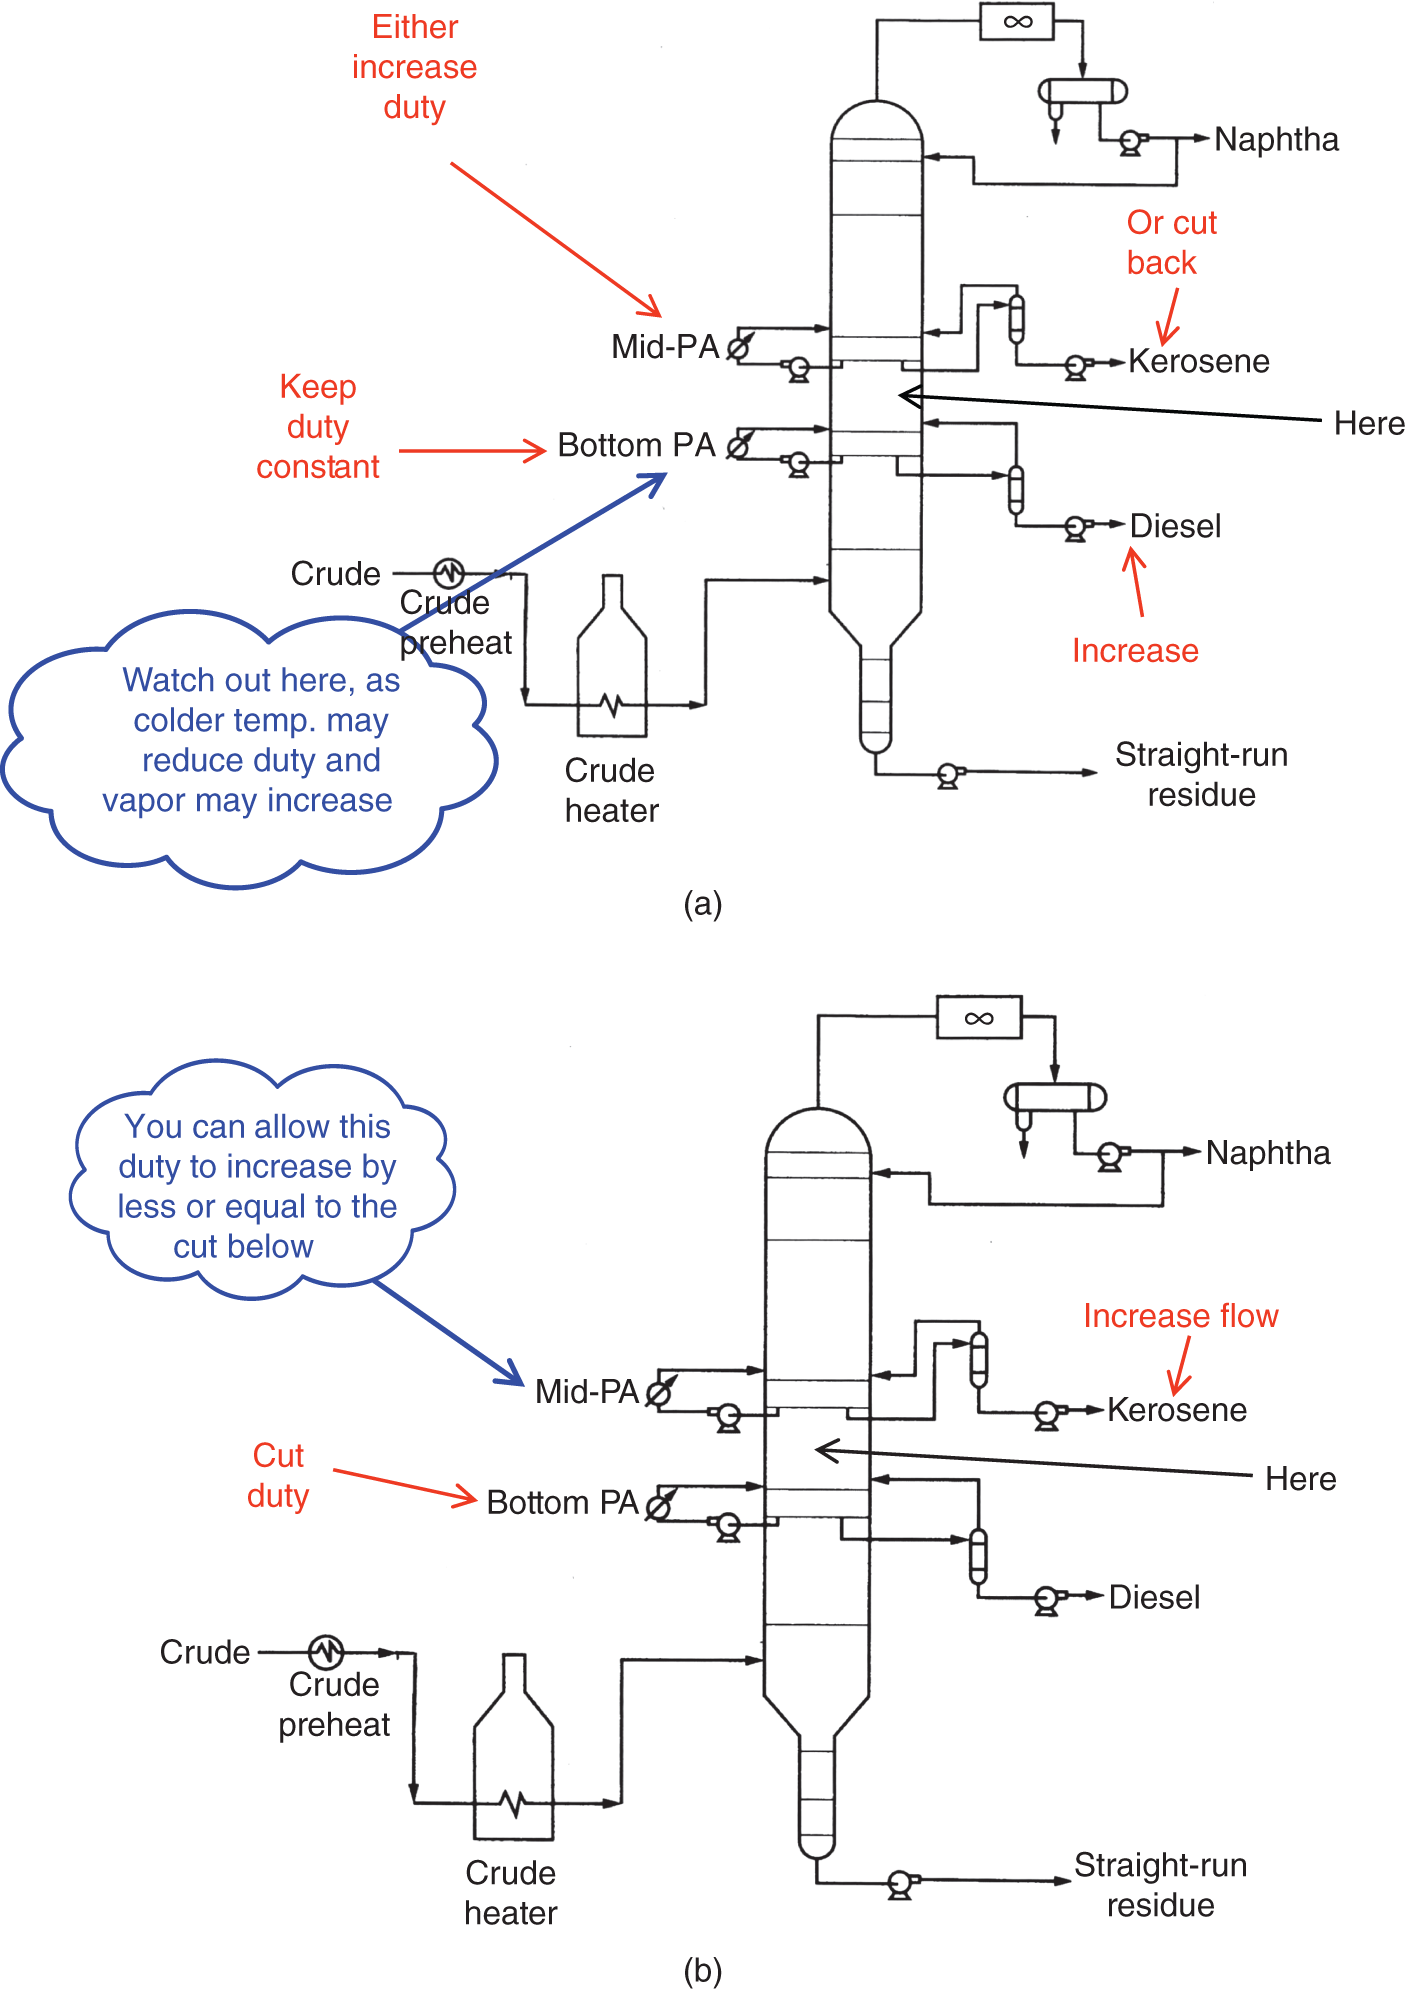
2.8 GAINING INSIGHT INTO THE CAUSE OF FLOOD FROM P VERSUS VAPOR RATE PLOTS

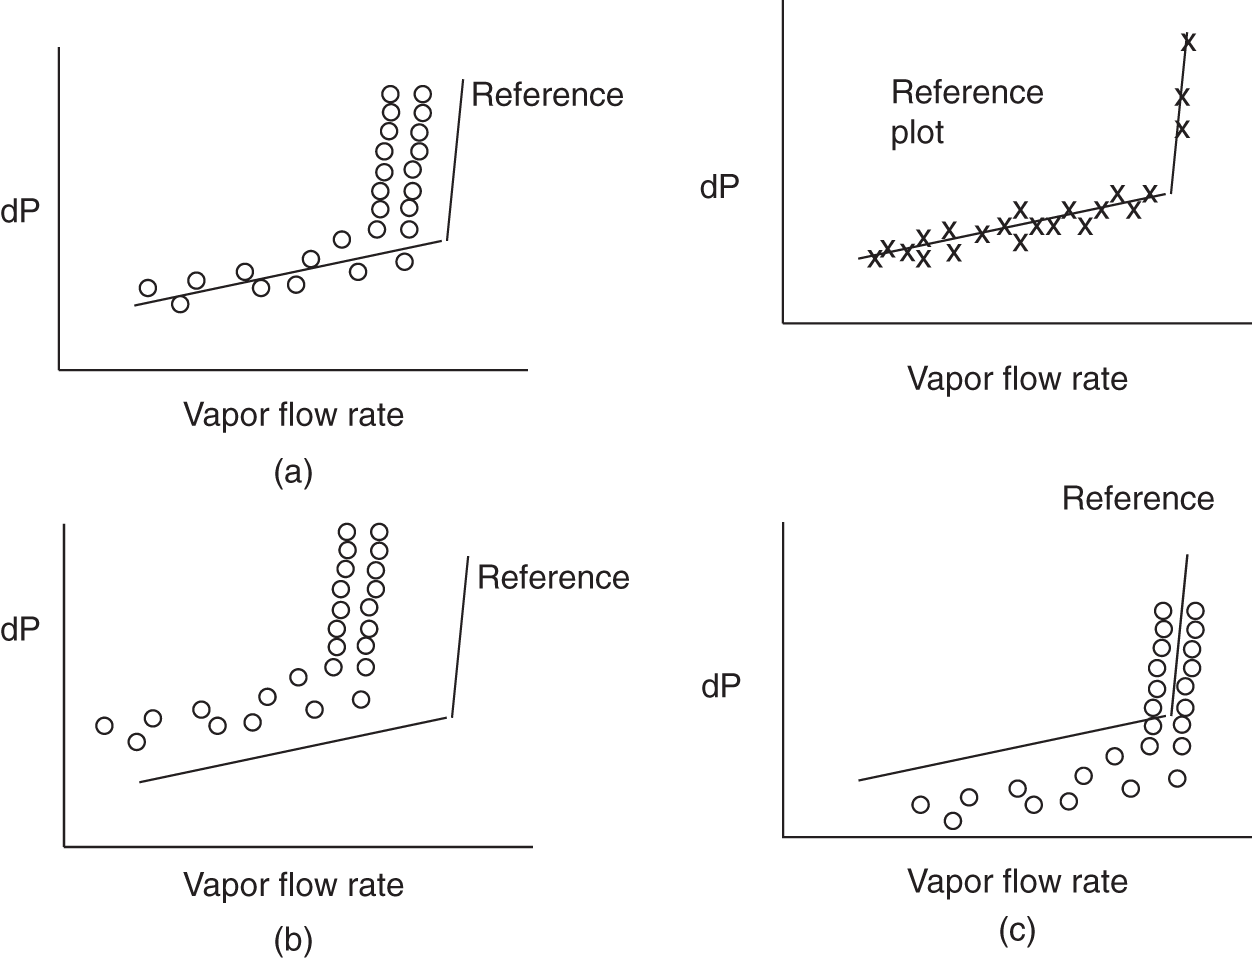
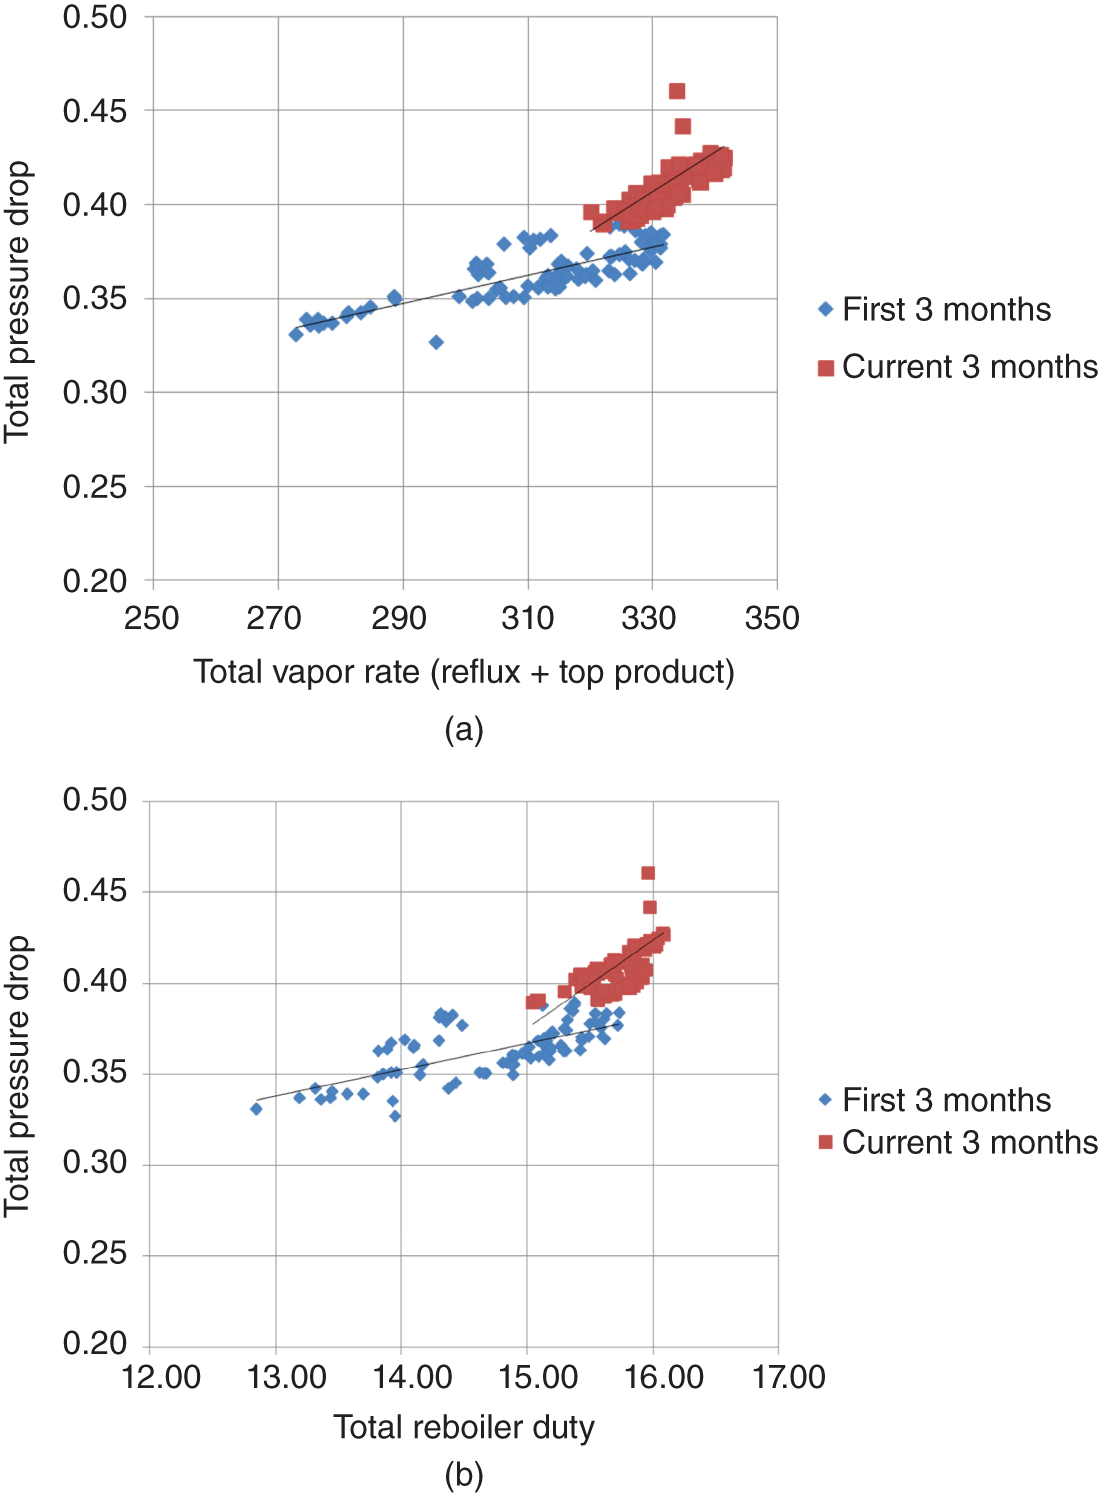
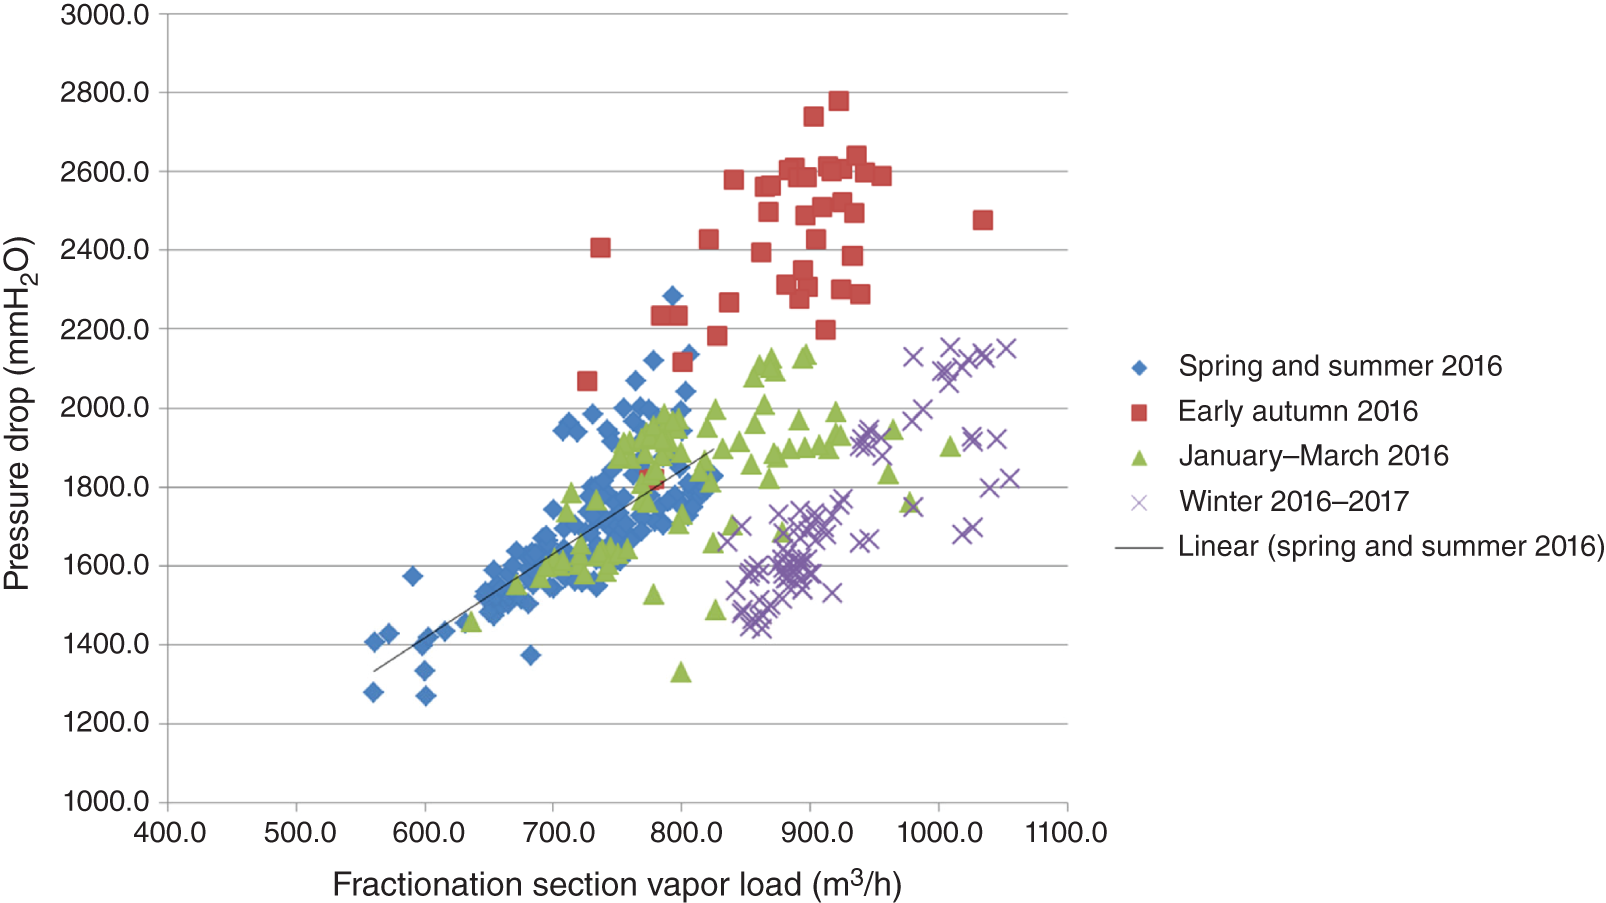
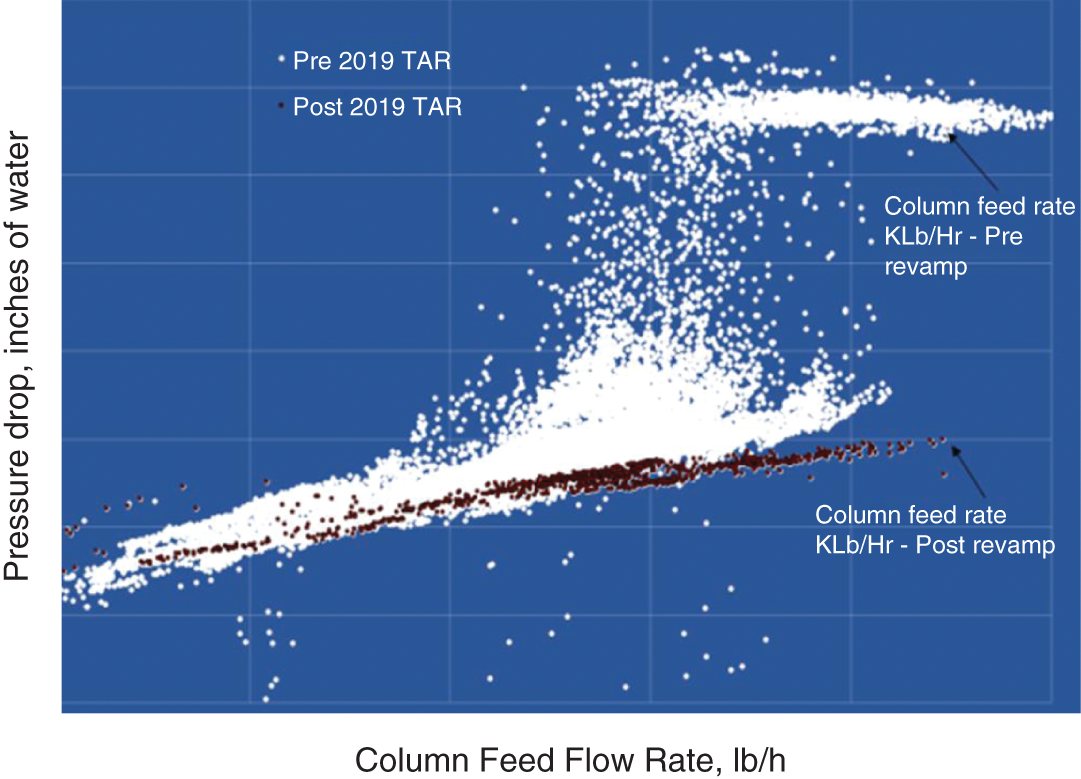
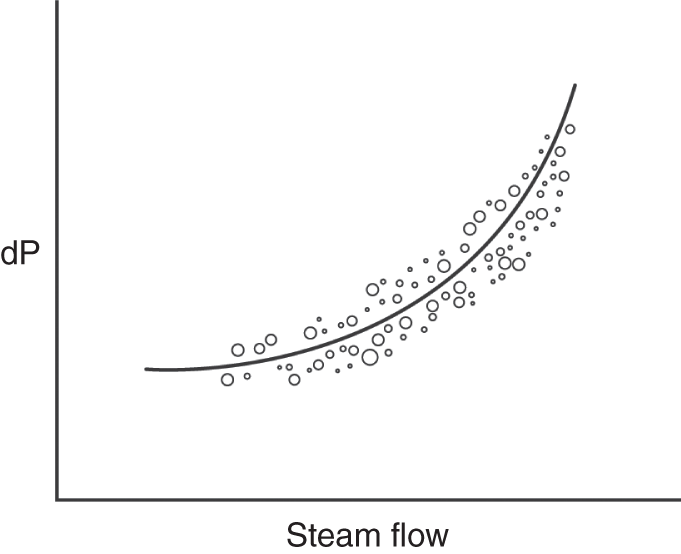
2.9 DIAGNOSING FLOODS THAT GIVE SMALL P OR NO P RISE
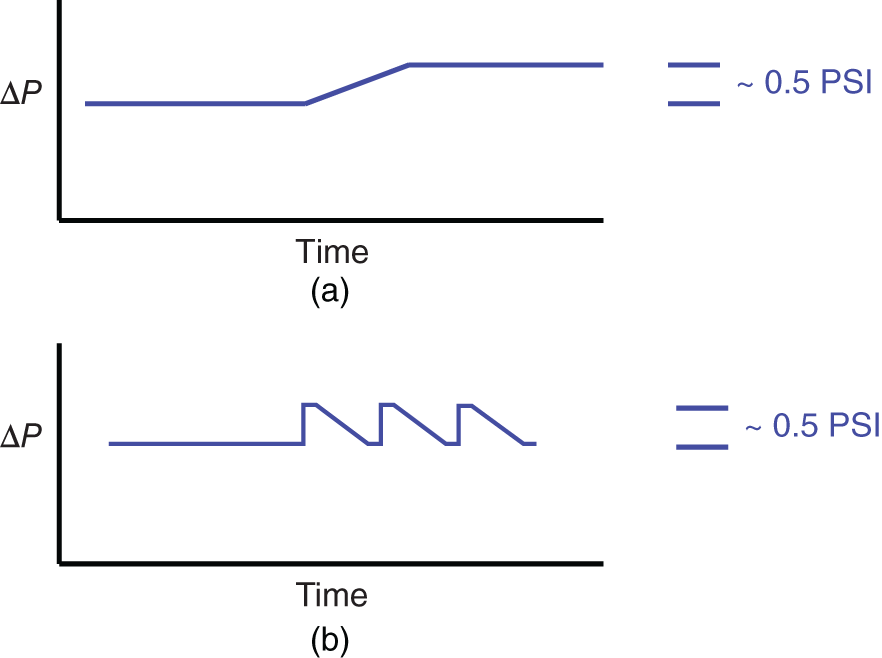
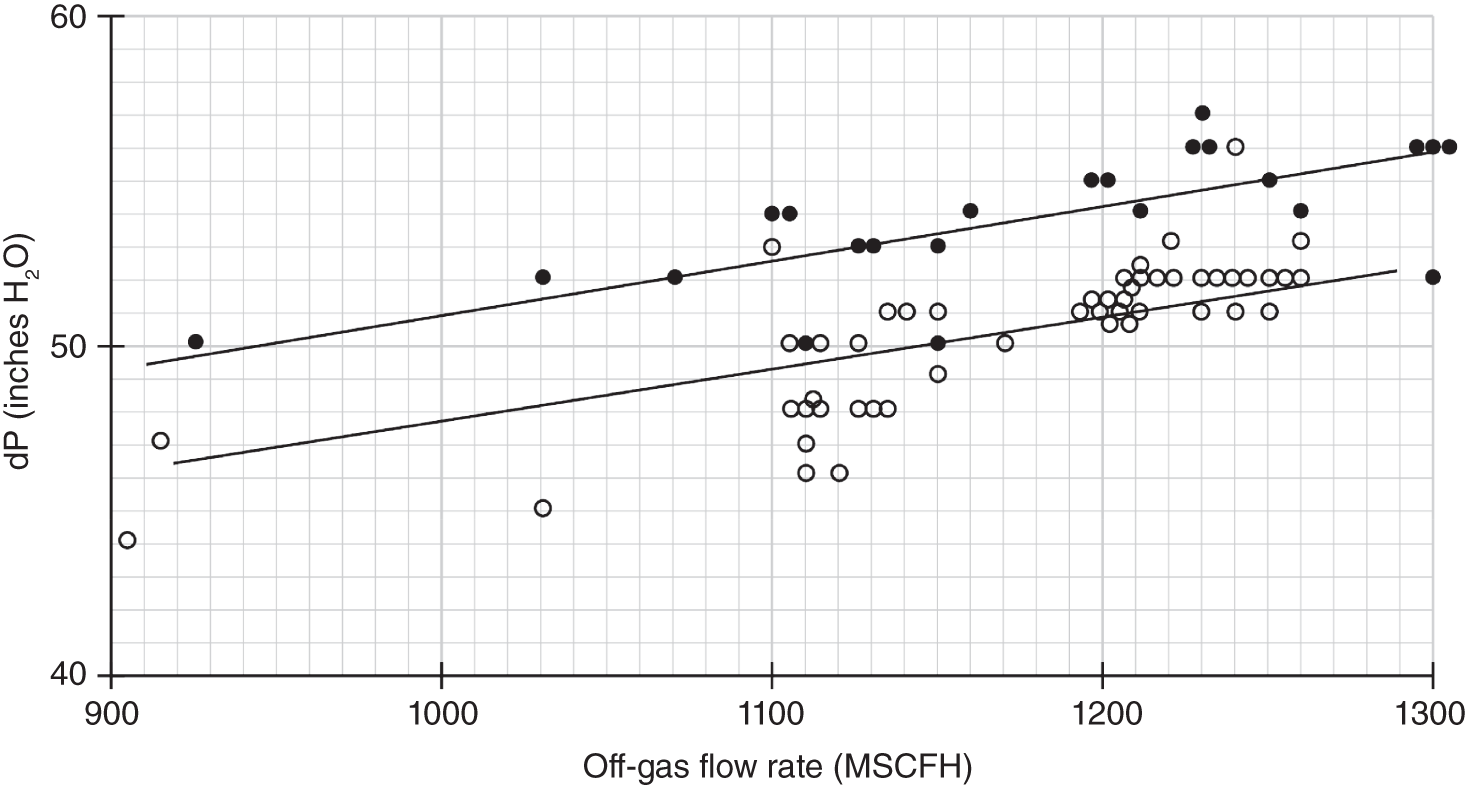
2.9.1 Flood Diagnosis in a Chemical Vacuum Tower with no dP Rise
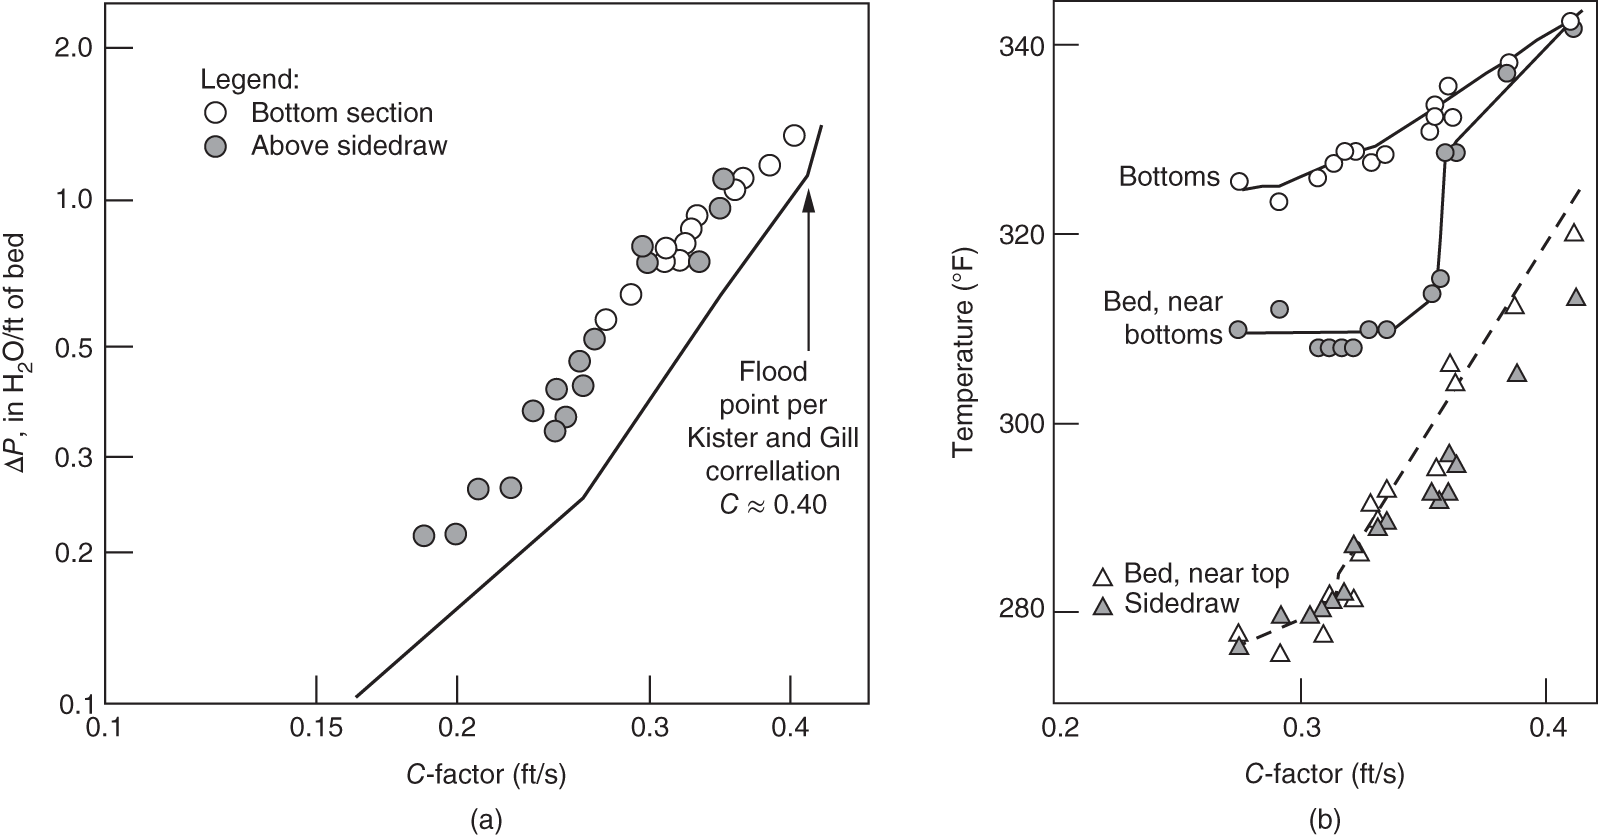
2.9.2 Flood Diagnosis in Packed Pumparound (PA) Beds
2.10 FOAM FLOODING SYMPTOMS AND TESTING
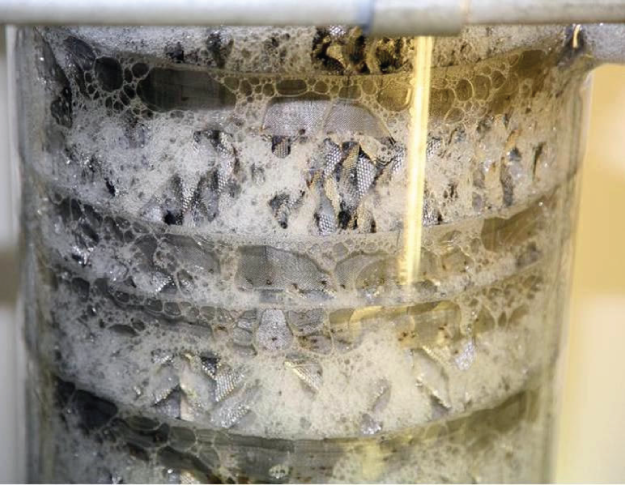
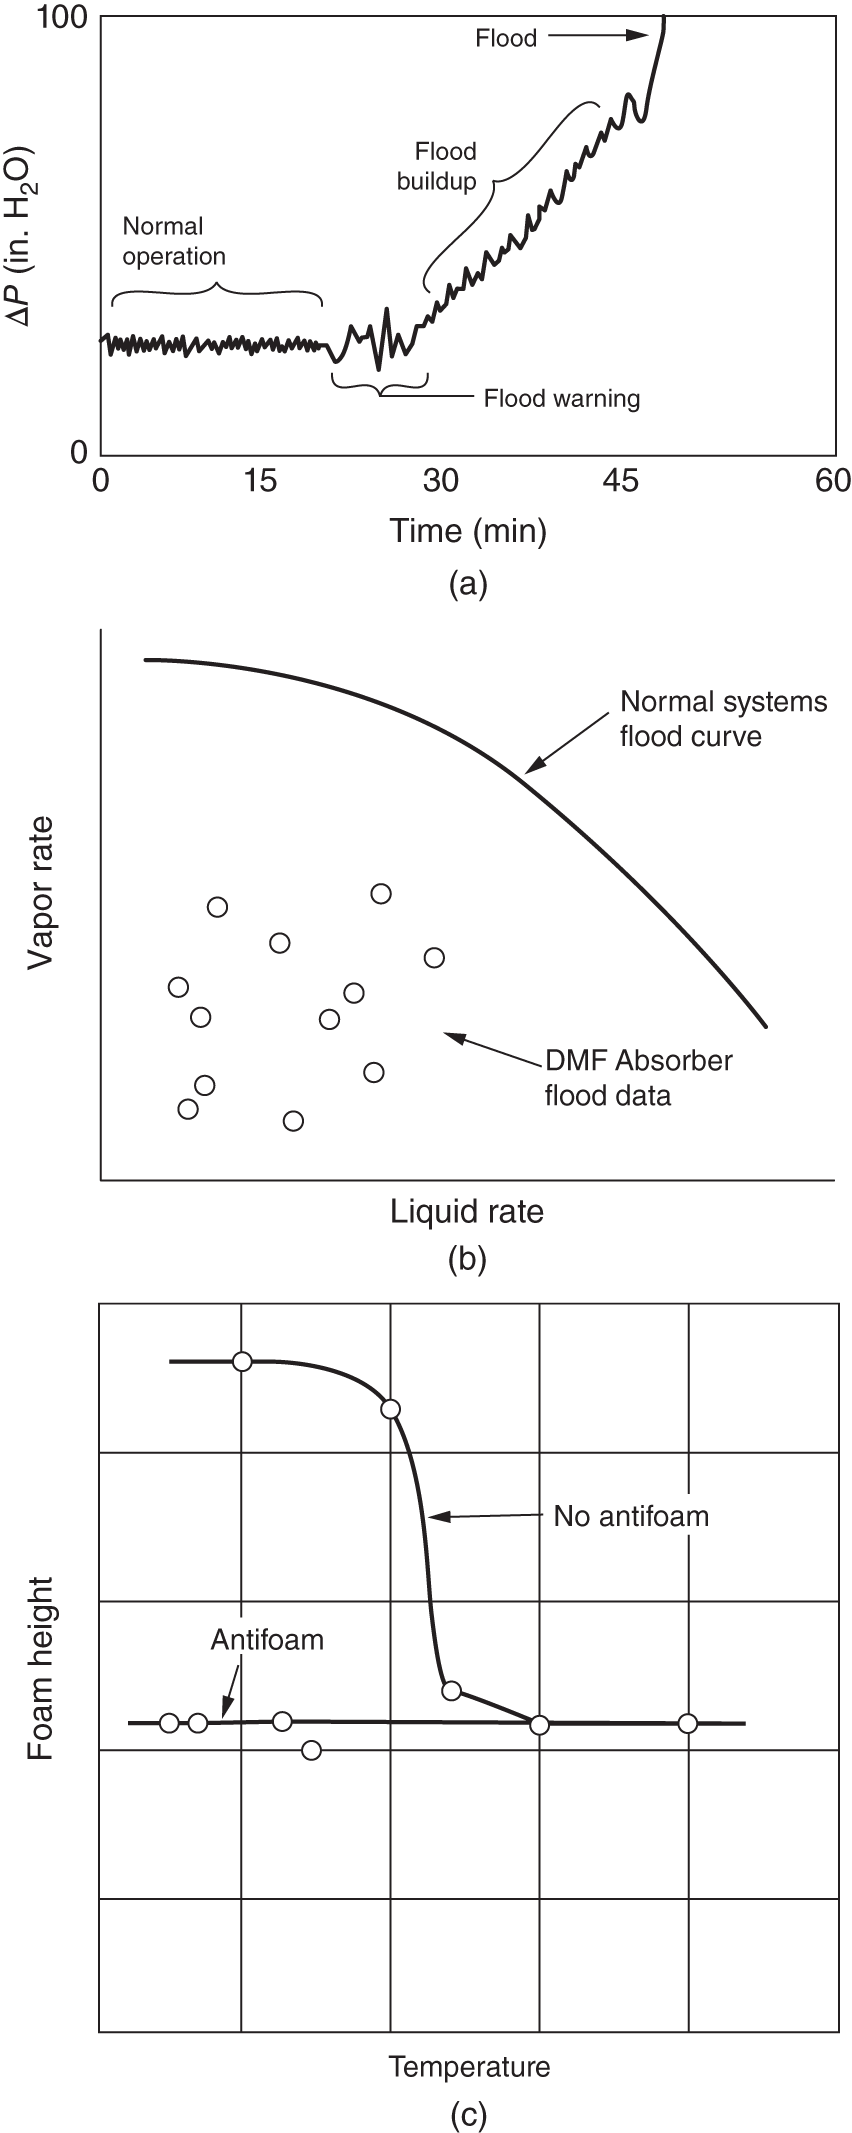
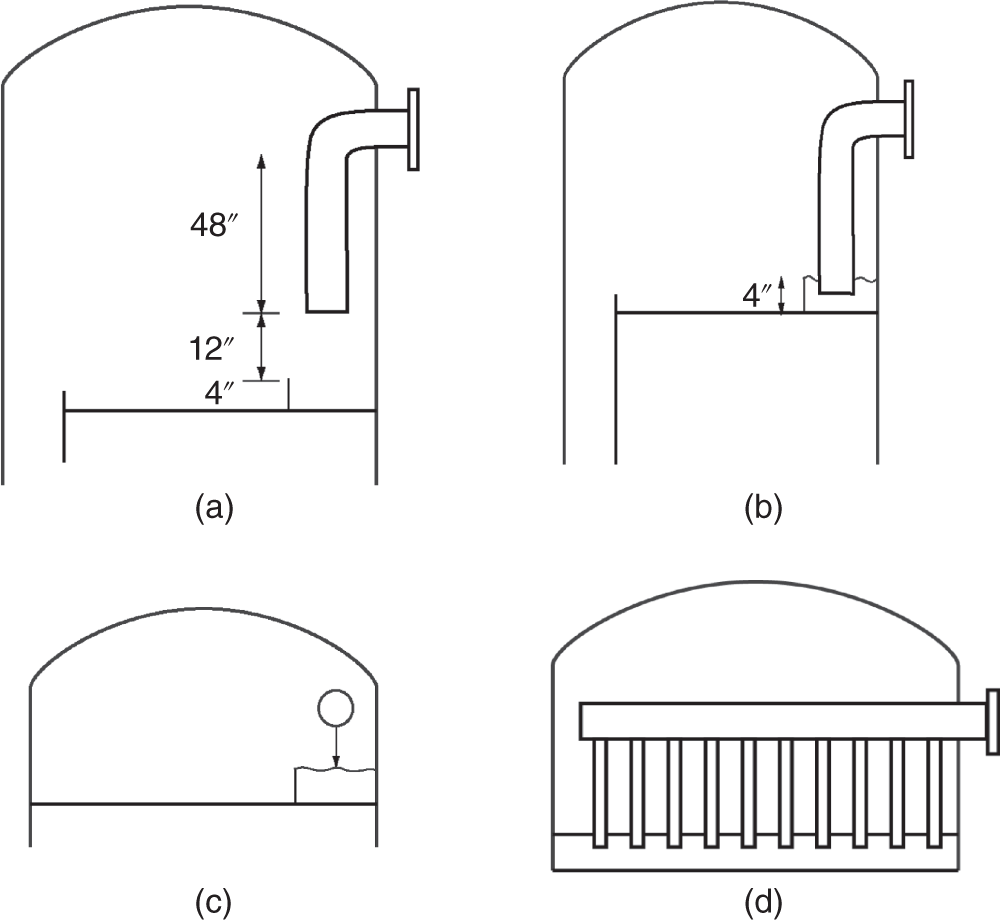
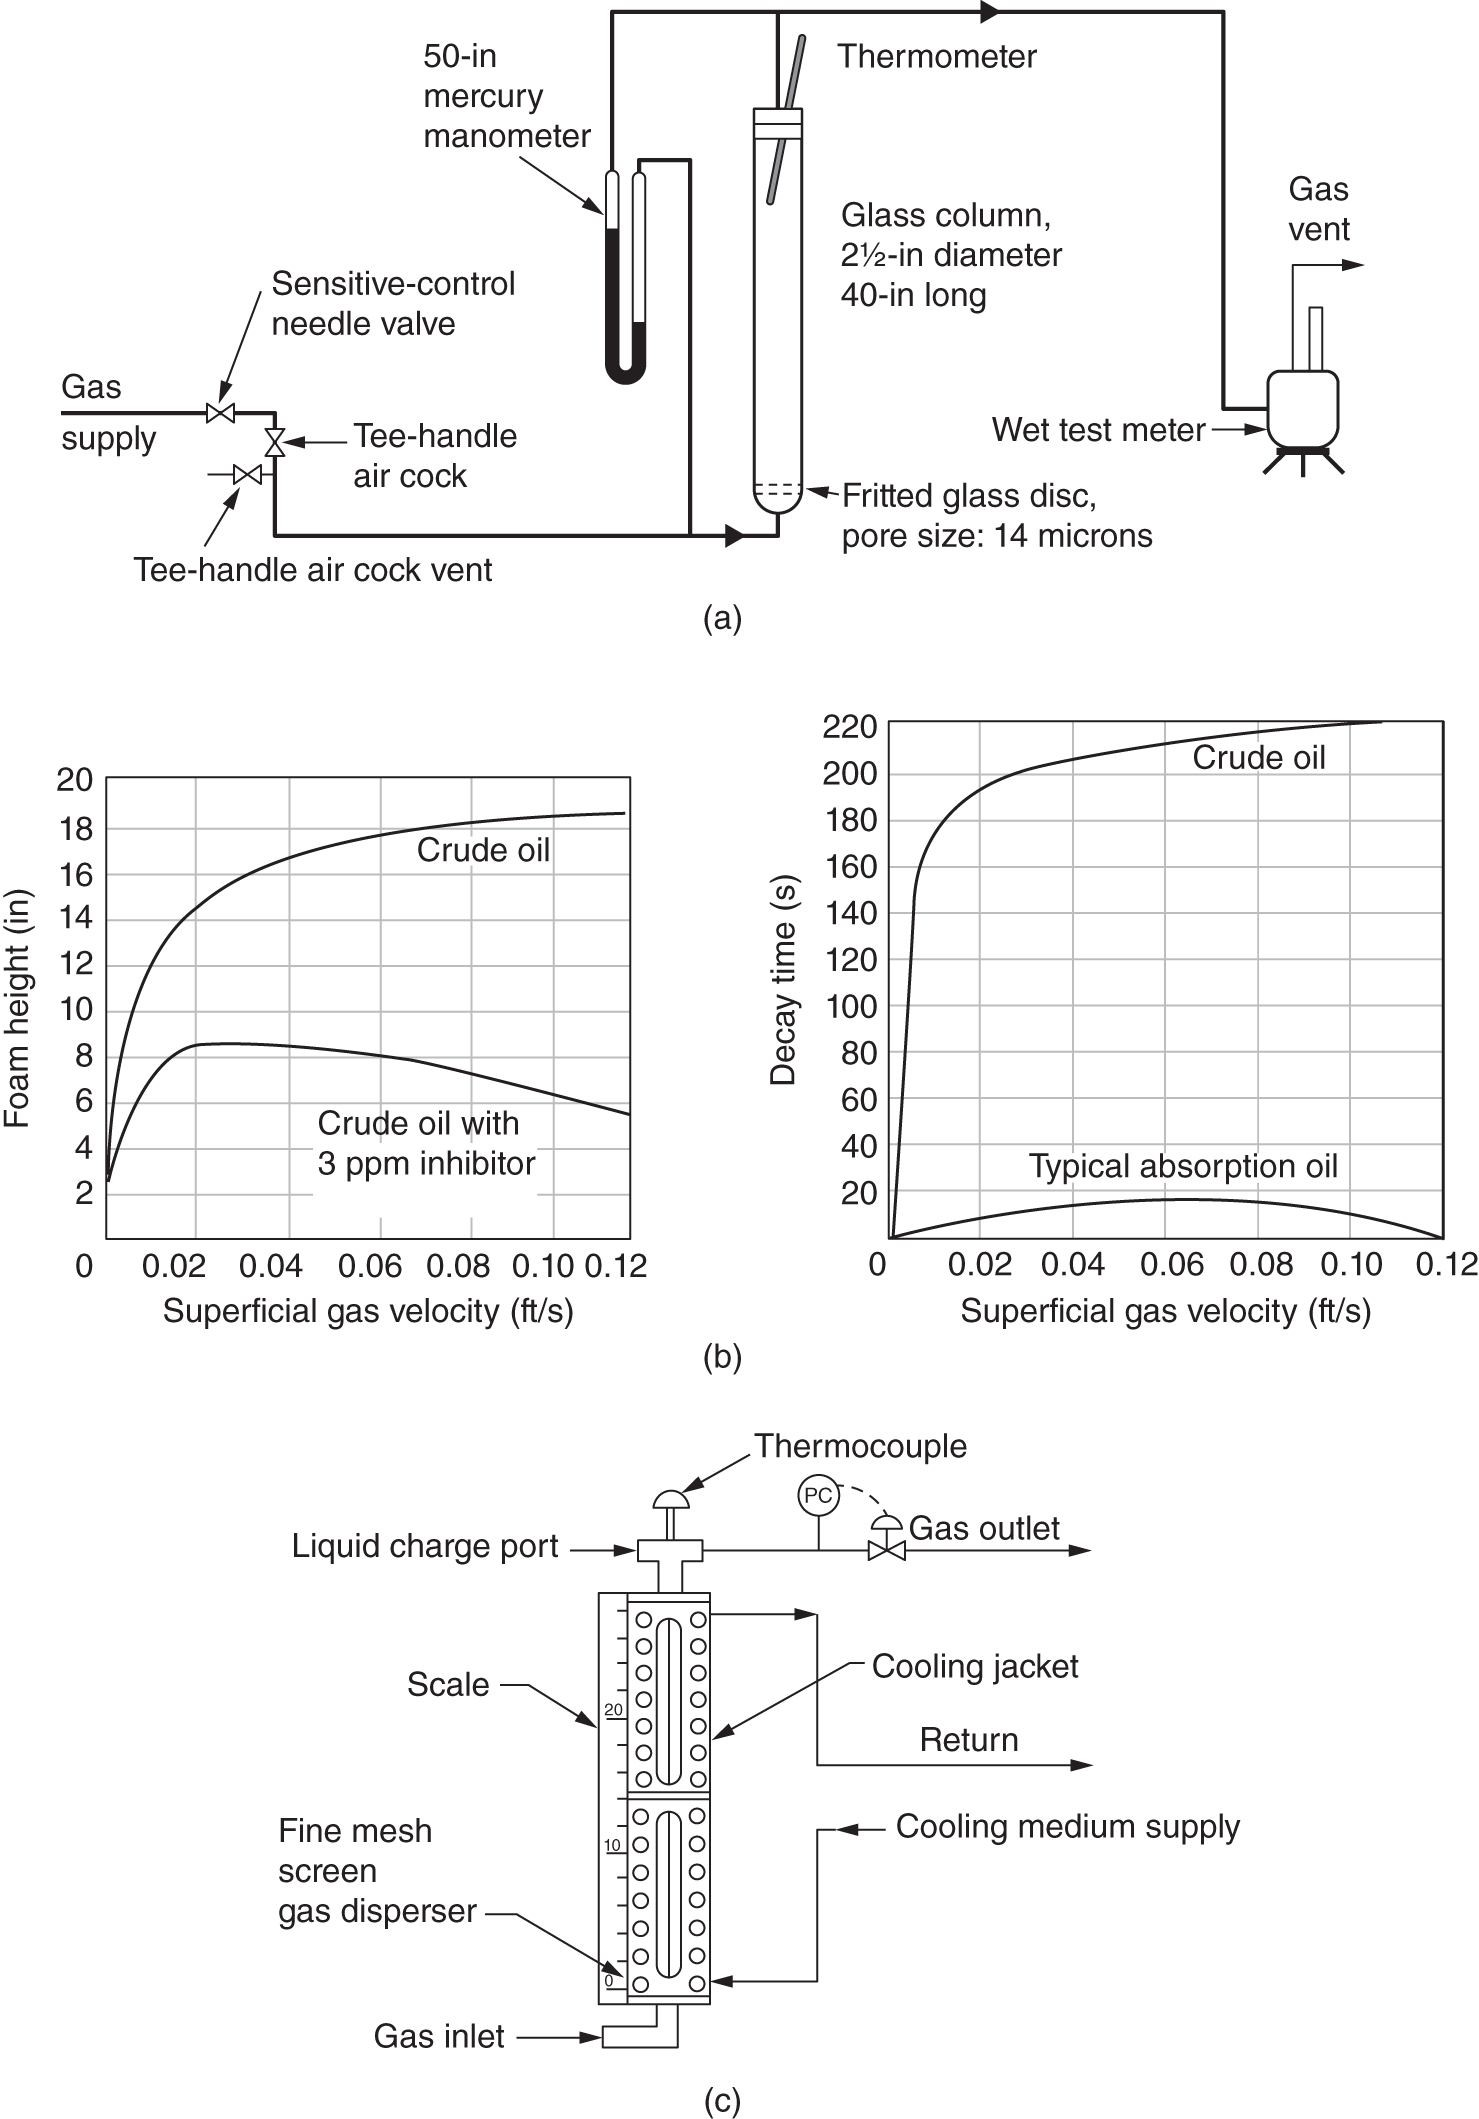
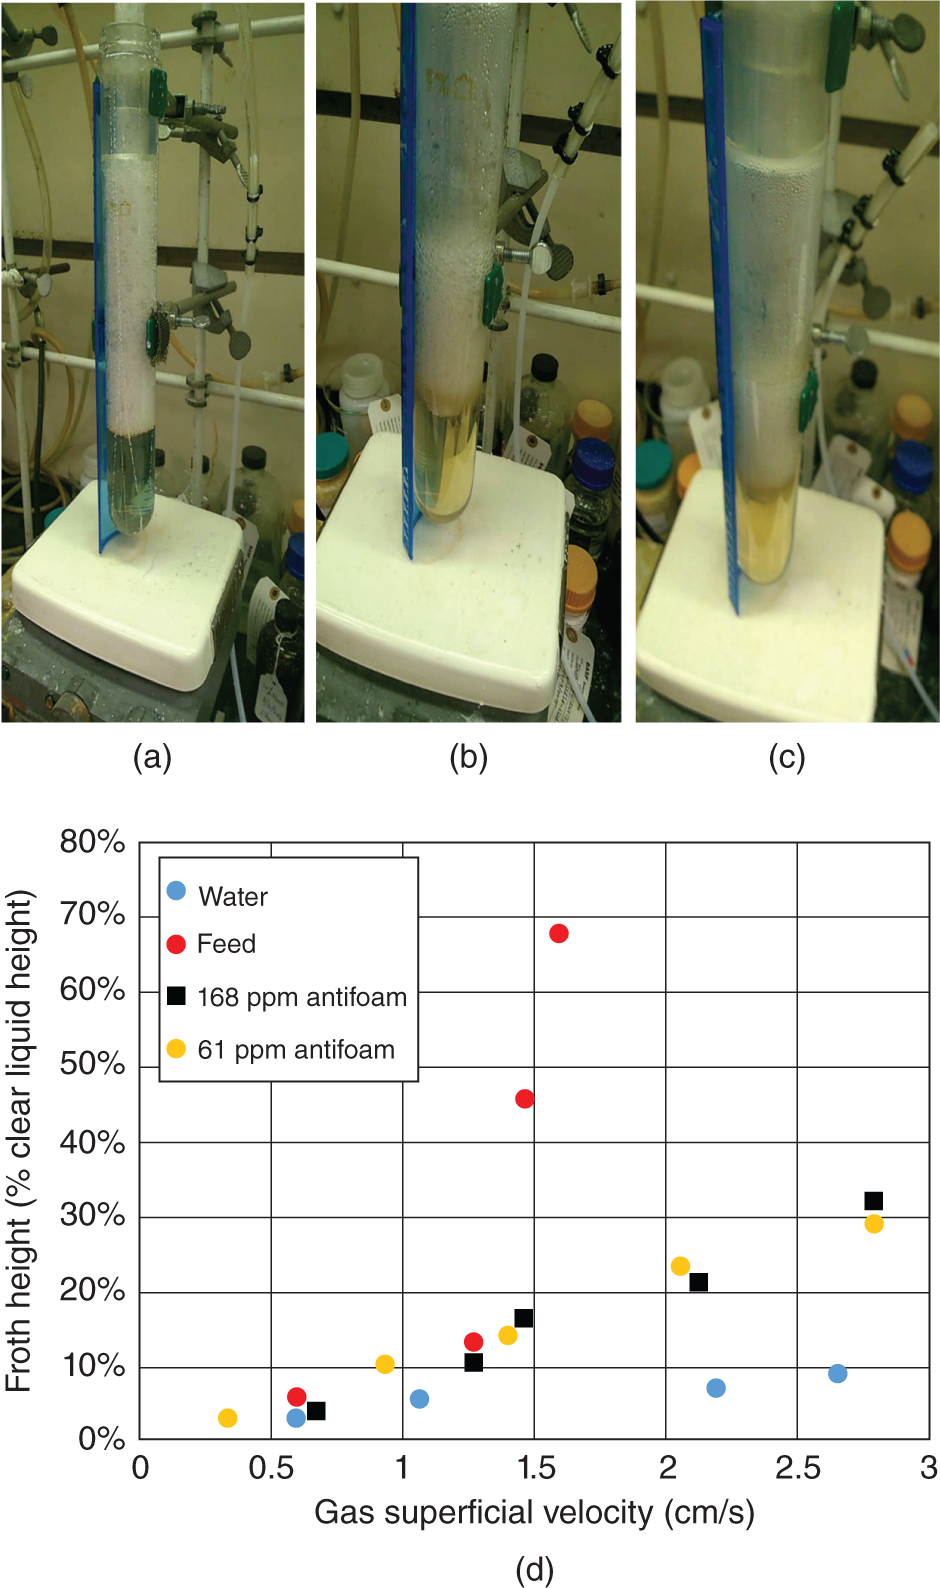
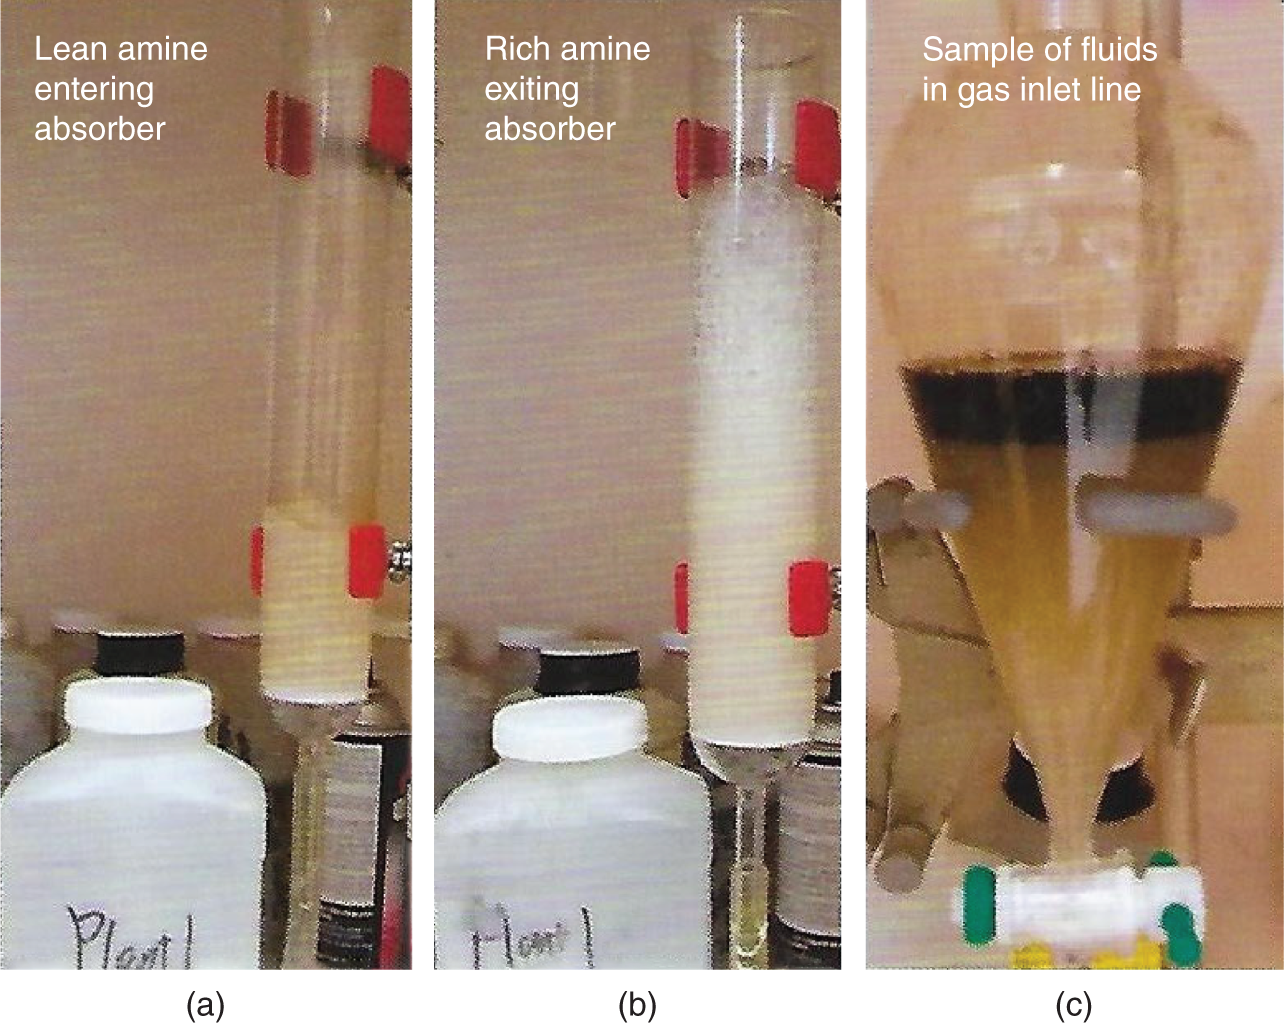
2.11 DOWNCOMER UNSEALING FLOODS AT LOW LIQUID LOADS
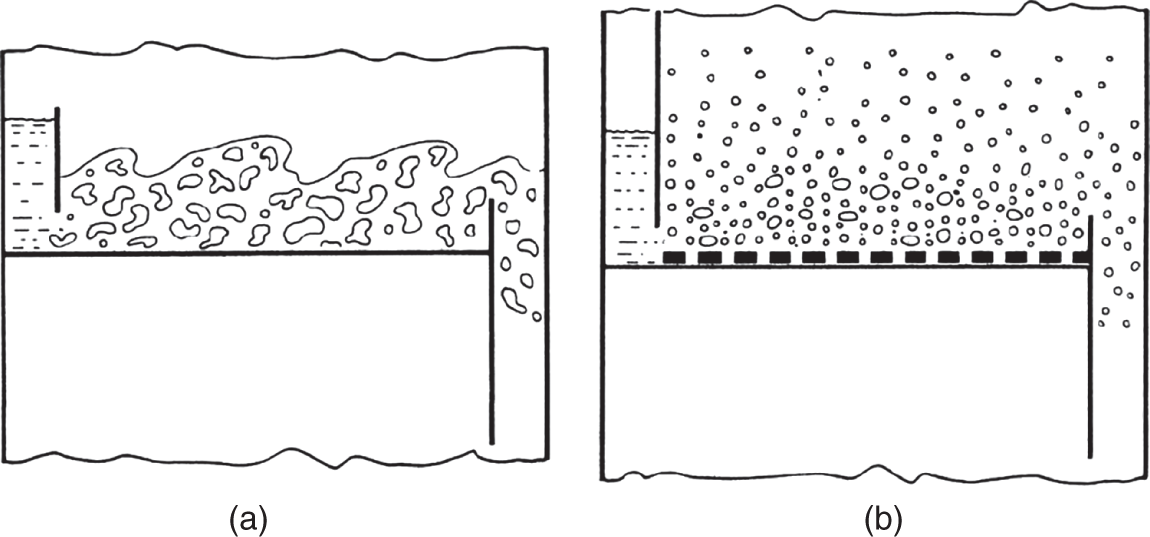
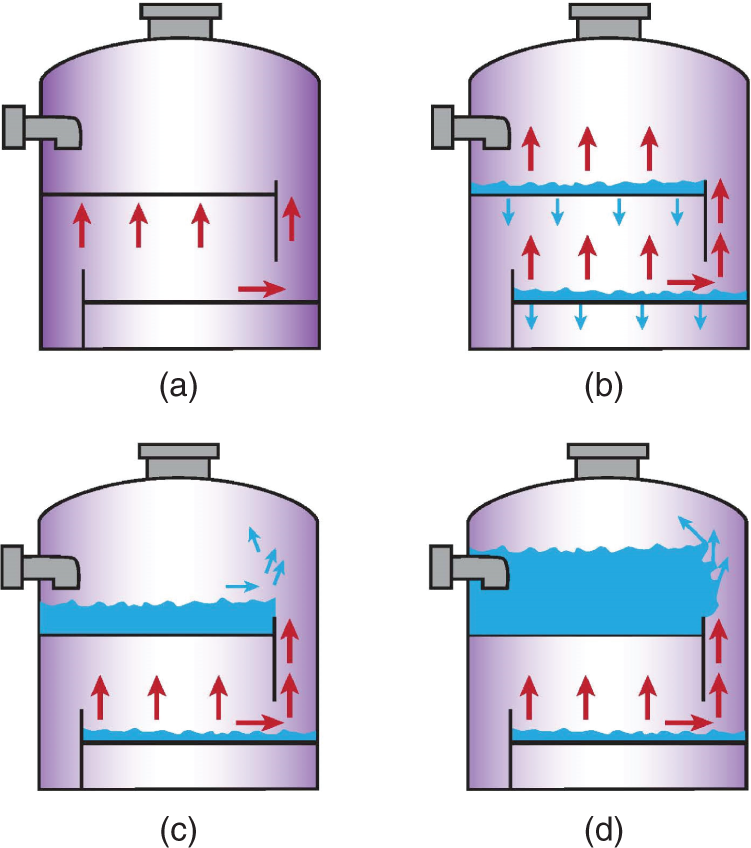
2.12 CHANNELING-INDUCED PREMATURE FLOODS AT HIGH LIQUID LOADS
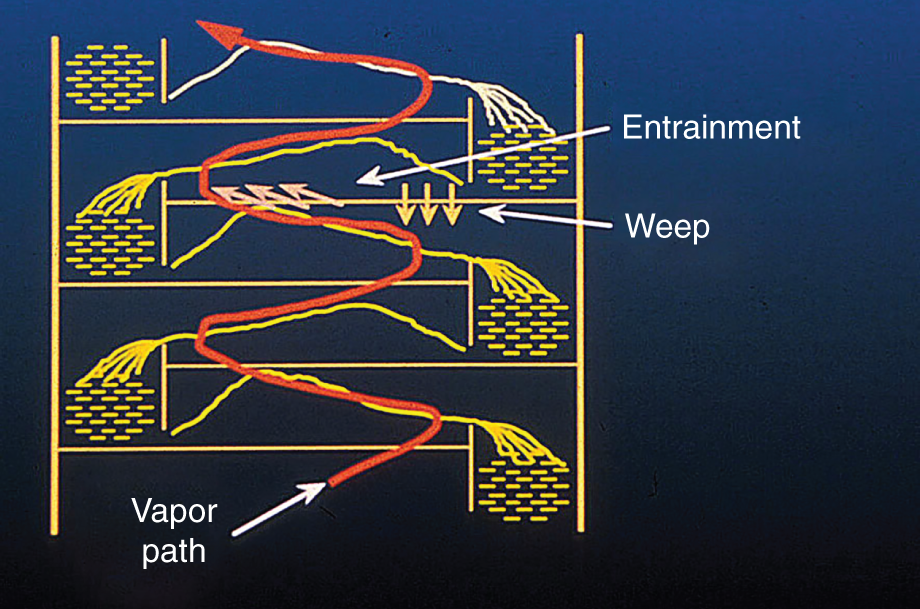
2.13 FLOODS BY HIGH BASE LEVEL OR ENTRAINMENT FROM THE TOWER BASE
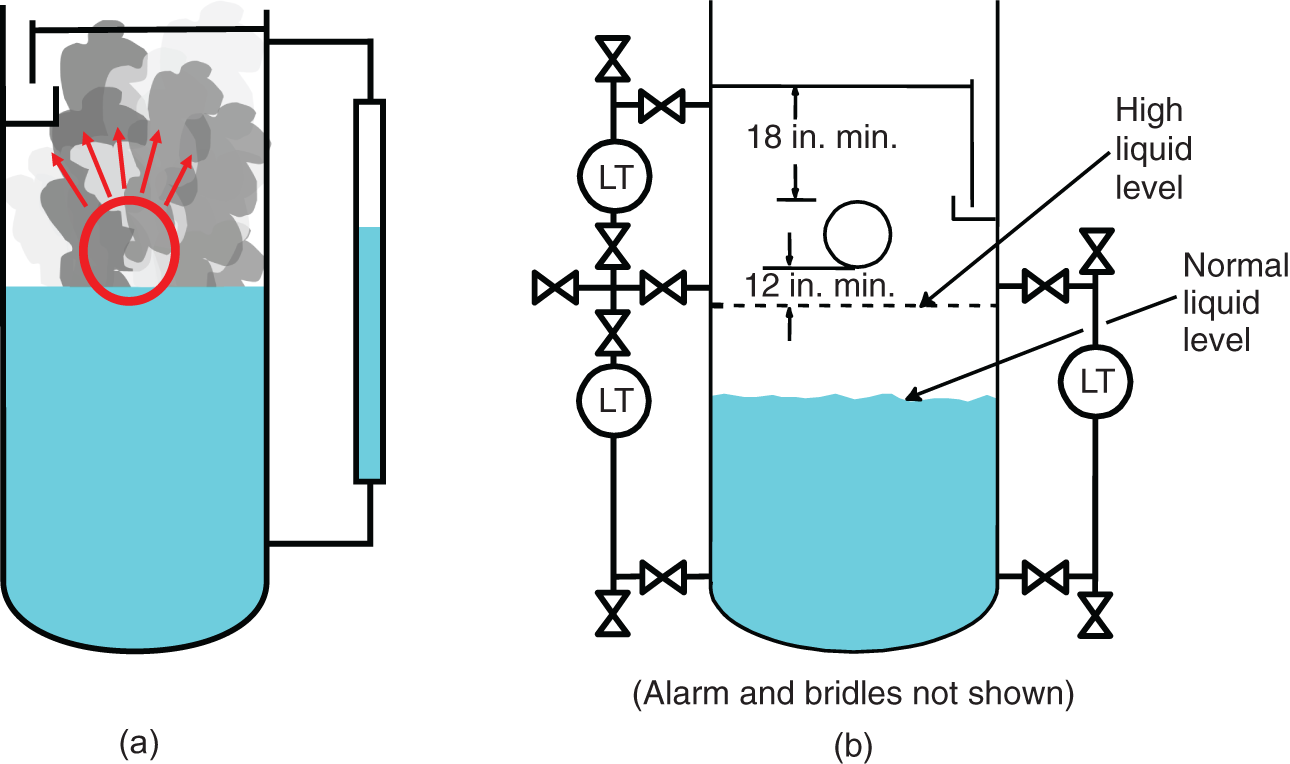
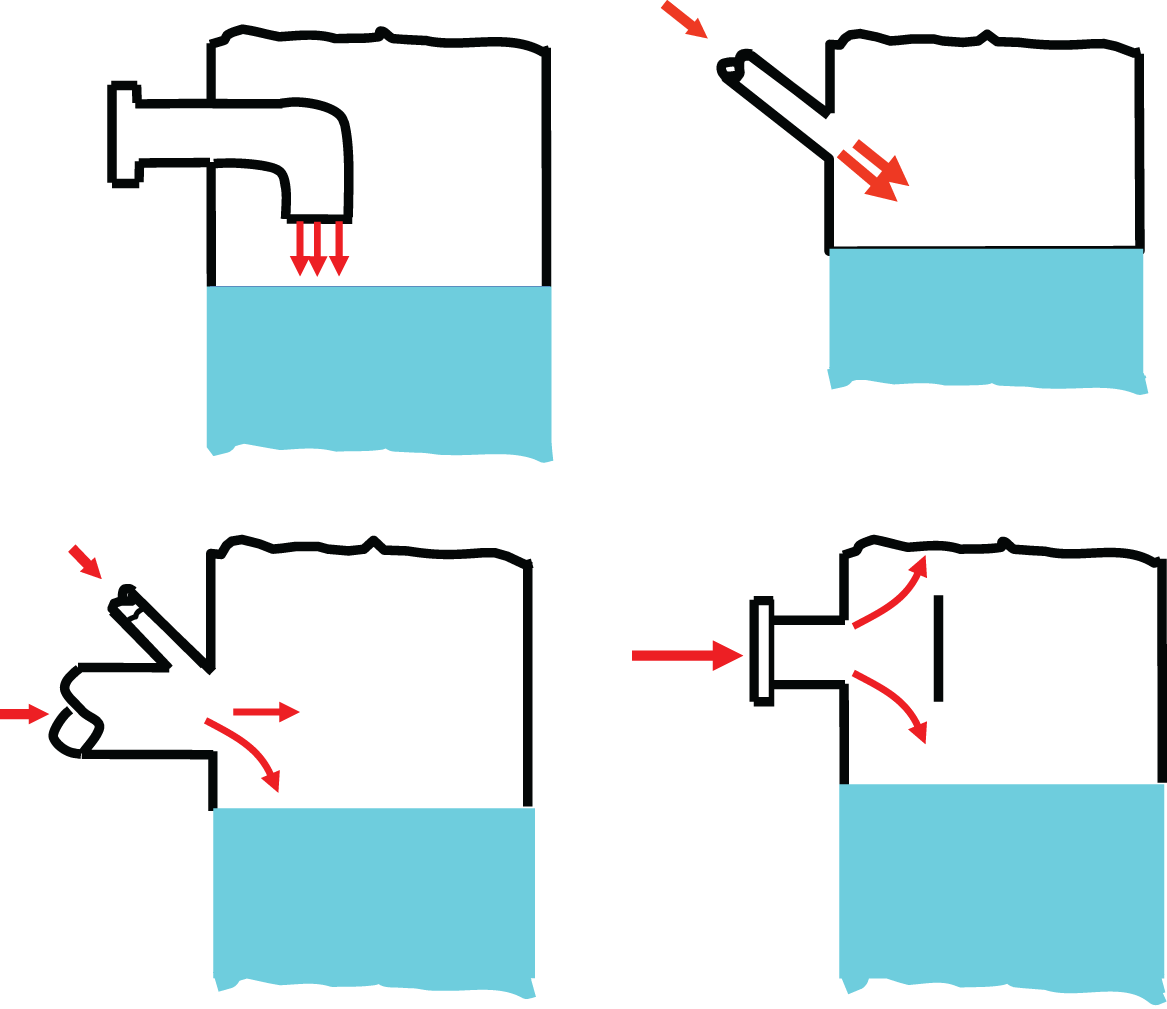
2.14 TROUBLESHOOTING INTERMEDIATE COMPONENT ACCUMULATION
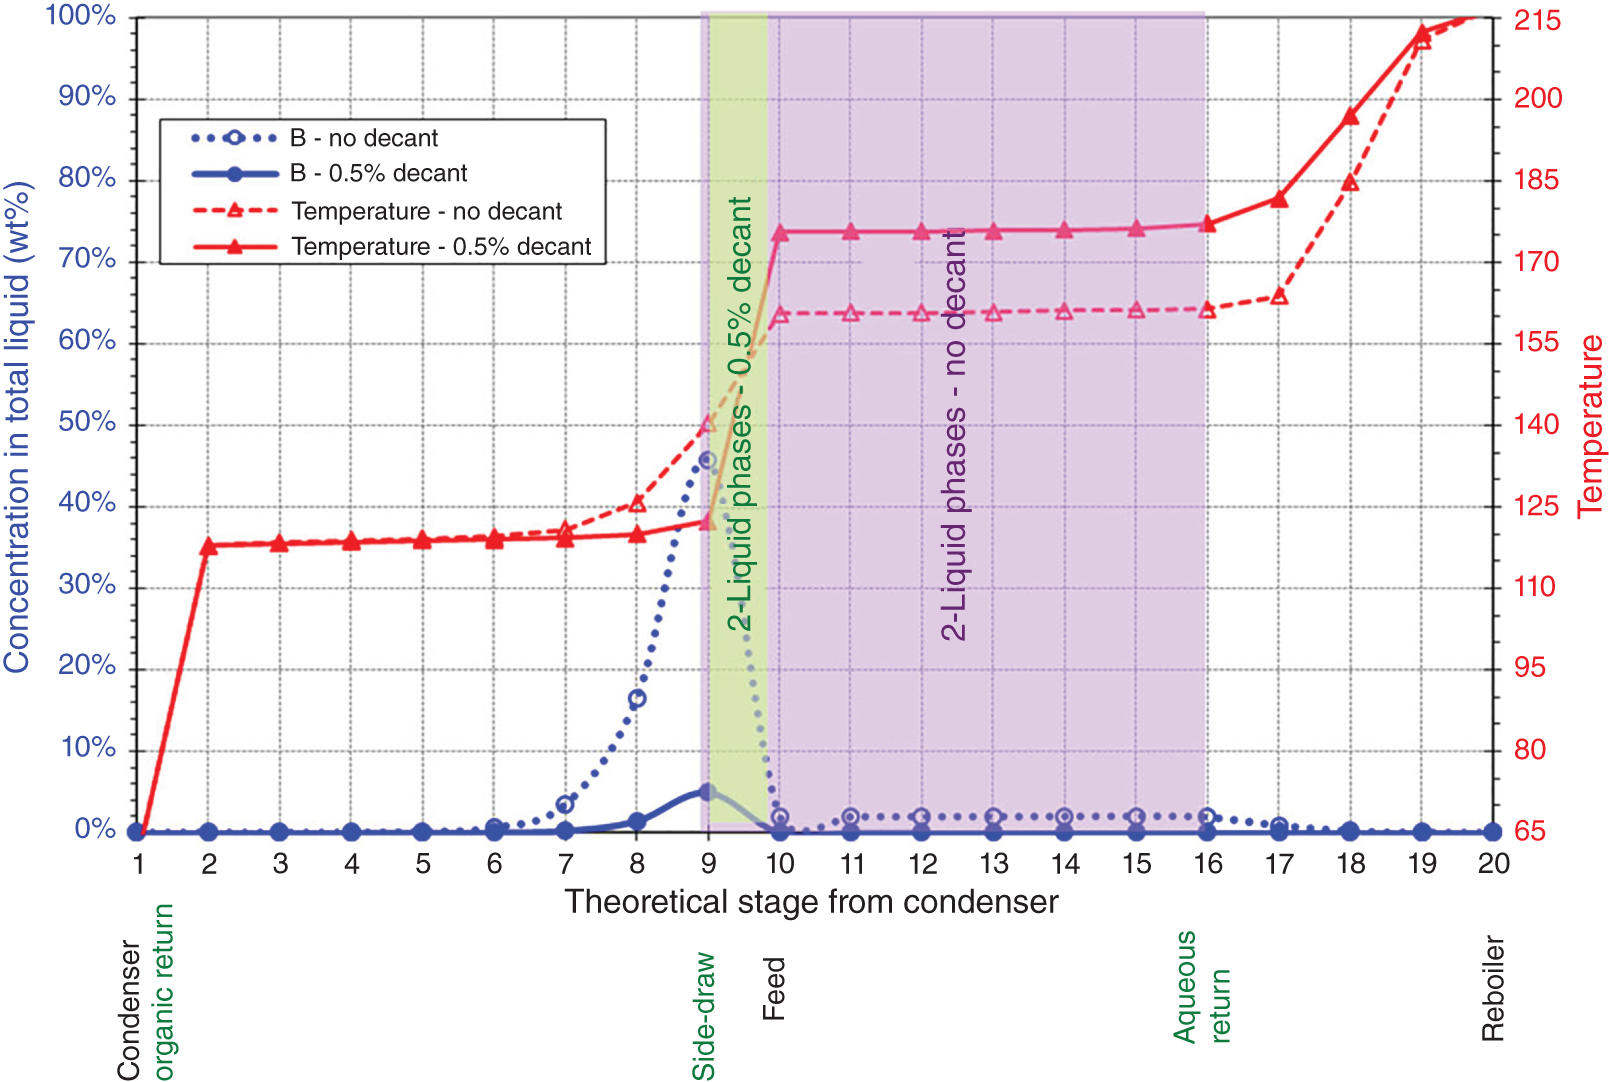
2.15 TROUBLESHOOTING LIQUID SIDE DRAW BOTTLENECKS
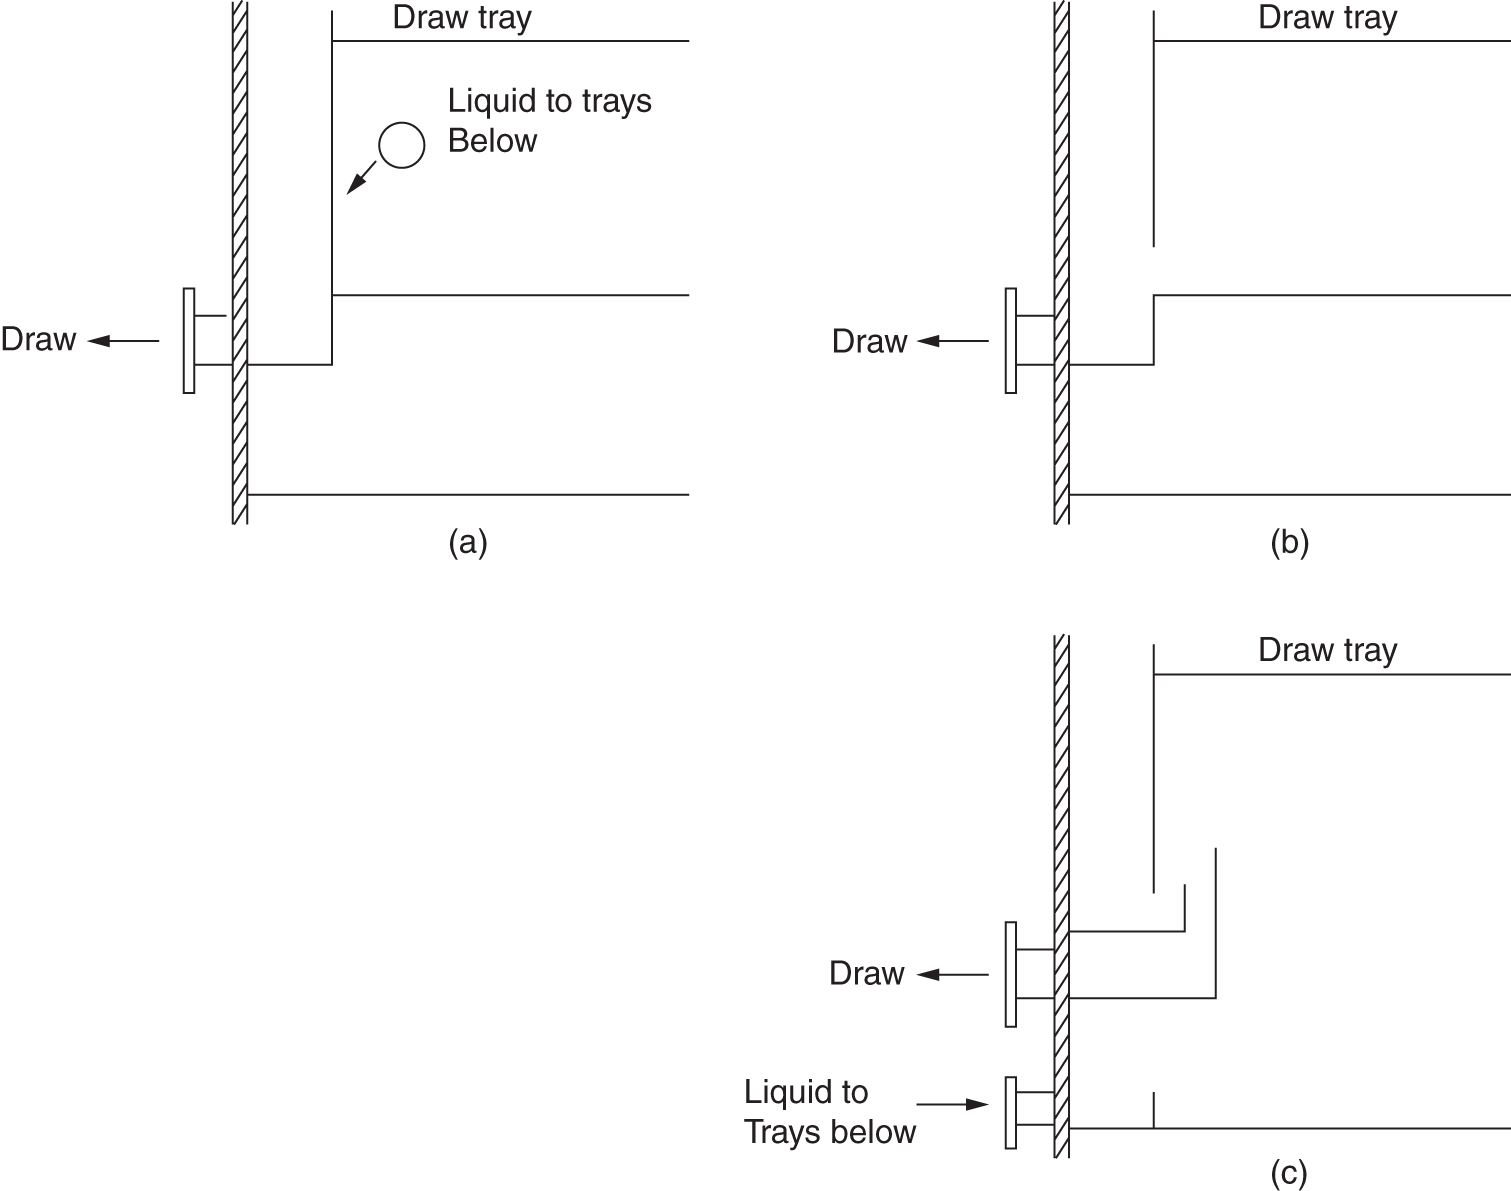
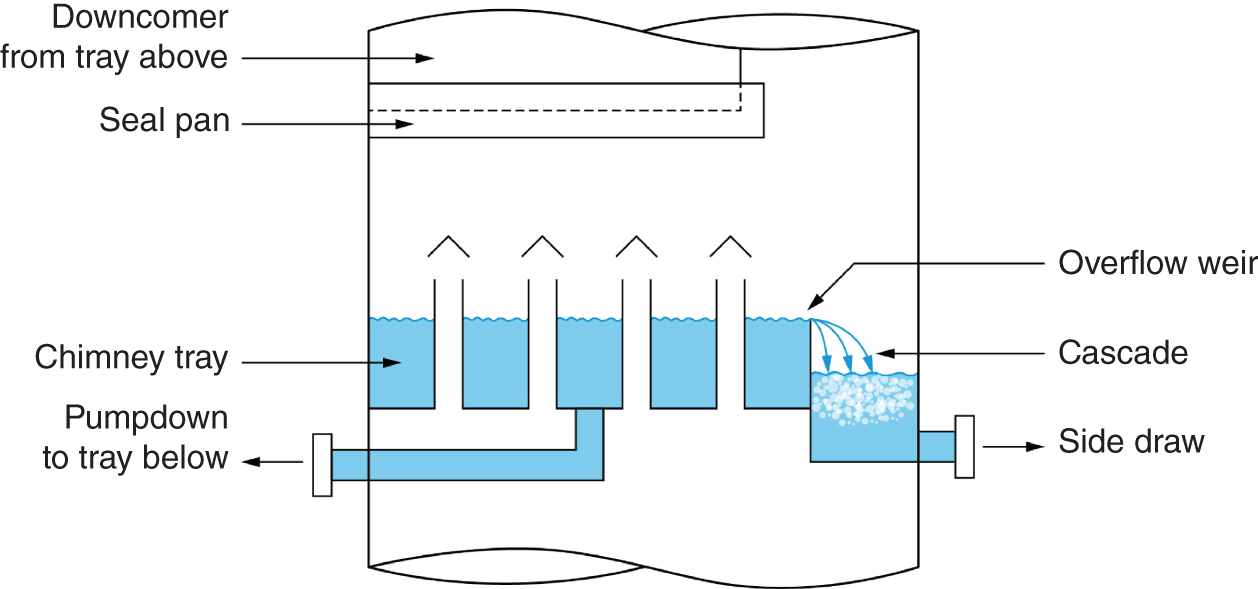
2.16 TWELVE USEFUL RULES OF THUMB
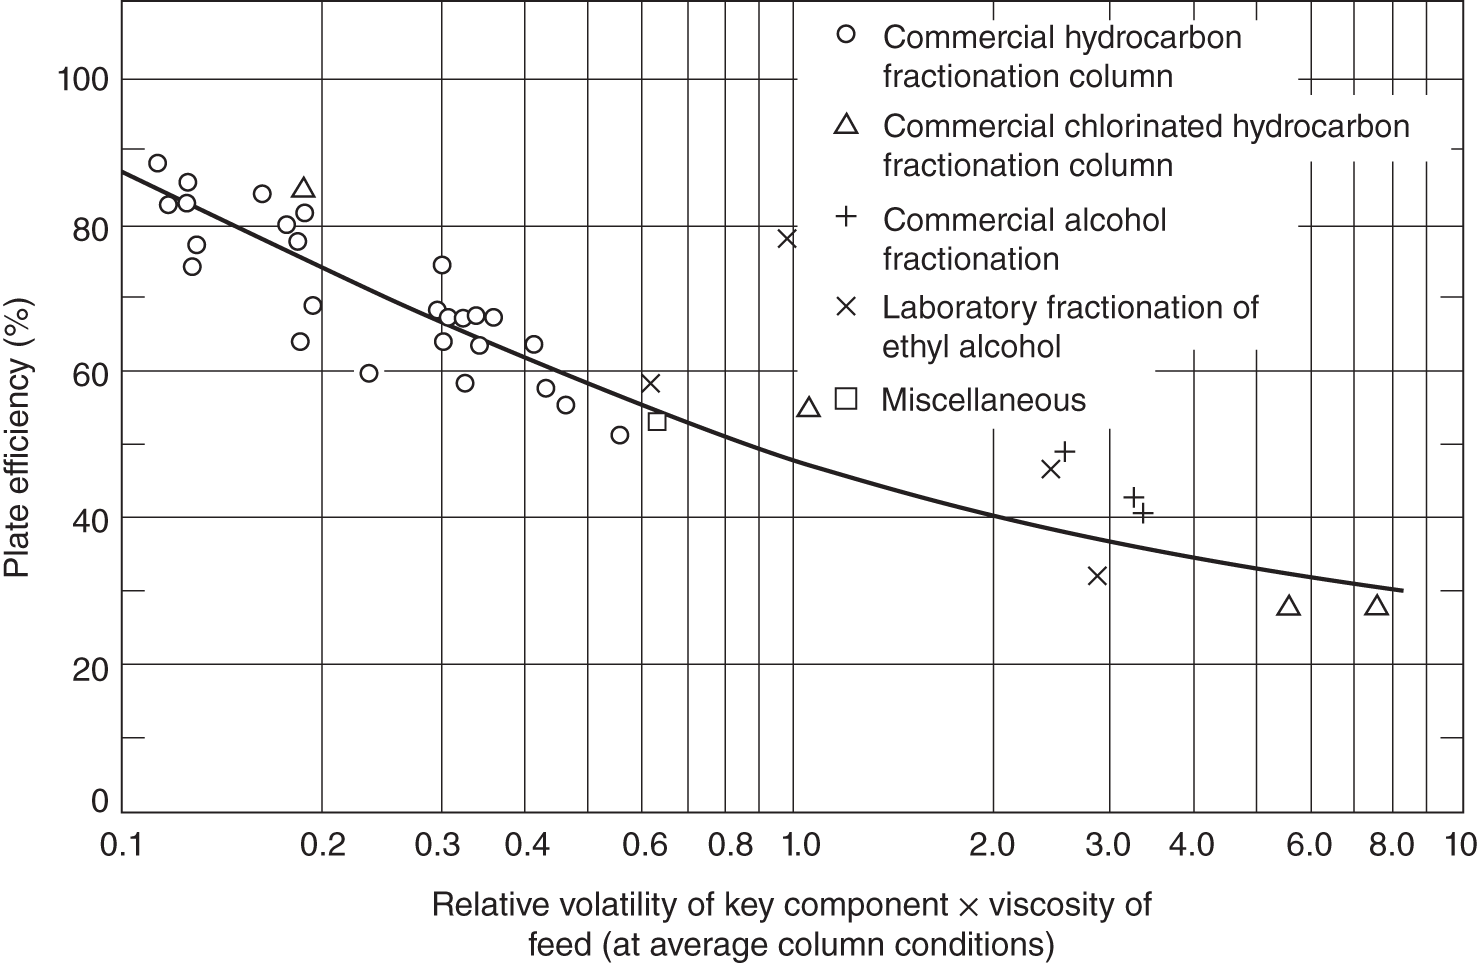

Troubleshooting for Flood
(2.3)
(2.4)
(2.5)
where Q is the liquid flow rate, gpm; KD is the orifice discharge coefficient, with a recommended value of 0.707 (68, 161, 192, 245); nD is the number of holes; dh is the hole diameter, inches; and h is the net liquid head, inches. See Section 4.6.2 for pressure drop and buoyancy corrections.(2.6)