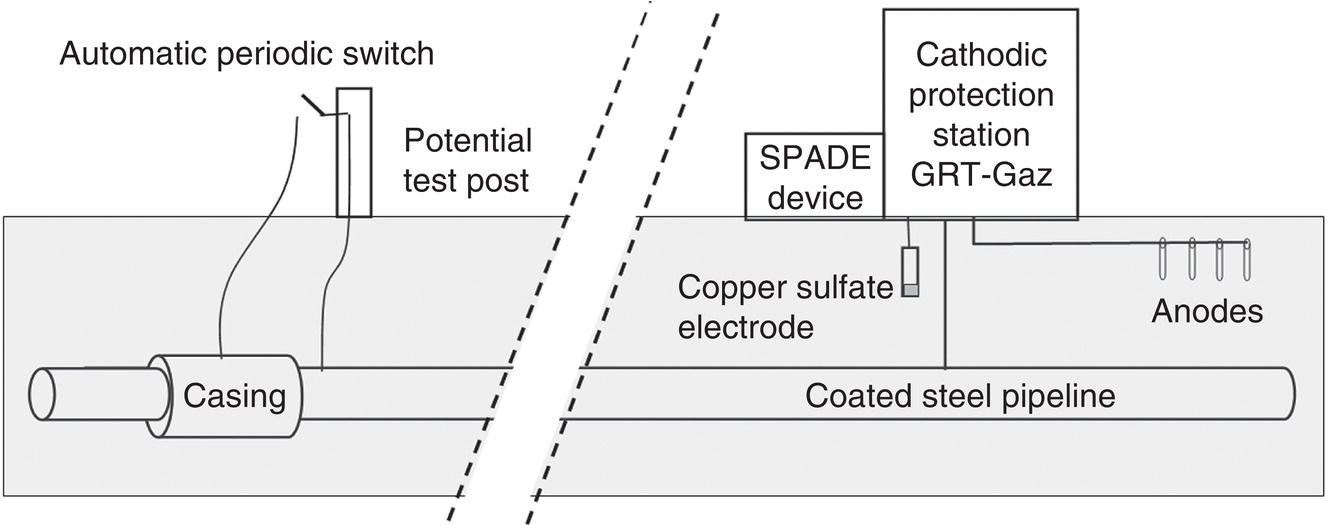
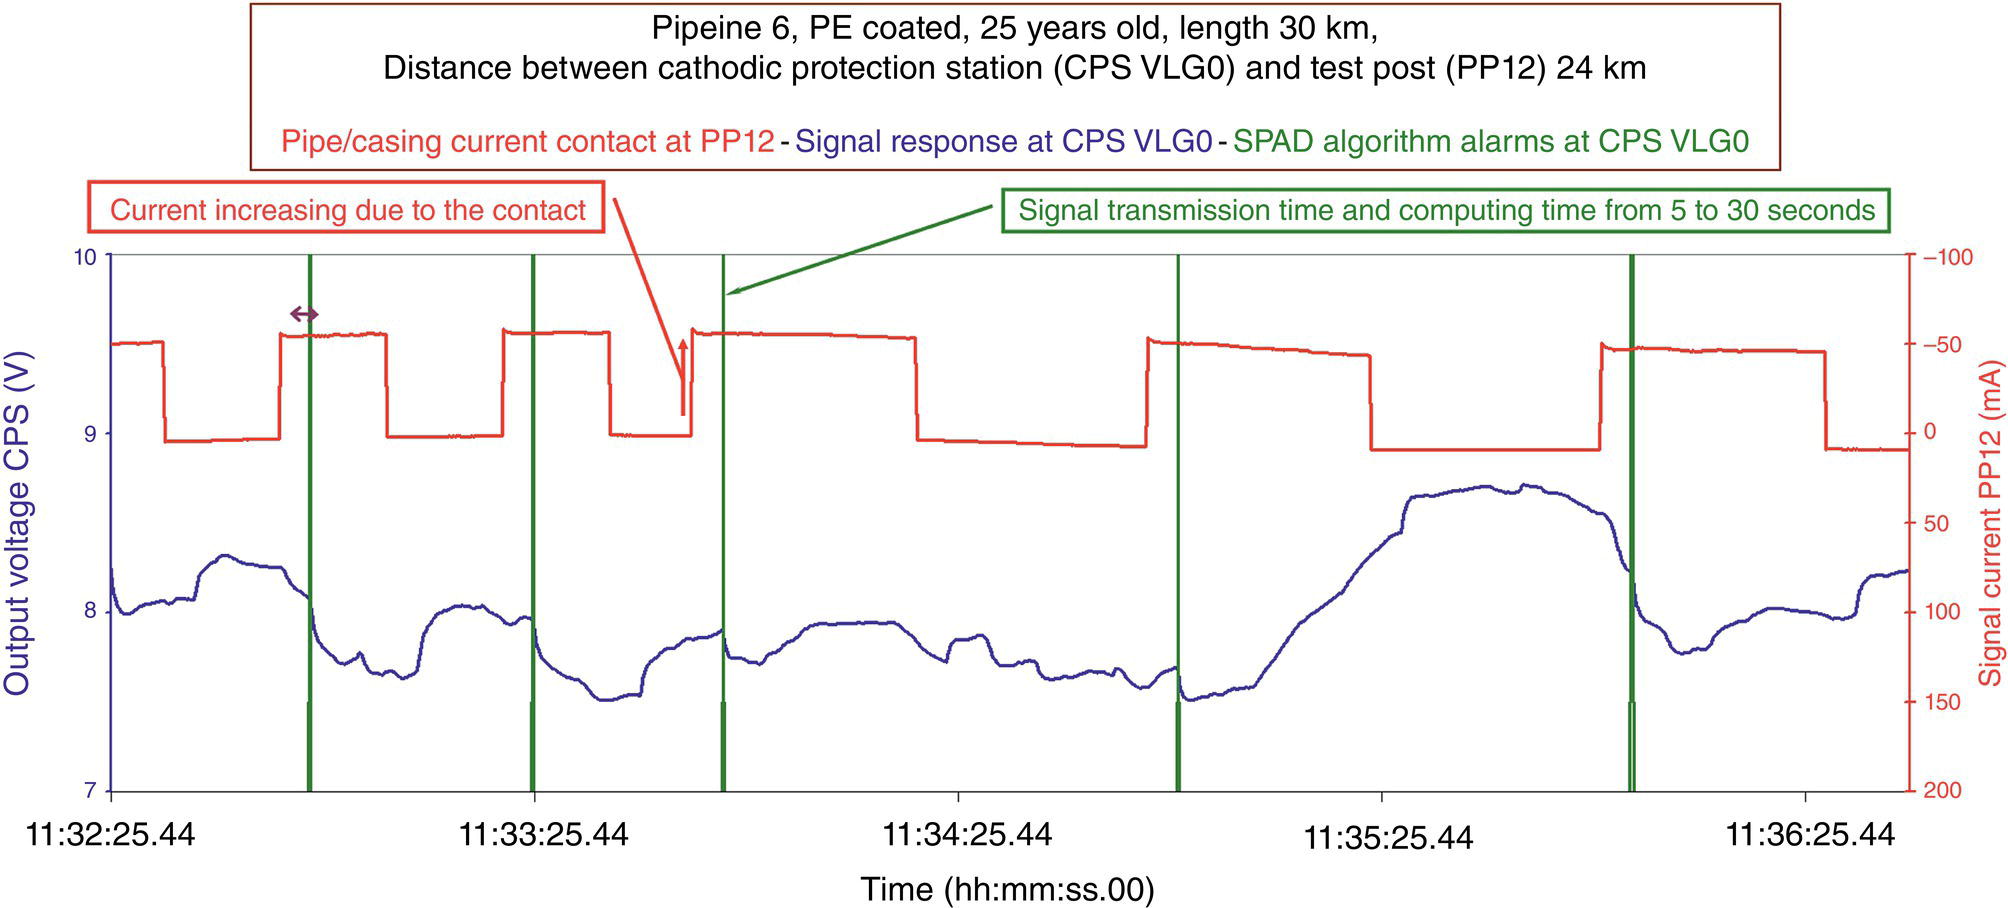
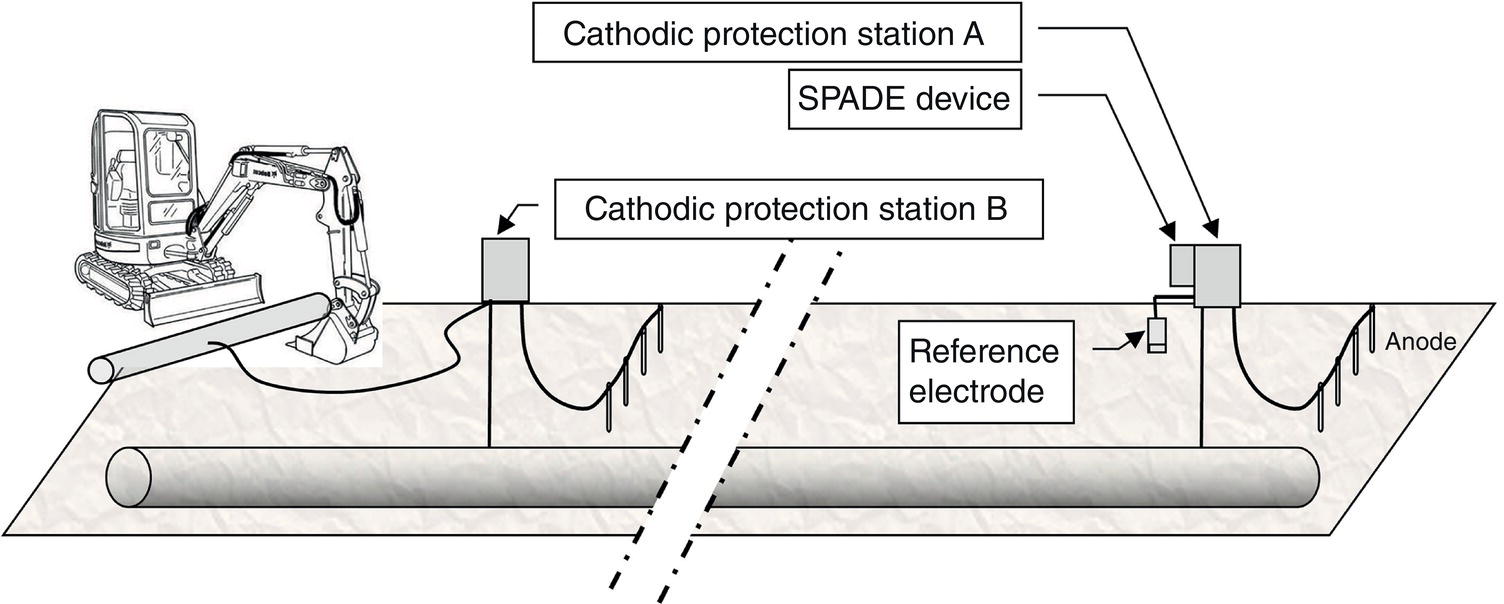
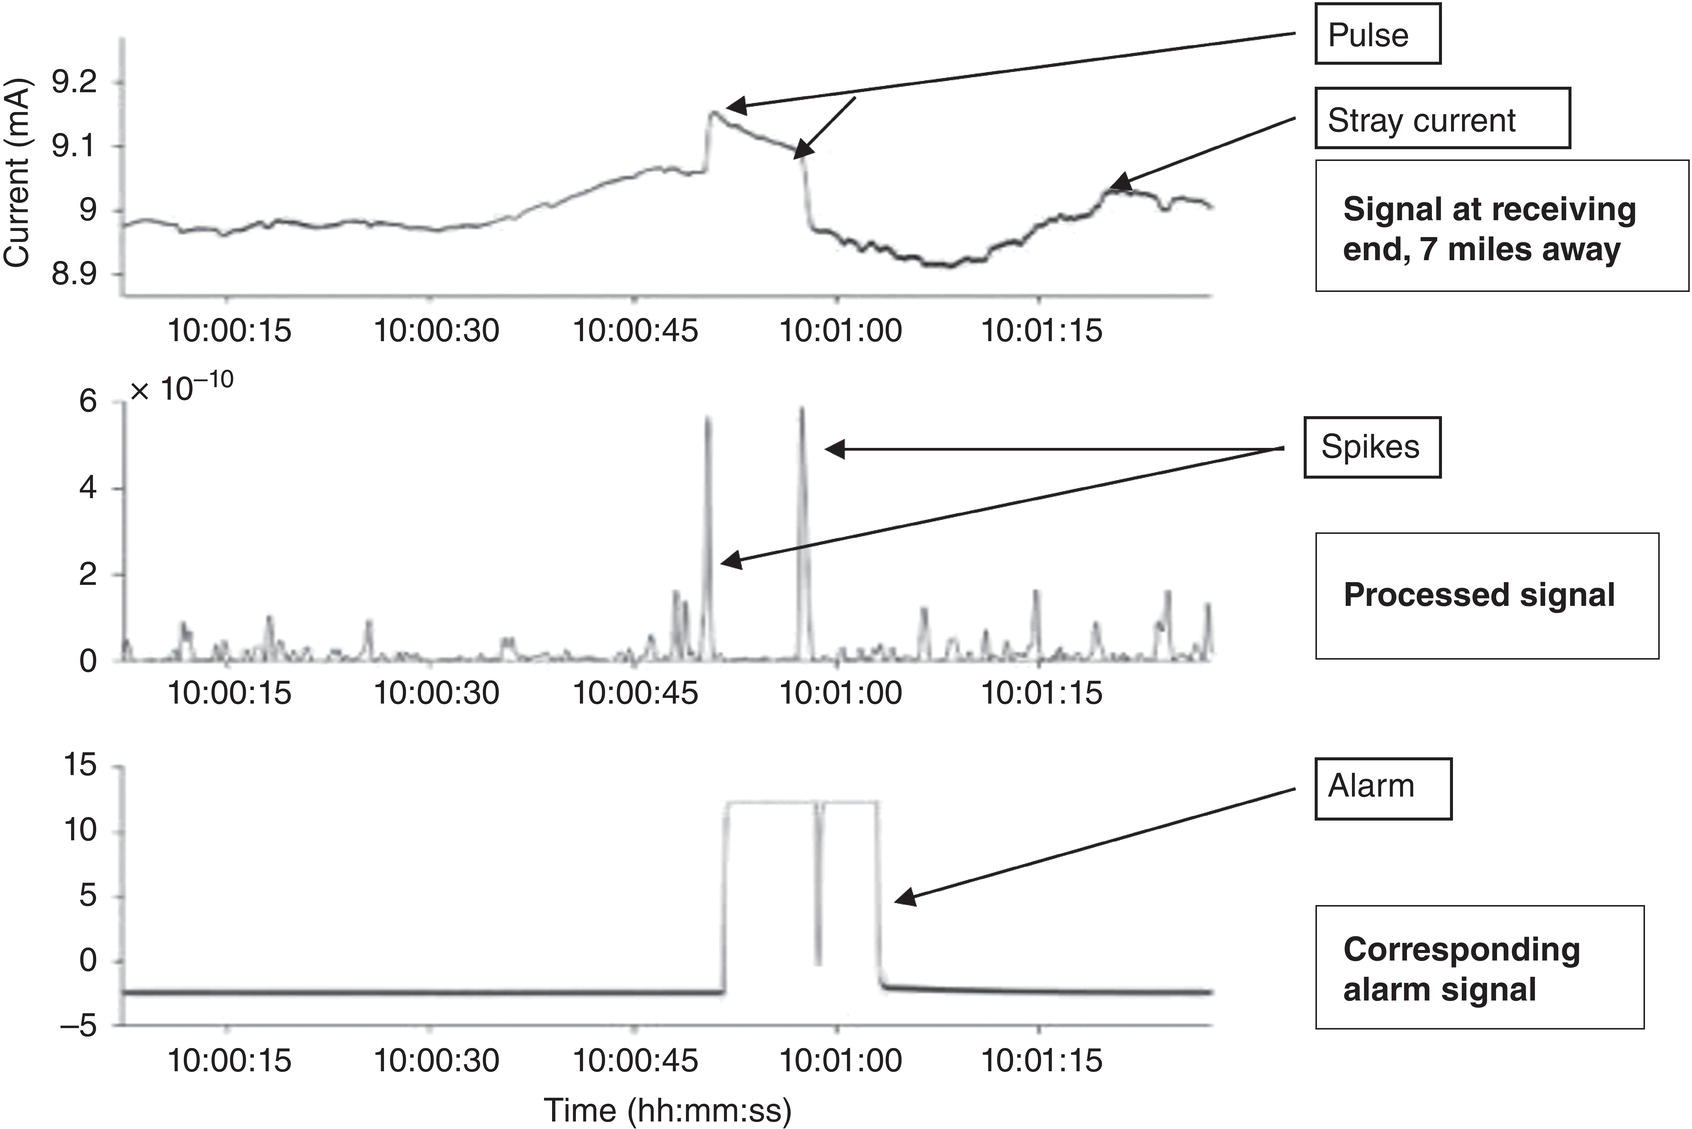
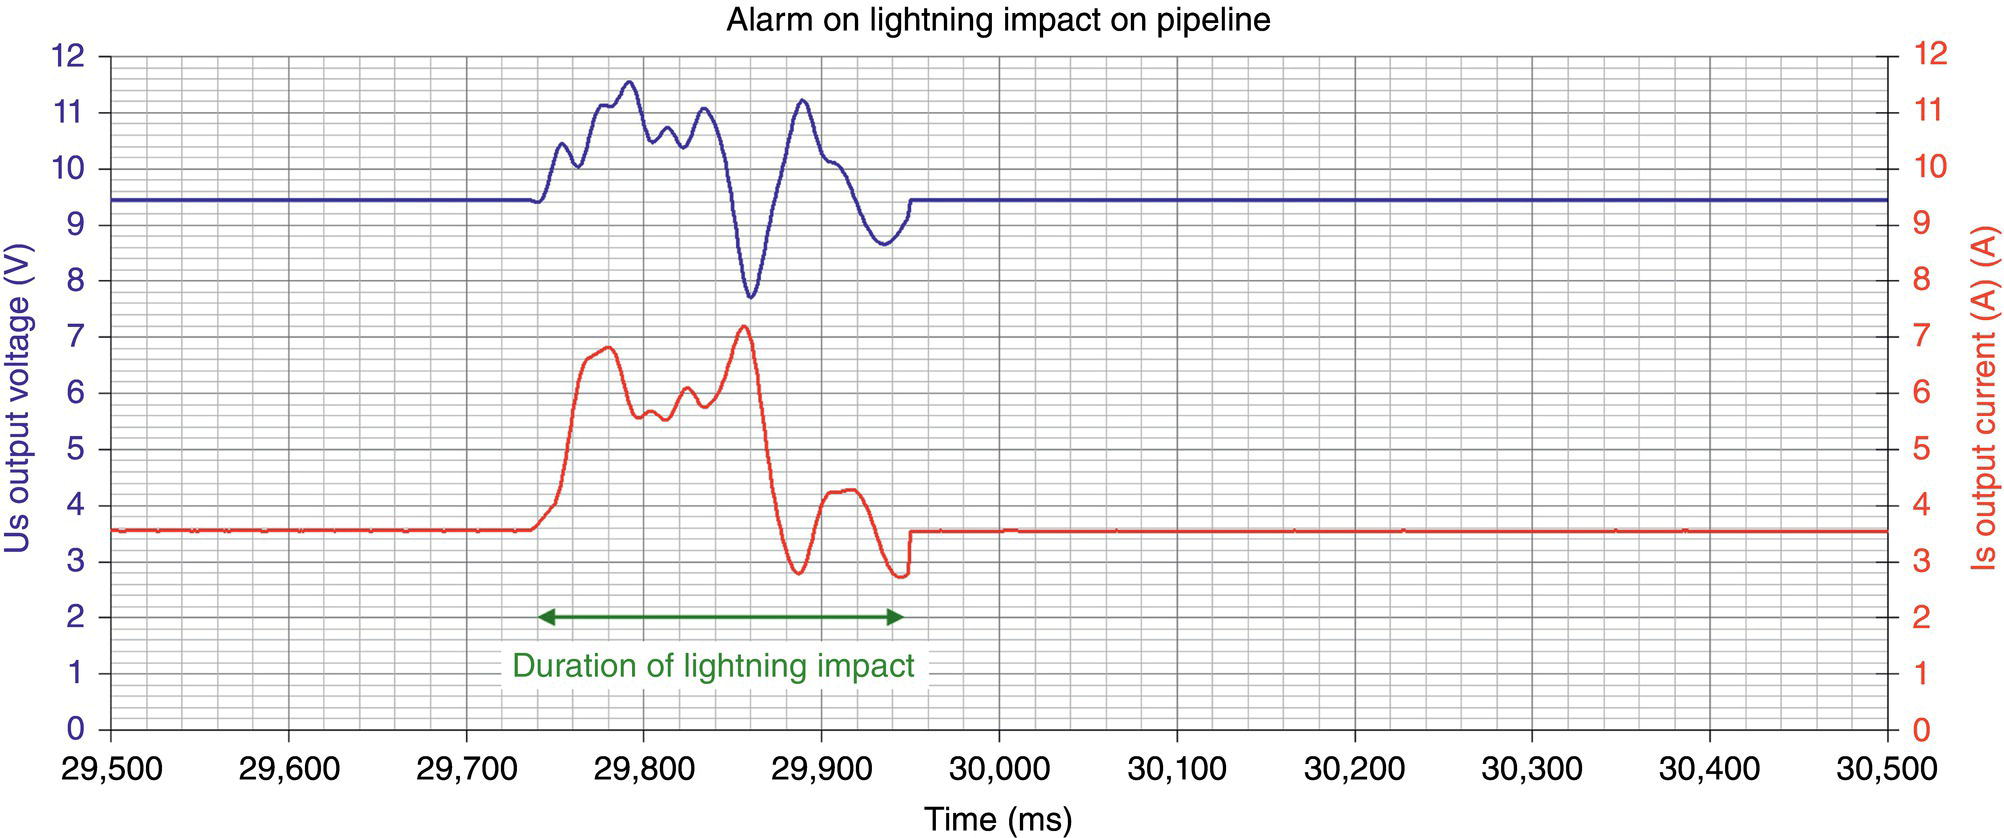
Gérard Huss1, Carine Lacroix2, Éric Parizot3 and David Xu4 1SPADE Pipelines, Paris, France 2GRTgaz RICE, Paris, France 3GRTgaz Technical Department, Paris, France 4PG&E Corporation, Oakland, CA, USA The tools currently used for pipeline monitoring, such as airplanes, vehicles, cathodic protection, Direct Current Voltage Gradient (DCVG), External Corrosion Direct Assessment (ECDA), Inline Inspection (ILI), are used periodically. On the other hand, cathodic protection is permanently active. Dreaded events, such as a mechanical collision lasting a relatively short period or a few seconds, with very low amplitude and drowned in the background noise, are not detectable by conventional remote monitoring [1]. Real-time monitoring of the pipeline and detection of mechanical aggression can be achieved through a process of data acquisition, local and real-time data processing, then triggering and sending an alarm by comparison with a library of damage indication signatures. Furthermore, this monitoring system needs to be economically efficient and easy to integrate into existing facilities without interfering with the pipeline operations. SPADE (System for Pipeline Aggression Detection) has developed a solution that has been tested for over 2 years on the network of GRTgaz, a leading transmission gas pipeline operator in Europe [2]. The tests conducted and their outcome are discussed in this chapter. Real-time detection of accidental or intentional attacks on pipelines is a major challenge to pipeline operators. Existing methods can detect such events, albeit with delays reaching several months or years, resulting in serious accidents and delayed ruptures. Cathodic protection is a means of detecting these events in real time and qualifying them. The steel pipeline is likened to an electric field sensor. It suffices to study the variations of the output voltage and current parameters of the cathodic protection generator. Nevertheless, major prerequisites required for the development of the system are a good practice and a thorough knowledge of stray current phenomena [3, 4]. In 2019, a laboratory prototype was installed in the field, with the objective of detecting an electrical short between a pipeline and its casing. The pilot was conclusive, the short was detected in real time at a distance of approximately 18 mi. between the casing and the rectifier where the SPADE system was installed. In 2020, a functional protype was produced and installed on a GRTgaz operating pipeline. After 4 months, the following events were detected: See Figure 23.1. Figure 23.1 Schematic of pipe illustrating parameters at different distances along a pipe. (Gérard Huss (Chapter author).) SPADE made the following development from the attenuation’s formulas [5, 6] usually used: The proof of concept was established with GRTgaz by placing a recorder at a rectifier and by creating an earthing of the pipeline through a metal spike connected to a potential test post (Figure 23.2). The signal is captured in the recording of the rectifier current (Figure 23.3). The detection sensitivity of the system can be evaluated by interconnecting several spikes. The SPADE system has been designed to monitor the characteristics of the cathodic protection system during pipeline operation and to identify, in real time, changes caused by mechanical damage, illegal tapping, and a short circuit between pipe and casing. For developing a commercial SPADE system for field use during pipeline operation, a SPADE demonstrator has been designed and constructed. The main components of the SPADE demonstrator are Figure 23.2 Proof of concept of pipeline monitoring by recording the current of cathodic protection. (Gérard Huss, original figure.) Figure 23.3 Proof of concept signal recording. (Gérard Huss, original figure.) The SPADE system takes one thousand measurements per second. Compared with the demonstrator, the industrial version of the SPADE system, to be available in the fourth quarter of 2023, is smaller, less expensive, and can be operated over an expanded range of environmental conditions. Noteworthy differences compared with the demonstrator are The demonstrator was placed on a racking station and became operational. The recorded alarms were examined without outside intervention, and the records were checked to discriminate between one indicating a danger and one that results from harmless surrounding electrical disturbances. The different procedures were repeated to verify the triggering of alarms and to adjust the parameters of the demonstrator according to the pipeline (considering its length, coating, stray currents, etc.) To simulate the pipeline/casing contact, the pipeline control cable is connected to the casing at the level of the potential test post (Figure 23.4). This test was conducted on a pipeline of an oil company close to Paris. To evaluate the sensitivity of the system, a resistor in series was introduced between the two cables to reduce the contact current. The data in Figure 23.5 show detection of the signal corresponding to a pipe/casing contact from a distance of 24 km (15 mi.). The periodicity of the signal allows its recognition after digital processing, not perceptible to the naked eye. The tests to demonstrate detection of mechanical aggression cannot be carried out directly on an operational pipeline. Instead, as shown in Figure 23.6, an accessible potential test post was selected with an available space to bury a coated test tube 3.7 m (12 ft.) in length, which was connected to the pipeline via a potential test post. After backfilling the test tube, the soil was left to rest for 2 or 3 weeks before bringing an excavator to impact the test pipe. Figure 23.4 Setup for detecting signal between casing and pipe. (Gérard Huss, original figure.) Figure 23.5 Signals corresponding to a pipe/casing electrical short. (Gérard Huss, original figure.) Figure 23.6 Pilot setup for real-time detection of mechanical aggression by an excavator. (Gérard Huss, original figure.) A device recording the current drained and the potential of the pipeline was inserted in the tube/potential connection. Also, a recorder was placed at the level of the cathodic protection rectifier. Figure 23.7 Signals of mechanical impacts in the absence of stray currents. (Gérard Huss, original figure.) In Figures 23.7 and 30.8, the signals that mechanical impact on a pipeline can produce are shown, in the absence and in the presence of stray currents, respectively. In Figure 23.7, the upper curve, at Dammartin, shows the pulse duration of about 10 s. The stray current level is weak. The second curve shows the signal after processing. The two spikes indicate the beginning and the end of the pulse. The third (lower) curve shows the alarm that was triggered a few milliseconds after the pulse. In Figure 23.8, the first (upper) curve shows the raw signal caused by the excavator at Bazainville. The second curve shows the received signal (continuous curve, site of Dammartin) with the local alarm (rectangular curve). The third (lower) curve shows the processed signal (variable levels with peaks) and the alarm (constant levels, rectangular signals). During the monitoring, several impacts of lightning strikes on the pipeline were detected in real time, and these triggered alarms. The corresponding signal is illustrated in Figure 23.9. The first eighty milliseconds, when ouput voltage and output current together increase, correspond to the lightning precursor channel formation. The eighty milliseconds following, when ouput voltage and current variations are opposed, correspond to the lightning discharge. The last forty milliseconds are the reequilibrium of charges in the soil. This result confirms that pipelines could be impacted [7] and eventually damaged by lightning impact. In this case, the output voltage of the Cathodic Protection (CP) station has varied from 8 to 12 V and the current from 3 to 7 A. This is not a variation in the supply voltage; otherwise, the output voltage and the current would have increased simultaneously. Over time, a data base of events related to triggered alarms will allow to characterize the type of impact on the pipeline. Studies and tests have shown that detecting mechanical impact in real time is possible even in a difficult environment with stray current interference and with a poorly insulating coating. In this project, successful real-time detection of impacts on the pipeline resulting from a simple spike, a pipe/casing electrical short, and mechanical aggression caused by an excavator have been demonstrated. It was also possible to identify a lightning strike, which could cause coating disbondment and other adverse impacts. Figure 23.8 Signals with stray currents and system response. (Gérard Huss, original figure.) Figure 23.9 Electrical signal of a lightning impact in the close environment of a pipeline. (Gérard Huss, original figure.) The recordings made suggest that the type of aggression could be established through the alarm signals (labeling). The strength of the signal generated by illegal tapping is much stronger than the one related to an excavator impact. Thus, the real-time detection of an illegal tapping is within the scope of the technology. In the most common application, the system that has been developed is used to monitor the cathodic protection at all points of the pipeline because any sudden failure of the coating will be detected. If the coating on the pipe is weakly insulating and strongly degraded, it will suffice to reinforce the cathodic protection by installing an additional rectifier equipped with this system. The installation of the system should also give information on ground movements when the constraints tear the coating, probably the case for coal tar and Fusion Bonding Epoxy (FBE) coatings.
23
Utilizing Cathodic Protection for Real-Time Detection of Mechanical Damage and Interference
23.1 Introduction
23.2 Background
23.3 Testing Procedure and Process
23.3.1 Theory

23.3.2 Proof of Concept
23.3.3 Other Parameters
23.3.4 Demonstrator
23.3.4.1 SPADE System
23.4 Real-Time Detection of an Electrical Short Between a Pipeline and Its Casing
23.5 Real-Time Detection of Mechanical Aggression on a Pipeline
23.6 Real-Time Detection of a Lightning Strike
23.7 Discussion

References
Utilizing Cathodic Protection for Real-Time Detection of Mechanical Damage and Interference
(23.1)
(23.2)