1.0 Introduction
This is the age of gas turbines with their ever-growing contributions to people’s living standard and well-being. As a great technological marvel, perhaps next only to the inventions of electricity and light bulb, gas turbines have become indispensible in commercial aviation, shrinking the travel time around the globe in hours rather than days and weeks as was the case in the early 1990s by sea. Almost all modern military fighter jets with high maneuverability deploy gas turbine engines. Even in liquid rocket propulsion, gas turbines are used to pump liquid fuel and oxidizer to the combustion chamber at high pressure. Nonflying gas turbines, where weight considerations are important only to reduce material cost, have revolutionized the means of power generation both on land and sea. Their impressive applications portfolio includes utility and industrial power generation, combined heat and power (CHP), oil and gas, and mechanical drive. Gas turbines are a strong candidate of choice where fast power is needed in the distributed power generation for commercial buildings and facilities. Their fuel flexibility is leveraged in applications involving biogas, biomass, waste gas, and waste to energy to produce utility steam. In view of the growing demand for energy around the world, it is highly unlikely that wind turbines and other forms of turbomachinery using renewable will make gas turbines obsolete as they (gas turbines) did to piston-powered reciprocating machines in the early part of the last century. In fact, in the foreseeable future, the world demand for gas turbines for both propulsion and power generation is expected to grow monotonically.
Bathie (1996), Soares (2014), and Saravanamuttoo et al. (2017) present the history of gas turbines for aircraft propulsion and for various power-generation applications. Historically, the gas turbine technology has cascaded from military engines to commercial engines to large and small engines used for power generation. Aeroderivative gas turbines used for land and marine applications are directly derived from aircraft engines. For reasons of high reliability and safety, the development of the most of aviation gas turbines has been evolutionary rather than revolutionary, each engine being an upgrade of a previous successful engine or a conglomeration various technologies from other engines.
Olson (2017) touts the advanced technologies associated with the GE9X™ engine, shown in Figure 1.1. Designed specifically for the Boeing 777X airplane, the GE9X is the most fuel-efficient and quietest jet engine GE has ever produced. This engine is designed to deliver 10 percent improved aircraft fuel burn versus the GE90–115B-powered 777–300ER and 5 percent improved specific fuel consumption versus any twin-aisle engine available. Additional design features include an approximate 10:1 bypass ratio, 60:1 overall pressure ratio, and 8 db margins to Stage 5 noise limits. As to the cooling technology, the GE9X engine features ceramic matrix composite (CMC) materials in the combustor and high-pressure turbine for twice the strength, a third of the weight, and greater thermal management capabilities than their metal counterparts. The low-pressure turbines of the GE9X use enhanced titanium aluminide (TiAl) airfoils, which are stronger, lighter, and more durable than their nickel-based counterparts. Achieving this milestone for gas turbines in the history of aviation would have been beyond any forecast fifty years ago!

Figure 1.1 Cutaway view of the GE9X engine
GE is not the sole manufacturer of such large aircraft engines. Other original equipment manufacturers (OEMs) include Pratt & Whitney (P&W) and Rolls-Royce (R-R), which in their portfolio have similar class of engines, being marketed in a close global competition with GE. As a result of the enormous cost, which runs into hundreds of millions of dollars, associated with the development of a new large gas turbine for commercial aviation and a decade-long breakeven point, the entire market for such engines has remained divided among these three companies (GE, P&W, and R-R) with no new major OEM seen on the horizon.
Unlike aircraft engines, the gas turbines used to generate electricity can operate under a simple cycle (i.e., the Brayton cycle, discussed in Chapter 2) or jointly with a steam turbine using a heat recovery steam generator (HRSG), which yields significantly improved combined-cycle thermal efficiency (ηthCC≈ηthGT + ηthST − ηthGTηthSTηthCC≈ηthGT+ηthST−ηthGTηthST). Until the early 1990s, the simple-cycle thermal efficiency, which depends on the overall pressure ratio and turbine inlet temperature (TIT), was limited to 33–38 percent, and the combined-cycle efficiency was in the range of 51–58 percent. Around the turn of this century, OEMs including GE and Siemens embarked on the new line of high-efficiency gas turbines called H-class with a TIT of around 1427oC, which is around 100oC higher than the previous class of gas turbines. These new gas turbines for electricity generation were developed to break the perceived barrier of the combined-cycle efficiency of 60 percent. GE designated their H-class machines as 9H for 50 Hz (3000 rpm) and 7H for 60 Hz (3600 rpm) applications. To maintain the same turbine tip speed, 9H gas turbines are hence larger in size than their 7H counterpart. Siemens, by contrast, designated their machines as SGT5–8000H and SGT6–8000H for 50 Hz and 60 Hz electricity generation, respectively.
For the initial development of the H-class gas turbines, GE used a somewhat revolutionary design philosophy of introducing closed-loop steam cooling in the first stage turbine stator and rotor system, including internal cooling of vanes (nozzles) and blades (buckets). At this time, GE remains the only OEM that has successfully introduced steam cooling for a rotating gas turbine component. After an extensive validation process, GE installed their first 9H combined-cycle gas turbine at Baglan Bay in 2003. Since then, the plant has been reliably providing up to 530 MW to the UK national grid, operating at over 60 percent combined-cycle efficiency.
Siemens, by contrast, used an evolutionary approach to the design and development of their H-class gas turbines and tested their first SGT5–8000H at full load in Ingolstadt, Germany, in 2008. The gas turbine unit performed at 40 percent efficiency and as a part of a combined-cycle system reached a world efficiency-record of 60.75 percent. This plant has been providing power to the German grid since the end of the testing period.
While maturing their steam-cooled gas turbine technology, GE simultaneously launched the development of the traditional air-cooled H-class machines under the designation 9HA and 7HA. According to Vandervort, Wetzel, and Leach (2017), in April 2016, under the auspices of the Guinness Book of World Records, a 9HA.01 GTCC set a world record for the combined cycle efficiency of 62.22 percent while producing more than 605 MW of electricity. In June 2016, GE and Électricité de France (EDF, Electricity of France) officially inaugurated the first 9HA combined-cycle power plant in Bouchain, France, and achieved a combined cycle efficiency of over 62 percent. A cutaway view of GE’s 9HA gas turbine is shown in Figure 1.2.

Figure 1.2 Cutaway view of GE’s 9HA gas turbine
Key gas turbine technologies, their mutual interactions, and their influence on the core components (compressor, combustor, and turbine) are depicted in Figure 1.3. Aerodynamics influences the design and performance of gas turbine primary flow path, which participates directly in the energy conversion process. Modern gas turbine compressors and turbines feature 3-D airfoils, whose details are designed using computational fluid dynamics (CFD) for a nearly isentropic performance.

Figure 1.3 Interactions among gas turbine key technologies.
A device is as strong as its weakest link. All components of a gas turbine must perform in concert for its successful operation. To realize the desired aerodynamic performance, the structural integrity of both compressor and turbine are critically important, as they involve rotating components at very high temperature. A failure of either of them could be catastrophic. The key drivers of gas turbine technology are: (1) the fuel cost, which in turn drives the technology development for higher efficiency; (2) engine reliability, durability, and availability, which require active life management of each engine from cradle to grave, determining its maintenance intervals and the overall product cost; and (3) environmental regulations against pollution, which drives the combustor technology development.
As the compressor pressure ratio and TIT keeps rising for more efficient gas turbines, heat transfer (cooling), secondary air system (SAS), and materials and coatings constitute today’s pacing technologies. SAS delivers gas turbine cooling and sealing flows, which could be around 20 percent of the compressor flow. Note in Figure 1.3 that SAS strongly influences gas turbine heat transfer, which in turn has a weak influence on SAS.
Any reduction in cooling and sealing flows directly translate into higher thermal efficiency for a gas turbine. Advances in materials and coatings technology, such as CMC, has led to increased cooling effectiveness with reduced cooling flow requirements. In addition, many aspects of gas turbine design are already benefitting from the fast-emerging additive manufacturing (also called 3D printing) technology. Earlier designs were almost always constrained by manufacturability. With the widespread use of additive manufacturing, the new paradigm is “if you can design it, we can manufacture it.”
1.1 Primary Flow: Energy Conversion
The primary flow of the core engine consists of the flow through low-pressure and high-pressure compressors, combustor, and high-pressure and low-pressure turbines. As the air flows against an adverse gradient, the high-pressure ratio over the compressor is achieved in multiple stages to prevent boundary layer separation over the airfoils. For an axial-flow compressor, which is found in most modern large gas turbines, the flowpath area continuously decreases downstream with the increase in air density, pressure, and temperature as the work transfer from the compressor blades (rotating airfoils) to airflow occurs continuously in each stage. This transfer of energy into the airflow from compressor is governed by the Euler’s turbomachinery equation presented in Chapter 2. In essence, this equation states that for unit air mass flow rate through a blade passage, we obtain the amount of work transfer by subtracting the product of the air tangential velocity (absolute) and blade tangential velocity at the inlet from their product at the outlet. It is interesting to note that Euler’s turbomachinery equation deals with velocities in the absolute (inertial) reference frame. Although turbines operate under the most adverse thermal environment, the compressor operating under stall-free and surge-free conditions is the heart of a gas turbine, playing a critical role in its overall operation and performance. The compressor flow is the source of all cooling and sealing flows in a gas turbine with the exception of a steam-cooled gas turbine, where some of the cooling needs are met by steam in a combined cycle operation, as in GE’s 9H/7H machines.
The combustor is the place where the primary flow path air receives chemical energy from the fuel through an efficient combustion, significantly raising its temperature (TIT). But for a slight loss of pressure in the combustor, the turbine handles nearly the same overall pressure ratio as the compressor but in fewer stages. The turbine flow path predominantly operates under a favorable pressure gradient with negligible propensity for boundary-layer separation. For a gas turbine engine used in aircraft propulsion, the high-pressure turbine drives the compressor, and the exhaust gases from the turbine are expanded in a nozzle for generating the propulsive thrust. In a power generation application, by contrast, we may have separate turbines; one, which is called a gas generator turbine, drives the compressor; and the other, called a power turbine, rotates a generator to produce electricity. Euler’s turbomachinery equation also holds good for computing energy transfer from hot gases to turbine blades and rotor. In this case, however, the product of flow tangential velocity and blade tangential velocity at the outlet is less than that at the inlet of a row of turbine blades. Vanes (nonrotating airfoils) have no direct role in the work transfer both in the compressor and turbine. Their main purpose is to receive the upstream flow with minimum pressure loss and to prepare the flow to enter the downstream blades, which are rotating, with minimum entrance loss.
Heat transfer (cooling) considerations take the center stage in the design of turbines, whose flow path contains hot gases at temperatures close to the melting point of structural material in contact. For an acceptable life and durability of the turbine components during their entire operational envelope, designers must ensure that these components are adequately cooled using compressor air at the required high pressure. A serious uncertainty, however, remains for the temperature distribution in the hot gases exiting the combustor, critically impacting the thermal design of the first stage vanes and possibly the downstream blades.
While the gas turbines for aircraft propulsion are fitted with a nozzle to expand the flow exiting the last stage turbine to ambient pressure with a high exit velocity to produce thrust, shaft-power gas turbines use an exhaust diffuser at the turbine exit. Using additional duct work with minimum pressure loss, the gases from the exhaust diffuser are either ducted to an HRSG in a combined-cycle operation or by-passed to ambient in a simple-cycle operation. The primary role of a diffuser is to render the turbine exit static pressure subambient through the static pressure recovery to the ambient pressure, while minimizing loss in pressure in the downstream duct. The exhaust diffuser thus helps create higher pressure ratio across the turbine, making it more efficient. For a detailed experimental and 3-D CFD investigation of scaled GE’s 9E gas turbine exhaust diffuser, which exhausts sideways, see Sultanian, Nagao, and Sakamoto (1999).
Based on the Brayton cycle analysis presented in Chapter 2, we can easily deduce Equation 1.1 for the net specific work output (nondimensional), which when multiplied by the compressor mass flow rate (neglecting fuel mass flow rate into the combustor) yields the total cycle power output, and Equation 1.2 for the thermal efficiency:
 (1.1)
(1.1) (1.2)
(1.2)Under the assumptions of equal pressure ratio across the compressor and turbine with an isentropic efficiency of 0.9 and κ = 1.4κ=1.4 for the fluid (assumed to be air) in their primary flow path, Equations 1.1 and 1.2 are plotted in Figure 1.4. We can make the following key observations from this figure:
(1) The net specific work output (wnet/cpTt1wnet/cpTt1) and the cycle thermal efficiency (ηthηth) depend upon the compressor pressure ratio (ππ) and the ratio of turbine inlet temperature to compressor inlet temperature (Tt3/Tt1Tt3/Tt1).
(2) For a given compressor pressure ratio, both wnet/cpTt1wnet/cpTt1 and ηthηth increase with Tt3/Tt1Tt3/Tt1.
(3) For a given value of Tt3/Tt1Tt3/Tt1, the compressor pressure ratio needed to maximize wnet/cpTt1wnet/cpTt1 is lower than that needed to maximize ηthηth. This explains why the gas turbines used for military planes requiring higher wnet/cpTt1wnet/cpTt1 tend to operate at a lower pressure ratio, while the gas turbines for civil aviation, where higher thermal efficiency is preferred, operate at a higher pressure ratio.
(4) The curves for wnet/cpTt1wnet/cpTt1 feature sharper maxima than those for ηthηth. This means that a small variation of compressor pressure ratio around the optimal value will not significantly impact the engine thermal efficiency.

Figure 1.4 Variations of net specific work output and thermal efficiency with pressure ratio and turbine inlet temperature.
From Equation 1.1, we can easily show that, for a given value of Tt3/Tt1Tt3/Tt1, the optimum pressure ratio that yields the maximum value of wnet/cpTt1wnet/cpTt1 is given by
 (1.3)
(1.3)which tends to vary as 0.692(Tt3/Tt1)1.750.692(Tt3/Tt1)1.75 for a gas turbine with compressor and turbine isentropic efficiency of 0.9.
1.2 Internal Flow System (IFS)
The air flows extracted from the compressor primary flow path for the purpose of cooling various hot components and providing effective sealing between rotor and stator parts is known among gas turbine engineers as secondary flows. The system of such air flows is called secondary air system (SAS). It is also alternatively known as internal air system (IAS). In this textbook, we have further generalized this system where coolant could be different from air, for example, steam in a steam-cooled gas turbine in a combined-cycle operation, calling it internal flow system (IFS). The use of secondary flows instead of internal flows may be confused with the secondary flows of the first and second kind found in duct flows, see Schlichting (1979). For all practical purposes, SAS, IAS, and IFS are used synonymously here. Further note that the primary flow paths of gas turbine compressor and turbine are essentially annuli through which internal flows of air and hot gases occur with interruptions from vanes and blades, the latter being responsible for work transfer into compressor air flow or out of the hot gases flowing through the turbine. In this textbook, we will avoid referring to the primary air flow as an internal flow.
A typical cooling and sealing arrangement of a hypothetical turbine (to avoid disclosing the proprietary design of any OEM) as a part of its internal flow systems is shown in Figure 1.5. The internal air system is also used to balance the pressure distribution on the rotating disk and drum structure in the engine to maintain acceptable bearing loads. Another function of the internal air flow is to ventilate the bearing compartments so as to prevent the buildup of combustible gas mixtures and to carry lubrication oil droplets to the oil separators. A distinguishing feature of gas turbine internal flows is the presence of rotation with its generally nonintuitive behavior. The energy transfer in such flows occurs both from heat transfer and work transfer, which requires interactions with rotating components.

Figure 1.5 Cooling and sealing arrangement of a hypothetical turbine
Based on years of research in the flow and heat transfer of gas turbine rotating disk systems at the University of Sussex, largely funded by Rolls-Royce, Owen and Rogers (1989, 1995) were the first to publish a comprehensive monogram in two volumes. Unfortunately, both these volumes have been rendered out of print. More recently, Childs (2011) published a book on rotating flow covering the ones found in gas turbine internal air systems as well as earth’s atmosphere. Among others, Kutz and Speer (1994) and Johnson (2010) describe industry-oriented approach to the simulation of secondary air systems involving elements such as restrictors, tappings, seals, vortices, and coverplates. They also briefly discuss the two-phase (oil and air) flow that occurs in bearing chamber vent systems.
1.2.1 Key Components
Gas turbine internal flows are generally driven between the compressor flow path as the source and the turbine flow path as the sink. In each system, the flow has to pass through a number of components such as stationary and rotating orifices, stator–rotor and rotor–rotor cavities, preswirler nozzles, labyrinth and other types of seals, turbine rim seals, and so on. Some of these components are depicted in Figure 1.6, and their brief description is provided here. We discuss modeling of these components in later chapters.

Figure 1.6 Key components of gas turbine internal flow systems
Orifice. Orifice, like a resistor in an electrical network, is a basic component of the gas turbine internal flow system. It may belong to stationary part or a rotating part, in which case it is called a rotating orifice. Typically, an orifice is modeled as an adiabatic flow element. For given inlet total pressure and temperature, exit static pressure, and reference flow area, orifice mass flow rate depends upon the discharge coefficient, or loss coefficient, which mainly depends upon its length-to-diameter ratio, ratio of throughflow velocity to total velocity at orifice inlet, pressure ratio across the orifice, and its rotational velocity. Note that both the discharge coefficient and loss coefficient are determined using empirical correlations. In the flow network modeling using an orifice element, its exit dynamic pressure associated with flow velocity is considered lost for the downstream element.
Channel. A channel, also known as pipe, duct, or tube element, offers the most flexibility in internal flow modeling. Unlike an orifice element, the channel allows the simulation of heat transfer effects and conservation of flow linear momentum governed by the momentum equation. The most general formulation of 1-D compressible flow through a channel includes area change, friction, heat transfer, and rotation. Thus, we can possibly simulate an orifice using a channel but not the other way around. While the closed-from analytical solutions are available for individual effects in a channel flow (compressible), namely, isentropic flow with area change, Fanno flow (constant area with no heat transfer and rotation), and Rayleigh flow (constant area with no friction and rotation), when two and more effects are present, their linear superposition is ruled out. In that case, we resort to numerical solution of the resulting nonlinear system of governing equations. For the simulation of general channel flow, we need empirical equations to determine the wall friction factor and heat transfer coefficient.
Vortex. Vortex is a uniquely important component of gas turbine internal flow system and arises due to the presence of rotation. Like solid-body rotation, the forced vortex is characterized by a constant angular velocity. By contrast, a free vortex, which is free from any external torque, keeps its angular momentum constant. In internal flows, because of the presence of walls with friction, a pure free vortex is seldom found. When the flow enters a rotating channel, it immediately assumes the state of solid-body rotation with the channel and thus becomes a forced vortex. In gas turbine cavities, the internal flow features the most complex vortex structure. Such a vortex structure does not fit the definition of either the forced vortex or the free vortex. We call this a general vortex, which can be modeled using a stacked combination of forced vortices. For a radially inward flow in a rotor cavity, the flow shows the tendency of a free vortex with its swirl velocity increasing downstream. For a large radial span, the flow may rotate faster than the adjacent rotor surfaces. The radially outward flow features the opposite behavior, rotating slower than the rotor surface.
The primary effect in a free, or forced, vortex is to increase the static pressure in a radially outward flow and decrease it in a radially inward flow. It also influences the amount of work transfer with the rotor surface in contact. For example, if the fluid is rotating at the same angular velocity as the surface in contact, no rotational work transfer occurs. The pumping flow induced by a rotor disk also depends on the vortex strength of the adjacent fluid. Unlike other IFS components, which can be modeled as a loss element with empirically defined relationship between their mass flow rate and the associated pressure drop, the change in static pressure in a vortex is nearly independent of its mass flow rate. The modeling of a vortex in the flow network therefore requires special consideration.
Cavity. In gas turbine design, cavities are widely encountered by internal flows. But for some three-dimensional features like bolts, these cavities are modeled as axisymmetric. In general, the surfaces forming the cavity may be rotating, counterrotating or stationary. In the absence of a radially inward or outward flow, as is often the case for compressor rotor disk cavities, the internal flow behaves like a forced vortex in solid-body rotation with the disks. In other cases, a complex vortex structure prevails in the cavity flow. From design considerations, for a given coolant mass flow rate, the cavity flow model provides the distributions of swirl velocity, windage, and static pressure. These quantities form essential inputs to accurate heat transfer simulation. The accuracy of rotor axial thrust computation largely depends upon the accuracy of static pressure distribution in rotor cavities.
In the foregoing, we have presented brief descriptions of the four basic components (orifice, channel, vortex, and cavity) of a gas turbine internal flow system. Other components such as labyrinth seal, rim seal, and preswirler may be modeled as a combination of the four basic components. These components may therefore be considered as superelements in a flow network model.
Internal flow systems are generally represented by a complex flow network of various components (elements) interconnected at junctions (chambers or nodes). In each element, the flow is assumed to be locally one-dimensional. A typical flow network of gas turbine internal flow systems is shown in Figure 1.7. Chapter 3 presents a comprehensive discussion on 1-D flow network modeling and the related robust solution method.

Figure 1.7 Flow network representation of internal flow systems
1.2.2 Efficiency Impact on Gas Turbine Components
The cooling flows peeled off from the compressor primary flow path works somewhat similar to regeneratively cooling, robbing energy in the form of heat transfer and work transfer and dumping some of it into the turbine flow path for potential work extraction by the rows of turbine blades. Whereas the equivalence of work transfer and heat transfer holds in terms of energy (the first law of thermodynamics), and whereas the conversion of work into thermal energy is 100 percent, the complete conversion of thermal energy back to work is not possible (the second law of thermodynamics). As a result of heating, wall friction, and mixing with high-momentum primary flow, the internal flows feature monotonic increase in entropy, which results in irreversible loss in total pressure. This entropy generation in the primary and internal flow systems is the main reason behind the efficiency loss during energy conversion in gas turbines.
In compressors, the primary air flow faces an adverse pressure gradient in all its stages. This makes the compressor prone to boundary layer separation, leading to design considerations of improving stall and surge margins. As discussed by Cumpsty (2004), the matching of various stages in a multistage axial-flow compressor remains a serious design challenge. To protect these compressors from stalling and surging conditions, bleed valves are generally used during start-up and shut-down. These valves, which discharge into the gas turbine exhaust duct, are only open during acceleration to the rated speed and deceleration from the rated speed. When we bleed compressor air from a stage to become an internal flow, the air flow through the downstream stages is reduced. Unless it is already factored into the original design, the internal flow extraction will render the latter stages to perform at off-design conditions, reducing their polytropic efficiencies. Thus, for the compressor to perform with minimum loss in its aerodynamic efficiency with acceptable stall and surge margins, the realistic schedule of bleed flow rates and their stage-wise locations must be factored into the original design.
Figure 1.8 shows two categories of internal flows. The first kind, which fully participates in the work output from the turbine, is called nonchargeable, and the second kind, which is ignored for work extraction through the turbine, is called chargeable, directly impacting the overall cycle performance. The only nonchargeable flow shown in the figure corresponds to the cooling flow used for the first-stage vanes. The net effect of this internal flow, which bypasses the combustor, is to lower the turbine inlet total temperature and somewhat lower the corresponding total pressure as a result of entropy increase from mixing and heat transfer. Horlock and Torbidoni (2006) present the calculations of isentropic efficiencies defined by Timko (1980) and Hartsel (1972) for a cooled turbine stage with a polytropic efficiency of 0.9. From their calculations, the linear variation of the cooled-turbine isentropic efficiency with the coolant air flow fraction can be approximated by the following equation:
 (1.4)
(1.4)where ṁiT is the internal air mass flow rate used for turbine stage cooling and ṁg
 is the mass flow rate of hot gases from the combustor.

Figure 1.8 Chargeable and nonchargeable internal flows in gas turbine design and cycle performance.
1.2.3 Penalty on Engine Cycle Performance
Both materials and cooling technologies must advance simultaneously to realize the trend of continuous increase in gas turbine cycle efficiency by increasing the combustor outlet temperature (COT) or turbine inlet temperature (TIT). MacArthur (1999) and Horlock, Watson, and Jones (2001) suggested that with the contemporary materials technology further increases in COT might result in a decrease of cycle efficiency. The penalty of internal flows, which are associated with cooling and sealing, on engine cycle performance can be determined only by a judicious application of both the first and second laws of thermodynamics. While it is straightforward to apply the first law of thermodynamics (steady flow energy equation), the second analysis requires user-specified models for cooling losses. Young and Wilcock (2002a, 2002b) provide such models, which are expressed in terms of irreversible entropy creation rates rather than the loss of total pressure or modified stage efficiency. Wilcock, Young, and Horlock (2005) used these models to compute the effect of turbine blade cooling on the cycle efficiency of shaft-power gas turbines.
To understand the effect of chargeable internal flow on specific work output and cycle efficiency, let us consider a simple gas turbine with the compressor and turbine operating at constant isentropic efficiencies ηCiηCi and ηTiηTi, respectively. In the cycle analysis of this gas turbine, we neglect the fuel mass flow rate and the combustor pressure drop, which implies equal pressure ratio across both compressor and turbine. We obtain the following equations (see Problem 1.4) for the specific work output and cycle thermal efficiency with their dependence on the chargeable internal flow as a fraction of compressor air flow, engine pressure ratio, and turbine inlet temperature:
 (1.5)
(1.5) (1.6)
(1.6)where ṁich is the chargeable internal air mass flow rate and ṁa
 is the compressor inlet air mass flow rate.
Equation 1.5 is plotted in Figure 1.9a for two values (4 and 5) of turbine inlet to compressor inlet temperature ratio Tt3/Tt1Tt3/Tt1 and two values (5 and 10) of compressor, or turbine, pressure ratio ππ. The figure shows that for all combinations of pressure ratios and temperature ratios the net specific work output of the cycle decreases with increasing chargeable flow rate. The rate of decrease, however, increases with increase in pressure ratio and temperature ratio. For a given pressure ratio, the specific work input into the compressor remains constant, independent of the temperature ratio and the amount of the chargeable flow bled from the compressor. In this case, as we increase the temperature ratio the specific work output of the turbine increases. This in turn increases the deficit in turbine total work output with increase in the chargeable flow. The net effect is that, for a given pressure ratio, as we increase the chargeable flow, the specific net work output of the cycle decreases faster with an increase in temperature ratio, as shown in the figure.

Figure 1.9 (a) Net specific work output versus chargeable internal flow fraction and (b) cycle thermal efficiency versus chargeable internal flow fraction.
Now for a given value of the temperature ratio Tt3/Tt1Tt3/Tt1, if we increase the pressure ratio, both the compressor work input and turbine work output increase. With increasing chargeable flow, while the compressor total work input remains constant, the turbine work output decreases more than the corresponding value at a lower pressure ratio. The net effect is that, for a given temperature ratio, the net specific work output decreases with increasing chargeable flow faster with an increase in pressure ratio, as shown in Figure 1.9a.
Equation 1.6 is plotted in Figure 1.9b, which shows that the cycle efficiency decreases with chargeable flow for all pressure ratios and temperature ratios. For a given pressure ratio, however, the rate of decreases gets lower with increased temperature ratio. This trend for the cycle efficiency is opposite to the trend we discussed in the foregoing for the net specific work output. For the same temperature ratio, however, the constant pressure ratio lines are converging in the direction of increasing chargeable flow, similar to the trend for the specific net work output. As we increase the pressure ratio, the compressor will demand higher work input, but less thermal energy input in the combustor through added fuel will be needed to achieve the specified turbine inlet temperature. This interplay of various effects is more complex and does not lend itself to simple explanations behind the trends observed in Figure 1.9b for the thermal efficiency. We are left with no choice but to rely on Equation 1.6 to compute various effects.
1.3 Physics-Based Modeling
Physics is the foundation of engineering; mathematics is the language of physics. All engineering solutions must not only be mathematically sound; they must also satisfy all the applicable laws of physics to be realized in the physical world. Fortuitously, all the flow and energy transfer processes in a gas turbine are governed by the conservation laws of mass, momentum, energy (the first law of thermodynamics), while satisfying the entropy constraint as dictated by the second law of thermodynamics. In terms of mathematical equations in tensor notation, we summarize these conservation laws as follows:
Continuity equation:
∂ρ∂t+∂ρui∂xi=0 (1.7)
(1.7)
Momentum equations:
∂ρui∂t+∂(ρujui)∂xj=−∂Ps∂xi+∂σij∂xj+Si (1.8)
(1.8)
Energy equation:
∂ρe∂t+∂(ρuje)∂xj=∂q̇j∂xj−∂(Psuj)∂xj+∂(uiσij)∂xj+QS (1.9)
(1.9)
where ee is the specific total energy, σijσij the stress tensor, SiSi the momentum source term, q̇j the diffusive energy flux vector, and QSQS the energy source term. We discuss these equations in Chapter 2 in greater detail, in Chapter 3 for 1-D flow network modeling, and in Chapter 6 in the context of whole engine modeling with emphasis on the turbulence models widely used in gas turbine design applications. Solutions of Equations 1.7–1.9 in their most general form (time-dependent evolution of pressure, temperature, and velocities throughout the flow domain) in gas turbine design is handled by a number of leading CFD commercial codes.
The thermofluids design of a gas turbine is a complex undertaking and far from being handled by a pushbutton technology by simply integrating a number of commercial and in-house codes to execute the design process. The entire design process is multidisciplinary in nature. Generally, a new gas turbine design is handled in three phases: conceptual design, preliminary design, and detailed design. In each of these phases, different degrees of geometric details and approximations are used for modeling and related numerical solutions. In the conceptual design phase, analyses are limited to “back-of-the-envelope” and 1-D modeling. In the preliminary design phase, when the product geometry gets a preliminary definition, the engineers undertake 1-D and 2-D (axisymmetric) modeling. In the detailed design phase, when the product definition needs to be finalized to release engineering drawings for manufacturing, some 3-D analysis is undertaken to fine-tune the design for reduced losses, higher performance, and higher reliability and durability.
In thermofluids design engineering, 1-D, 2-D, and 3-D modeling are also called 1-D CFD, 2-D CFD, and 3-D CFD, respectively, and are schematically shown in Figure 1.10. The only requirement for a prediction method, be it 1-D, 2-D, or 3-D, to be physics-based is that it must not violate any of the aforementioned conservation laws. Although each method must validate with the product performance data obtained from in-house testing and field operation, a method that is not physics-based and based entirely on previous empirical data and arbitrary correction factors is undesirable and short-lived as a reliable predictive tool. Physics-based methods tend to make more consistent predictions and, at times, may need only some minor corrections for an acceptable validation with the actual design. These methods are continuously validated using data from gas turbine thermal surveys, and the discrepancies between pretest predictions and test data are meticulously resolved by improved physical modeling and adjustment of correction factors.

Figure 1.10 Physics-based modeling: (1) 1-D CFD, (b) 2-D CFD, and (c) 3-D CFD.
In 1-D CFD, shown schematically in Figure 1.10a, the flow domain is divided into large control volumes. Each control volume contains a part of the bounding walls. The prediction yields one-dimensional variation of various flow properties, usually along the flow direction. The modeling is based on the empirical correlations to compute the discharge coefficient, friction factor, loss coefficient, and heat transfer coefficient. Like all CFD analyses, boundary conditions are specified at the inlet, outlet, and walls. The 1-D CFD offers designers maximum flexibility to adjust correction factors to the empirical correlations to improve validation with the component test data.
A 2-D CFD analysis, shown schematically in Figure 1.10b with a two-dimensional computational grid, becomes necessary when the flow properties vary both in the flow direction and in one more direction normal to the flow direction. A three-dimensional axisymmetric flow is commonly handled by 2-D CFD in cylindrical polar coordinates. In this case, for predicting turbulent flows, which most gas turbine internal flows are, one of the turbulence models is used instead of the empirical correlations used in 1-D CFD. As shown in Figure 1.10b, to resolve local variations in flow properties, very small control volumes are used, making the final results grid-independent, that is to say that the further refinement in grid will have little effect on the solution. Except those near a wall, all other control volumes used in a 2-D CFD are without a wall. Knowing the flow properties at many locations (grid points) in a 2-D CFD has the distinct advantage of providing two-dimensional flow visualization, delineating regions of internal flow recirculation and wall boundary layer separation. This information is certainly missing in a 1-D CFD. For computing integral quantities such as the loss in total pressure from inlet to outlet, we need to compute section-average values from the 2-D CFD results. These integral quantities may then be compared with the corresponding 1-D CFD results or test data. A physics-based method to postprocessing CFD results is presented in Chapter 6. It is important to note that when using 2-D CFD, changing the turbulence model is the only option a designer has to improve the validation of the CFD results with the test data. The flow visualization aspect of a 2-D CFD analysis often proves useful in gas turbine design for reinforcing 1-D CFD modeling. It may come as a surprise to some that the integral results obtained from a 2-D CFD analysis may not often be more accurate than those from a 1-D CFD, which directly uses the applicable empirical correlations. In this respect, 1-D CFD tends to be more postdictive; that is, using the empirical correlations obtained from the test data to predict these data, than predictive.
The general methodology to carry-out a 3-D CFD analysis, which becomes necessary to understand the three-dimensional behavior of a flow field, is similar to that used for a 2-D CFD. In this case, we use a three-dimensional grid system, shown schematically in Figure 1.10c, with a number of interconnected three-dimensional control volumes. In each of these control volumes, all the governing conservation equations must be satisfied, albeit approximately due to the numerical nature of the solution obtained. For example, to simulate the hot gas ingestion across a turbine rim seal with ingress and egress driven by a circumferential variation in static pressure at the exit of preceding vanes, one needs to carry out a 3-D CFD analysis, preferably unsteady at that.
Often in gas turbine design, circumferentially periodic geometry and boundary conditions allow one to use a 3-D CFD model for a sector, which yields results faster than a full 360-degree model. Like 2-D CFD, the accuracy of the results from 3-D CFD using a model of high geometric fidelity with a fine mesh depends on the turbulence model used. Designers have little control to further improve these results for a better match with the test data. Note that the current limitations of various statistical turbulence models can only be overcome by using large eddy simulation (LES) and direct numerical simulation (DNS), both of which are a few years away from being a part of routine gas turbine design applications.
Modern gas turbines for aircraft propulsion and shaft-power used for electric power generation and mechanical drives demand the very best of the thermofluids (thermodynamics, heat transfer, and fluid dynamics) sciences and structure and fracture mechanics for component life assessment to meet the upward moving targets of thermal efficiency and specific work output (or propulsive thrust), which primarily depend on compressor pressure ratio and turbine inlet temperature. Among various technologies used in the design, development, and customer-friendly field operation of gas turbines, advances in cooling and materials technologies stand out. The designers must ensure the specified durability, expected reliability, and manufacturability of various gas turbine components. Working as a system, each gas turbine must deliver its overall operational reliability and flexibility while meeting its performance guarantees and regulatory constraints on environmental pollution, noise level, and safety from potential explosion, including containment of critical component failure.
From the foregoing discussion it is clear that the gas turbine design is a multidisciplinary undertaking, requiring a multiphysics approach to the design and analysis of all its components. Chapter 6 discusses in detail the methodology of an integrated flow, heat transfer, and mechanical modeling of gas turbine components and the engine as a whole.
1.4 Robust Design Methodology
The typical engineering education is built on deterministic evaluations of equations and formulas to yield numerical values of dependent (response) variables for a given set of independent (design) variables. This mindset among engineers persists in the real-world engineering environment. When it comes to manufacturing, we are all expected to include a tolerance on each dimension of a part to be built. Thus, uncertainty and variability is ubiquitous in the engineering world, and the probability of failure of any engineered product is seldom zero, regardless of how well it is designed and built.
Suppose, for example, that we need to calculate the diameter of a sharp-edge orifice to meter and measure the required mass flow rate through a gas pipe line. Such a calculation for a general compressible flow requires the knowledge of pressure and temperature conditions upstream of the orifice, the downstream pressure, and the discharge coefficient, all of which have some uncertainty associated with them. Even when we carry out the calculation at the mean expected values of these input variables, the computed orifice diameter can only be realized within some tolerance, depending upon the capability of the machining process used. In the actual operation, we should expect the final orifice to perform at the mean target value with a finite variance.
Robustness is insensitivity to uncertainty. A component or system design is considered robust if its intended performance is not affected by uncertainties associated with inputs or uncontrollable environmental conditions (noises). While the governing equations are deterministic, the independent variables and boundary conditions have noise associated with them. We must therefore ensure that within the probabilistic variations in various inputs, the output (response) is functionally acceptable. Such a design is called a robust design, as depicted in Figure 1.11 in which the design variables are set such as to yield an increased average performance (response) with minimum variance. As shown in the figure, both designs 3 and 4 have the equal average performance; but, because of its higher robustness, design 4 is preferred to design 3.

Figure 1.11 Pictorial representation of a robust design.
Robust design methodology (RDM) means systematic efforts to achieve insensitivity to various noise factors. For a final robust design, a designer must have complete awareness of variation and apply RDM at all stages of the product and process design. Invariably, RDM involves a probabilistic assessment of the design requiring thousands of deterministic runs using random samples of all input variables. In this sense, a robust design is alternatively called a probabilistic design. Because each run in a probabilistic assessment is deterministic, it behooves a designer to develop a physics-based model of the design under consideration with acceptable product validation. Multiples runs are not a substitute for the lack of understanding of the underlying physics of design. It is important to note that a robust design need not necessarily be an optimum design, which could probably fall off the cliff under certain variation of a design variable or environmental noise. For situations in which the product reliability is of utmost concern, robustness in design becomes the most desirable quality, at times, at the expense of some loss in performance.
The main task of a gas turbine internal flow system is to provide the required cooling or sealing flow to the target location at the required pressure and temperature conditions, knowing the source conditions at the compressor bleed location. Brack and Muller (2014) present a probabilistic analysis of the secondary air system (SAS), shown in Figure 1.7, of a three-stage low pressure turbine of a jet engine at takeoff. The study focuses on the robustness of three key functions of SAS: (1) turbine rotor cooling flow, (2) axial bearing loads, and (3) effectiveness toward preventing hot gas ingestion in wheel-space. To determine the uncertainty associated with these SAS deliverables and to identify major drivers of variation, they have used a Latin hypercube sampling method coupled with the correlation coefficient analysis on the 1-D flow network model. In the following sections, we present a more general and widely used approach of Monte Carlo simulation (MCS), often complemented by response surface modeling (RSM), to carry out a probabilistic (robust) design.
1.4.1 Monte Carlo Simulation
Monte Carlo simulation is a powerful statistical analysis method and widely used for solving complex engineering problems involving a number of random variables, which feature various types of probability distribution. The accuracy of MCS does not depend on the problem size or on how nonlinear the engineering models are. Because MCS involves a large number of runs, the cost and time taken for each run, which is necessarily deterministic, determines its application in gas turbine design.
Figure 1.12 shows the overall methodology of MCS. Once we have determined a large number of random samples of the input variables, MCS can be carried out using one of two methods. In Method 1, the design code is directly used for each combination of random input variables xixi to yield the corresponding output (response) variables yjyj. We can then obtain the distribution for each yjyj for further statistical analysis and assessment of design robustness and reliability. If the design code is too time-consuming to run and we need a quick assessment of design, especially in the preliminary design phase, gas turbine designers resort to Method 2 in which MCS is carried out using a simple surrogate model, often developed by the response surface modeling (RSM) methodology, which we discuss in the next section.

Figure 1.12 Schematic of Monte Carlo simulation.
For example, suppose we wish to carry out the probabilistic rim seal design for an acceptable sealing effectiveness in the stage 1 turbine to prevent or minimize hot gas ingestion. Conducting MCS using a 3-D CFD model in this region will be a daunting task, almost impractical in today’s design environment. However, one can leverage the 3-D CFD method in the development of a multispoke orifice model, discussed in Chapter 4, and use it to conduct the required MCS. To further reduce the MCS time, one may use, for the multisurface orifice model, a surrogate model developed using the RSM techniques.
1.4.2 Response Surface Modeling
Two main building blocks of RSM are the design of experiments (DOE) and regression analysis, and the end result is the response surface equation (RSE), which acts like a transfer function as a surrogate for the full-fledged design code. Besides supporting a fast MCS, RSM finds standalone applications in design optimization and sensitivity analysis. Myers, Montgomery, and Anderson-Cook (2016) provide comprehensive details on all aspects of RSM. We provide here some introductory discussion on this topic.
DOE constitutes the first step in RSM. Here one chooses a particular design such as Box-Behnken design (BBD), full central composite design (CCD), fractional CCD, or three-level full factorial design (FF3). These designs provide the points, having coordinates in terms of coded variables, on which to perform actual evaluations of the response. For the physical variable xixi, the coded variable ξiξi, which ranges from –1 to +1, is defined by the equation
 (1.10)
Craney (2003) recommends the fractional CCD as the best generic choice, which may be replaced by a full CCD for the cases with less than five input variables.
The second step in RSM is to utilize carry out a regression analysis on the evaluated responses. For example, for the response yy, a second-order response surface equation (RSE) for kk input variables can be written as
 (1.11)
where xixi are the input (design) variables. The constant β0β0, the coefficients βiβi for linear terms, βiiβii for pure quadratic terms, and βijβij for cross-product terms are estimated using linear least squares regression, where an overdetermined system of linear equations is solved, see Sultanian (1980). Equation 1.11 is also known as transfer function, and it must be adequately validated before using it as surrogate model replacing the actual design code. For the Monte Carlo simulation (MCS), each xixi is simulated according to its statistical distribution (probability distribution function) and then the response yy is calculated using Equation 1.11. This is repeated a large number of times, resulting in a distribution function for yy.
By using the linearization method around the mean of the input variables xixi, it may not often be necessary to carry out MCS for estimating the mean and variance of the response (output) variable yy. According to Bergman et al. (2009), the Gauss approximation formula is used in the following way:
 (1.12)
where cici is the sensitivity coefficient belonging to xixi. Under the assumption that the input variables are independent, Equation 1.12 reduces to
 (1.13)
In Equations 1.12 and 1.13, the sensitivity coefficient cici for each xixi is simply obtained as ci = ∂y/∂xici=∂y/∂xi from Equation 1.11
 (1.14)
where μi = E(xi)μi=Exi, the mean of xixi. We can also approximate the mean of the output variable as E(y)≈y(μi)Ey≈yμi by evaluating Equation 1.11 at the mean value of each input variable.
In Chapter 3, we present the modeling of a general compressible flow orifice whose discharge coefficient depends upon a number of design and operational parameters whose direct and interaction effects are not sufficiently known through empirical correlations. One way to mitigate this situation is to develop a response surface model for the orifice using high-fidelity CFD analyses following the RSM methodology. The resulting RSE will be a valuable method to implement in a general purpose flow network for modeling various internal flow systems of modern gas turbines.
1.5 Concluding Remarks
In this chapter, we have presented a brief overview of the state-of-the-art gas turbines and their pacing technologies behind their widespread applications in aircraft propulsion (aviation) and electric power generation. The bibliography at the chapter will be helpful to the readers who are interested in the history of gas turbines and their primary flow path design fundamentals and performance calculations. Advances in materials and cooling technologies will essentially determine the future growth of gas turbines with higher thermal efficiency and net specific work output. Additive manufacturing (3-D printing) has currently emerged as a disruptive technology to remove major constraints of manufacturing of many critical gas turbine components, thus allowing a more robust design of these components to achieve higher durability and performance at lower cost. The trend of achieving higher efficiency by increasing turbine inlet temperature and compressor pressure ratio is not sustainable unless the penalty associated with the required cooling and sealing flows, which is currently around 20 percent of the compressor air flow, is minimized.
From modeling considerations, we have identified four basic components (orifice, channel, vortex, and cavity) of the internal flow system and suggested that other superelements such as labyrinth seals, turbine rim seals to prevent hot gas ingestion, preswirler system, and others can be modeled combining these basic elements.
As introduced in this chapter, we emphasize throughout this book that the internal flow systems be simulated using the physics-based modeling, be it 1-D, 2-D, or 3-D. The basic idea behind this thermofluids modeling approach is to ensure that the conservation equations of mass, momentum, energy, and entropy are satisfied over each control volume regardless of its size. For large control volumes, used in 1-D CFD, we make direct use of the applicable empirical correlations. For small control volumes used in 3-D CFD, the empirical information is generally buried in the turbulence models used. This view of physics-based modeling is more encompassing than the view of 3-D CFD being the only physics-based analysis method, and it will hopefully inculcate in young design engineers the dying culture of “back of the envelope” calculations in their design activities.
The chapter ends with a brief discussion on the probabilistic or robust design methodology based on Monte Carlo simulation (MCS) either directly using the design code or with a surrogate model developed using the response surface modeling (RSM) methodology.
Worked Examples
Example 1.1
Two compressors are compared for bidding. Compressor A is submitted with a total pressure ratio of 4.5 and isentropic efficiency of 85 percent. Compressor B is submitted with a discharge static pressure of 620 kPa, static temperature of 250°C, and velocity of 150 m/s as tested at the ambient condition of 101 kPa and 18°C. Which compressor is actually more efficient? Assume: κ = 1.4κ=1.4 and cP = 1004 J/(kg K)cP=1004J/kgK.
Solution
Compressor A
Pressure ratio(πC) = 4.5Pressure ratioπC=4.5
Isentropic efficiency(ηCAi) = 85%Isentropic efficiency(ηCAi)=85%
Polytropic efficiency (ηPCA)(ηPCA) of Compressor A:
κ=1.4;κ−1κ=1.4−11.4=0.2857;κκ−1=1.41.4−1=3.5
ηPCA=lnπCκ−1κln1+πCκ−1κ−1ηCAi=ln4.50.2857ln1+4.50.2857−10.85=87.8%
Compressor B
Inlet total pressure(Pt1) = 101 kPaInlet total pressure(Pt1)=101kPa
Inlet total temperature(Tt1) = 18 + 273 = 291 KInlet total temperature(Tt1)=18+273=291K
Exit static pressure(Ps2) = 620 kPaExit static pressure(Ps2)=620kPa
Exit static temperature(Ts2) = 250 + 273 = 523 KExit static temperature(Ts2)=250+273=523K
Exit velocity(V2) = 150 m/sExit velocityV2=150m/s
Exit total temperature:Tt2=Ts2+V222cP=523+150×1502×1004=534.2K
Exit total pressure:Pt2Ps2=Tt2Ts2κκ−1=534.25233.5=1.077Pt2=1.077×620=667.75kPa
Polytropic efficiency (ηPCB)(ηPCB) of Compressor B:

Now

which yields

Thus, Compressor B is more efficient than Compressor A.
Example 1.2
The thermodynamic performance of a gas turbine working on a Brayton cycle is given below:
| Ideal Cycle | Real Cycle | |
|---|---|---|
| Compressor specific work input (kJ/kg) | 350 | 407 |
| Specific energy input to cycle (kJ/kg) | 758 | 700 |
| Turbine specific work output (kJ/kg) | 758 | 705 |
| Net specific work (kJ/kg) | 408 | 298 |
| Cycle thermal efficiency | 54% | 42% |
If the polytropic efficiency of the compressor is 90 percent, compute the polytropic efficiency of the turbine. Assume κ = 1.4κ=1.4 and cP = 1004 J/(kg K)cP=1004J/kgK throughout the cycle.
Solution
Compressor
Ideal compressor work = 350 kJ/kgIdeal compressor work=350kJ/kg
Actual compressor work = 407 kJ/kgActual compressor work=407kJ/kg
Isentropic efficiency(ηCi)=350407=0.86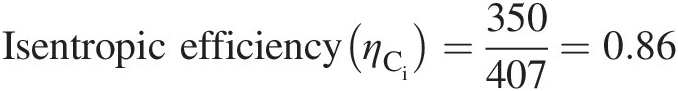

With the given compressor polytropic efficiency of 0.90, we can compute the compressor pressure ratio ππ from the following equation from Chapter 2 (using an iterative solution method, e.g., “Goal Seek” in Excel):

giving π = 12.75π=12.75.
Turbine
Ideal turbine work = 758 kJ/kgIdeal turbine work=758kJ/kg
Actual turbine work = 705 kJ/kgActual turbine work=705kJ/kg
Isentropic efficiency(ηTi)=705758=0.93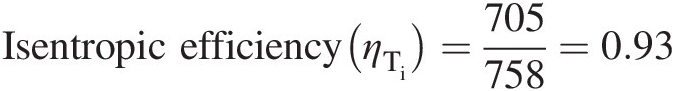
In the given Brayton cycle, we have turbine pressure ratio equal to compressor pressure ratio. The polytropic efficiency of the turbine is then computed from the following equation from Chapter 2:
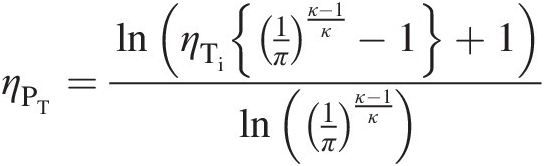
giving ηPT = 0.901ηPT=0.901. Note that ηPC>ηCiηPC>ηCi and ηPT < ηTiηPT<ηTi.
Problems
1.1 Using the analysis of Brayton cycle presented in Chapter 2, derive Equation 1.1.
1.2 Using the analysis of Brayton cycle presented in Chapter 2, derive Equation 1.2.
1.3 Derive Equation 1.3.
1.4 Derive Equations 1.5 and 1.6.
1.5 Using the relationships between the polytropic efficiency and isentropic efficiency presented in Chapter 2 and assuming a polytropic efficiency of 0.9 for both the compressor and turbine, re-plot Figure 1.9.
1.6 For a gas turbine with fixed Tt3/Tt1Tt3/Tt1, give a physics-based argument to explain why the compressor pressure ratio needed to maximize Wnet/cpTt1Wnet/cpTt1 is lower than that needed to maximize ηthηth.
1.7 Show that two compressors, one with 4/1 pressure ratio and overall isentropic efficiency of 84.2 percent, and the other with 8/1 pressure ratio and overall isentropic efficiency of 82.7 percent, have an equal polytropic efficiency of ~87 percent. If these two compressors are operated together in series, calculate the overall isentropic efficiency of the combined unit. Assume κ = 1.4κ=1.4.
1.8 A gas turbine, schematically shown in Figure 1.13, draws in air from atmosphere at 1 bar and 10°C and compresses it to 5 bar with an isentropic efficiency of 80 percent. The air is heated to 1200 K at constant pressure and expanded through two stages in series back to 1 bar. The high-pressure turbine (gas generator turbine) produces just enough power to drive the compressor. The low-pressure turbine (power turbine) is connected to an external load and produces 80 kW of power. The isentropic efficiency is 85 percent for each turbine stage. Assume κ = 1.4κ=1.4 for the compressor and κ = 1.333κ=1.333 for both turbines. The gas constant RR is 287 J/(kg K) for the entire cycle. Neglect the increase in mass due to the addition of fuel in the combustion chamber. Calculate: (a) the mass flow rate of air, (b) the inter-stage pressure of the turbines, and (c) the thermal efficiency of the cycle.

Figure 1.13 A gas turbine engine using a gas generator turbine and a power turbine (Problem 1.8).
1.9 Consider the frictionless flow of a calorically perfect gas in a channel with thermal interaction. For the case in which the wall is shaped to keep the Mach number constant, find: (a) an expression for both static and total pressure ratios Ps2/Ps1Ps2/Ps1 and Pt1/Pt1Pt2/Pt1 in terms of κκ, MM, and Tt2/Tt1Tt2/Tt1 and (b) an expression for the area ratio A2/A1A2/A1 in terms of the same variables. Hint: As we know from the Rayleigh flow (frictionless, constant-area channel flow) that the total pressure changes due to heat transfer. This important relationship between the changes in total pressure due to the changes in total temperature is governed by the following equation:

1.10 A gas turbine for aircraft propulsion is mounted on a test bed. Air at 1 bar and 293 K enters the compressor at low velocity and is compressed through a pressure ratio of 4 with isentropic efficiency of 85 percent. The air then passes to a combustion chamber where it is heated to 1175 K. The hot gas then expands through a turbine which drives the compressor and has an isentropic efficiency of 87 percent. The gas is then further expanded isentropically through a nozzle leaving at the speed of sound. The exit area of the nozzle is 0.1 m2. Assume κ = 1.4κ=1.4 for the compressor and turbine exhaust nozzle, κ = 1.333κ=1.333 for the turbine, and R = 287 J/(kg K)R=287J/kgK for the entire cycle. Neglect the increase in mass due to the addition of fuel in the combustion chamber. Sketch the open thermodynamic cycle on a T − sT−s diagram and determine: (a) the pressure at the turbine and nozzle outlets, (b) the mass flow rate, and (c) the thrust on the engine mountings.
1.11 In this problem, schematically shown in Figure 1.14, you are asked to compute the loss in total pressure due to the mixing of a low momentum flow (B) with a high momentum flow (A) as shown in the figure below with additional flow and geometric data for a constant-area, adiabatic annular duct. Neglect the axial velocity of flow B. The mass flow rate of flow B is 2 percent of the mass flow rate of flow A, which enters the duct at a Mach number of 0.8. Both flows are fully mixed at section 2. Assume that the total pressure at section 1 corresponds to that of flow A, and neglect any pressure loss due to wall friction.
a) Verify that Ps2 = 177572 PaPs2=177572Pa.
b) Compute the loss in total pressure between sections 1 and 2.

Figure 1.14 Mixing of two compressible flows in an adiabatic annular duct (Problem 1.11).
1.12 Figure 1.15 shows schematically a 200 MW modern gas turbine engine for power generation. The operating cycle parameters for the baseline design are given as follows:
Pt1 = Pt4 = 101.325 kPaPt1=Pt4=101.325kPa
Tt1 = 15 ˚ CTt1=15°C
Compressor pressure ratio(Pt2/Pt2) = 20Compressor pressure ratio(Pt2/Pt1)=20
Compressor pressure ratioatthe point of turbinecooling flow extraction(Pt2′/Pt1)=10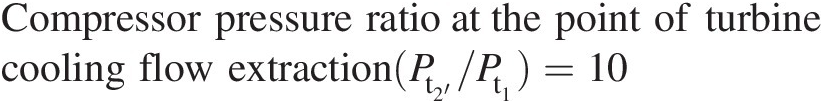
Turbine cooling flow(ṁcooling)=20percent of the compressorinlet flow(ṁengine)
Combustor total pressure loss = 1 percent of compressor exit total pressureCombustor total pressure loss=1percent of compressor exit total pressure
Turbine inlet temperature(T3) = 2000 KTurbine inlet temperatureT3=2000K
Compressor polytropic efficiency(ηPC) = 92%Compressor polytropic efficiency(ηPC)=92%
Turbine polytropic efficiency(ηPT) = 92%Turbine polytropic efficiency(ηPT)=92%
Ratio of specific heats across compressor(κC) = 1.4Ratio of specific heats across compressorκC=1.4
Ratio of specific heats across turbine(κT) = 1.33Ratio of specific heats across turbineκT=1.33
Rair = 287 J/kg KRair=287J/(kgK)
Calculate engine flow rate (ṁengine ) and cycle thermodynamic efficiency (ηthηth) for the following cases:
(a) Baseline design
(b) Upgraded baseline design with ηPC = ηPT = 93%ηPC=ηPT=93%
(c) Upgraded baseline design with Pt 2′/Pt 1 = 9Pt2′/Pt1=9
(d) Upgraded baseline design with ṁcooling=0.18ṁengine


Assume that the turbine cooling flow does not contribute to turbine work. Show details of all your calculations for the baseline design only. Tabulate your calculation results for all four cases.

Figure 1.15 An air-cooled gas turbine engine (Problem 1.12).
References
Bibliography
Nomenclature
- BBD
Box-Behnken design
- cpcp
Specific heat at constant pressure
- cvcv
Specific heat at constant volume
- CC
Combined cycle
- CCD
Central composite design
- CFD
Computational fluid dynamics
- CMC
Ceramic matrix composite
- COT
Combustor outlet temperature
- DNS
Direct numerical simulation
- DOE
Design of experiments
- ee
Specific total energy
- EDF
Electricity of France
- FF3
3-Level full factorial design
- gjgj
Transfer function for yjyj
- GE9X
Trade mark of GE
- GT
Gas turbine
- GTCC
Gas turbine combined cycle
- IFS
Internal flow system
- IAS
Internal air system
- LES
Large eddy simulation
- kk
Number of independent variables in MCS and RSM
- ṁ

Mass flow rate
- ṁa

Compressor inlet air mass flow rate
- ṁc

Combustor inlet air mass flow rate
- ṁe

Turbine exhaust mass flow rate
- ṁf

Fuel mass flow rate into combustor
- ṁg

Mass flow rate of combustor gases
- ṁi

Internal air mass flow rate
- ṁiT

Internal air mass flow rate for turbine cooling
- MM
Mach number
- MCS
Monte Carlo simulation
- PP
Pressure
- q̇j

Diffusive energy flux vector
- QSQS
Energy source term
- RR
Gas constant
- RSE
Response surface equation
- RSM
Response surface modeling
- SiSi
Source term of the momentum equation in tensor notation
- ST
Steam turbine
- SAS
Secondary air system
- tt
Time
- TT
Temperature
- TIT
Turbine inlet temperature
- uiui
Velocity in tensor notation
- ww
Specific work
- w˜

Specific work of a cooled gas turbine
- Ẇ

Rate of work transfer
- xixi
Cartesian coordinates in tensor notation; input (design) variables
- yjyj
Dependent (response) variables
Subscripts and Superscripts
- CC
Compressor
- chch
Chargeable
- CCCC
Combined cycle
- GTGT
Gas turbine
- ii
Summation index in RSE
- jj
Summation index in RSE
- nchnch
Nonchargeable
- netnet
Net (turbine work output minus compressor work input)
- ss
Static
- STST
Steam turbine
- tt
Total (stagnation)
- TT
Turbine
- (−)−
Average
Greek Symbols
- β0β0
Constant in RSE
- βiβi
Coefficients of linear terms in RSE
- βiiβii
Coefficients of pure quadratic terms in RSE
- βijβij
Coefficients of cross-product terms in RSE
- ηCiηCi
Compressor isentropic efficiency
- ηPCηPC
Compressor polytropic efficiency
- ηPTηPT
Turbine polytropic efficiency
- ηTiηTi
Turbine isentropic efficiency
- η˜Ti

Cooled-turbine isentropic efficiency
- ηthηth
Cycle thermal efficiency
- κκ
Ratio of specific heats (κ = cP/cvκ=cP/cv)
- μiμi
Mean of independent variable xixi
- ππ
Pressure ratio
- ρρ
Density
- σijσij
Stress tensor
- ΩΩ
Angular velocity