Abstract
There are only so many technologies and devices that have the same type of impact as that of the internal combustion (IC) engine. Its ubiquitous nature pervades our everyday life, many times without us even realizing it. Whether it be the spark-ignited engine driving our vehicle, the compression-ignition engine hauling food to our local grocery store, the jet engine we hear flying 38,000 feet overhead, or the gas turbine powering the laptop screen from which we read this article, internal combustion engines are quite literally intricately and irreplaceably woven into our daily lives. The internal combustion has taken on many different forms throughout its long, greater than 150-year history, but combustion has always been one of its few constants. Indeed, combustion is even in its name and helps differentiate it from other thermodynamic work devices such heat engines and fuel cells.
Introduction
There are only so many technologies and devices that have the same type of impact as that of the internal combustion (IC) engine. Its ubiquitous nature pervades our everyday life, many times without us even realizing it. Whether it be the spark-ignited engine driving our vehicle, the compression-ignition engine hauling food to our local grocery store, the jet engine we hear flying 38,000 feet overhead, or the gas turbine powering the laptop screen from which we read this article, internal combustion engines are quite literally intricately and irreplaceably woven into our daily lives. The internal combustion has taken on many different forms throughout its long, greater than 150-year history, but combustion has always been one of its few constants. Indeed, combustion is even in its name and helps differentiate it from other thermodynamic work devices such heat engines and fuel cells.
In spite of combustion’s constancy in the internal combustion engine, the nature of this combustion has always been of interest, of fervent research, of subject of study, and of key importance to the internal combustion engine’s ability to deliver power efficiently and cleanly. Indeed, to this day, there is much to learn about combustion within the internal combustion engine and how this combustion may be exploited better to achieve goals for healthy benefit to society.
A key advancement to this exercise of improving our knowledge and use of combustion has been experimental visualization of flames, species concentrations, fluid motions, and other gradients that occur during combustion within an internal combustion engine. Tremendous progress has been made to precisely measure features of in-cylinder or in-burner reactions that not only aid our understanding of the phenomena taking place but also equip confidence in the use of simulation-based tools that further lend insight where experimentation cannot (at least at the present).
This chapter features some of the more recent major advancements in optical or visual measurements being made of combustion as used in internal combustion engines. I am gratefully indebted to the authors’ whose work follows for their dedicated contribution to this chapter. Roughly half the submissions involve internal combustion engines of the reciprocating piston type, including those from Drs. Busch, Ciatti, Mueller, Musculus, and Sjoberg. The remaining half involve visualization of the combustion present in open internal combustion engines, such as jet engines and gas turbines, and include the contributions by Drs. Han, Kero, Stohr, and Versailles. What is most intriguing about these visualizations is not so much the qualitative features one can extract – which by themselves are incredibly useful particularly from an educator’s perspective – but the quantitative features that are used to make impactful conclusions that change the course of research or execute substantial design decisions leading to a better engineered product.
3.1 Single-Cylinder Version of a Cummins Six-Cylinder N-14 Highway Truck Engine
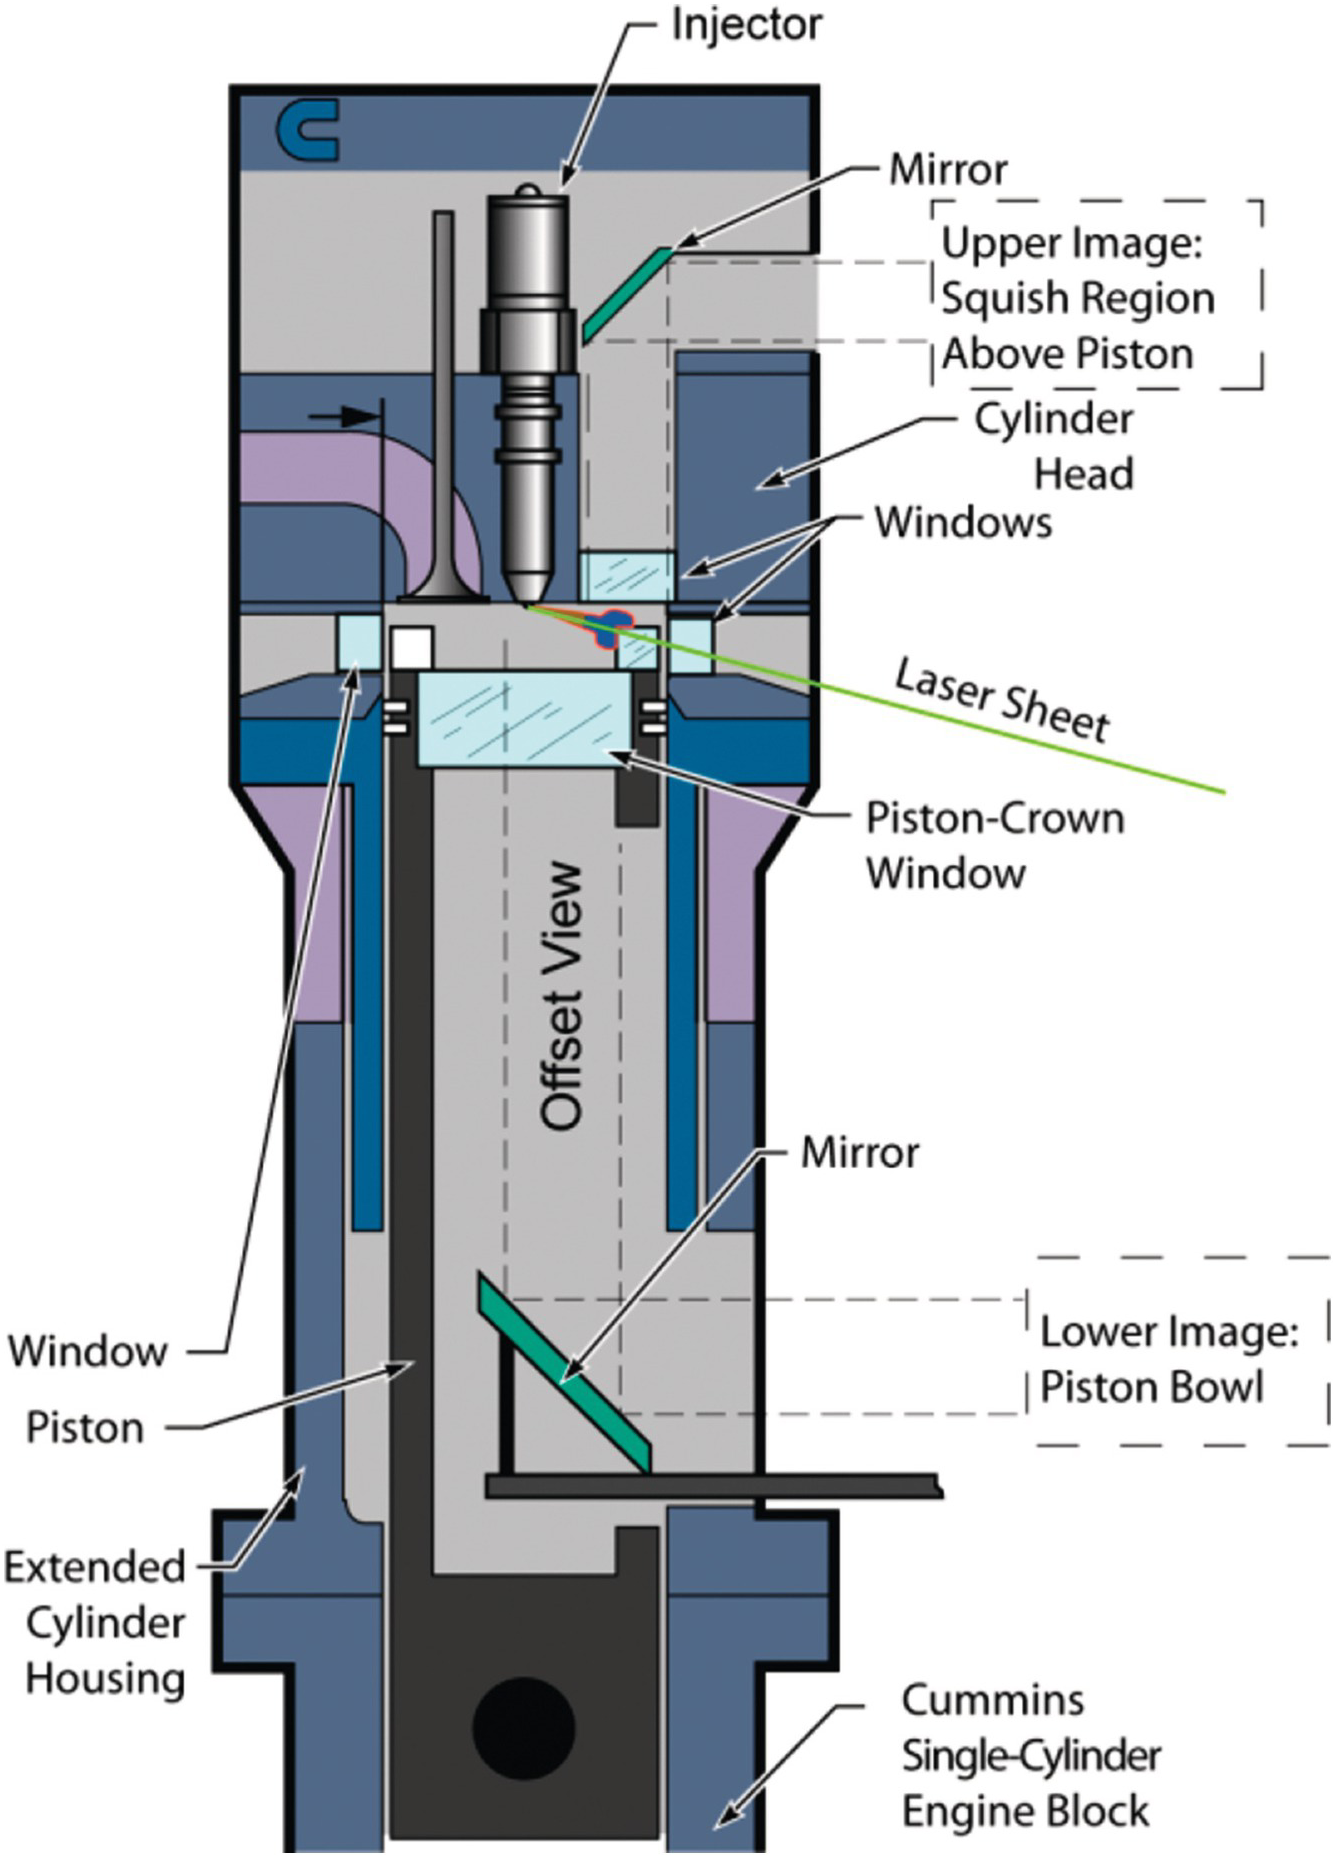
Fuel injection, combustion, and pollutant formation processes are studied in an optically accessible, single-cylinder version of the Cummins six-cylinder N-14 highway truck engine. Windows in the cylinder walls provide access for laser illumination, while windows in the extended piston and cylinder head provide imaging access to the combustion bowl and “squish” region above the piston. Using lenses, high-energy pulsed laser beams are formed into thin sheets to probe the cross-section of the in-cylinder jets, which are imaged by intensified cameras.
3.2 Mixing-Controlled Combustion in a Heavy-Duty Compression-Ignition Engine
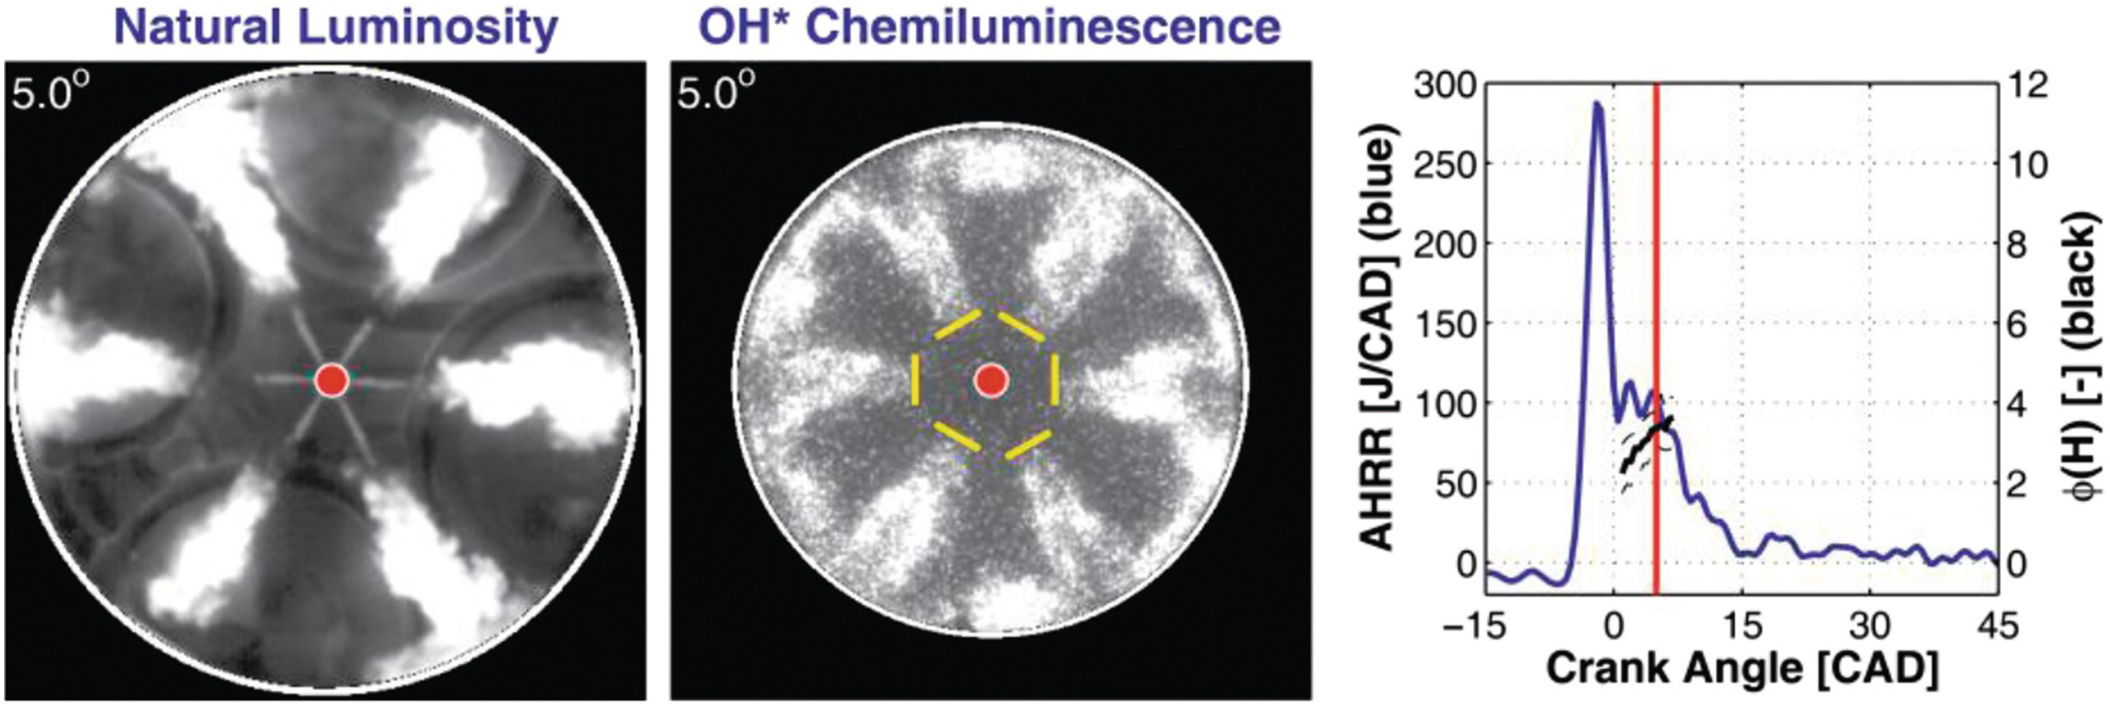
This figure shows an in-cylinder image of natural luminosity (NL, left), an in-cylinder image of electronically excited hydroxyl radical chemiluminescence (OH* CL, center), and the apparent heat-release rate (AHRR) and the estimated equivalence ratio at the flame lift-off length (ϕ(H), right) during conventional, mixing-controlled combustion in a heavy-duty diesel engine. The images were acquired at 5.0 crank-angle degrees (CAD) after top-dead-center by viewing the combustion through a fused-silica window in the bowl of the piston. The piston bowl diameter is indicated by the larger white circle in each image, and the location of the fuel injector tip is indicated by the red dot at the center of each image. The NL signal is dominated by incandescence from hot soot, with the six saturated (white) regions corresponding to soot from each of the six fuel sprays. Liquid fuel in the six fuel sprays is also visible as gray lines emanating from the injector tip due to NL signal from hot soot being elastically scattered from the fuel droplets to the camera. The NL and OH* CL cameras detected photons with wavelengths in the range of 380–1000 nm and 308 ± 10 nm, respectively. The OH* CL image shows regions where high-temperature chemical reactions are occurring. The distance from the injector orifice exit to the most upstream extent of this region is known as the flame liftoff length, and the liftoff length for each spray is shown with a yellow bar. The estimated ϕ(H) values shown in the plot on the right are > 2, indicating that soot should be present, which is consistent with the hot soot evident in the NL image. The AHRR plot shows a typical premixed-burn spike followed by a period of mixing-controlled heat release, which is relatively brief at this 6 bar gross indicated mean effective pressure operating condition. Other engine operating conditions are: 1,500 rpm speed, 240 MPa injection pressure, −5 CAD start of combustion timing, 21% intake-oxygen mole fraction, 30°C intake manifold temperature, and 85°C coolant temperature. The red vertical line on the AHRR figure indicates the timing that corresponds to the images shown, which were acquired when 70% of the cumulative fuel mass was burned. The fuel is a commercial #2 diesel fuel.
Reference
3.3 Visible Combustion Emissions in a Swirl-Supported, Light-Duty Diesel Engine
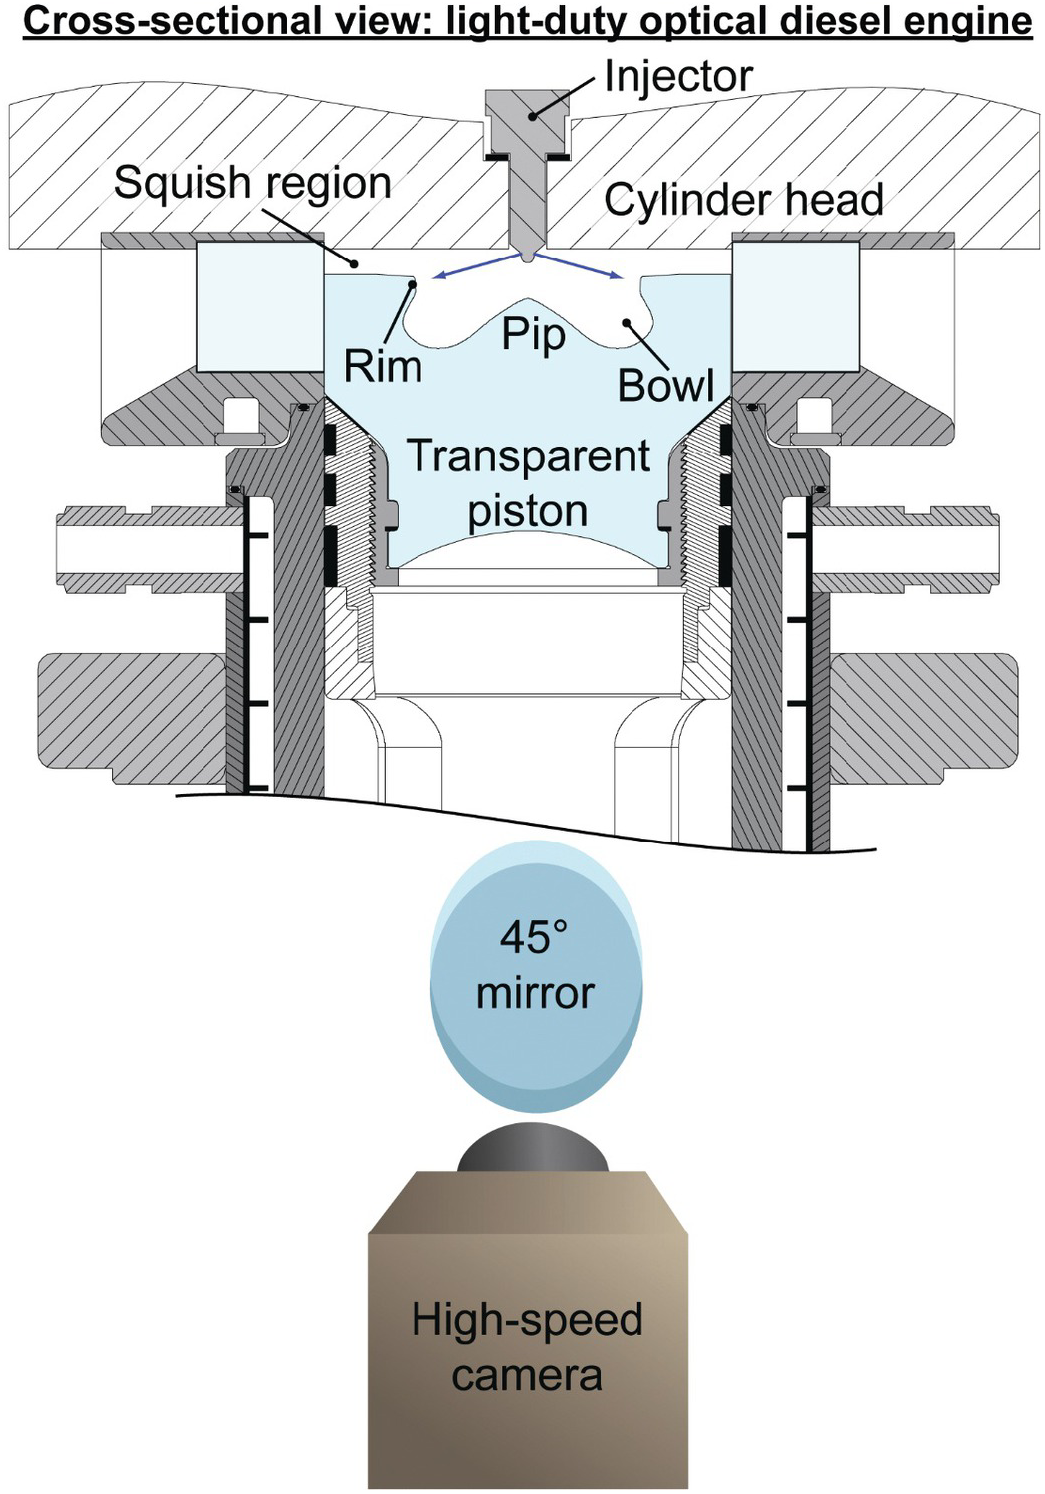
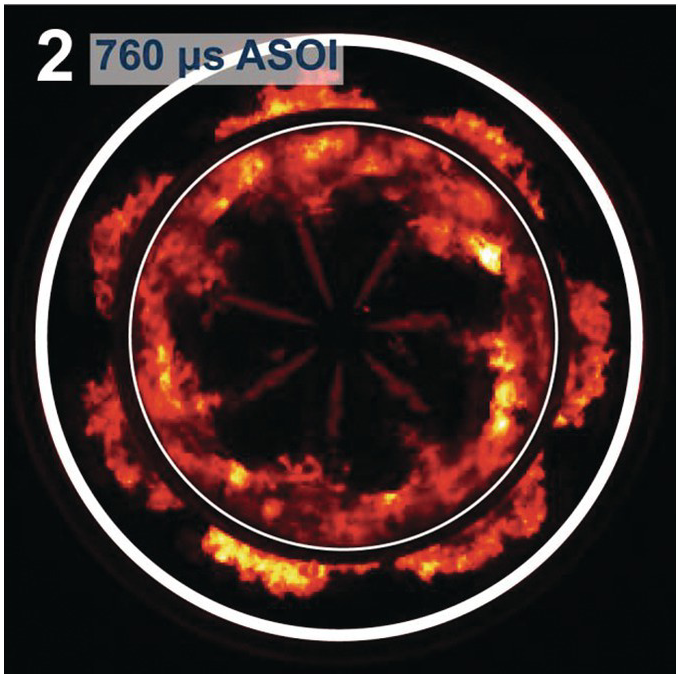
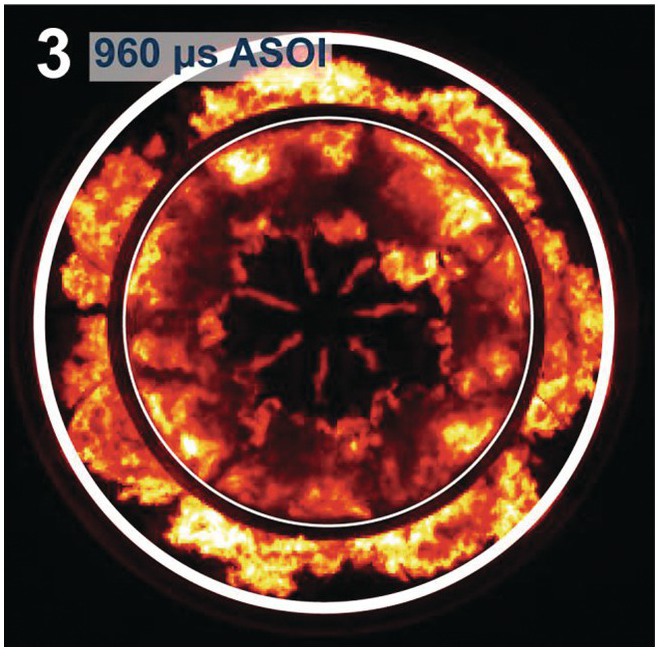
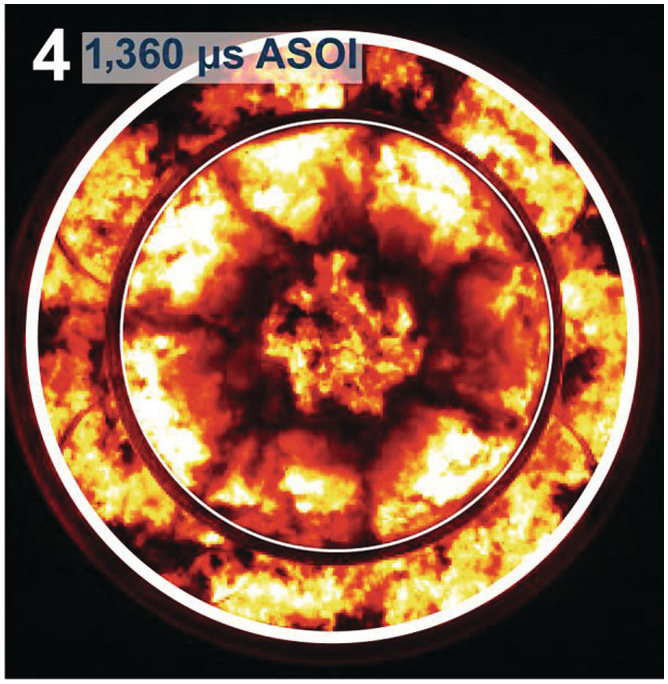
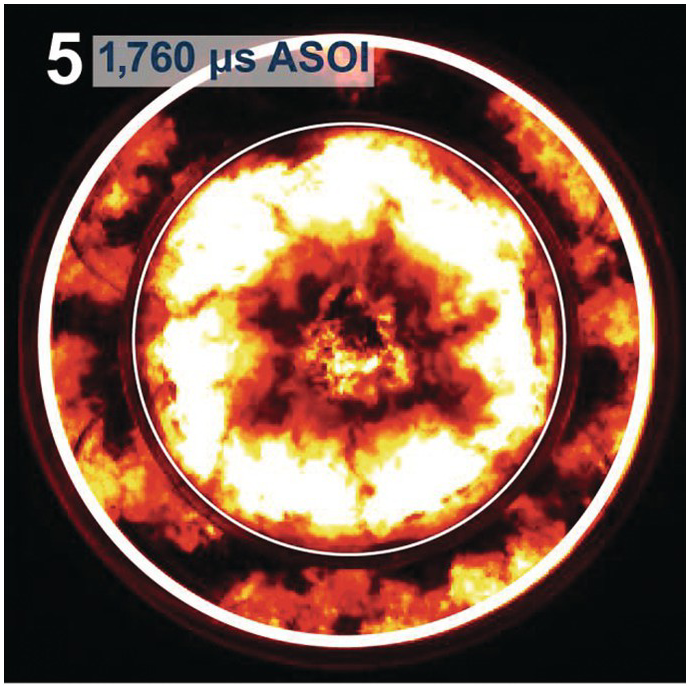
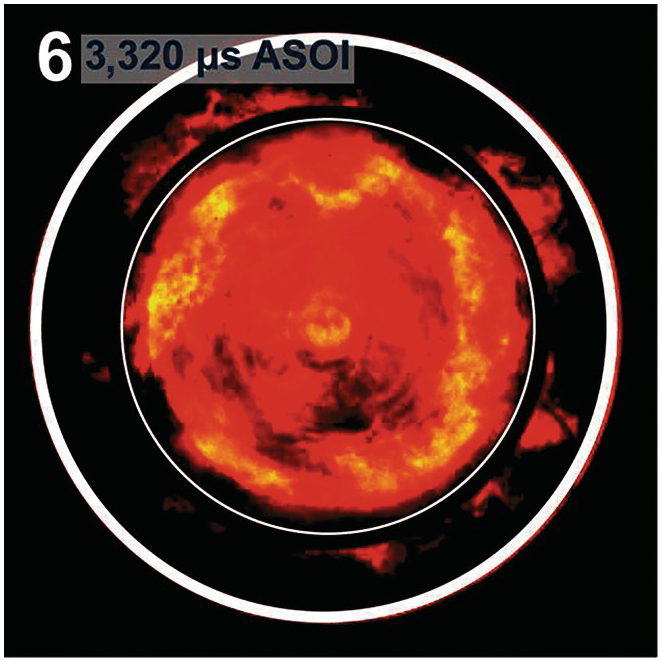
This series of images taken with a high-speed camera show visible and near-infrared combustion emissions inside a swirl-supported, optical diesel research engine. The images are monochromatic, but are shown with a false color scaling to help distinguish regions of high intensity (yellow and white) from regions of low intensity (dark-red and orange). Images are taken through the engine’s transparent piston, looking up at the cylinder head, as shown by the cross-sectional view. The thick white circle represents the edge of the field of view, which is several millimeters smaller than the cylinder bore.
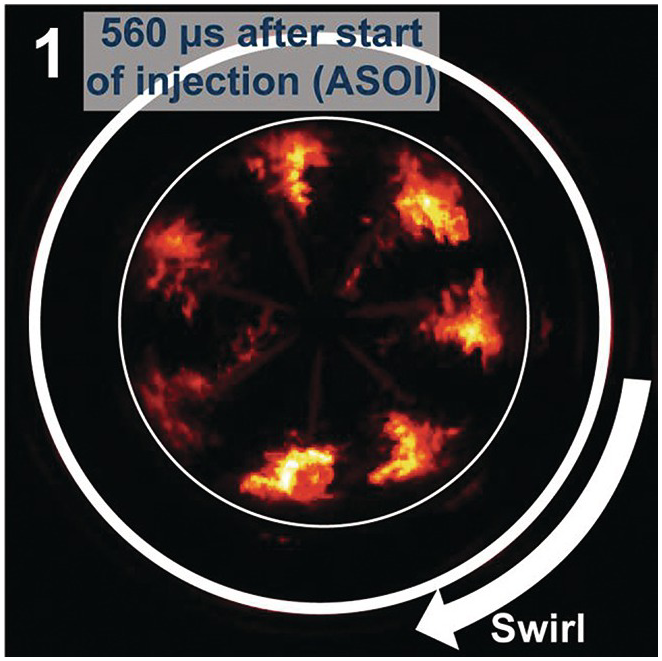
Figure 3.4 (560 µs after the start of injection – ASOI): Seven jets of liquid fuel issuing from the centrally mounted fuel injector are dimly illuminated by the hot, glowing soot particles that form in regions where fuel has mixed with hot air and begun to burn. The swirling air in the cylinder has transported the fuel–air mixture so that the soot clouds are now displaced from the liquid jets in a clockwise direction. The presence of these glowing soot particles indicates hot combustion of rich mixtures. The piston is just starting to move downward at the beginning of the expansion stroke.
Figure 3.5 (760 µs ASOI): combustion continues as the outwardly propagating sprays impinge on the piston bowl rim. Part of the combusting mixture is deflected down into the piston bowl, and part of the mixture continues to propagate outward into the region between the piston and the cylinder head (this is called the squish region).
Figure 3.6 (960 µs ASOI): The injection of liquid fuel is nearing completion. Mixture in the bowl follows the contour of the wall and is redirected inward and upward along the central “pip” while also being transported by the clockwise swirl. This three-dimensional flow pattern is often referred to as a toroidal vortex. Outward propagation continues into the squish region.
Figure 3.7 (1,360 µs ASOI): The last fuel to be injected mixes poorly, and soot forms as it burns near the center of the cylinder. The toroidal vortex in the bowl supports the mixing of partially burned fuel and air, as the rate of fuel energy conversion to heat is near its maximum. Combusting mixture in the squish region continues to propagate outward.
Figure 3.8 (1,760 µs ASOI): Regions of hot soot are consumed by combustion reactions in the squish region. Soot intensities in the bowl are near their maximum values. The inward motion associated with the toroidal vortex in the bowl begins to decay, but swirling motion continues.
Figure 3.9 (3,320 µs ASOI): Late in the combustion event, most of the hot soot is observed in the bowl, and the downward motion of the piston acts to expand and cool the cylinder contents. Oxidation of soot requires high temperatures, as well as mixing and reaction with an oxidizer, so turbulent mixing processes and chemical kinetics play important roles in this stage of combustion.
3.4 Sequential Images of Gasoline Compression Ignition Inside an Engine

High-speed imaging captured this sequence of the auto-ignition and combustion progression of gasoline used in a compression ignition engine. The work is important to defining the compression ignition characteristics of gasoline rather than standard octane ratings empirically defined for spark ignition, stoichiometric engines. The images are compared with advanced engine simulations to better understand the mechanism of gasoline auto-ignition.
3.5 Spray–Swirl Interactions Stabilize Stratified-Charge SI Operation by Reducing Flow Variability near the Spark
Research at Sandia National Laboratories has clarified the mechanism through which intake-generated swirl promotes stable combustion in stratified-charge spark-ignition (SI) engines operated on gasoline-type fuels. Using an optically accessible engine, the in-cylinder flow was examined with particle image velocimetry (PIV) for both swirling and non-swirling flows at an engine speed of 2,000 rpm. The measurements show that swirl makes the flow patterns of individual cycles more similar to the ensemble-averaged cycle, as exemplified in Figure 3.11. This effect is quantified in Figure 3.12 using a “flow similarity” parameter (Rp). With in-cylinder swirl, Rp remains consistently high for all examined cycles, indicating a high similarity between the ensemble-averaged flow and each individual cycle. Combustion data indicate a low IMEP variability of 1.4% for operation with swirl. In contrast, for operation without swirl, the average Rp is lower, and some cycles have very low Rp values. This leads to an unacceptably high IMEP varibility of 3.5%.

Figure 3.11 Cycle-to-cycle variations of flow pattern near spark plug 5°CA after EOI (end of injection)

Figure 3.12 Relevance index variations of flow patterns with and without swirl
The interaction of the eight fuel sprays with the swirling gas flow strongly contributes to the flow stabilization at the time and location of the spark, as described conceptually in the top portion of Figure 3.13. The flow measurements reveal that the fuel sprays displace low angular-momentum gas downward. In the wake of the spray, higher-angular-momentum gas from larger radii flows inward and increases its rotation rate due to conservation of momentum. This process creates a strong and very repeatable vortex near the spray centerline at the time of spark, as demonstrated by the vector fields in Figure 3.13. Related research efforts have shown that the increased flow similarity stabilizes the combustion process by reducing variability in both the ignition event and in the flame spread throughout the remaining charge; see Ref. 1. This avoids the occurrence of slow-burning cycles that may develop into partial burns. In contrast, the flow fields without swirl in the bottom row of Figure 3.11 show no evidence of such a stabilizing vortex. Moreover, the single-cycle examples without swirl are quite different from the average flow field, consistent with the observed higher combustion variability. Using this understanding of swirl–spray interactions, combustion engineers can optimize injector and flow parameters to maximize combustion stability and enable highly efficient stratified-charge SI operation.

Figure 3.13 Conceptual model of spray-swirl interactions that create a repeatable vortex near the spark plug, based on PIV imaging experiments
References
The top portion of Figure 3.13 was published previously in:
An appropriate reference for the discussed stabilization of the flame spread is:
3.6 Quantitative Narrowband Infrared Imaging of a Turbulent Premixed Flame
Figure 3.14 shows quantitative time-dependent measurements of the narrowband (2.58 ± 0.03 μm, 2.77 ± 0.1 μm, and 4.38 ± 0.08 μm) radiation intensities emitted from a turbulent premixed flame. Figure 3.15 shows ensemble averaged images of 6,400 time-dependent images for the three infrared narrow bands. The radiation intensity measurements of the flame in the 1–3 μm range were acquired using a FLIR Phoenix camera (InSb detector array with liquid nitrogen (LN2) cooling) and those in the 3–5 μm range were acquired using a FLIR SC6000 camera (InSb detector array with thermoelectric (TE) cooling). The images were taken at 430 Hz with an exposure time of 10 μs. Each image consists of six panels. These panels are temporally independent but spatially correlated. Figure 3.16 shows a comparison of measured and computed radiation intensity of 4.38 ± 0.08 μm band emitted from the turbulent premixed flame. Measured temperature profiles, state relationship, and stochastic time and space analysis modeling turbulent radiation interaction were employed for radiation intensity computation. Emission coefficients were calculated using narrowband model from RADCAL or line-by-line model with line strengths and widths from HITRAN and HITEMP databases.


The flame was established on a rim stabilized co-flow burner with an inner diameter (D) of 15 mm. A methane flow rate of 84 ± 1 mg/s and an equivalence ratio of 0.8 were chosen for the present measurements. A pilot flow of hydrogen at 2 ± 0.05 mg/s through a ring of annular holes was applied to stabilize the flame. The nominal jet exit Reynolds number (8950 ± 50) is based on the cold gas properties, the exit velocity of the central jet burner, and the burner diameter.
This combined experimental and computational work studied infrared radiation intensity emitted by individual and combined bands of H2O and CO2 from a turbulent premixed flame. The purpose was to study the thermal radiation properties of turbulent premixed flames, which provides insight into flame structures by revealing detailed features of the flame stabilization zone near the burner exit, the wrinkled flame zone at intermediate distances, and the broader combustion zone near the flame tip. In addition, the agreement between measured and computed radiation intensities of a turbulent premixed flame demonstrates a potential application in full-scale industrial facilities such as gas turbine combustors for combustion diagnostics and computational model validation.
This work was supported by the US Department of Energy (DOE), National Energy Technology Laboratory (NETL), University Turbine Systems Research (UTSR) Program with DOE award number DE-FE0011822.
3.7 Thermoacoustic Oscillation of a Confined Turbulent Swirl Flame


Turbulent swirl flames are commonly employed to drive gas turbines in stationary power plants or aeroengines. A major technical challenge is the occurrence of self-excited, so-called thermoacoustic instabilities that arise due to a complex feedback mechanism involving interactions of flow field, acoustics, and heat release. The instabilities lead to strong pressure oscillations that affect combustor performance and lifetime.
The feedback mechanisms have been studied experimentally in a partially premixed model gas turbine combustor with optical access. The combustor is operated with methane and air at a thermal power of 10 kW and an equivalence ratio of 0.75, where a thermoacoustic oscillation of ≈300 Hz occurs. Instantaneous flow fields and reaction zones have been measured simultaneously in a transverse section using stereoscopic particle image velocimetry and planar laser-induced fluorescence of the OH radical, respectively.
The images show combinations of OH distribution (gray scale) and velocity field (colored vectors). Regions without OH (black) represent unburned gas, whereas high levels of OH (light-gray to white) indicate superequilibrium OH formed in the reaction zones. Medium and low levels of OH (medium and dark gray) represent burned gas whose OH concentration has decayed toward equilibrium while it was transported away from the reaction zone. The vector color indicates the out-of-plane velocity.
The three images represent different times during the cycle of the pressure oscillation. In the first image a strong inflow of unburned gas is observed (region of red vectors) and the reaction is confined to the inner zone. In the second image, most of the unburned gas burns along extensive wrinkled reaction zones, which leads to a strong overall heat release. As a result, burned gas is present in most part of the third image, and the overall heat release is reduced until the inflow of fresh gas at the beginning of the next oscillation cycle. In summary, the measurements reveal the considerable changes of the reaction zone topology associated with the combustion instability.
The work was funded by German Aerospace Center (DLR) within the project MVS.
Reference
Similar images were published in:
3.8 Effects of H2 Enrichment on Flame Stability and Pollutant Emissions for a Kerosene/Air Swirled Flame with an Aeronautical Injector
Experimental studies are conducted on an aeronautical kerosene spray injection system to characterize the flame stability and pollutant emissions of two-phase kerosene/air flames, at conditions similar to the idle phase of an aircraft engine (P = 0.03 MPa and T = 500 K). A multi-point fuel injector (SAM 146 aircraft engine) is provided by SAFRAN-AE and integrated in a fully transparent combustion chamber (Figure 3.21). Hydrogen as a surrogate of reformer gases from kerosene reforming is added in a small amount to enhance flame stability and to reduce NOx and CO on the idle and taxi phases. Hydrogen is injected directly into three vanes (120 degrees) of the central air swirler of the injector by three pipes, with an external diameter of 3 mm (Figure 3.22). When hydrogen is used and the kerosene is off, one can see three hydrogen/air pilot flames at the exit of the injector in the bottom of the combustion chamber (Figure 3.23). When the kerosene is on, a classical swirled flame is obtained (Figure 3.24) and the flame stability is improved, and the lean blow-off limit is reduced by the presence of these three pilot flames.


The injection system consists of two air swirlers and two kerosene-supplying pipes. Considering the operating condition (1/15 of the takeoff setting), only the first kerosene-supplying pipe is used. The air blast injector generates a spray SMD close to 50 microns. The swirl number is 0.73, with the air and kerosene mass flow rates of 35 g/s and 1.6 g/s, respectively. The amount of H2 enrichment is 2.8%, defined by the ratio of the H2 to kerosene mass flow rate corrected by the ratio of their low heating values.
The authors gratefully acknowledge the financial support of SAFRAN-AE and SAFRAN Tech.
References
3.9 Effects of Carbon Dioxide Addition on Turbulent Premixed Flames
Figure 3.25 shows averaged visible images of turbulent premixed flames with varying CO2 addition of 0%, 5%, and 10%. Each image is an ensemble average of 100 images taken by a Phantom v7.1 at 100 Hz with 10 ms exposure time. Figure 3.26 shows instantaneous images using OH laser induced fluorescence (PLIF) for these flames. The image was taken by a Phantom v7.3 camera with a LaVision high-speed IRO intensifier at 9 kHz with an exposure time of 50 ns. Each image consists of nine panels. These panels are temporally independent but spatially correlated. Each panel has a 15% overlap with an adjacent panel along the axial axis of the burner centerline. The bright areas in the images indicate combustion products with a finite concentration of the OH radical, while the dark areas show unburned reactants with no detectable OH radical. The brightness of each pixel shows the OH fluorescence intensity received by the camera.


The flames were established on a piloted axisymmetric reactor assisted turbulent (PARAT) burner. The burner nozzle exit has an 18 mm diameter (D) annular cross-section with a 3 mm-thick wall. The burner is 523 mm tall with diverging (bottom) and converging (near the nozzle exit) sections. To sustain a flame at large Reynolds numbers, a non-premixed pilot flame of undiluted hydrogen was utilized. The pilot flame was generated by flowing hydrogen through a 2 mm-wide annulus just outside of the nozzle outer wall. Turbulence generator plates were installed within the burner. The lower turbulence generator plate is located before the final convergence of the flow channel, 177 mm upstream of the nozzle exit. This plate has five circular holes with a diameter of 6.35 mm and a 94% blockage ratio. The upper turbulence generator plate is placed 30 mm upstream of the nozzle exit. The upper plate has 13 circular holes with a diameter of 2.54 mm and an 87% blockage ratio.
The flames were operated at identical jet Reynolds numbers (10,000), and the equivalence ratios were chosen as 0.8, 0.84, and 0.89 for flames with, respectively, 0%, 5%, and 10% CO2 addition to yield identical adiabatic flame temperature (2,030 K) in order to minimize the thermal effects on flame propagation and structure. The unburned mixture Lewis numbers of the flames differed by a maximum of 2%, thereby minimizing transport effects on the flame structure. The heat release rates for the turbulent premixed flames and pilot flames calculated using lower heat values were about 6 kW and 0.4 kW, respectively.
This experiment studied the effects of exhaust gas recirculation (EGR) emulated by CO2 addition on turbulent premixed flames with minimized thermal and transport effects. The purpose was to better understand the effects of EGR on turbulent premixed combustion in gas turbine systems with identical turbine inlet temperature and generate an experimental database for the development and validation of a combustion model and a computational tool for gas turbine applications.
Funding for this work was provided by the US Department of Energy, National Energy Technology Laboratory (NETL), University Turbine Systems Research (UTSR) Program under Grant No. DE-FE0011822 and by the US Department of Energy, Division of Chemical Sciences, Geosciences, and Biosciences under Grant No. DE-FG02–03ER15391.
3.10 Application of a Dielectric Barrier Discharge (DBD) to Retard Flashback in Lean Premixed Dump Combustors
Lean, premixed combustors have the potential to significantly reduce nitrogen oxide emissions of gas turbine engines. However, as the fuel and air streams are mixed upstream of the combustion chamber, flashback can occur and significantly damage the premixer that is not designed to sustain high temperatures.
A technology based on non-thermal plasma discharges was developed at the National Research Council Canada. As shown in Figure 3.27, it employs a DBD actuator installed on the wall of the quartz premixer to produce a plasma layer. The charged molecules are entrained by the electric field across the electrodes and transfer their momentum to the neighboring neutral molecules. This results in a volumetric force close to the wall of the premixer, which locally accelerates the flow toward the combustion chamber. As the high-voltage, high-frequency AC electric signal is applied to the electrodes, the lean (equivalence ratio, φ, of 0.75) methane/air flame that was originally attached to the burner rim (Figure 3.28) is lifted and adopts a new stable position on the toroidal vortex located in the corner of the combustion chamber (φ = 0.75 in Figure 3.29(a) and φ = 0.99 in Figure 3.292(b)).


Figures 3.30 and 3.31 present a series of flame images taken with decreasing air flow rates for a fixed fuel flow rate of 0.102 g/s, without and with DBD actuation, respectively. The resulting reduction in overall flow rate and increase in equivalence ratio, leading to a rise in laminar flame speed, are two factors favoring flashback. It is observed that the actuated flame flashes back at a higher equivalence ratio, therefore demonstrating the ability of DBD actuators to prevent this phenomenon by changing the stabilization mechanism of flames in dump combustors.


This work was supported by the National Research Council Canada and the Natural Sciences and Engineering Research Council of Canada whose contributions are gratefully acknowledged.