Abstract
Our perception of a flame is strongly grounded in gravity’s influence. From our every interaction with fire from the first birthday candles we blew out, we each build an intuitive understanding of how a flame interacts with the hot air rising via buoyant convection. As researchers, our perceptions of how flames respond to our controls are unconsciously biased by this intrinsic buoyant flow.
Introduction
Our perception of a flame is strongly grounded in gravity’s influence. From our every interaction with fire from the first birthday candles we blew out, we each build an intuitive understanding of how a flame interacts with the hot air rising via buoyant convection. As researchers, our perceptions of how flames respond to our controls are unconsciously biased by this intrinsic buoyant flow.
It has been my experience that many renowned researchers come into the microgravity field of study with preconceived notions of how their flames will respond when gravity is removed, only to be flummoxed when something completely unexpected happens. When gravity is removed, suddenly new realms of fluid mechanics, heat transfer, and chemical reactions become accessible, which is one of the really rewarding aspects of studying microgravity combustion. This is a space-age, still evolving field that is rich for study. It also does not hurt that some of the experimental platforms for microgravity combustion are literally out of this world.
Microgravity combustion does have its challenges with diagnostics, however. Diagnostics have to be small and low power due to launch weight and cooling constraints for flight experiments, and for some drop tower tests they must also be able to withstand repeated 65 g impacts and vacuum conditions. Due to these serious constraints, microgravity flame diagnostics have lagged behind laboratory diagnostic systems. One can imagine the laser alignment issues associated with experiment packages that flex as gravity is removed and flex again during the high-gravity impacts. Recent advances in digital cameras have revolutionized flame imaging so that the dimmest blue flames can be captured even with high-speed movies. Many previously “invisible” microgravity flames can now be imaged, such as cool flames.
This section is organized by general topic, with subsections noted in parentheses: gaseous fuel flames (spherical and gas jets), liquid fuel flames (droplet, candles, and pool fires), and solid fuel flames (spherical, rods, and thin and thick flat sheets).
For further study of microgravity combustion, a good resource is Microgravity Combustion: Fire in Free Fall, by Howard D. Ross, ed., Academic Press, 2001. It provides an excellent framework of understanding and a number of color plates of older microgravity combustion graphics.
4.1 Gaseous Fuels
4.1.1 Cellular Instabilities in Premixed Flames
For many combustible mixtures and ambient conditions, instead of a smooth flame surface (Figure 4.1 top), irregular cells can spontaneously develop and grow over the flame surface as the premixed flame propagates outward, as shown in Figure 4.1 middle and bottom.

Figure 4.1 High-speed Schlieren images for spark-ignited spherically expanding flame under three different conditions demonstrating cellular instabilities that developed: (top): Rich H2/O2/N2 mixtures, equivalence ratio φ = 1.5, P = 1 atm, Le > 1; (middle) Rich H2/O2/N2 mixtures, φ = 1.5, P = 5 atm, Le > 1; (bottom) Lean H2/O2/N2 mixtures, φ = 0.4, P = 2 atm, Le < 1.
The presence of these cells increases the total (wrinkled) flame surface area and consequently the global flame propagation speed. Furthermore, with the continuous generation of these cells, the increase in the propagation speed can be accelerative, leading to the hypothesized scenarios that a wrinkled laminar flame can first transition to a turbulent flame, and eventually to a detonation wave.
There are two instability mechanisms that are intrinsic to the propagation of laminar premixed flames, namely the hydrodynamics, Darrieus-Landau (DL), instability, and the diffusional-thermal (DT) instability.
These instabilities are demonstrated in Figure 4.1: in the top row, the flame does not develop wrinkles because the pressure is not high and the deficit reactant, O2, is also a heavy molecule (Le > 1). In the middle row, the flame exhibits DL instability at high pressure, but not the DT instability (Le > 1). In the bottom row, the flame does not exhibit DL instability (P = 2 atm) but does exhibit DT instability because the deficit reactant, H2, is a light molecule (Le < 1).
This work was supported by the National Science Foundation.
4.1.2 Flame Balls
In 1944, Ya. B. Zeldovich predicted the possibility of stationary, steady spherical flames (“flame balls”) occurring in premixed gases that are supported exclusively by diffusion of reactants to a reaction zone and diffusion of thermal energy and combustion products away from this reaction zone. Flame balls are valid equilibrium solutions to the governing conservation equations for any combustible mixture, but they were predicted to be unstable (i.e., they would either expand beyond their equilibrium radius or collapse and extinguish) and thus not physically observable.
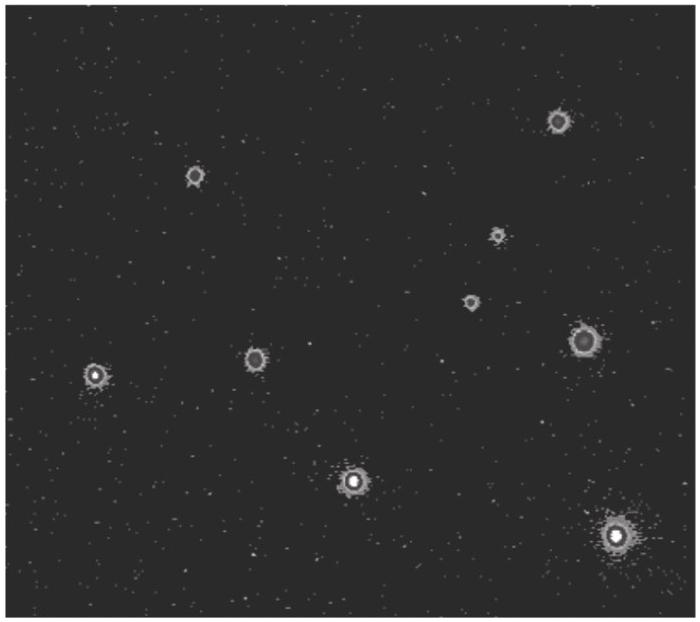
Forty years later, seemingly stable flame balls were accidentally discovered in drop tower experiments at NASA-Glenn, but the short test times of drop tower experiments and g-jitter effects in parabolic aircraft flight experiments precluded a definite conclusion regarding their stability. This led to the development of the Structure Of Flame Balls At Low Lewis-number (SOFBALL) experiment that flew on Space Shuttle missions STS-83, STS-94, and STS-107. These experiments confirmed the prediction that radiative losses could stabilize flame balls near extinction limits, but it led to a number of surprising observations including mutual repulsion of adjacent flame balls, their extreme sensitivity to tiny gravitational disturbances (on the order of 10−6 g), and the uniformity of thermal power among stable flame balls (1–2 watts per ball over a wide variety of mixtures, pressures, and number of balls).
Figure 4.2 is a schematic of a flame ball illustrating representative temperature and concentration profiles.
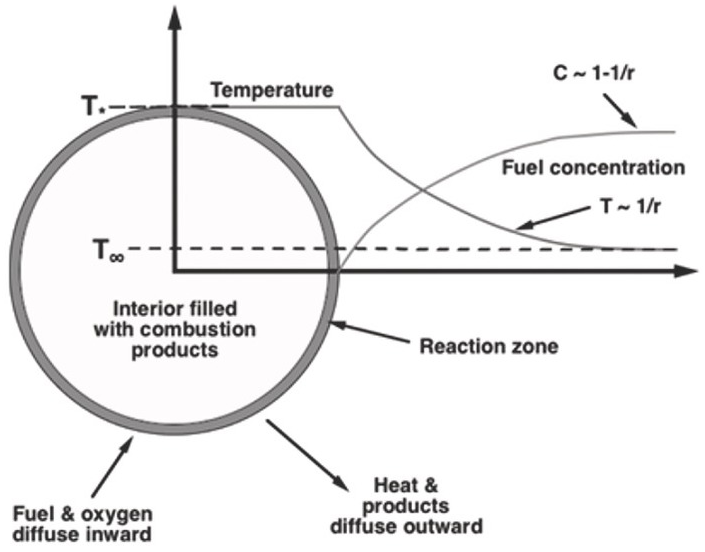
Figure 4.3 is an image of flame balls in a 7.5% H2 – 15% O2 – 77.5% SF6 mixture taken on the STS-107 mission. Width of field of view is 20 cm. (Flame balls appear to be of different sizes because of [1] differing distances from the camera and [2] differing points in their progress toward extinction at sufficiently small radii.)
This work was supported by NASA.
References
4.1.3 Quasi-Steady Microgravity Spherical Ethylene Diffusion Flame
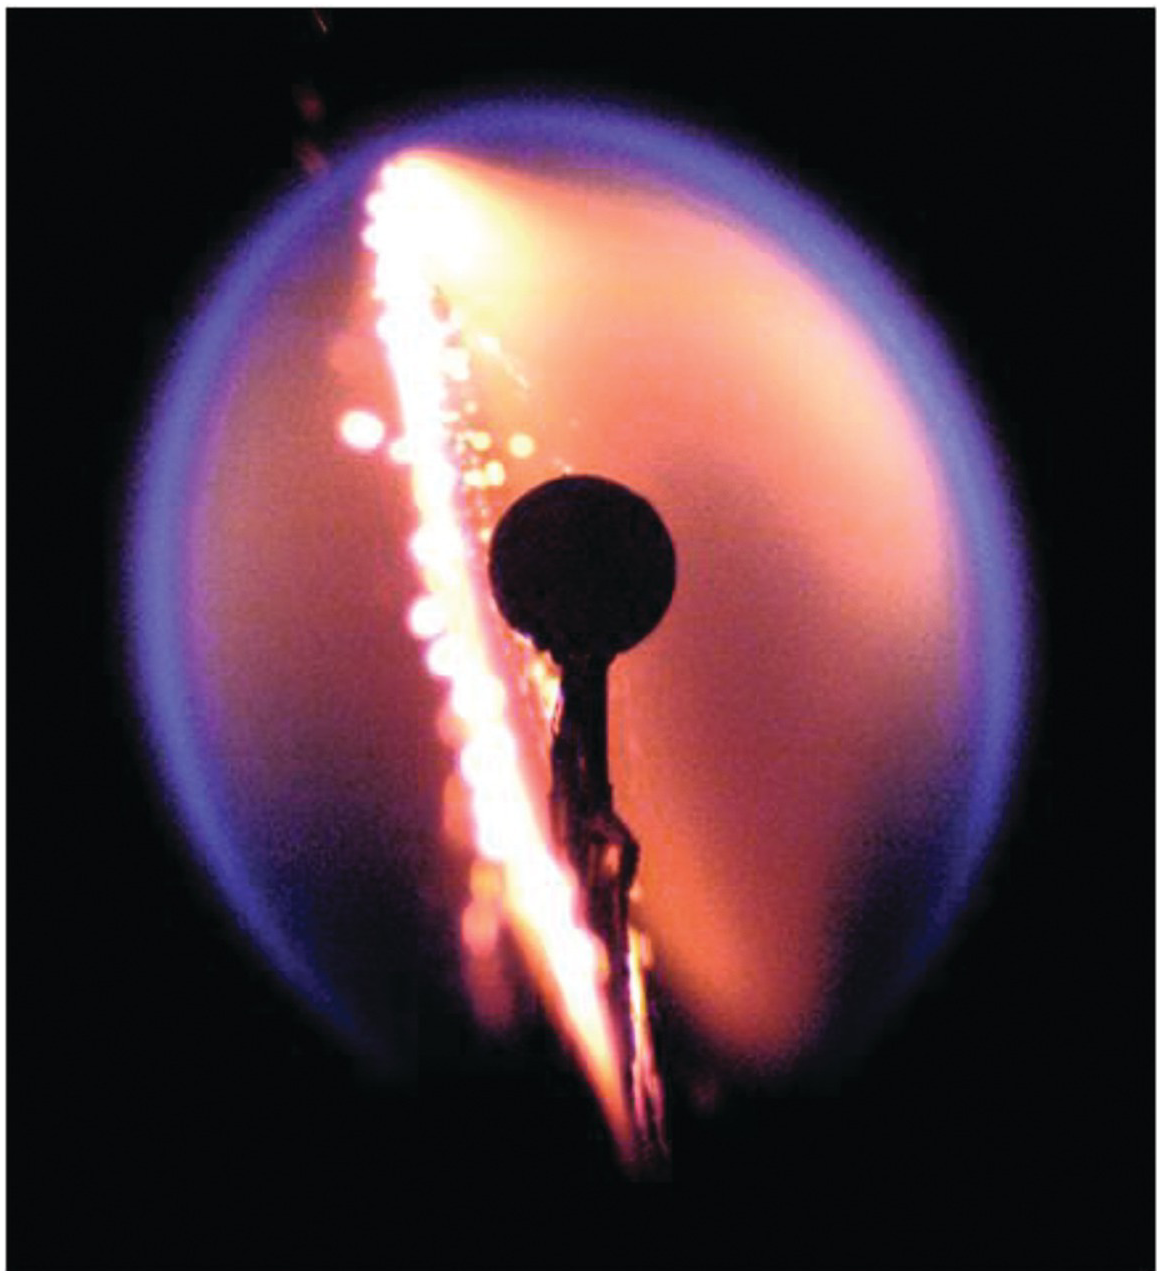
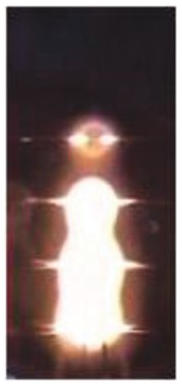
This is a color image of an ethylene–air diffusion flame in microgravity. The pressure was 1.01 bar and the ethylene flow rate was 1.51 mg/s. The blue flame sheet and yellow soot are clearly visible. The image was recorded 1.3 s after ignition in the 2.2 s drop tower at NASA Glenn. The camera was a Nikon D100 digital still camera with a resolution of 6 megapixels. The scale is indicated by the 6-mm spherical burner.
The Flame Design International Space Station flight experiment examines the soot inception and extinction limits of spherical microgravity flames. It seeks to improve the understanding of soot inception and control to enable the optimization of oxygen-enhanced combustion and the “design” of non-premixed flames that are both robust and soot free. Tests are conducted with various concentrations of both the injected fuel (i.e., ethylene or methane) and the oxygen-enhanced atmosphere to determine the role of the flame structure on soot inception. The effects of flow direction will be assessed with inverse spherical flames. Flame design explores whether the stoichiometric mixture fraction can characterize soot and flammability limits for non-premixed flames like the equivalence ratio serves as an indicator of those limits for premixed flames.
This work was supported by NASA.
Reference
4.1.4 Effect of Microgravity on Sooty Co-flow Laminar Diffusion Flames
The study of the influence of microgravity on the sooting behavior of axisymmetric co-flow laminar diffusion flames was performed in the Microgravity Science Glovebox, on board the International Space Station during expedition 29/30. Examples of the differences between 1 g and μg flames are illustrated in the photographs above. Figures 4.5a and 4.5b show images of a pure methane flame stabilized in normal and microgravity, respectively. The fuel nozzle has a diameter of 3.23 mm and is surrounded by a 76 mm × 76 mm square duct co-flow. The average flow velocities were 46 cm/s and 18 cm/s for fuel and co-flow, respectively. The images appear green because of the BG-7 color filter that was added to the imaging setup to balance the RGB signal of the color detector.1
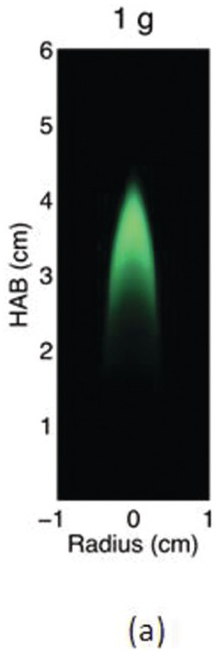
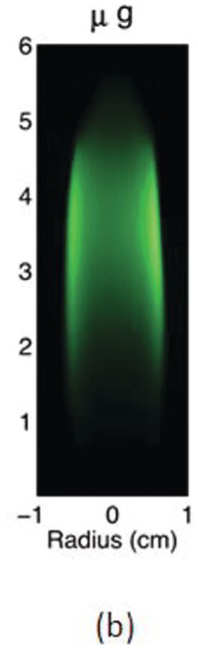
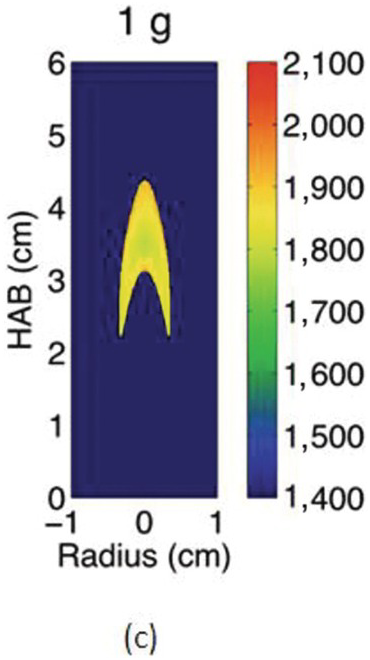
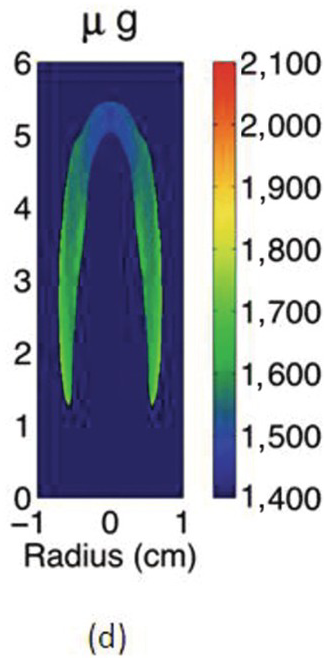
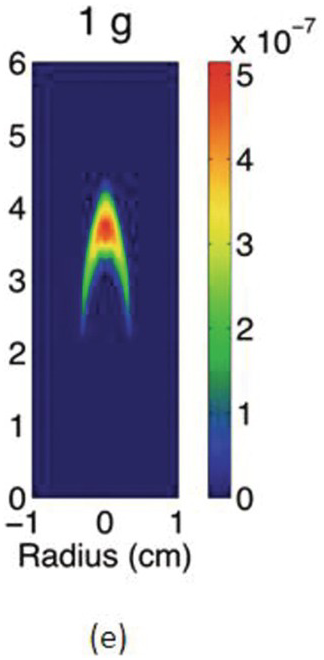
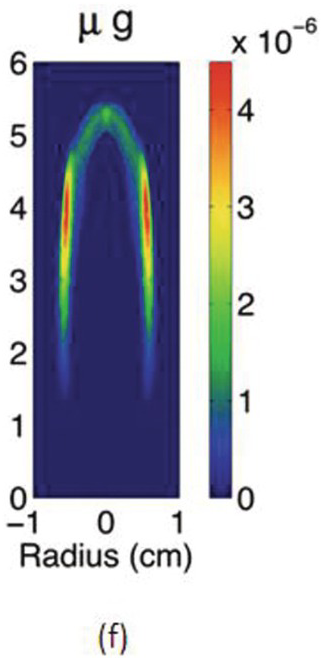
The cross-sectional soot temperature (in Kelvin), shown in Figures 4.5c and 4.5d, was derived from the collected color images employing an Abel deconvolution and using the color ratio pyrometry technique. Soot volume fraction, shown in Figures 4.5e and 4.5f, was then obtained given the measured temperature and by performing an absolute light intensity calibration.
Due to the lack of buoyancy, in μg a taller and wider flame is produced because the reactant mixing is limited and the inward convection is reduced. The sooty region broadens, following the broadening of the flame, and the peak soot volume fraction increases. The enhanced soot production results in increased thermal radiation losses and hence lower flame temperatures. For these flames, the peak soot temperature in μg is shown to be ~200 K lower than its 1 g counterpart.
Compared to the 1 g flame, the μg counterpart is more diffusion-controlled and has a thicker diffusion layers with more soot production in the wings. From 1 g to μg, the peak of soot volume fraction redistributes from the flame centerline to the wings and the soot growth mode is believed to change from an inception-dominated mode to a surface growth–dominated one.
From accompanying numerical simulations it was seen that, due to the density gradients, the hot flow under normal gravity conditions is accelerated up to 200 cm/s at the far downstream location, while the μg maximum velocity is only 90 cm/s (at the upstream location around the tip of the burner, assuming a parabolic flow profile). The reduction in axial velocity causes longer residence times, allows more time for soot particles to grow, and results in enhanced soot volume fraction.
This work was funded by NASA.
Reference
4.1.5 Steady and Pulsed Sooting Gas Jet Diffusion Flames in Microgravity
A fundamental issue in turbulent gas jet diffusion flames is the behavior of large-scale structures that dominate the dynamics of these flames. The research employs a fully modulated fuel injection approach to study both isolated and interacting flame structures. Buoyancy effects are found to be important for these flames, and hence experiments are conducted in microgravity to suppress these effects. The images show ethylene turbulent gas jet diffusion flames in microgravity obtained in the 2.2 s Drop Tower at NASA Glenn. Ethylene is injected at a Reynolds number of 5000 through a 2 cm id nozzle into a chamber filled with a blend of 30% oxygen in nitrogen. Different degrees of interaction between injected flame puffs may be established by varying the injection time for each puff and the time between puff injections.
Figure 4.6 is an image of the sooting, approximately steady-state, diffusion flame. Figure 4.7 shows a sequence of the pulsed case where the fuel is injected for a time of 40 ms. This case studies the dynamics of an isolated flame structure, hence no more fuel is injected until the flame puff is no longer visible. The time between images in Figure 4.7 is 33 ms and the first image is taken approximately 40 ms after injection. The vertical extent of all images is 56 cm. The length of the flame to burnout is related to the ratio of the injection flow rate and radial diffusion rate of oxygen. The reduced burnout length of the pulsed flame indicates better mixing with the surrounding air. The heat release rate and radiative profiles of the flame may be controlled by varying the degree of interaction between the flame structures. The interaction between flame structures also impacts their downstream convection rate.


This research was supported by NASA.
References
4.2 Liquid Fuels
4.2.1 Soot Shell Formation in Microgravity Droplet Combustion

The image sequence shows a free-floated decane droplet in microgravity from deployment (first image) to hot flame extinction (last image). Immediately after ignition a dense soot cloud forms close to the droplet (second image). As time proceeds, the soot shell moves slowly outward, as the Stefan flow from the droplet, which pushes the soot away from the droplet, is opposed by the thermophoretic forces on the soot particles, which push the soot toward the droplet (third and fourth images).
As the soot shell expands, the more uniform dense cloud transitions into discrete aggregate particles, and the soot shell expels a very large aggregate particle that has penetrated through the flame due to its increased drag (fifth and sixth images). Once it penetrates the flame, thermophoretic forces and the Stefan flow are both pushing the soot away from the droplet.
Near the radiative extinction of the hot-flame (the last image in the sequence), the symmetric soot cloud is much less dense (the corresponding color of the flame is very dim blue) and located far from the droplet surface.
When the hot flame extinguishes, the soot shell moves rapidly away from the droplet, as the Stefan force is no longer opposed by the thermophoretic force. In this test, a prolonged period of cool-flame burning of the remaining large droplet follows hot-flame extinction.
The experiments reveal a number of interesting aspects of the dynamics of soot particles.2 These particles normally migrate around the soot-diameter position as they aggregate and eventually move out through the flame. The soot passing through the flame is very evident in the back-lit view because the particle velocity rapidly increases after the particle traverses the reaction zone as a consequence of the suddenly favorable temperature gradient for enhancing the outward thermophoretic velocity, in contrast to the retarding thermophoretic effect for particles inside the flame.
The lower gas density in the vicinity of the flame also helps increase velocities there. Soot particles, thus, are helpful markers of gas motion once thermophoretic effects are subtracted; temperature gradients can be inferred from thermopherotic effects.
Many aspects of soot production and soot-particle histories require further attention. As with many fundamental scientific investigations, this work has uncovered an appreciable number of additional areas worthy of further investigation.
Details of the Flame Extinguishment Experiment are available in Ref. 1.
This research was supported by NASA.
References
4.2.2 Cool-Flame Supported Microgravity Droplet Combustion
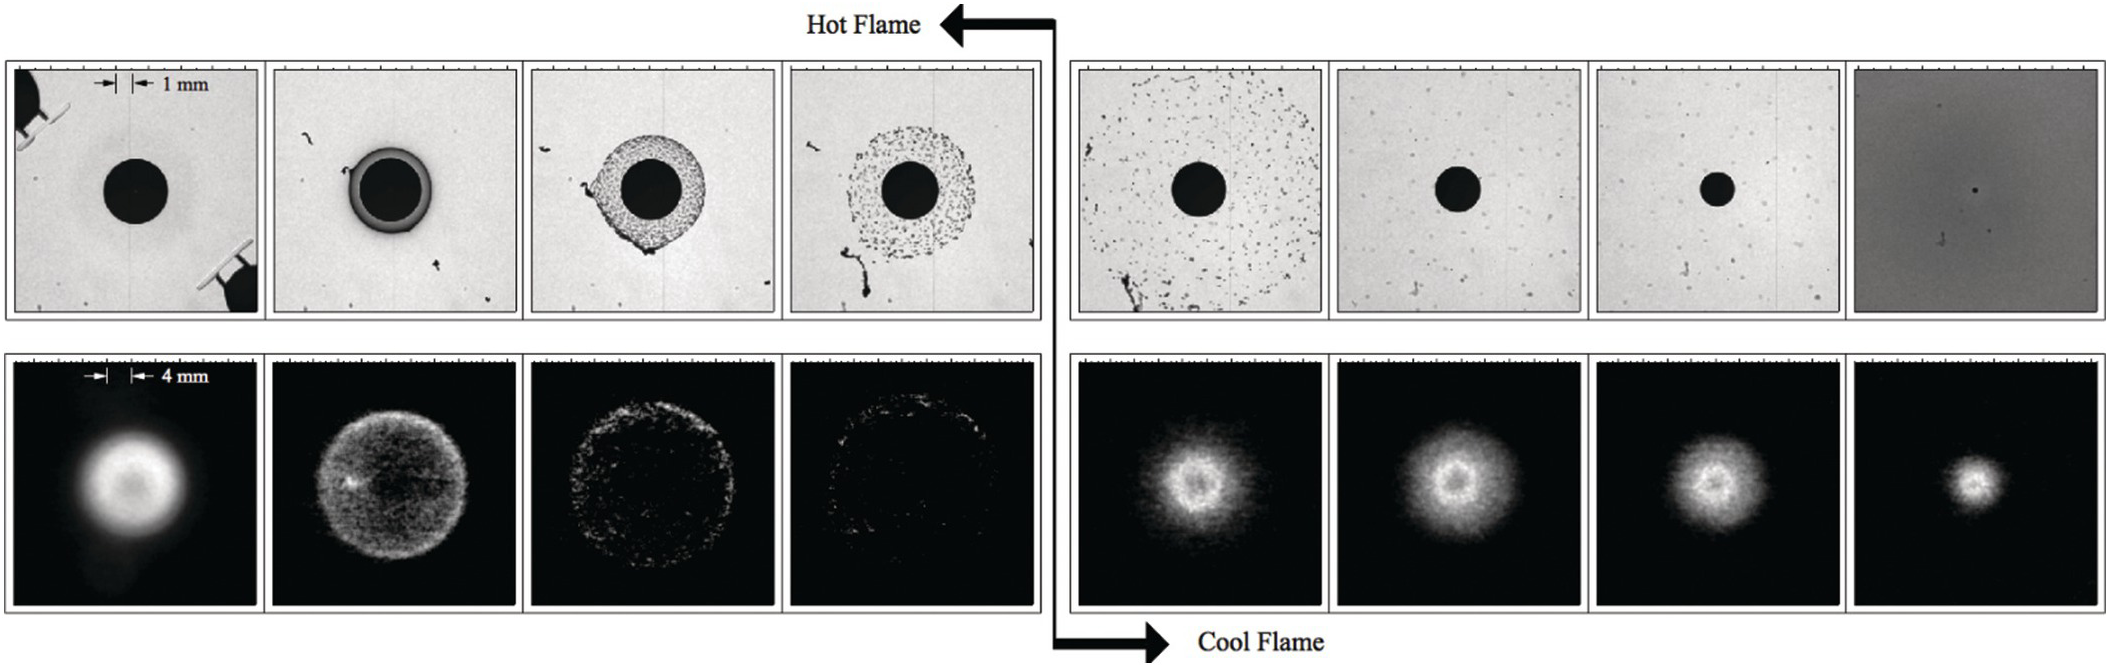
The image sequence shows a free-floating n-dodecane droplet in microgravity from the moment of ignition to cool flame extinction. For each instant in time there is a backlit image of the droplet and an orthogonal image of the flame. The hot-flame images are the CH* chemiluminescence and the cool flame images are the formaldehyde chemiluminescence.
Immediately after ignition there is a small bright hot flame (the igniters are still visible in the droplet view). Shortly after ignition a dense soot shell forms close to the droplet. The soot particles increase in size and the soot shell grows with time. This corresponds with rapid growth of the hot flame. The flame gets continuously dimmer as it grows and eventually extinguishes due to excessive radiative energy loss (relative to combustion heat release). The hot flame burned for approximately 12 s in the test above, and the images are in 4-s intervals.
Following radiative extinction of the hot flame, a cool flame forms. The cool flame is invisible to the naked eye and required the intensified camera with a formaldehyde filter to visualize the flame. The cool flame temperature is much lower than the hot flame and lies closer to the droplet surface. The soot shell present at hot flame extinction rapidly expands when the hot flame extinguishes, quickly growing in diameter and eventually out of the camera field of view.
The cool flame only burns a fraction of the fuel vaporized from the droplet surface. The rest of the fuel vapor transits the cool flame and can collect far outside the cool flame and recondense to form a fuel cloud that is visible in the backlit view as a darkening of the background and also on a color camera view of the test.
The cool flame burns until the droplet reaches a critical size when it extinguishes leaving a small residual droplet. The cool flame in the image sequence burned for approximately 30 s after the hot flame extinguished, and the images are in approximately 10-s intervals.
Details of the experiment are in Ref. 1, and the cool flame discovery is detailed in Ref. 2.
This research was supported by NASA.
4.2.3 Flame Spread over a Randomly Distributed Droplet Cloud Aboard Kibo/ISS

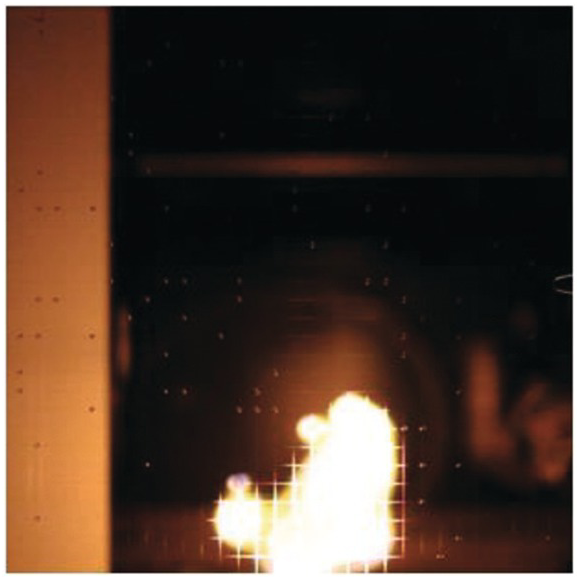
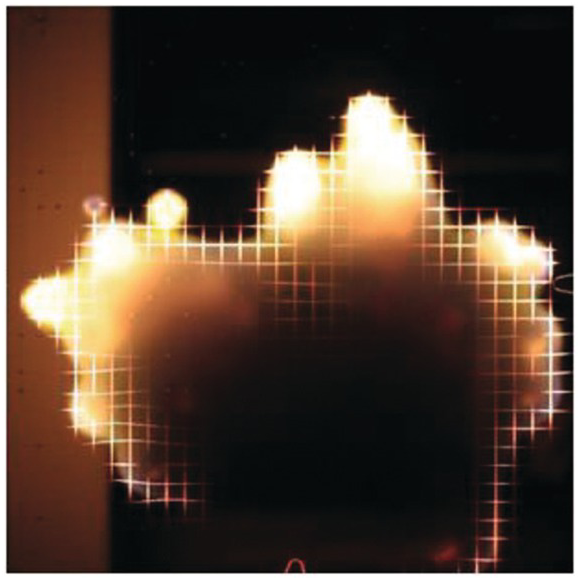
The left three images show the flame spread behavior over an n-decane 2D droplet array in microgravity aboard the Japanese Experiment Module, Kibo, on the International Space Station (ISS). In this test, 97 droplets were randomly distributed at intersections of a 30 × 30 square lattice with 14 µm silicon carbide fibers placed in a combustion chamber. The spacing between fibers was 4 mm. The initial droplet diameter at ignition was about 1 mm.
One droplet was ignited by a hot-wire igniter to initiate the flame spread at atmospheric pressure (first image). The burning behavior was observed by a digital video camera through the window. The flame spread starts from a small spherical flame around a single fuel droplet and then spreads across the lattice of droplets (second image), until finally a yellow large-scale group flame appears (third image). A blue flame propagating a mixture layer around an unburned droplet is also seen near leading flame regions (top left droplet of third image, for example). The fundamental flame-spread mechanism is similar to that of a linear droplet array in microgravity shown in the small fourth image. However, more dynamic flame-spread behavior appears in randomly distributed droplet clouds. The flame-spread behavior and group-flame formation were investigated for different numbers of droplets and the initial droplet diameters.
Percolation theory has been applied to determine the physics that govern the local flame spread between droplets and the flame spread across the droplet cloud, leading to group combustion.
This research will bridge the gap between the combustion of a small number of droplets and spray combustion.
This research was funded by JAXA under the project entitled “Elucidation of flame-spread and group combustion excitation mechanism of randomly distributed droplet clouds (Group Combustion).”
References
4.2.4 Candle Flames in Normal and Microgravity
Figure 4.14 shows that candle flames in normal earth gravity (left) and in microgravity (right) have very different flame shapes, sizes and colors. Figure 4.15 is the numerical simulation of the two cases (with the gravity vector pointed to the left). The visible flames are represented by the fuel reaction rate contour of 5 × 10⁻⁵ g/cm3 s. Upper halves of Figures 4.15(a) and (b) are the velocity vectors, and the lower half shows the streamlines and the oxygen mass flux. The normal-gravity flame is elongated due to buoyancy-induced flow of the combustion products as shown in Figure 4.15(b). Oxygen is entrained into the flame reaction zone primarily by convection and to a lesser extent by diffusion. In the microgravity flame, flow is generated by the Stefan flow resulting from wax evaporation. Comparing Figures 4.15(a) and (b), the magnitude of the flow is much smaller in microgravity (notice the different scales between the two images). In microgravity, Figure 4.15(b) indicates oxygen is supplied to the reaction zone entirely by molecular diffusion. Because these rates are slow, the required fuel supply rate is also small. The flame standoff distance from the wick is therefore large compared with that of the normal gravity case as shown in Figure 4.14. Since the microgravity flame has lower burning and heat release rates, the percentage of radiative heat loss from the flame is larger. The resulting lower flame temperature is believed to be the main reason for a visibly soot-free blue flame shown in Figure 4.14. Details of the experiment are in Ref. 1. Computed candle flames as a function of different gravity levels can be found in Ref. 2. Near-limit candle oscillations were reported in Refs. 1 and 3. Modeling of heat and mass transfer inside the porous wick and wick-trimming effect can be found in Ref. 4.


This research was supported by NASA.
References
4.2.5 Microgravity Candles in the Wind

In microgravity, a candle is very sensitive to flow speed and direction.
The candle is comprised of paraffin wax within a 6.5 mm-diameter ceramic tube. A fiberglass string is used as the wick. Flow is generated using a duct having a 7.6 × 7.6 cm cross-sectional area and a volume of 1 liter. Flow direction is from bottom to top in all images and time from ignition (mm:ss) is indicated for each frame.
Left: candlewick points toward the oncoming flow. The initial atmosphere was 17% O2/N2 at 1 atm. The flow speed was varied gradually from 5 to 4, 3, 2, 1, and then less than 1 cm/s, at which point the flame goes out as shown in the last image. In this configuration, the flame surrounds the wick and the tip of the candle, promoting fuel vaporization. At the higher flow speeds, the flame is yellow due to significant soot, which is emitted as smoke. At low flow speed, the flame color becomes bluer as the soot diminishes and its shape is more spherical as mass diffusion becomes dominant.
In previous microgravity candle flame studies, a flame could persist even in a quiescent environment. However, the 1-liter flow duct used here was too small to support quiescent combustion. Instead a flow of air always needed to be applied, albeit at a very slow rate (less than 1 cm/s).
Right: candlewick points away from the oncoming flow. The initial atmosphere was 16% O2/N2 at 1 atm. The flow in the top row changes from 2 to 1.7 cm/s, the middle row from 1.5 to 1.3 cm/s, and the bottom row from 1.3 to 1.1 cm/s. There is less heat feedback to the candle in this configuration, and so the resulting flame is much smaller compared to the case on the left. The smaller flame burns for a long time because the fuel consumption rate is very low.
The peak heat release rate in the flame stabilization region (base of the flame) is proportional to the flow velocity. Thus, lowering the flow velocity reduces the peak heat release rate and, in turn, heat feedback to the wick, diminishing the fuel vaporization. In other words, the flow velocity and fuel supply rate are coupled in the flame stabilization and extinction processes.
This work was supported by NASA.
References
4.2.6 Rainbow Schlieren Images of Flame Spread across a Liquid Fuel

As part of the Spread Across Liquids (SAL) sounding rocket experiment at NASA in the 1990s, rainbow schlieren images were taken of the flame spread process. The flame was ignited at one end of a liquid fuel tray that was 30 cm long × 2 cm wide × 1 cm deep. The fuel was 1-butanol initially at room temperature in these images, and the flame spread is not steady but pulsating at this temperature. Rainbow schlieren filters were used to indicate density (temperature) gradients that arose during the flame spread. All images were taken in normal gravity with a slow opposed air flow.
In the top four images, from left to right, the filter is set to record vertical gradients. The lid on the fuel tray (black) effectively stops evaporation, so that the liquid is all one temperature (blue color). The lid is removed and the surface starts to cool due to evaporation of the 1-butanol. A thermal boundary layer grows downward from the free surface toward the bottom, and by the third image it has grown to approximately 5 mm. In the fourth image, cooling at the surface causes Rayleigh Taylor cells to begin to develop; the cool fluid sinks to the bottom and is replaced by warmer liquid. The entire depth of the liquid is participating in this motion.
In the lower left image, the flame is spreading over the fuel from right to left and the schlieren filter is set to record vertical temperature gradients. Liquid motion is seen several centimeters ahead of the flame front due to surface tension gradients. The flame does not spread steadily but “pulsates”: periods of rapid spread are followed by periods of very slow or almost no spread. During each period of slow spread a large vortex builds up beneath the flame driven by surface tension flows on the surface. The vortex nearly reaches the bottom of the pool. When enough fuel vapor has been pulled ahead of the flame by the surface flow, the flame spreads rapidly though this premixed region, and then the process begins again. Due to the much higher index of refraction of the liquid, flow structures are more evident in the liquid phase. However, a thin, high-temperature gradient region is evident right along the liquid surface behind the flame front.
In the lower right image, the filter is set to record horizontal gradients. The gas-phase layer near the surface is no longer evident, since the horizontal gradients in it are very small. However, in the liquid phase, the Rayleigh-Bernard convection cells are now visible as the alternating blue-green strips ahead of the flame. As the flame approaches, those cells are modified by the flow of liquid away from the flame. Once again, the large vortex is seen beneath the flame.
This work was supported by NASA.
4.3 Thick Solid Fuels
4.3.1 Microgravity Sphere Burning with Model Comparison

Still image of burning Poly (methyl methacrylate) in microgravity condition aboard International Space Station (top, obtained through the Burning And Suppression of Solid fuels (BASS) project), compared with numerical model [2] that incorporates the effect of surface regression and solid surface heat balance (bottom). Forced flow velocity is 12 cm/s (left to right), and the oxidizer consists of an oxygen/nitrogen mixture (17%/83% by mole, respectively).
The top half of the image shows the silhouetted shape of the regressing sphere and the blue flame stabilized around the forward half of the sphere. The bottom half of the image shows the numerical model predictions. The gas-phase blue color corresponds to the gas-phase reaction rate. The flame standoff distance is overpredicted by the model. This may be due to a mismatch in the timing of the solid-phase heating between experiment and model. The rainbow colors represent the solid fuel temperature distribution, showing how the flame is heating the sphere.
This work was supported by NASA.
References
4.3.2 Burning Sphere in Microgravity

Still images of burning Poly (methyl methacrylate) in microgravity condition aboard International Space Station obtained through the Burning And Suppression of Solid fuels (BASS) project. Forced flow velocity is 12 cm/s (upward), and the oxidizer consists of an oxygen/nitrogen mixture (17%/83% by mole, respectively). The initial diameter of the solid fuel was 2 cm, and each image is about 1.5 s apart.
A cast PMMA sphere of initial diameter of 2 cm was supported by a rod inserted through the back side. The sample is placed in the flow tunnel. A heated wire igniter is placed at the forward stagnation region (i.e., upstream). Once the flame is established, the igniter is retracted. As can be seen in the top row of images, the initial flame is localized around the forward half of the sphere and is all blue.
As time goes on, the flame tip spreads downstream to the sides of the sample. The flame develops an inner soot region (orange-yellow area) by the third row of images. This indicates that the flame is getting stronger as the conductive heat flux to the solid phase decreases with time as the sample interior is heated up.
By the forth row, the flame has enveloped the sphere. The flame is stable and smooth for this low Reynolds number flow, except for intermittent vapor jetting from small bubbles rupturing at the fuel surface as it burns.
Such series of high-resolution images are utilized for model development by providing validation data of flame growth rate, flame-to-fuel distance, and the solid surface regression rate.
This work was supported by NASA.
References
4.3.3 Microgravity Flames Stabilized around the Stagnation Tip of a Clear Polymethylmethacrylate (PMMA) Rod

During a test in the BASS-II hardware aboard the International Space Station, a 0.95 cm-diameter PMMA rod is burned in a very slow concurrent flow.1 Flow direction is up in each of the four images. From left to right, the effect of decreasing flow speed is shown: 2 cm/s, 1.5 cm/s, 1.1 cm/s, and 1 cm/s. Allowing the rod sufficient time to reach a stable solid-phase thermal profile after each flow step, the flame became exceptionally stable, and the image was taken. The last flame was held at 1 cm/s flow for 100 s until extinction finally occurred because of oxygen depletion. The initial oxygen concentration in the chamber was 14.8% O2 at 1 atm., and the final oxygen concentration was 13.6% O2. These oxygen levels are well below the minimum for which this fuel will burn on Earth (15% O2).
The rod tip is aligned in all four images as shown by the fine yellow line. Despite the flow changes, the stagnation flame standoff distance remained the same, as shown by the fine orange line. Once the solid phase reached a steady-state thermal profile, the rod regression rate became constant. The primary effect of decreasing flow is a proportional decrease in the flame length. As the quantity of available oxygen was reduced (via reduced flow and slowly dropping ambient oxygen concentration), the size of the flame sheet shrunk to match.
Also visible in each image is the blackened tip of the rod that has an elliptical shape. The clear portion of the rod shows a dense bubble layer that spans the extent of the flame. Near the quenching extinction (right-most image), the bubble layer length had shrunk to approximately the same size as the rod diameter. This is an indication of the hemispherical shape of the flame, for which the very low convective flow speeds and mass diffusion speeds are approximately equal.
Prior to extinction, the flame length oscillated at a frequency of 1.1 Hz. These oscillations are very similar to those observed for candle flames in a quiescent environment,2 since the 1 cm/s convective flow is the same level as mass diffusion speeds in the vicinity of the candle flame.
This work was supported by NASA.
4.3.4 Microgravity Concurrent Flame Blowoff from the Tip of a PMMA Rod

This sequence of images is taken from a 5.18 s drop tower test burning a 1.27 cm-diameter PMMA rod in 15% oxygen at 30 cm/s concurrent flow (up in the images) at 1 atm. pressure. The eight frames are 1/30 s apart. The rod interior is illuminated with a green LED to show the bubble layer that develops beneath the flame as the material degrades in depth. While the end of the rod is blackened by soot, some green illumination can be seen right at the tip.
Prior to the drop, the rod was ignited with a retractable hot wire coil at the rod tip in an 18% oxygen atmosphere. Once ignited, the flame was allowed to grow and heat the rod. The drop was triggered and the gas flow was switched to 15% oxygen.
Blowoff occurs shortly after the drop starts, and is triggered by the opening of a small hole that forms at the stagnation tip of the rod, as shown in the second image. This hole is caused by the Damkohler number reaching a critical value where the reactions cannot occur fast enough in the finite thickness of the reaction zone for the given flow time. This hole quickly grows to the scale of the rod diameter as the stagnation region of the flame destabilizes. Due to the destabilization, the flame quickly blows downstream.
The flame flashes back forward a few millimeters and develops a bright blue flame base that anchors briefly to the sides of the cylinder in the slower-flow environment in the rod boundary layer (fifth image). This bright blue base is interpreted as the outer lip of the triple flame at the flame’s leading edge of an opposed flow flame. The downstream section of the flame becomes sooty (sixth image), as the newly anchored flame burns out the unburned fuel that has leaked through the open tip of the flame. However, the flame base cannot sustain the side-stabilization and blows downstream, extinguishing the flame.
Some blowoff tests show a prolonged oscillation of the anchoring flame ring prior to blowoff. The triple flame base resides within the boundary layer along the side of the rod. The still hot rod tip continues to produce fuel vapor, and a flammable mixture is formed within the boundary layer. The bright blue triple flame moves forward through this layer, consuming the mixture. Once the mixture is consumed, the flame is blown downstream to a lower flow deeper in the boundary layer where it can stabilize. The cycle repeats a number of times, but each time the flame is blown slightly further downstream as the mixture becomes leaner.
The flame speed during the oscillations is on the order of gas-phase premixed flame speeds. Interestingly, both the maximum flame speed and the brightest blue triple flame region occur during the last few oscillations. The blue chemilumienscene is an indication of the reaction rate, and the flame speed is fastest near stoichiometric mixtures. So, the fact that the flame speed increases as the rod cools indicates that the flammable mixture layer was initially fuel rich but becomes progressively leaner as the rod cools. Once the blown-off rod tip cools sufficiently, the flame can no longer find a thick enough flammable mixture layer forming upstream, and the flame extinguishes.
This work was supported by NASA.
References
4.3.5 Microgravity Flame Spread over a Black Polymethylmethacrylate (PMMA) Rod

Fire safety in microgravity has always been a concern in space travel. Very few flame-spread experiments, particularly on thick fuels, have been conducted in spacecraft environments because of the limited long-term microgravity facilities. The presented fire image shows part of the microgravity flame-spread experiments, Burning And Suppression of Solids – II (BASS-II), conducted on the International Space Station.
The flame spread over the 6.4 mm-thick black PMMA rod was tested under low-velocity opposed flows (Vg).1 These fire images show the opposed flame spread under a gas flow of low oxygen concentration by volume of 18.5% (upper row) and 17.2% (lower row). The interval between these images is 1 minute. As the opposed flow is slowly decreased from 76 mm/s to 7 mm/s, the flame changes from yellow to blue and becomes wider. The measured flame spread rate first increases when the opposed flow velocity is reduced from 76 mm/s to 17 mm/s, and then it decreases as the opposed flow velocity is further reduced. Eventually, flame extinction occurs when the flow velocity is reduced to 6 mm/s.
The observed correlation between flame spread rate and the opposed flow velocity has only been predicted theoretically2 but not been observed experimentally for thick fuels until this work. In normal gravity, the strong upward buoyant flow (about 300 mm/s) generated by the flame dominates over the low-velocity forced flow. As a consequence, the flame-spread rate measured on Earth is almost independent of the flow velocity,3 which prevents the study of the flammability of materials in spacecraft environments.
This group of photos also show that in microgravity flame spread could be sustained at oxygen concentration of 17.5% or lower. However, in normal gravity, the minimum oxygen concentration to sustain a flame in the same PMMA sample is 18.3%. These novel results suggest that under certain environmental conditions there could be a higher fire risk and a more difficult fire suppression in microgravity than on Earth, which would have significant implications for spacecraft fire safety.
This work was supported by NASA.
References
4.3.6 Heterogeneous Burning of Bulk Metallic Materials in Pure Oxygen in Reduced Gravity
Figure 4.23 shows center ignition/burning of a 0.32 cm-diameter cylindrical iron rod in microgravity (6.9 MPa white lines added to show sample boundaries).1, 2 The igniter was Al-Pd wire, and burning progresses up the test sample until molten when surface tension pinches the liquid column to create two spherical burning regions that continue to consume the sample (over 1.2 s). Figure 4.24 shows a “rolled-up” 316-Stainless Steel mesh burning in microgravity over 0.08 s (1.7 MPa).1,2 The burning liquid mass rises into the mesh by capillary action before burning it from the inside out. The complete sample was consumed, and after the test, unlike in a normal gravity test, green oxide is distributed all around due to the higher temperatures in the reaction zone (leading to volatilization of the chromium in the stainless steel). Figure 4.25 shows the ignition (3.5 MPa over 1.5 s) of a 0.32 cm-diameter cylindrical solid iron rod in microgravity that produces the typical (in microgravity) spherical burning molten mass that then contacts, melts, and ignites a 0.32 cm-diameter cylindrical 2219 Aluminum rod, clearly showing the different burning characteristics of these two metals.1,2


These experiments studied flammability of metallic materials in relation to combustion mechanisms and fire safety and established the heterogeneous burning mechanism for most metals. The work also demonstrated that bulk metallic materials are consumed much faster in microgravity than in normal gravity – the first time an increased burn rate was shown for a material in microgravity.
This work was supported by NASA.
4.3.7 PMMA In-Depth Bubble Formation

The characteristics of molten layers of burning materials are not well understood. The samples tested were 2.4 cm-thick PMMA slabs (30 cm × 30 cm) heat-formed into large radius of curvature samples. These large-radius-of-curvature samples had very slow regression rates (low Peclet numbers). An extensive layer of polymer material above the glass transition temperature (105°C) was observed during the burning of these samples in a ceiling fire configuration. A bubble layer is formed beneath the burning surface. The figure shows magnified images of the resolidified bubble layers: cross-section cuts through the sample to show the in-depth bubble formation for four different sample radii: (a) 5 cm, (b) 20 cm, (c) 50 cm, and (d) 100 cm.
The depth of the bubble layer increases as the radius of curvature increases and the Peclet number decreases. The bubbles become less glassy and more opaque. The opaque, wrinkled bubbles seen in the cross-section images are the MMA vapor bubbles after the samples resolidify after the test. The opaque wrinkling of the bubbles is believed to be due to local fracturing of the cooling/solidifying molten polymer–vapor interface and/or crystal growth of crystalline PMMA as the pressure within the vapor bubble decreases due to cooling and condensation of the MMA vapor. This give the cut bubbles a geode appearance.
Unique phenomena associated with this extensive glass layer included an initial substantial swelling of the burning surface (4 mm) due to the initial formation of the bubble layer and migration and/or elongation of the bubbles normal to the hot surface through the viscous molten polymer. The bubble layer acted to insulate the polymer surface by reducing the effective thermal conductivity of the solid.
As the material thermally degrades in depth at temperatures above 225°C, the random scission of the polymer chains releases gaseous MMA monomer (B.P. 101°C, just below the glass transition temperature) that forms bubbles in the molten polymer. These bubbles are at greater than ambient pressure. As bubbles reach the burning surface (~360°C), these pressurized bubbles rupture and a jet of MMA fuel vapors is released. The fuel ignites as it passes through the flame sheet, causing a flame jet and a characteristic sizzling audible signature. The vapor jets add to the effective fuel vaporization rate and enhance burning in slow convective flow environments by entraining ambient air flow.
This work was supported by NASA.
Reference
4.4 Thin Solid Fuels
4.4.1 Experimental Comparison of Opposed and Concurrent Flame Spread in a Forced Convective Microgravity Environment

A series of 5.18 s drop tower tests were performed using a very thin cellulose samples with an igniter wire on either the upstream or downstream end of the 5 cm-wide by 10 cm-long sample. Top view (left) and side view (right) images are shown for two tests at 34% O2, 10.2 psia, and 30 cm/s. The spread rates are nearly identical, but the flame structure is quite different for the opposed flow flame (top images) and the concurrent flow flame (bottom images).
The opposed-flow flame has a fairly flat dark pyrolysis front ahead of the sooty region of the flame. The material burns out quickly, with only some lacy char within the luminous flame. The edge view shows the classic blue leading edge, followed by a long luminous merged inner tail that fills the open space behind the burnt-out fuel. An outer magenta halo flame curves inward and is shorter than the sooty tail. For opposed flow, the flame leading edge reaches a steady spread rate almost immediately (<1 s) while the flame size continues to grow for a few seconds.
For the concurrent flame, the flame base (burnout) is quite flat with a long pyrolysis region beneath the flame. The concurrent flame exhibits a separated inner sooty tail structure, and the flame standoff distance is significant. There is again an outer magenta halo flame. In the concurrent case, the flame base remains stationary for ~1 s after ignition as the flame length develops. The flame base then accelerates to a steady spread rate within ~1 s once it starts to propagate.
This work was funded by NASA.
Reference
4.4.2 Visible and Infrared Images of Flow Effects on Simultaneous Upstream and Downstream Flame Spread in Microgravity

The effect of low-velocity forced flow on microgravity flame spread is shown in these images: (top) quantitative infrared images of the burning surface; and (bottom) color images of the surface view. The IR image has a shorter field of view and is the mirror image of the visible view. The images are roughly to scale, with a 1-cm grid printed on the paper. The scale is visible in the IR, since the emissivity is slightly higher on the grid lines. A color temperature scale for the IR images is shown on the right. The forced flow is up in these images.
These images were taken at the end of the JAMIC 10 s drop tower in Hokkaido, Japan. In these tests, the flame is able to spread both upstream and downstream from a central ignition on the fuel surface. The Whatman 44 ashless filter paper cellulose fuel samples were ignited in microgravity using a straight hot wire across the center of the 75 mm-wide by 140 mm-long samples. Red LEDs illuminate the visible sample. Very thin thermocouple wires are also present, and are visible in some IR images. The flame spread is reasonably 2D, since the sample is wide enough and the ignition is uniform across the fuel width.
Four cases, at 1 atm. 35% O2 in N2, at forced flows of 2, 5, 10, and 20 cm/s are presented here. This flow range captures flame spread from strictly upstream spread at 2 cm/s flow velocity (top row) to predominantly downstream spread by 20 cm/s (bottom row).
The surface color view images show that while the upstream leading edge of the flame is 2D, there are 3D soot structures occurring in the flame. At 2 and 5 cm/s the soot along the edges of the fuel is most pronounced, and at 10 cm/s the soot funnels downstream over the downstream fuel.
The IR images show the fairly 2D thermal structure of the pyrolyzing fuel surface upstream and downstream even up to 10 cm/s (blue to pink transition). At 2 and 5 cm/s the only downstream exothermic char oxidation is at the fuel edges. Exothermic char oxidation that is a clear indication of a separate downstream flame base is beginning to show at 10 cm/s with a slight saturated glow at the burnout, and by 20 cm/s a highly exothermic concurrent flame base is clearly present in the IR, showing two separated flames. The gas-phase sooting increases in intensity in the burnout gap as flow increases.
This work was jointly supported by a NASA/NEDO international agreement.
Reference
4.4.3 Large-Scale Flame Spread in Space

NASA and an international team of investigators have worked to address open issues in spacecraft fire safety. NASA’s Spacecraft Fire Safety Demonstration Project was developed with a goal to conduct a series of large-scale experiments in true confined spacecraft environments that represent practical spacecraft fires. One flight examined flame spread over a large thin sheet of flammable fuel (cotton/fiberglass 41 cm × 94 cm). This experiment was performed on an unmanned ISS resupply spacecraft after they had delivered their cargo and had undocked, but prior to the reentry. The opposed-flow experiment (left) was performed first, followed by the concurrent-flow experiment (right), shown in the above montage. The flow was 25 cm/s air flow from right to left. The image height is 41 cm, the full width of the sample.
The opposed-flow flame was ignited at the downstream end, and the flame was allowed to propagate upstream (left image sequence, images 10 s apart). The flame quickly reached a steady size and spread rate. The flame was very flat and uniform, and mostly blue. After a prescribed time, the flow was turned off, and the flame extinguished almost immediately. As shown in the last image of the left sequence above, the flame front broke up into smaller flamelets before extinguishing completely. It is noteworthy that in Earth’s gravity, this fuel is not flammable in the downward configuration (opposed-flow).
For the concurrent ignition (rightmost image sequence, 40 s apart), the flame propagated on both sides of the igniter wire, with a string of small bright-blue upstream flame pearls and longer dim-blue downstream flames. Once the small piece of upstream fuel burned out, the concurrent flame developed a blue base and a pattern of orange-yellow radiation coming from incandescent soot. After the flame base passed, bright orange exothermic surface smolder spots burning some of the leftover fuel were visible.
The flame base was reasonably flat at first but developed into a wavy shape as it spread. This shape slowly became more exaggerated as time progressed, as two broad portions of the flame that had moved ahead tended to move even further ahead.
The flame speed and size for both tests were measured from the video. The flame and pyrolysis position traces show that the pyrolysis propagation rate was steady for most of the tests. For the concurrent-flow flame, after a transient that drives an overshoot in the pyrolysis length, that length reached a plateau value.
This experiment was funded by the Advanced Exploration Systems Division of the Human Exploration and Operations Directorate at NASA.
Reference
4.4.4 Concurrent Flame Growth, Spread, and Extinction over Composite Fabric Samples in Low-Speed Purely Forced Flow in Microgravity

Flame spread over solids in concurrent-flow purely forced convection depends strongly on the magnitude of flow velocity. Theories predict that a limiting flame length will be reached and is a function of flow velocity.1, 2 Theory also predicts the flame will be quenched if the flow velocity is sufficiently low.3 The figures describe an experiment (BASS) carried out on the International Space Station (ISS) within the Microgravity Science Glovebox. The fuel sample, consisting of a composite fabric (75% cotton, 25% fiberglass), is mounted on a sample holder. The exposed sample dimension is 10 cm × 2.2 cm. The flow velocities range from 1 to 55 cm/s. The side-view video images in the left figure show the sequence of flame growth, steady spread, and decay in air at a flow of 10 cm/s (blowing from right to left). After ignition, the flame length gradually increased, but at approximately 20 s, a limiting length was reached and stayed constant until 28 s when the flame tip reached the end of the sample. The spread rate during this ‘quasi-steady’ period was 2.75 mm/s. The right figure shows a quenching sequence at 18.7% oxygen (balanced with nitrogen), which occurred when the flow was reduced. These top view images of the flame were taken by a still camera. After ignition at 10 cm/s, the flow was turned down gradually until 2.2 cm/s was reached. This image shows that both the flame length and width became smaller until quenching was reached. The quenching velocity is a function of ambient oxygen percentage, among other parameters.
This work was supported by NASA.
References
4.4.5 Cyclic Flame Growth Phenomena in Nomex III Fabric

Upward flame spread over samples of Nomex III fabric in enriched-oxygen, reduced-pressure environments resulted in a cyclic flame growth phenomena.1 This is shown in the image sequences above. These images are digitally enhanced with increased contrast and brightness levels but no alteration to hue. (A) shows front (top) view images of the fuel surface. The flame lengthens, splits into two flames (image 4 and 5), and the secondary flame blows off immediately after break-off. This sequence then repeats. The conditions for this test were 29% oxygen, 6.25 psia, 2 cm width. (B) shows front-view images of a case where the secondary flame survives for several seconds. The conditions for this test were 30% oxygen, 6 psia, 2 cm wide. This was the second break-off of the test. Note that the pyrolysis front is visible in (A) and (B). (C) is a sequence of side (edge) view images showing a break-off similar to that in (B). The conditions for this test were 29% oxygen, 8 psia, 2 cm width. Based on TGA data and the measured surface temperatures during the test, this cyclic flame spread is believed to be the result of two-stage pyrolysis from the Nomex sample.
This work was funded by NASA.
4.4.6 Concurrent Flame Spread over Three Parallel Thin Fuel Sheets in Microgravity

Concurrent flame spread experiments were performed in NASA Glenn Research Center’s 5.18 s Zero Gravity Research Facility using the Microgravity Wind Tunnel Apparatus. The test conditions were selected to ensure radiation was important to the flame spread rate, so air at 5 cm/s concurrent flow was selected at 1 atm. total pressure.
Three 5 cm × 10 cm sheets of cheesecloth (half thickness area density 0.001 g/cm2) were mounted on parallel metal frames. Three sheets were selected instead of only two so that the center sample would have a centerline plane of symmetry. The gap between the sheets was varied experimentally from 1.27 cm to 3.81 cm, and compared to a single sheet (infinite spacing). Three parallel igniter wires were used to ignite the three samples simultaneously after the experiment entered zero gravity. A green LED shines down from above the samples. Flow is up in each image.
The single sheet flame (∞ gap) under these conditions was all blue, with tips that are parallel to the fuel sample. At 3.81 cm spacing, the flame tips begin to interact, and the tips fan out away from the fuel surface. The flame is brighter, with a slight inner soot layer, which indicates that the flame temperature is higher than the single flame case. At 3.18 cm, the tips are connected but the flame bases are still well defined with a deep cleft between them. At 1.91 cm, the flames are connected through much of the body of the flame with a shallow cleft that is skewed toward the outer sheets. At 1.27 cm, the center flame base is lagging significantly behind the outer flames, and the cleft is shifted to the surface of the outer sheets. At these two narrowest gap spacings, a large vapor cloud of unburned fuel appears (illuminated by the green LED), indicating that the mixing of fuel and oxygen is inhibited for those conditions.
At low gap spacings, despite the enhanced radiant heat transfer with the higher radiation view factors, the heat release rate from the flame is significantly reduced due to limited available mixing of the fuel vapor and inflowing oxidizer in the narrow channels. At large gap spacings, the radiation exchange augments the flame’s heat flux to the fuel surface, enhancing the burning. The optimum gap spacing appears to be close to 3.2 cm where the flame spread rate is increased to 152% of the single sheet value. These results are in qualitative agreement with a published numerical model.
This work was supported by NASA.
References
4.4.7 Diffusion Flame in Enclosed Geometry

A polymethyl-methacrylate (PMMA) sample with thickness of 3,175 µm and width of 30 mm is burning in ambient conditions between two ceramic plates. The enclosed geometry allows to approximate this diffusion flame as two-dimensional, with the sample width being the negligible coordinate. Moreover, enclosed flames generally show a laminar behavior also for fuel thicknesses that would generate turbulent flames, if the sample edges were free to burn.
The flame over the sample, as illustrated in the sequence of pictures, shows a steady-state behavior while spreading downward. The time step between each flame picture in the sequence is about 2 min, and the ignition transient is not considered. The burning area and flame length are constant throughout the experiment. Both characteristics depend on the sample thickness, and experiments show that the length of the melting front increases almost linearly with fuel thickness. The flame leading edge, characterized by the blue color, is spreading with a constant speed of 0.06 mm/s.
This work was supported by NASA.
References
4.4.8 Effect of a Varying Opposed-Flow Velocity in Microgravity

The Burning And Suppression of Solid – II (BASS-II) investigation considered different solid fuel geometries in presence of a concurrent or opposing flow field. Experiments were carried out inside the Microgravity Science Glovebox, on board the International Space Station.
Flames over thin solid fuels, exposed to an opposed flow, react quickly to velocity variations, therefore multiple velocities can be examined during the same experiment.
The sequence of flame pictures shows a diffusion flame spreading against a varying opposed-flow velocity, from 4 cm/s (first frame considered) to 0 cm/s (last frame), and at steps of 1 cm/s. The fuel is polymethyl-methacrylate (PMMA), with a thickness of 200 µm, burning with oxygen concentration of 20% and pressure of 1 atm.
From the sequence, it is clear that the yellow and orange parts of the flame tend to decrease with lower velocities. The flame is burning in the so-called radiative regime, where radiation is the most important heat transfer mechanism. This regime can only be achieved in microgravity, where buoyancy is absent and the oxidizer can reach the reaction zone mostly by diffusion. As a result, the contour of the flame is elliptical and characterized by a bright blue color typical of premixed flames, in contrast with the common tailored shape of flames in normal gravity.
This work was supported by NASA.
References
4.4.9 Fingering Flamelet Spread over Thin Cellulosic Fuels

Fingering flamelets are a near-limit fire adaptation to adverse conditions of limited oxidizer flow or diffusion. These adverse conditions occur in spacecraft or on earth in vertically confined spaces where there is no room for the hot gases to rise and entrain fresh air. In these near-limit conditions, a flame front propagating across a solid fuel breaks apart into separate flamelets.1
On the left image montage,2 a 17.5 cm-wide Whatman 44 ashless filter paper is mounted in a narrow channel apparatus, spaced 7 mm from the top window and 5 mm from the lower copper plate. The initial forced airflow rate was 10 cm/s for ignition (first flame), then the flow was decelerated at 1.05 cm/s2 to a flow velocity of 5 cm/s. The flame becomes corrugated (the second dim blue flame), and the flow is further decelerated at 0.1 cm/s2 to a final flow velocity of 3 cm/s. The third flame front from the top shows breakup into flamelets. Thereafter, the flamelet fingering spread process is a sequence of bifurcations, extinctions, and recombinations. The unburned fuel left behind is illuminated by a red LED.
On the right sequence,3 the same fuel is tested in the Zero Gravity Research Facility 5.18 s drop tower. The sequence of images shows the flame transition from an initial normal gravity uniform flame to a corrugated flame (1.25 s) to seven flamelets evenly spaced along the front that survived to the end of the drop test. The Whatman 44 filter paper sample is 12 cm wide. Time from the start of the drop is indicated on the right of the image. Test conditions were an air velocity of 8 cm/s with a copper substrate mounted 2.5 mm behind the sample.
Flamelets form a Turing-type reaction–diffusion fingering pattern as they spread across the fuel. A the continuous logistic model4 with a time lag can describe the flamelet population growth and fluctuation around a stable population’s carrying capacity based on environmental limitations.
This work was supported by NASA.
References
4.4.10 Microgravity Fingering Smolder Spread over a Thin Cellulosic Fuel

Smoldering flame spread tests were conducted in the Middeck Glovebox Facility on the STS-75 USMP-3 space shuttle mission.1 The Whatman 44 ashless filter paper was doped with smolder-promoting potassium acetate. A 1 cm grid was printed on each sample and a red LED illuminated the surface. Ignition occurred in the center of the sheet, and the smolder front propagated out from the center. A slow airflow was imposed from the right side of each image. The airflow velocities were: (a) 0.5 cm/s, (b) 2 cm/s, (c) 5 cm/s, and (d) 6.5 cm/s.
A complex finger-shaped char pattern was observed in microgravity. This is in contrast with a symmetric horizontal smolder spread in normal gravity with only buoyant airflow (~20 cm/s), shown in (e). For the microgravity fingering smolder spread, each “fingertip” had a glowing smolder front that propagated, frequently bifurcated, and occasionally extinguished. The smolder fingers preferentially propagated upstream (to the right) into fresh oxidizer. Downstream propagation was slower and less viable. At low imposed flows, onset of downstream smolder was delayed until completion of upstream smolder, due to the “oxygen shadow” cast by the upstream smolder fronts. The smolder fronts cumulatively follow population dynamics, and the population growth rate increases linearly with the forced flow velocity. The data indicate that a uniform smolder front in the upstream direction should occur when the forced flow velocity exceeds 9–10 cm/s.
Smolder front bifurcation occurred when the smolder front width exceeded approximately 0.3 cm. This is of the same order as the diffusive gas-phase Stokes length scale (lg = 2D/U∞) and is significantly larger than the solid-phase length scale ls = αs /Vs, where αs is the solid thermal diffusivity and Vs is the velocity of the smolder spot. The bifurcation process occurs in approximately 1 s, regardless of imposed flow. This timescale is consistent with solid-phase timescales ts = ls /Vs ≈ 2/3 s, because the primary heat release and heat losses are from the solid phase. In contrast, gas-phase timescales vary with flow tg = lg/U∞ ≈ 0.8 s to less than 0.1 s at the highest flows. This bifurcation-extinction process is consistent with the oxygen transport model.
This work was supported by NASA.